
diff options
| author | Daniel Baumann <daniel.baumann@progress-linux.org> | 2024-04-27 11:08:07 +0000 |
|---|---|---|
| committer | Daniel Baumann <daniel.baumann@progress-linux.org> | 2024-04-27 11:08:07 +0000 |
| commit | c69cb8cc094cc916adbc516b09e944cd3d137c01 (patch) | |
| tree | f2878ec41fb6d0e3613906c6722fc02b934eeb80 /docs/get | |
| parent | Initial commit. (diff) | |
| download | netdata-upstream/1.29.3.tar.xz netdata-upstream/1.29.3.zip | |
Adding upstream version 1.29.3.upstream/1.29.3upstream
Signed-off-by: Daniel Baumann <daniel.baumann@progress-linux.org>
Diffstat (limited to '')
| -rw-r--r-- | docs/get/README.md | 158 | ||||
| -rw-r--r-- | docs/getting-started.md | 240 |
2 files changed, 398 insertions, 0 deletions
diff --git a/docs/get/README.md b/docs/get/README.md new file mode 100644 index 0000000..f89472d --- /dev/null +++ b/docs/get/README.md @@ -0,0 +1,158 @@ +<!-- +title: "Get Netdata" +description: "Time to get Netdata's monitoring and troubleshooting solution. Sign in to Cloud, download the Agent everywhere, and connect it all together." +custom_edit_url: https://github.com/netdata/netdata/edit/master/docs/get/README.md +--> + +# Get Netdata + +import { OneLineInstall } from '../src/components/OneLineInstall/' +import { Install, InstallBox } from '../src/components/InstallBox/' + +Netdata uses the open-source Netdata Agent and Netdata Cloud web application +[together](/docs/overview/what-is-netdata.md) to help you collect every metric, visualize the health of your nodes, and +troubleshoot complex performance problems. Once you've signed in to Netdata Cloud and installed the Netdata Agent on all +your nodes, you can claim your nodes and see their real-time metrics on a single interface. + +## Sign in to Netdata Cloud + +If you don't already have a free Netdata Cloud account, go ahead and [create one](https://app.netdata.cloud). + +Choose your preferred authentication method and follow the onboarding process to create your Space. + +## Install the Netdata Agent + +The Netdata Agent runs permanently on all your physical/virtual servers, containers, cloud deployments, and edge/IoT +devices. It runs on Linux distributions (**Ubuntu**, **Debian**, **CentOS**, and more), container/microservice platforms +(**Kubernetes** clusters, **Docker**), and many other operating systems (**FreeBSD**, **macOS**), with no `sudo` +required. + +> ⚠️ Many distributions ship with third-party packages of Netdata, which we cannot maintain or keep up-to-date. For the +> best experience, use one of the methods described or linked to below. + +The **recommended** way to install the Netdata Agent on a Linux system is our one-line [kickstart +script](/packaging/installer/methods/kickstart.md). This script automatically installs dependencies and builds Netdata +from its source code. + +<OneLineInstall /> + +Copy the script, paste it into your node's terminal, and hit `Enter`. + +Open your favorite browser and navigate to `http://localhost:19999` or `http://REMOTE-HOST:19999` to open the dashboard. + +<details> +<summary>Watch how the one-line installer works</summary> +<iframe width="820" height="460" src="https://www.youtube.com/embed/tVIp7ycK60A" frameborder="0" allow="accelerometer; autoplay; clipboard-write; encrypted-media; gyroscope; picture-in-picture" allowfullscreen></iframe> +</details> + +### Other operating systems/methods + +Want to install Netdata on a Kubernetes cluster, with Docker, or using a different method? Not a Linux user? Choose your +platform to see specific instructions. + +<Install> + <InstallBox + to="/docs/agent/packaging/installer/methods/kubernetes" + img="/img/index/methods/kubernetes.svg" + os="Kubernetes" /> + <InstallBox + to="/docs/agent/packaging/docker" + img="/img/index/methods/docker.svg" + os="Docker" /> + <InstallBox + to="/docs/agent/packaging/installer/methods/cloud-providers" + img="/img/index/methods/cloud.svg" + imgDark="/img/index/methods/cloud-dark.svg" + os="Cloud providers (GCP, AWS, Azure)" /> + <InstallBox + to="/docs/agent/packaging/installer/methods/packages" + img="/img/index/methods/package.svg" + imgDark="/img/index/methods/package-dark.svg" + os="Linux with .deb/.rpm" /> + <InstallBox + to="/docs/agent/packaging/installer/methods/kickstart-64" + img="/img/index/methods/static.svg" + imgDark="/img/index/methods/static-dark.svg" + os="Linux with static 64-bit binary" /> + <InstallBox + to="/docs/agent/packaging/installer/methods/manual" + img="/img/index/methods/git.svg" + imgDark="/img/index/methods/git-dark.svg" + os="Linux from Git" /> + <InstallBox + to="/docs/agent/packaging/installer/methods/freebsd" + img="/img/index/methods/freebsd.svg" + os="FreeBSD" /> + <InstallBox + to="/docs/agent/packaging/installer/methods/macos" + img="/img/index/methods/macos.svg" + os="MacOS" /> +</Install> + +Even more options available in our [packaging documentation](/packaging/installer/README.md#alternative-methods). + +## Claim your node on Netdata Cloud + +You need to [claim](/claim/README.md) your nodes to see them in Netdata Cloud. Claiming establishes a secure TLS +connection to Netdata Cloud using the [Agent-Cloud link](/aclk/README.md), and proves you have write and administrative +access to that node. + +When you view a node in Netdata Cloud, the Agent running on that node streams metrics, metadata, and alarm status to +Netdata Cloud, which in turn streams those metrics to your web browser. Netdata Cloud [does not +store](/docs/store/distributed-data-architecture.md#does-netdata-cloud-store-my-metrics) or log metrics values. + +To claim a node, you need to run the claiming script. In Netdata Cloud, click on your Space's name, then **Manage your +Space** in the dropdown. Click **Nodes** in the panel that appears. Copy the script and run it in your node's terminal. +The script looks like the following, with long strings instead of `TOKEN` and `ROOM1,ROOM2`: + +```bash +sudo netdata-claim.sh -token=TOKEN -rooms=ROOM1,ROOM2 -url=https://app.netdata.cloud +``` + +The script returns `Agent was successfully claimed.` after creating a new RSA pair and establishing the link to Netdata +Cloud. If the script returns an error, try our [troubleshooting tips](/claim/README.md#troubleshooting). + +> 💡 Our claiming reference guide also contains instructions for claiming [Docker +> containers](/claim/README.md#claim-an-agent-running-in-docker), [Kubernetes cluster parent +> pods](/claim/README.md#claim-an-agent-running-in-docker), via a [proxy](/claim/README.md#claim-through-a-proxy), and +> more. + +<details> +<summary>Watch how claiming nodes works</summary> +<iframe width="820" height="460" src="https://www.youtube.com/embed/UAzVvhMab8g" frameborder="0" allow="accelerometer; autoplay; clipboard-write; encrypted-media; gyroscope; picture-in-picture" allowfullscreen></iframe> +</details> + +For more information on the claiming process, why we implemented it, and how it works, see the [claim](/claim/README.md) +and [Agent-Cloud link](/aclk/README.md) reference docs. + +## Troubleshooting + +If you experience issues with installing the Netdata Agent, see our +[installation](/packaging/installer/README.md#troubleshooting-and-known-issues) reference. Our +[reinstall](/packaging/installer/REINSTALL.md) doc can help clean up your installation and get you back to monitoring. + +For Netdata Cloud issues, see the [Netdata Cloud reference docs](https://learn.netdata.cloud/docs/cloud). + +## What's next? + +At this point, you have set up your free Netdata Cloud account, installed the Netdata Agent on your node(s), and claimed +one or more nodes to your Space. You're ready to start monitoring, visualizing, and troubleshooting with Netdata. We +have two quickstart guides based on the scope of what you need to monitor. + +Interested in monitoring a single node? Check out our [single-node monitoring +quickstart](/docs/quickstart/single-node.md). + +If you're looking to monitor an entire infrastructure with Netdata, see the [infrastructure monitoring +quickstart](/docs/quickstart/infrastructure.md). + +Or, skip ahead to [Agent configuration](/docs/configure/nodes.md). + +### Related reference documentation + +- [Netdata Agent · Packaging & installer](/packaging/installer/README.md) +- [Netdata Agent · Reinstall Netdata](/packaging/installer/REINSTALL.md) +- [Netdata Agent · Update Netdata](/packaging/installer/UPDATE.md) +- [Netdata Agent · Agent-Cloud link](/aclk/README.md) +- [Netdata Agent · Agent claiming](/claim/README.md) + +[](<>) diff --git a/docs/getting-started.md b/docs/getting-started.md new file mode 100644 index 0000000..1ccab42 --- /dev/null +++ b/docs/getting-started.md @@ -0,0 +1,240 @@ +<!-- +title: "Get started guide" +date: 2020-05-04 +custom_edit_url: https://github.com/netdata/netdata/edit/master/docs/getting-started.md +--> + +# Get started guide + +Thanks for trying the Netdata Agent! In this getting started guide, we'll quickly walk you through the first steps you +should take after installing the Agent. + +The Agent can collect thousands of metrics in real-time and use its database for long-term metrics storage without any +configuration, but there are some valuable things to know to get the most out of Netdata based on your needs. + +We'll skip right into some technical details, so if you're brand-new to monitoring the health and performance of systems +and applications, our [**step-by-step guide**](/docs/guides/step-by-step/step-00.md) might be a better fit. + +> If you haven't installed Netdata yet, visit the [installation instructions](/packaging/installer/README.md) for +> details, including our one-liner script, which automatically installs Netdata on almost all Linux distributions. + +## Access the dashboard + +Open up your web browser of choice and navigate to `http://NODE:19999`, replacing `NODE` with the IP address or hostname +of your Agent. Hit **Enter**. Welcome to Netdata! + + + +**What's next?**: + +- Read more about the [standard Netdata dashboard](/web/gui/). +- Learn all the specifics of [using charts](/web/README.md#using-charts) or the differences between [charts, + context, and families](/web/README.md#charts-contexts-families). + +## Configuration basics + +Netdata primarily uses the `netdata.conf` file for custom configurations. + +On most systems, you can find that file at `/etc/netdata/netdata.conf`. + +> Some operating systems will place your `netdata.conf` at `/opt/netdata/etc/netdata/netdata.conf`, so check there if +> you find nothing at `/etc/netdata/netdata.conf`. + +The `netdata.conf` file is broken up into various sections, such as `[global]`, `[web]`, `[registry]`, and more. By +default, most options are commented, so you'll have to uncomment them (remove the `#`) for Netdata to recognize your +change. + +Once you save your changes, [restart Netdata](#start-stop-and-restart-netdata) to load your new configuration. + +**What's next?**: + +- [Change how long Netdata stores metrics](#change-how-long-netdata-stores-metrics) by changing the `page cache size` + and `dbengine disk space` settings in `netdata.conf`. +- Move Netdata's dashboard to a [different port](/web/server/) or enable TLS/HTTPS + encryption. +- See all the `netdata.conf` options in our [daemon configuration documentation](/daemon/config/). +- Run your own [registry](/registry/README.md#run-your-own-registry). + +## Change how long Netdata stores metrics + +Netdata can store long-term, historical metrics out of the box. A custom database uses RAM to store recent metrics, +ensuring dashboards and API queries are extremely responsive, while "spilling" historical metrics to disk. This +configuration keeps RAM usage low while allowing for long-term, on-disk metrics storage. + +You can tweak this custom _database engine_ to store a much larger dataset than your system's available RAM, +particularly if you allow Netdata to use slightly more RAM and disk space than the default configuration. + +Read our guide on [changing how long Netdata stores metrics](/docs/store/change-metrics-storage.md) to learn more and +use our the embedded database engine to figure out the exact settings you'll need to store historical metrics right in +the Agent's database. + +**What's next?**: + +- Learn more about the [memory requirements for the database + engine](/database/engine/README.md#memory-requirements) to understand how much RAM/disk space you should commit + to storing historical metrics. + +## Collect data from more sources + +When Netdata _starts_, it auto-detects dozens of **data sources**, such as database servers, web servers, and more. To +auto-detect and collect metrics from a service or application you just installed, you need to [restart +Netdata](#start-stop-and-restart-netdata). + +> There is one exception: When Netdata is running on the host (as in not in a container itself), it will always +> auto-detect containers and VMs. + +However, auto-detection only works if you installed the source using its standard installation procedure. If Netdata +isn't collecting metrics after a restart, your source probably isn't configured correctly. Look at the [external plugin +documentation](/collectors/plugins.d/) to find the appropriate module for your source. Those pages will contain +more information about how to configure your source for auto-detection. + +Some modules, like `chrony`, are disabled by default and must be enabled manually for auto-detection to work. + +Once Netdata detects a valid source of data, it will continue trying to collect data from it. For example, if +Netdata is collecting data from an Nginx web server, and you shut Nginx down, Netdata will collect new data as soon as +you start the web server back up—no restart necessary. + +### Configure plugins + +Even if Netdata auto-detects your service/application, you might want to configure what, or how often, Netdata is +collecting data. + +Netdata uses **internal** and **external** plugins to collect data. Internal plugins run within the Netdata dæmon, while +external plugins are independent processes that send metrics to Netdata over pipes. There are also plugin +**orchestrators**, which are external plugins with one or more data collection **modules**. + +You can configure both internal and external plugins, along with the individual modules. There are many ways to do so: + +- In `netdata.conf`, `[plugins]` section: Enable or disable internal or external plugins with `yes` or `no`. +- In `netdata.conf`, `[plugin:XXX]` sections: Each plugin has a section for changing collection frequency or passing + options to the plugin. +- In `.conf` files for each external plugin: For example, at `/etc/netdata/python.d.conf`. +- In `.conf` files for each module : For example, at `/etc/netdata/python.d/nginx.conf`. + +It's complex, so let's walk through an example of the various `.conf` files responsible for collecting data from an +Nginx web server using the `nginx` module and the `python.d` plugin orchestrator. + +First, you can enable or disable the `python.d` plugin entirely in `netdata.conf`. + +```conf +[plugins] + # Enabled + python.d = yes + # Disabled + python.d = no +``` + +You can also configure the entire `python.d` external plugin via the `[plugin:python.d]` section in `netdata.conf`. +Here, you can change how often Netdata uses `python.d` to collect metrics or pass other command options: + +```conf +[plugin:python.d] + update every = 1 + command options = +``` + +The `python.d` plugin has a separate configuration file at `/etc/netdata/python.d.conf` for enabling and disabling +modules. You can use the `edit-config` script to edit the file, or open it with your text editor of choice: + +```bash +sudo /etc/netdata/edit-config python.d.conf +``` + +Finally, the `nginx` module has a configuration file called `nginx.conf` in the `python.d` folder. Again, use +`edit-config` or your editor of choice: + +```bash +sudo /etc/netdata/edit-config python.d/nginx.conf +``` + +In the `nginx.conf` file, you'll find additional options. The default works in most situations, but you may need to make +changes based on your particular Nginx setup. + +**What's next?**: + +- Look at the [full list of data collection modules](/collectors/COLLECTORS.md) + to configure your sources for auto-detection and monitoring. +- Improve the [performance](/docs/guides/configure/performance.md) of Netdata on low-memory systems. +- Configure `systemd` to expose [systemd services + utilization](/collectors/cgroups.plugin/README.md#monitoring-systemd-services) metrics automatically. +- [Reconfigure individual charts](/daemon/config/README.md#per-chart-configuration) in `netdata.conf`. + +## Health monitoring and alarms + +Netdata comes with hundreds of health monitoring alarms for detecting anomalies on production servers. If you're running +Netdata on a workstation, you might want to disable Netdata's alarms. + +Edit your `/etc/netdata/netdata.conf` file and set the following: + +```conf +[health] + enabled = no +``` + +If you want to keep health monitoring enabled, but turn email notifications off, edit your `health_alarm_notify.conf` +file with `edit-config`, or with the text editor of your choice: + +```bash +sudo /etc/netdata/edit-config health_alarm_notify.conf +``` + +Find the `SEND_EMAIL="YES"` line and change it to `SEND_EMAIL="NO"`. + +**What's next?**: + +- Follow the [health quickstart](/health/QUICKSTART.md) to locate and edit existing health entities, and then + create your own. +- See all the alarm options via the [health configuration reference](/health/REFERENCE.md). +- Add a new notification method, like [Slack](/health/notifications/slack/). + +## Monitor multiple systems with Netdata Cloud + +If you have the Agent installed on multiple nodes, you can use Netdata Cloud in two ways: Monitor the health and +performance of an entire infrastructure via the Netdata Cloud web application, or use the Visited Nodes menu that's +built into every dashboard. + +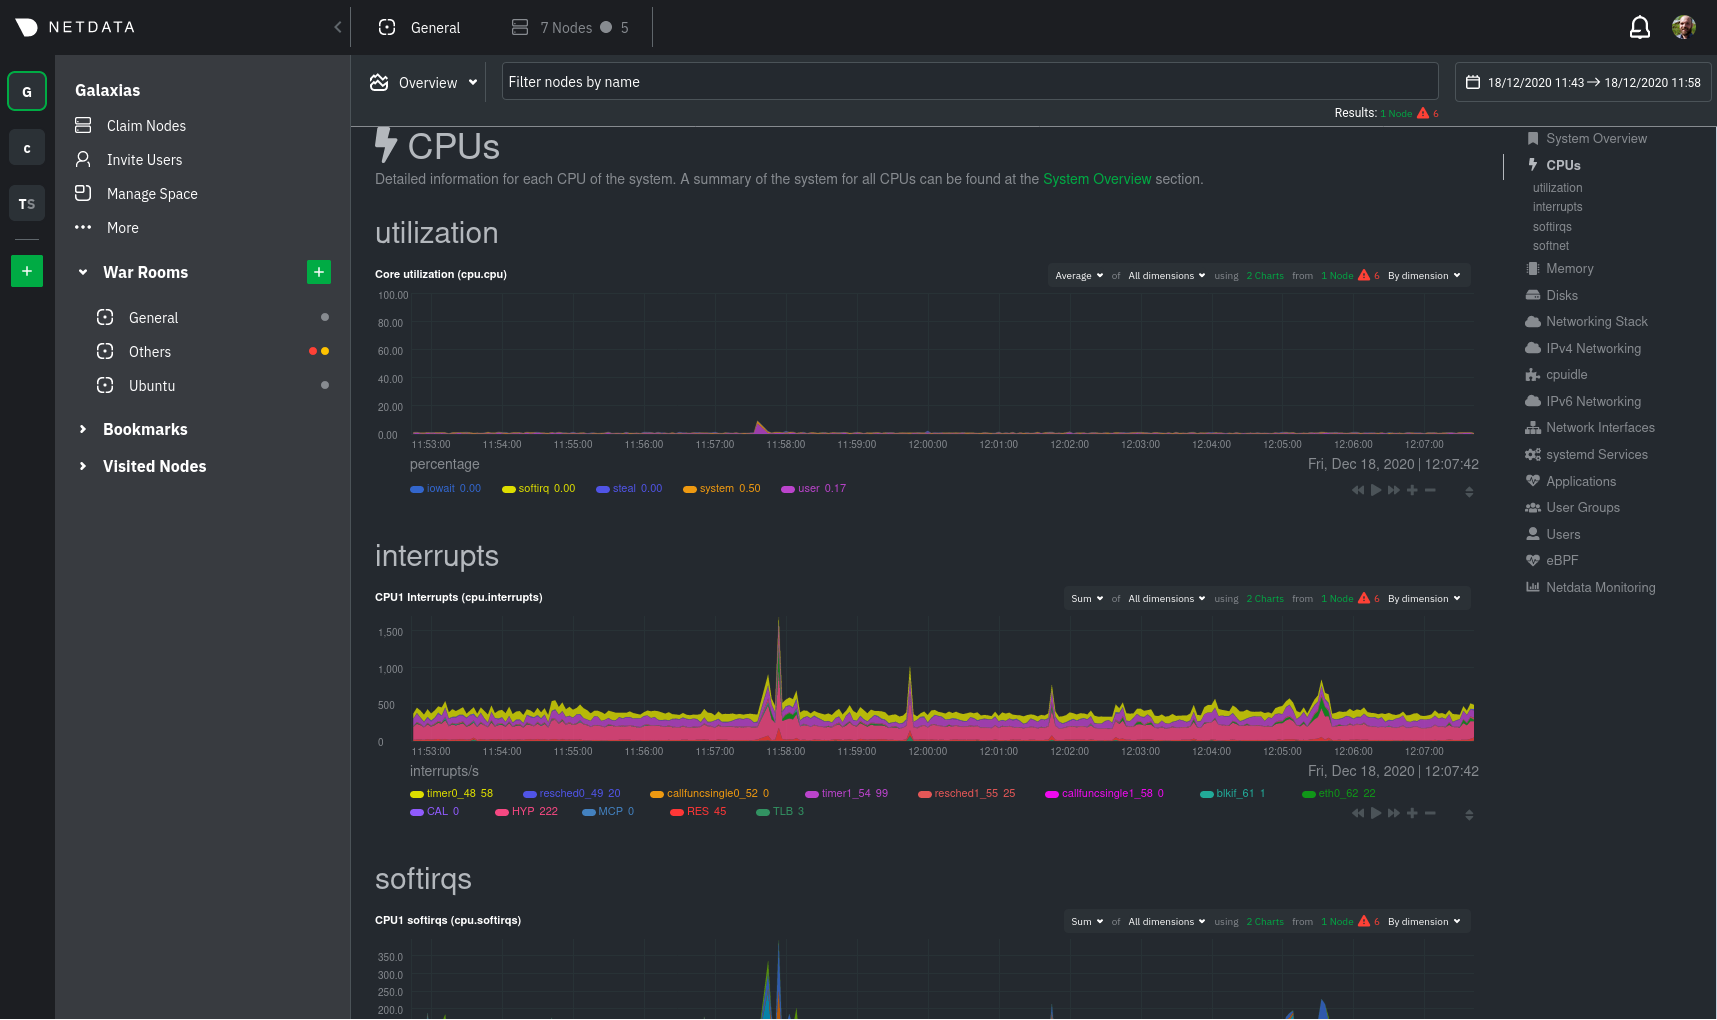 + +You can use these features together or separately—the decision is up to you and the needs of your infrastructure. + +**What's next?**: + +- Sign up for [Netdata Cloud](https://app.netdata.cloud). +- Read the [infrastructure monitoring quickstart](/docs/quickstart/infrastructure.md). +- Better understand how the Netdata Agent connects securely to Netdata Cloud with [claiming](/claim/README.md) and + [Agent-Cloud link](/aclk/README.md) documentation. + +## Start, stop, and restart Netdata + +When you install Netdata, it's configured to start at boot, and stop and restart/shutdown. You shouldn't need to start +or stop Netdata manually, but you will probably need to restart Netdata at some point. + +- To **start** Netdata, open a terminal and run `service netdata start`. +- To **stop** Netdata, run `service netdata stop`. +- To **restart** Netdata, run `service netdata restart`. + +The `service` command is a wrapper script that tries to use your system's preferred method of starting or stopping +Netdata based on your system. But, if either of those commands fails, try using the equivalent commands for `systemd` +and `init.d`: + +- **systemd**: `systemctl start netdata`, `systemctl stop netdata`, `systemctl restart netdata` +- **init.d**: `/etc/init.d/netdata start`, `/etc/init.d/netdata stop`, `/etc/init.d/netdata restart` + +## What's next? + +Even after you've configured `netdata.conf`, tweaked alarms, learned the basics of performance troubleshooting, and +claimed all your systems in Netdata Cloud or added them to the Visited nodes menu, you've just gotten started with +Netdata. + +Take a look at some more advanced features and configurations: + +- Centralize Netdata metrics from many systems with [streaming](/streaming/README.md) +- Enable long-term archiving of Netdata metrics via [exporting engine](/exporting/README.md) to time-series databases. +- Improve security by putting Netdata behind an [Nginx proxy with SSL](/docs/Running-behind-nginx.md). + +Or, learn more about how you can contribute to [Netdata core](/CONTRIBUTING.md) or our +[documentation](/docs/contributing/contributing-documentation.md)! + +[](<>) |