1
2
3
4
5
6
7
8
9
10
11
12
13
14
15
16
17
18
19
20
21
22
23
24
25
26
27
28
29
30
31
32
33
34
35
36
37
38
39
40
41
42
43
44
45
46
47
48
49
50
51
52
53
54
55
56
57
58
59
60
61
62
63
64
65
66
67
68
69
70
71
72
73
74
75
76
77
78
79
80
81
82
83
84
85
86
87
88
89
90
91
92
93
94
95
96
97
98
99
100
101
102
103
104
105
106
107
108
109
110
111
112
113
114
115
116
117
118
119
120
121
122
123
124
125
126
127
128
129
130
131
132
133
134
135
136
137
138
139
140
141
142
143
144
145
146
147
148
149
150
151
152
153
154
155
156
157
158
159
160
161
162
163
164
165
166
167
168
169
170
171
172
173
174
175
176
177
178
179
180
181
182
183
184
185
186
187
188
189
190
191
192
193
194
195
196
197
198
199
200
201
202
203
204
205
206
207
208
209
210
211
212
213
214
215
216
217
218
219
220
221
222
223
224
225
226
227
228
229
230
231
232
233
234
235
236
237
238
239
240
241
242
243
244
245
246
247
248
249
250
251
252
253
254
255
256
257
258
259
260
261
262
263
264
265
266
267
268
269
270
271
272
273
274
275
276
277
278
279
280
281
282
283
284
285
286
287
288
289
290
291
292
293
294
295
296
297
298
299
300
301
302
303
304
305
306
307
308
309
310
311
312
313
314
315
316
317
318
319
320
321
322
323
324
325
326
327
328
329
330
331
332
333
334
335
336
337
338
339
340
341
342
343
344
345
346
347
348
349
350
351
352
353
354
355
356
357
358
359
360
361
362
363
364
365
366
367
368
369
370
371
372
373
374
375
376
377
378
379
380
381
382
383
384
385
386
387
388
389
390
391
392
393
394
395
396
397
398
399
400
401
402
403
404
405
406
407
408
409
410
411
412
413
414
415
416
417
418
419
420
421
422
423
424
425
426
427
428
429
430
431
432
433
434
435
436
437
438
439
440
441
442
443
444
445
446
447
448
449
450
451
452
453
454
455
456
457
458
459
460
461
462
463
464
465
466
467
468
469
470
471
472
473
474
475
476
477
478
479
480
481
482
483
484
485
486
487
488
489
490
491
492
493
494
495
496
497
498
499
500
501
502
503
504
505
506
507
508
509
510
511
512
513
514
515
516
517
518
519
520
521
522
523
524
525
526
527
528
529
530
531
532
533
534
535
536
537
538
539
540
541
542
543
544
545
546
547
548
549
550
551
552
553
554
555
556
557
558
559
560
561
562
563
564
565
566
567
568
569
570
571
572
573
574
575
576
577
578
579
580
581
582
583
584
585
586
587
588
589
590
591
592
593
594
595
596
597
598
599
600
601
602
603
604
605
606
607
608
609
610
611
612
613
614
615
616
617
618
619
620
621
622
623
624
625
626
627
628
629
630
631
632
633
634
635
636
637
638
639
640
641
642
643
644
645
646
647
648
649
650
651
652
653
654
655
656
657
658
659
660
661
662
663
664
665
666
667
668
669
670
671
672
673
674
675
676
677
678
679
680
681
682
683
684
685
686
687
688
689
690
691
692
693
694
695
696
697
698
699
700
701
702
703
704
705
706
707
708
709
710
711
712
713
714
715
716
717
718
719
720
721
722
723
724
725
726
727
728
729
730
731
732
733
734
735
736
737
738
739
740
741
742
743
744
745
746
747
748
749
750
751
752
753
754
755
756
757
758
759
760
761
762
763
764
765
766
767
768
769
770
771
772
773
774
775
776
777
778
779
780
781
782
783
|
<p align="center">
<a href="https://www.netdata.cloud#gh-light-mode-only">
<img src="https://www.netdata.cloud/img/readme-images/netdata_readme_logo_light.png" alt="Netdata" width="300"/>
</a>
<a href="https://www.netdata.cloud#gh-dark-mode-only">
<img src="https://www.netdata.cloud/img/readme-images/netdata_readme_logo_dark.png" alt="Netdata" width="300"/>
</a>
</p>
<h3 align="center">Monitor your servers, containers, and applications,<br/>in high-resolution and in real-time.</h3>
<br />
<p align="center">
<a href="https://github.com/netdata/netdata/"><img src="https://img.shields.io/github/stars/netdata/netdata?style=social" alt="GitHub Stars"></a>
<br />
<a href="https://app.netdata.cloud/spaces/netdata-demo?utm_campaign=github_readme_demo_badge"><img src="https://img.shields.io/badge/Live Demo-green" alt="Live Demo"></a>
<a href="https://github.com/netdata/netdata/releases/latest"><img src="https://img.shields.io/github/release/netdata/netdata.svg" alt="Latest release"></a>
<a href="https://github.com/netdata/netdata-nightlies/releases/latest"><img src="https://img.shields.io/github/release/netdata/netdata-nightlies.svg" alt="Latest nightly build"></a>
<br />
<a href="https://bestpractices.coreinfrastructure.org/projects/2231"><img src="https://bestpractices.coreinfrastructure.org/projects/2231/badge" alt="CII Best Practices"></a>
<a href="https://scan.coverity.com/projects/netdata-netdata?tab=overview"><img alt="Coverity Scan" src="https://img.shields.io/coverity/scan/netdata"></a>
<a href="https://codeclimate.com/github/netdata/netdata"><img src="https://codeclimate.com/github/netdata/netdata/badges/gpa.svg" alt="Code Climate"></a>
<a href="https://www.gnu.org/licenses/gpl-3.0"><img src="https://img.shields.io/badge/License-GPL%20v3%2B-blue.svg" alt="License: GPL v3+"></a>
<br />
<a href="https://discord.com/invite/mPZ6WZKKG2"><img alt="Discord" src="https://img.shields.io/discord/847502280503590932?logo=discord&logoColor=white&label=chat%20on%20discord"></a>
<a href="https://github.com/netdata/netdata/discussions"><img alt="GitHub Discussions" src="https://img.shields.io/github/discussions/netdata/netdata?logo=github&label=github%20discussions"></a>
</p>
<p align="center"><b>Visit the <a href="https://www.netdata.cloud">Project's Home Page</a></b></p>
<hr class="solid">
MENU: **[WHAT IS NEW](#whats-new-and-coming)** | **[GETTING STARTED](#getting-started)** | **[HOW IT WORKS](#how-it-works)** | **[FAQ](#faq)** | **[DOCS](#book-documentation)** | **[COMMUNITY](#tada-community)** | **[CONTRIBUTE](#pray-contribute)**
Netdata collects metrics per second and presents them in beautiful low-latency dashboards. It is designed to run on all of your physical and virtual servers, cloud deployments, Kubernetes clusters, and edge/IoT devices, to monitor your systems, containers, and applications.
It scales nicely from just a single server to thousands of servers, even in complex multi/mixed/hybrid cloud environments, and given enough disk space it can keep your metrics for years.
**KEY FEATURES**:<br/>
- :boom: **Collects metrics from 800+ integrations**<br/>
Operating system metrics, container metrics, virtual machines, hardware sensors, applications metrics, OpenMetrics exporters, StatsD, and logs.
- :muscle: **Real-Time, Low-Latency, High-Resolution**<br/>
All metrics are collected per second and are on the dashboard immediately after data collection. Netdata is designed to be fast.
- :face_in_clouds: **Unsupervised Anomaly Detection**<br/>
Trains multiple Machine-Learning (ML) models for each metric collected and detects anomalies based on the past behavior of each metric individually.
- :fire: **Powerful Visualization**<br/>
Clear and precise visualization that allows you to quickly understand any dataset, but also to filter, slice and dice the data directly on the dashboard, without the need to learn any query language.
- :bell: **Out of box Alerts**<br/>
Comes with hundreds of alerts out of the box to detect common issues and pitfalls, revealing issues that can easily go unnoticed. It supports several notification methods to let you know when your attention is needed.
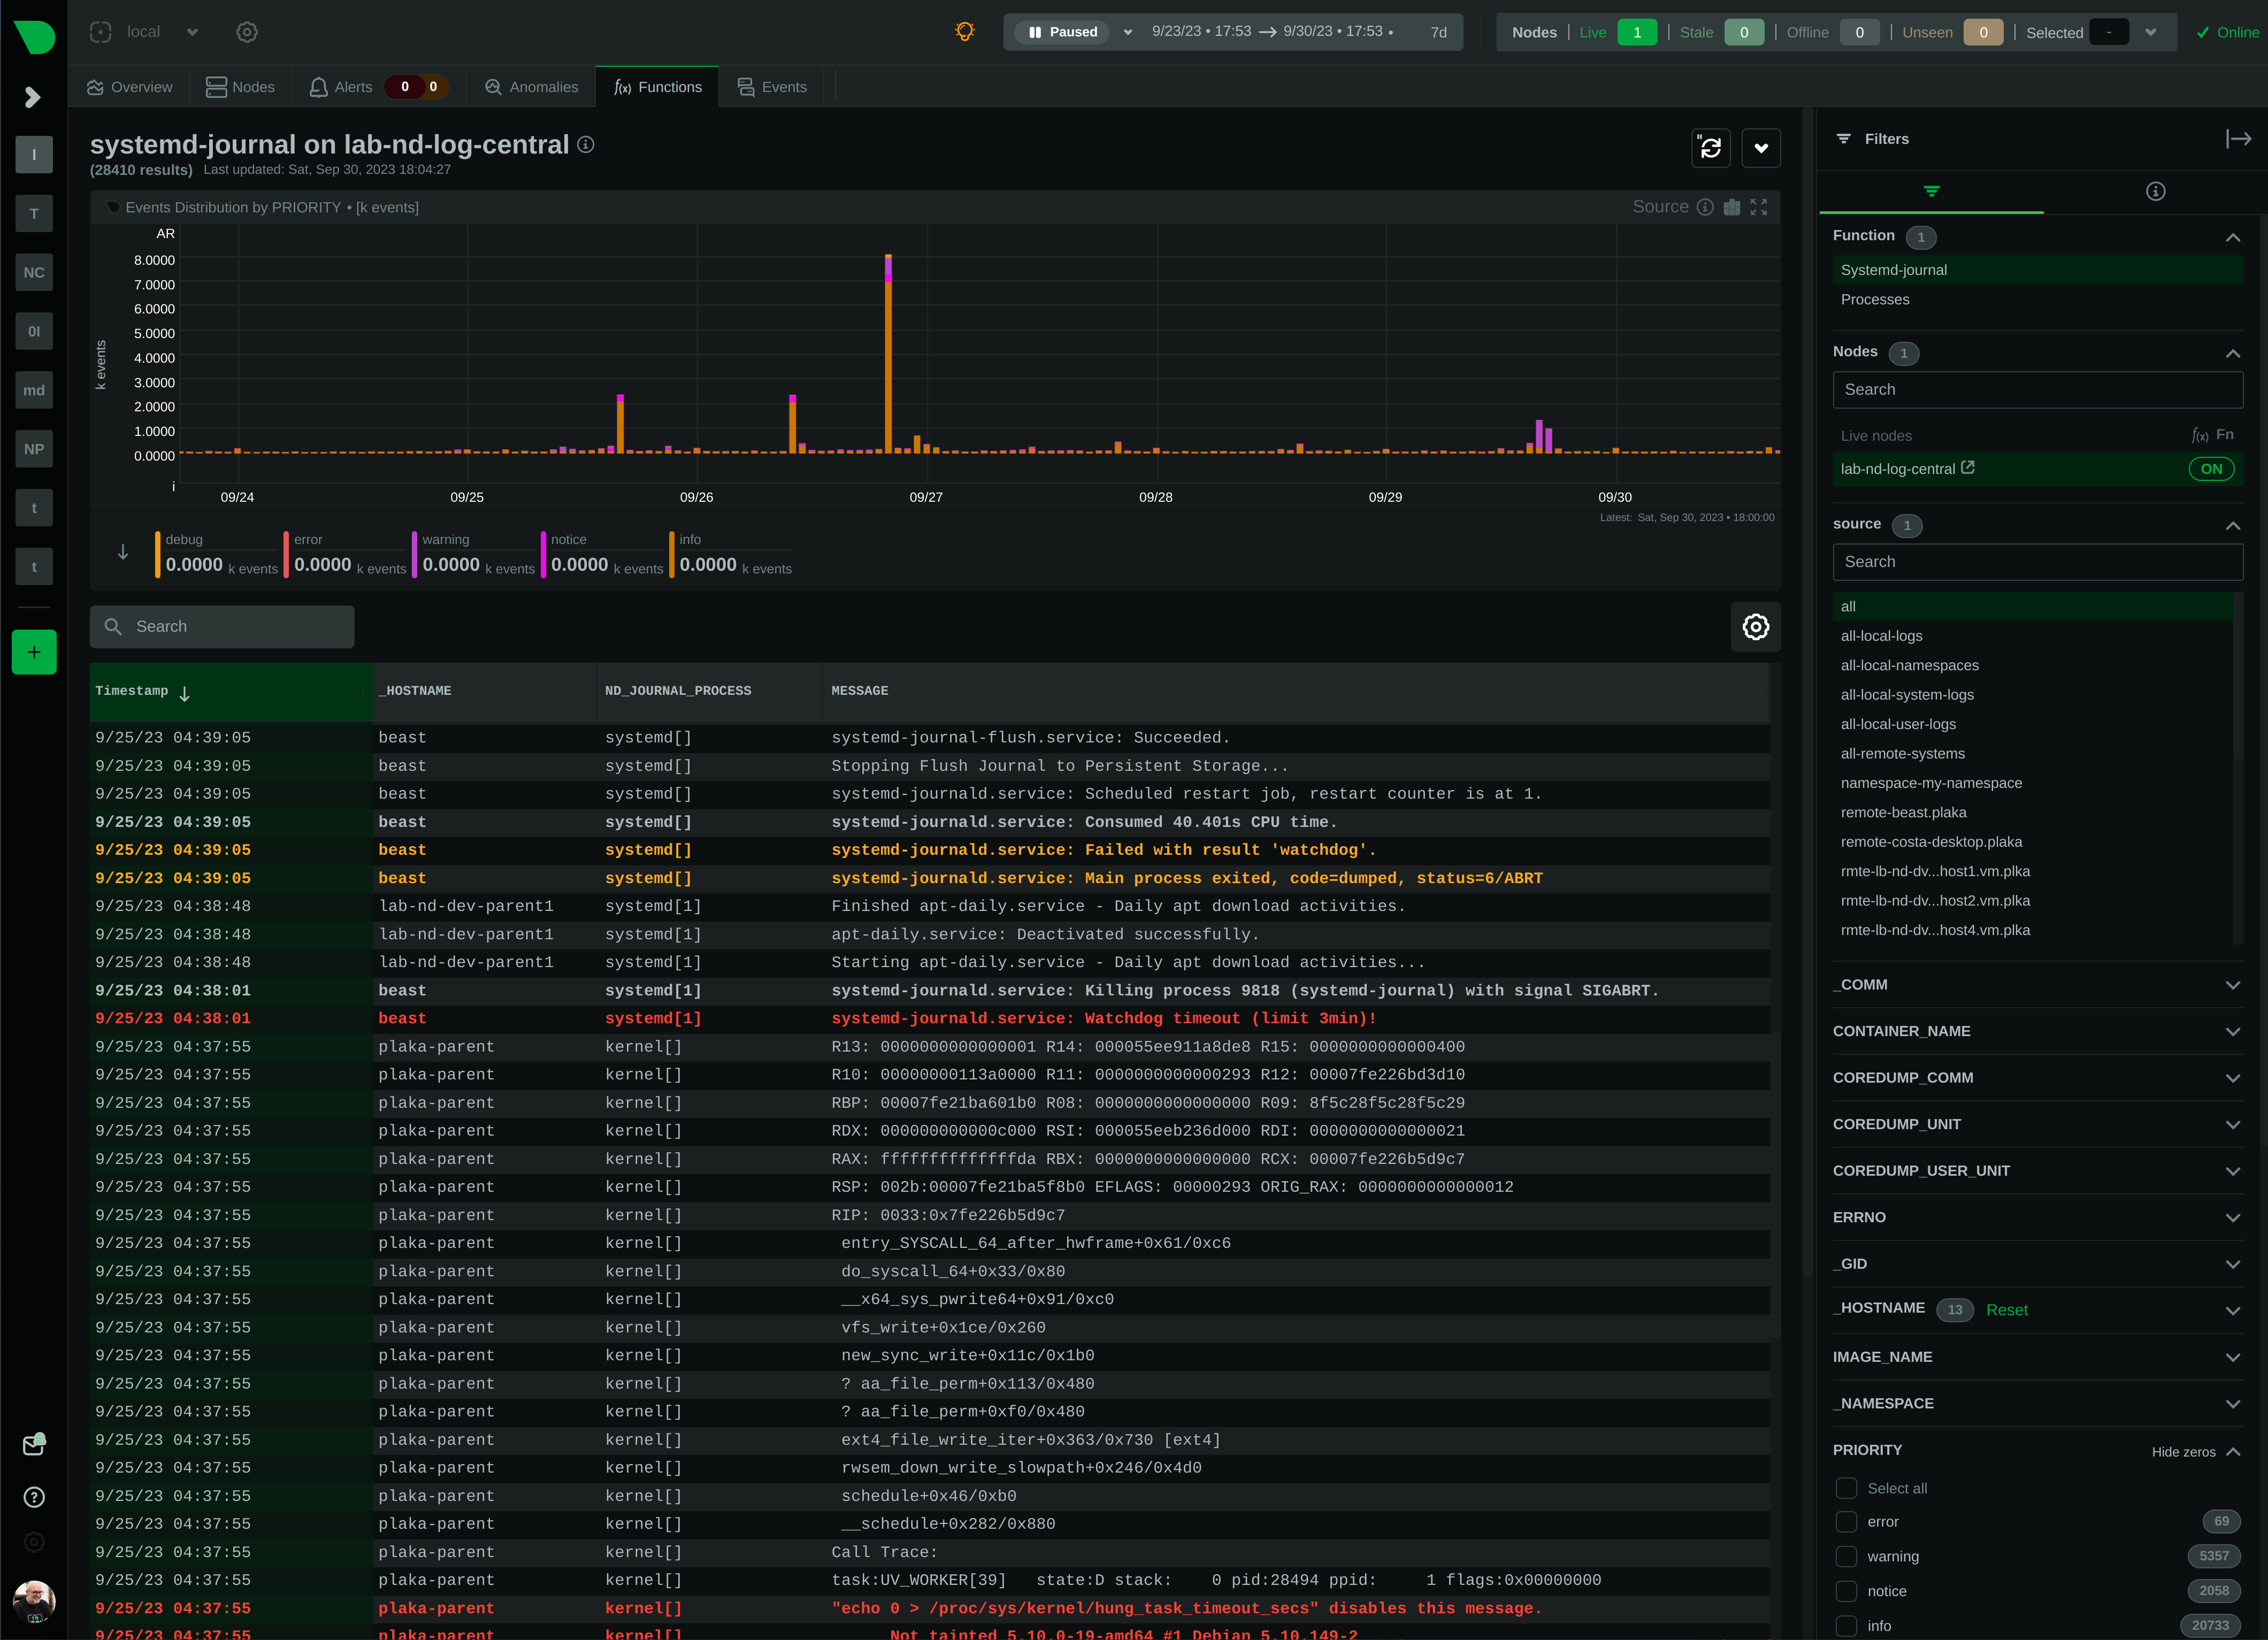
- 📖 **systemd Journal Logs Explorer**<br/>
Provides a `systemd` journal logs explorer, to view, filter and analyze system and applications logs by directly accessing `systemd` journal files on individual hosts and infrastructure-wide logs centralization servers.
- :sunglasses: **Low Maintenance**<br/>
Fully automated in every aspect: automated dashboards, out-of-the-box alerts, auto-detection and auto-discovery of metrics, zero-touch machine-learning, easy scalability and high availability, and CI/CD friendly.
- :star: **Open and Extensible**<br/>
Netdata is a modular platform that can be extended in all possible ways and it also integrates nicely with other monitoring solutions.
---
**LATEST BLOG POST**:<br/>
<p align="center">
<a href="https://blog.netdata.cloud/netdata-vs-prometheus-performance-analysis#gh-light-mode-only">
<img src="https://www.netdata.cloud/img/readme-images/netdata%20vs%20prometheus.png" alt="Netdata" width="500"/>
</a>
<a href="https://blog.netdata.cloud/netdata-vs-prometheus-performance-analysis#gh-dark-mode-only">
<img src="https://www.netdata.cloud/img/readme-images/netdata%20vs%20prometheus%20dark.png" alt="Netdata" width="500"/>
</a>
</p>
On the same workload, Netdata uses **35% less CPU**, **49% less RAM**, **12% less bandwidth**, **98% less disk I/O**, and is **75% more disk space efficient** on high resolution metrics storage, while providing more than a year of overall retention on the same disk footprint Prometheus offers 7 days of retention. [Read the full analysis in our blog](https://blog.netdata.cloud/netdata-vs-prometheus-performance-analysis/).
---
NEW: **Netdata and LOGS !** 🥳</br>
Check the [systemd-journal plugin of Netdata](https://github.com/netdata/netdata/tree/master/collectors/systemd-journal.plugin), that allows you to view, explore, analyze and query `systemd` journal logs!
---
<br/>
<p align="center">
<img src="https://raw.githubusercontent.com/cncf/artwork/master/other/cncf/horizontal/white/cncf-white.svg#gh-dark-mode-only" alt="CNCF" width="300">
<img src="https://raw.githubusercontent.com/cncf/artwork/master/other/cncf/horizontal/black/cncf-black.svg#gh-light-mode-only" alt="CNCF" width="300">
<br />
Netdata actively supports and is a member of the Cloud Native Computing Foundation (CNCF)<br />
<br/>
...and due to your love :heart: and :star:, <b>Netdata is leading the Observability category</b> at the <a href="https://landscape.cncf.io/card-mode?category=observability-and-analysis&grouping=no&sort=stars">CNCF landscape</a>!
</p>
<br/>
<hr class="solid">
<p align="center">
<b>Below is an animated image, but you can see Netdata live!</b><br/>
<a href="https://frankfurt.netdata.rocks"><b>FRANKFURT</b></a> |
<a href="https://newyork.netdata.rocks"><b>NEWYORK</b></a> |
<a href="https://atlanta.netdata.rocks"><b>ATLANTA</b></a> |
<a href="https://sanfrancisco.netdata.rocks"><b>SANFRANCISCO</b></a> |
<a href="https://toronto.netdata.rocks"><b>TORONTO</b></a> |
<a href="https://singapore.netdata.rocks"><b>SINGAPORE</b></a> |
<a href="https://bangalore.netdata.rocks"><b>BANGALORE</b></a>
<br/>
<i>They are clustered Netdata Parents. They all have the same data. <b>Select the one closer to you.</b></i>
<br/>
<i>All these run with the default configuration. We only clustered them to have multi-node dashboards.</i>
</p>
<hr class="solid">
> **Important** :bulb:<br/>
> People get addicted to Netdata. Once you use it on your systems, **there's no going back!**<br/>
<hr class="solid">
## What's New and Coming?
<details><summary>Click to see our immediate development plans and a summary view of the last 12 months' releases...</summary>
<br/>
| What | Description | When | Status |
|:-----------------------------:|:---------------------------------------------------------------------------------------------------:|:------------:|:-------------------------------------------------------------------------------------------------------:|
| WebRTC | Browser to Agent communication via WebRTC. | later | POC |
| Advanced Troubleshooting | Expanded view of dashboard charts integrating Metrics Correlations, Anomaly Advisor, and many more. | later | interrupted |
| Easy Custom<br/>Dashboards | Drag and drop charts to create custom dashboards on the fly, while troubleshooting! | soon | planned |
| More Customizability | Set default settings for all charts and views! | soon | planned |
| UCUM Units | Migrate all metrics to the Unified Code for Units of Measure. | soon | in progress |
| Click to Activate | Configure Alerts and Data Collectors from the UI! | soon | in progress |
| **Netdata Cloud<br/>On-Prem** | **Netdata Cloud available for On-Prem installation!** | **available** | [fill this form](https://www.netdata.cloud/contact-us/?subject=on-prem) |
| `systemd` journal | View the `systemd` journal logs of your systems on the dashboard. | Oct<br/>2023 | [v1.43](https://github.com/netdata/netdata/releases/tag/v1.43.0) |
| Integrations | Netdata Integrations Marketplace! | Aug<br/>2023 | [v1.42](https://github.com/netdata/netdata/releases#v1420-integrations-marketplace) |
| New Agent UI | Now Netdata Cloud and Netdata Agent share the same dashboard! | Jul<br/>2023 | [v1.41](https://github.com/netdata/netdata/releases/tag/v1.41.0#v1410-one-dashboard) |
| Summary Dashboards | High level tiles everywhere! | Jun<br/>2023 | [v1.40](https://github.com/netdata/netdata/releases/tag/v1.40.0#v1400-visualization-summary-dashboards) |
| Machine Learning | Multiple ML models per metric. | Jun<br/>2023 | [v1.40](https://github.com/netdata/netdata/releases/tag/v1.40.0#v1400-ml-extended-training) |
| SSL | Netdata Agent gets a new SSL layer. | Jun<br/>2023 | [v1.40](https://github.com/netdata/netdata/releases/tag/v1.40.0#v1400-streaming) |
| New Cloud UI | Filter, slice and dice any dataset from the UI! ML-first! | May<br/>2023 | [v1.39](https://github.com/netdata/netdata/releases/tag/v1.39.0) |
| Microsoft Windows | Monitor Windows hosts and apps! | May<br/>2023 | [v1.39](https://github.com/netdata/netdata/releases/tag/v1.39.0#v1390-windows-support) |
| Virtual Nodes | Go collectors can now be assigned to virtual nodes! | May<br/>2023 | [v1.39](https://github.com/netdata/netdata/releases/tag/v1.39.0#v1390-virtual-nodes-and-custom-labels) |
| DBENGINE v2 | Faster, more reliable, far more scalable! | Feb<br/>2023 | [v1.38](https://github.com/netdata/netdata/releases/tag/v1.38.0) |
| Netdata Functions | Netdata beyond metrics! Monitoring anything! | Feb<br/>2023 | [v1.38](https://github.com/netdata/netdata/releases/tag/v1.38.0#v1380-functions) |
| Events Feed | Live feed of events about topology changes and alerts. | Feb<br/>2023 | [v1.38](https://github.com/netdata/netdata/releases/tag/v1.38.0#v1380-feed) |
| Role Based<br/>Access Control | More roles, offering finer control over access to infrastructure. | Feb<br/>2023 | [v1.38](https://github.com/netdata/netdata/releases/tag/v1.38.0#v1380-rbac) |
| Infinite Scalability | Streaming compression. Replication. Active-active clustering. | Nov<br/>2022 | [v1.37](https://github.com/netdata/netdata/releases/tag/v1.37.0) |
| Grafana Plugin | Netdata Cloud as a data source for Grafana. | Nov<br/>2022 | [v1.37](https://github.com/netdata/netdata/releases/tag/v1.37.0#v1370-grafana-plugin) |
| PostgreSQL | Completely rewritten, to reveal all the info, even at the table level. | Nov<br/>2022 | [v1.37](https://github.com/netdata/netdata/releases/tag/v1.37.0#v1370-postgressql) |
| Metrics Correlations | Advanced algorithms to find the needle in the haystack. | Aug<br/>2022 | [v1.36](https://github.com/netdata/netdata/releases/tag/v1.36.0) |
| Database Tiering | Netdata gets unlimited retention! | Aug<br/>2022 | [v1.36](https://github.com/netdata/netdata/releases/tag/v1.36.0#v1360-tiering) |
| Kubernetes | Monitor your Kubernetes workloads. | Aug<br/>2022 | [v1.36](https://github.com/netdata/netdata/releases/tag/v1.36.0#v1360-kubernetes) |
| Machine Learning | Anomaly Rate information on every chart. | Aug<br/>2022 | [v1.36](https://github.com/netdata/netdata/releases/tag/v1.36.0#v1360-anomaly-rate-on-charts) |
| Machine Learning | Anomaly Advisor! Bottom-up unsupervised anomaly detection. | Jun<br/>2022 | [v1.35](https://github.com/netdata/netdata/releases/tag/v1.35.0#v1350-anomaly-advisor-ml) |
| Machine Learning | Metrics Correlation on the Agent. | Jun<br/>2022 | [v1.35](https://github.com/netdata/netdata/releases/tag/v1.35.0#v1350-metric-correlation-agent) |
</details>
<hr class="solid">
## Getting Started
<p align="center">
<a href="https://registry.my-netdata.io/#menu_netdata_submenu_registry"><img src="https://registry.my-netdata.io/api/v1/badge.svg?chart=netdata.registry_entries&dimensions=persons&label=user%20base&units=M&value_color=blue&precision=2÷=1000000&options=unaligned&tier=1&v44" alt="User base"></a>
<a href="https://registry.my-netdata.io/#menu_netdata_submenu_registry"><img src="https://registry.my-netdata.io/api/v1/badge.svg?chart=netdata.registry_entries&dimensions=machines&label=servers%20monitored&units=M÷=1000000&value_color=orange&precision=2&options=unaligned&tier=1&v44" alt="Servers monitored"></a>
<a href="https://registry.my-netdata.io/#menu_netdata_submenu_registry"><img src="https://registry.my-netdata.io/api/v1/badge.svg?chart=netdata.registry_sessions&label=sessions%20served&units=M&value_color=yellowgreen&precision=2÷=1000000&options=unaligned&tier=1&v44" alt="Sessions served"></a>
<a href="https://hub.docker.com/r/netdata/netdata"><img src="https://registry.my-netdata.io/api/v1/badge.svg?chart=dockerhub.pulls_sum÷=1000000&precision=1&units=M&label=docker+hub+pulls&options=unaligned&tier=1&v44" alt="Docker Hub pulls"></a>
<br />
<a href="https://registry.my-netdata.io/#menu_netdata_submenu_registry"><img src="https://registry.my-netdata.io/api/v1/badge.svg?chart=netdata.registry_entries&dimensions=persons&after=-86400&options=unaligned&group=incremental-sum&label=new%20users%20today&units=null&value_color=blue&precision=0&options=unaligned&tier=1&v44" alt="New users today"></a>
<a href="https://registry.my-netdata.io/#menu_netdata_submenu_registry"><img src="https://registry.my-netdata.io/api/v1/badge.svg?chart=netdata.registry_entries&dimensions=machines&group=incremental-sum&after=-86400&options=unaligned&label=servers%20added%20today&units=null&value_color=orange&precision=0&tier=1&v44" alt="New machines today"></a>
<a href="https://registry.my-netdata.io/#menu_netdata_submenu_registry"><img src="https://registry.my-netdata.io/api/v1/badge.svg?chart=netdata.registry_sessions&after=-86400&group=incremental-sum&options=unaligned&label=sessions%20served%20today&units=null&value_color=yellowgreen&precision=0&tier=1&v44" alt="Sessions today"></a>
<a href="https://hub.docker.com/r/netdata/netdata"><img src="https://registry.my-netdata.io/api/v1/badge.svg?chart=dockerhub.pulls_sum÷=1000&precision=1&units=k&label=docker+hub+pulls&after=-86400&group=incremental-sum&label=docker%20hub%20pulls%20today&options=unaligned&tier=1&v44" alt="Docker Hub pulls today"></a>
</p>
### 1. **Install Netdata everywhere** :v:
Netdata can be installed on all Linux, macOS, and FreeBSD systems. We provide binary packages for the most popular operating systems and package managers.
- Install on [Ubuntu, Debian CentOS, Fedora, Suse, Red Hat, Arch, Alpine, Gentoo, even BusyBox](https://learn.netdata.cloud/docs/installing/one-line-installer-for-all-linux-systems).
- Install with [Docker](https://learn.netdata.cloud/docs/installing/docker).<br/>
Netdata is a [Verified Publisher on DockerHub](https://hub.docker.com/r/netdata/netdata) and our users enjoy free unlimited DockerHub pulls :heart_eyes:.
- Install on [MacOS](https://learn.netdata.cloud/docs/installing/macos) :metal:.
- Install on [FreeBSD](https://learn.netdata.cloud/docs/installing/freebsd) and [pfSense](https://learn.netdata.cloud/docs/installing/pfsense).
- Install [from source](https://learn.netdata.cloud/docs/installing/build-the-netdata-agent-yourself/compile-from-source-code) 
- For Kubernetes deployments [check here](https://learn.netdata.cloud/docs/installation/install-on-specific-environments/kubernetes/).
Check also the [Netdata Deployment Strategies](https://learn.netdata.cloud/docs/architecture/deployment-strategies) to decide how to deploy it in your infrastructure.
By default, you will have immediately available a local dashboard. Netdata starts a web server for its dashboard at port `19999`. Open up your web browser of choice and
navigate to `http://NODE:19999`, replacing `NODE` with the IP address or hostname of your Agent. If installed on localhost, you can access it through `http://localhost:19999`.
### 2. **Configure Collectors** :boom:
Netdata auto-detects and auto-discovers most operating system data sources and applications. However, many data sources require some manual configuration, usually to allow Netdata to get access to the metrics.
- For a detailed list of the 800+ collectors available, check [this guide](https://learn.netdata.cloud/docs/data-collection/).
- To monitor Windows servers and applications use [this guide](https://learn.netdata.cloud/docs/data-collection/monitor-anything/system-metrics/windows-machines).
- To monitor SNMP devices check [this guide](https://learn.netdata.cloud/docs/data-collection/monitor-anything/networking/snmp).
### 3. **Configure Alert Notifications** :bell:
Netdata comes with hundreds of pre-configured alerts, that automatically check your metrics, immediately after they start getting collected.
Netdata can dispatch alert notifications to multiple third party systems, including: `email`, `Alerta`, `AWS SNS`, `Discord`, `Dynatrace`, `flock`, `gotify`, `IRC`, `Matrix`, `MessageBird`, `Microsoft Teams`, `ntfy`, `OPSgenie`, `PagerDuty`, `Prowl`, `PushBullet`, `PushOver`, `RocketChat`, `Slack`, `SMS tools`, `Syslog`, `Telegram`, `Twilio`.
By default, Netdata will send e-mail notifications, if there is a configured MTA on the system.
### 4. **Configure Netdata Parents** :family:
Optionally, configure one or more Netdata Parents. A Netdata Parent is a Netdata Agent that has been configured to accept [streaming connections](https://learn.netdata.cloud/docs/streaming/streaming-configuration-reference) from other Netdata agents.
Netdata Parents provide:
- **Infrastructure level dashboards, at `http://parent.server.ip:19999/`.**<br/>
Each Netdata Agent has an API listening at the TCP port 19999 of each server.
When you hit that port with a web browser (e.g. `http://server.ip:19999/`), the Netdata Agent UI is presented.
When the Netdata Agent is also a Parent, the UI of the Parent includes data for all nodes that stream metrics to that Parent.
- **Increased retention for all metrics of all your nodes.**<br/>
Each Netdata Agent maintains each own database of metrics. But Parents can be given additional resources to maintain a much longer database than
individual Netdata Agents.
- **Central configuration of alerts and dispatch of notifications.**<br/>
Using Netdata Parents, all the alert notifications integrations can be configured only once, at the Parent and they can be disabled at the Netdata Agents.
You can also use Netdata Parents to:
- Offload your production systems (the parents run ML, alerts, queries, etc. for all their children)
- Secure your production systems (the parents accept user connections, for all their children)
### 5. **Connect to Netdata Cloud** :cloud:
Optionally, [sign-in](https://app.netdata.cloud/sign-in) to [Netdata Cloud](https://www.netdata.cloud/) and claim your Netdata Agents and Parents.
If you connect your Netdata Parents, there is no need to connect your Netdata Agents. They will be connected via the Parents.
When your Netdata nodes are connected to Netdata Cloud, you can (on top of the above):
- Access your Netdata agents from anywhere
- Access sensitive Netdata agent features (like "Netdata Functions": processes, systemd-journal)
- Organize your infra in spaces and rooms
- Create, manage, and share **custom dashboards**
- Invite your team and assign roles to them (Role Based Access Control - RBAC)
- Get infinite horizontal scalability (multiple independent Netdata Agents are viewed as one infra)
- Configure alerts from the UI (coming soon)
- Configure data collection from the UI (coming soon)
- Netdata Mobile App notifications (coming soon)
:love_you_gesture: Netdata Cloud does not prevent you from using your Netdata Agents and Parents directly, and vice versa.<br/>
:ok_hand: Your metrics are still stored in your network when you connect your Netdata Agents and Parents to Netdata Cloud.
<hr class="solid">
<hr class="solid">
## How it works
Netdata is built around a **modular metrics processing pipeline**.
<details><summary>Click to see more details about this pipeline...</summary>
<br/>
Each Netdata Agent can perform the following functions:
1. **`COLLECT` metrics from their sources**<br/>
Uses [internal](https://github.com/netdata/netdata/tree/master/collectors) and [external](https://github.com/netdata/go.d.plugin/tree/master/modules) plugins to collect data from their sources.
Netdata auto-detects and collects almost everything from the operating system: including CPU, Interrupts, Memory, Disks, Mount Points, Filesystems, Network Stack, Network Interfaces, Containers, VMs, Processes, `systemd` units, Linux Performance Metrics, Linux eBPF, Hardware Sensors, IPMI, and more.
It collects application metrics from applications: PostgreSQL, MySQL/MariaDB, Redis, MongoDB, Nginx, Apache, and hundreds more.
Netdata also collects your custom application metrics by scraping OpenMetrics exporters, or via StatsD.
It can convert web server log files to metrics and apply ML and alerts to them, in real-time.
And it also supports synthetic tests / white box tests, so you can ping servers, check API responses, or even check filesystem files and directories to generate metrics, train ML and run alerts and notifications on their status.
2. **`STORE` metrics to a database**<br/>
Uses database engine plugins to store the collected data, either in memory and/or on disk. We have developed our own [`dbengine`](https://github.com/netdata/netdata/tree/master/database/engine#readme) for storing the data in a very efficient manner, allowing Netdata to have less than 1 byte per sample on disk and amazingly fast queries.
3. **`LEARN` the behavior of metrics** (ML)<br/>
Trains multiple Machine-Learning (ML) models per metric to learn the behavior of each metric individually. Netdata uses the `kmeans` algorithm and creates by default a model per metric per hour, based on the values collected for that metric over the last 6 hours. The trained models are persisted to disk.
4. **`DETECT` anomalies in metrics** (ML)<br/>
Uses the trained machine learning (ML) models to detect outliers and mark collected samples as **anomalies**. Netdata stores anomaly information together with each sample and also streams it to Netdata Parents so that the anomaly is also available at query time for the whole retention of each metric.
5. **`CHECK` metrics and trigger alert notifications**<br/>
Uses its configured alerts (you can configure your own) to check the metrics for common issues and uses notifications plugins to send alert notifications.
6. **`STREAM` metrics to other Netdata Agents**<br/>
Push metrics in real-time to Netdata Parents.
7. **`ARCHIVE` metrics to 3rd party databases**<br/>
Export metrics to industry standard time-series databases, like `Prometheus`, `InfluxDB`, `OpenTSDB`, `Graphite`, etc.
8. **`QUERY` metrics and present dashboards**<br/>
Provide an API to query the data and present interactive dashboards to users.
9. **`SCORE` metrics to reveal similarities and patterns**<br/>
Score the metrics according to the given criteria, to find the needle in the haystack.
When using Netdata Parents, all the functions of a Netdata Agent (except data collection) can be delegated to Parents to offload production systems.
The core of Netdata is developed in C. We have our own `libnetdata`, that provides:
- **`DICTIONARY`**<br/>
A high-performance algorithm to maintain both indexed and ordered pools of structures Netdata needs. It uses JudyHS arrays for indexing, although it is modular: any hashtable or tree can be integrated into it. Despite being in C, dictionaries follow object-oriented programming principles, so there are constructors, destructors, automatic memory management, garbage collection, and more. For more see [here](https://github.com/netdata/netdata/tree/master/libnetdata/dictionary).
- **`ARAL`**<br/>
ARray ALlocator (ARAL) is used to minimize the system allocations made by Netdata. ARAL is optimized for peak performance when multi-threaded. It also allows all structures that use it to be allocated in memory-mapped files (shared memory) instead of RAM. For more see [here](https://github.com/netdata/netdata/tree/master/libnetdata/aral).
- **`PROCFILE`**<br/>
A high-performance `/proc` (but also any) file parser and text tokenizer. It achieves its performance by keeping files open and adjustings its buffers to read the entire file in one call (which is also required by the Linux kernel). For more see [here](https://github.com/netdata/netdata/tree/master/libnetdata/procfile).
- **`STRING`**<br/>
A string internet mechanism, for string deduplication and indexing (using JudyHS arrays), optimized for multi-threaded usage. For more see [here](https://github.com/netdata/netdata/tree/master/libnetdata/string).
- **`ARL`**<br/>
Adaptive Resortable List (ARL), is a very fast list iterator, that keeps the expected items on the list in the same order they are found in input list. So, the first iteration is somewhat slower, but all the following iterations are perfectly aligned for best performance. For more see [here](https://github.com/netdata/netdata/tree/master/libnetdata/adaptive_resortable_list).
- **`BUFFER`**<br/>
A flexible text buffer management system that allows Netdata to automatically handle dynamically sized text buffer allocations. The same mechanism is used for generating consistent JSON output by the Netdata APIs. For more see [here](https://github.com/netdata/netdata/tree/master/libnetdata/buffer).
- **`SPINLOCK`**<br/>
Like POSIX `MUTEX` and `RWLOCK` but a lot faster, based on atomic operations, with significantly smaller memory impact, while being portable.
- **`PGC`**<br/>
A caching layer that can be used to cache any kind of time-related data, with automatic indexing (based on a tree of JudyL arrays), memory management, evictions, flushing, pressure management. This is extensively used in `dbengine`. For more see [here](https://github.com/netdata/netdata/blob/master/database/engine/README.md).
The above, and many more, allow Netdata developers to work on the application fast and with confidence. Most of the business logic in Netdata is a work of mixing the above.
Netdata data collection plugins can be developed in any language. Most of our application collectors though are developed in [Go](https://github.com/netdata/go.d.plugin).
</details>
## FAQ
### :shield: Is Netdata secure?
Of course it is! We do our best to ensure it is!
<details><summary>Click to see detailed answer ...</summary>
<br/> <br/>
We understand that Netdata is a software piece that is installed on millions of production systems across the world. So, it is important for us, Netdata to be as secure as possible:
- We follow the [Open Source Security Foundation](https://bestpractices.coreinfrastructure.org/en/projects/2231) best practices.
- We have given great attention to detail when it comes to security design. Check out our [security design](https://learn.netdata.cloud/docs/architecture/security-and-privacy-design).
- Netdata is a popular open-source project and is frequently tested by many security analysts.
- Check also our [security policies and advisories published so far](https://github.com/netdata/netdata/security).
<br/> <br/>
</details>
### :cyclone: Will Netdata consume significant resources on my servers?
No. It will not! We promise this will be fast!
<details><summary>Click to see detailed answer ...</summary>
<br/> <br/>
Although each Netdata Agent is a complete monitoring solution packed into a single application, and despite the fact that Netdata collects **every metric every single second** and trains **multiple ML models** per metric, you will find that Netdata has amazing performance! In many cases, it outperforms other monitoring solutions that have significantly fewer features or far smaller data collection rates.
This is what you should expect:
- For production systems, each Netdata Agent with default settings (everything enabled, ML, Health, DB) should consume about 5% CPU utilization of one core and about 150 MiB or RAM.
By using a Netdata parent and streaming all metrics to that parent, you can disable ML & health and use an ephemeral DB mode (like `alloc`) on the children, leading to utilization of about 1% CPU of a single core and 100 MiB of RAM. Of course, these depend on how many metrics are collected.
- For Netdata Parents, for about 1 to 2 million metrics, all collected every second, we suggest a server with 16 cores and 32GB RAM. Less than half of it will be used for data collection and ML. The rest will be available for queries.
Netdata has extensive internal instrumentation to help us reveal how the resources consumed are used. All these are available in the "Netdata Monitoring" section of the dashboard. Depending on your use case, there are many options to optimize resource consumption.
Even if you need to run Netdata on extremely weak embedded or IoT systems, you will find that Netdata can be tuned to be very performant.
<br/> <br/>
</details>
### :scroll: How much retention can I have?
As much as you need!
<details><summary>Click to see detailed answer ...</summary>
<br/> <br/>
Netdata supports **tiering**, to downsample past data and save disk space. With default settings, it has 3 tiers:
1. `tier 0`, with high resolution, per-second, data.
2. `tier 1`, mid-resolution, per minute, data.
3. `tier 2`, low-resolution, per hour, data.
All tiers are updated in parallel during data collection. Just increase the disk space you give to Netdata to get a longer history for your metrics. Tiers are automatically chosen at query time depending on the time frame and the resolution requested.
<br/> <br/>
</details>
### :rocket: Does it scale? I have really a lot of servers!
Netdata is designed to scale and can handle large volumes of data.
<details><summary>Click to see detailed answer ...</summary>
<br/> <br/>
Netdata is a distributed monitoring solution. You can scale it to infinity by spreading Netdata servers across your infrastructure.
With the streaming feature of the Agent, we can support monitoring ephemeral servers but also allow the creation of "monitoring islands" where metrics are aggregated to a few servers (Netdata Parents) for increased retention, or for offloading production systems.
- :airplane: Netdata Parents provide great vertical scalability, so you can have as big parents as the CPU, RAM and Disk resources you can dedicate to them. In our lab we constantly stress test Netdata Parents with several million metrics collected per second, to ensure it is reliable, stable, and robust at scale.
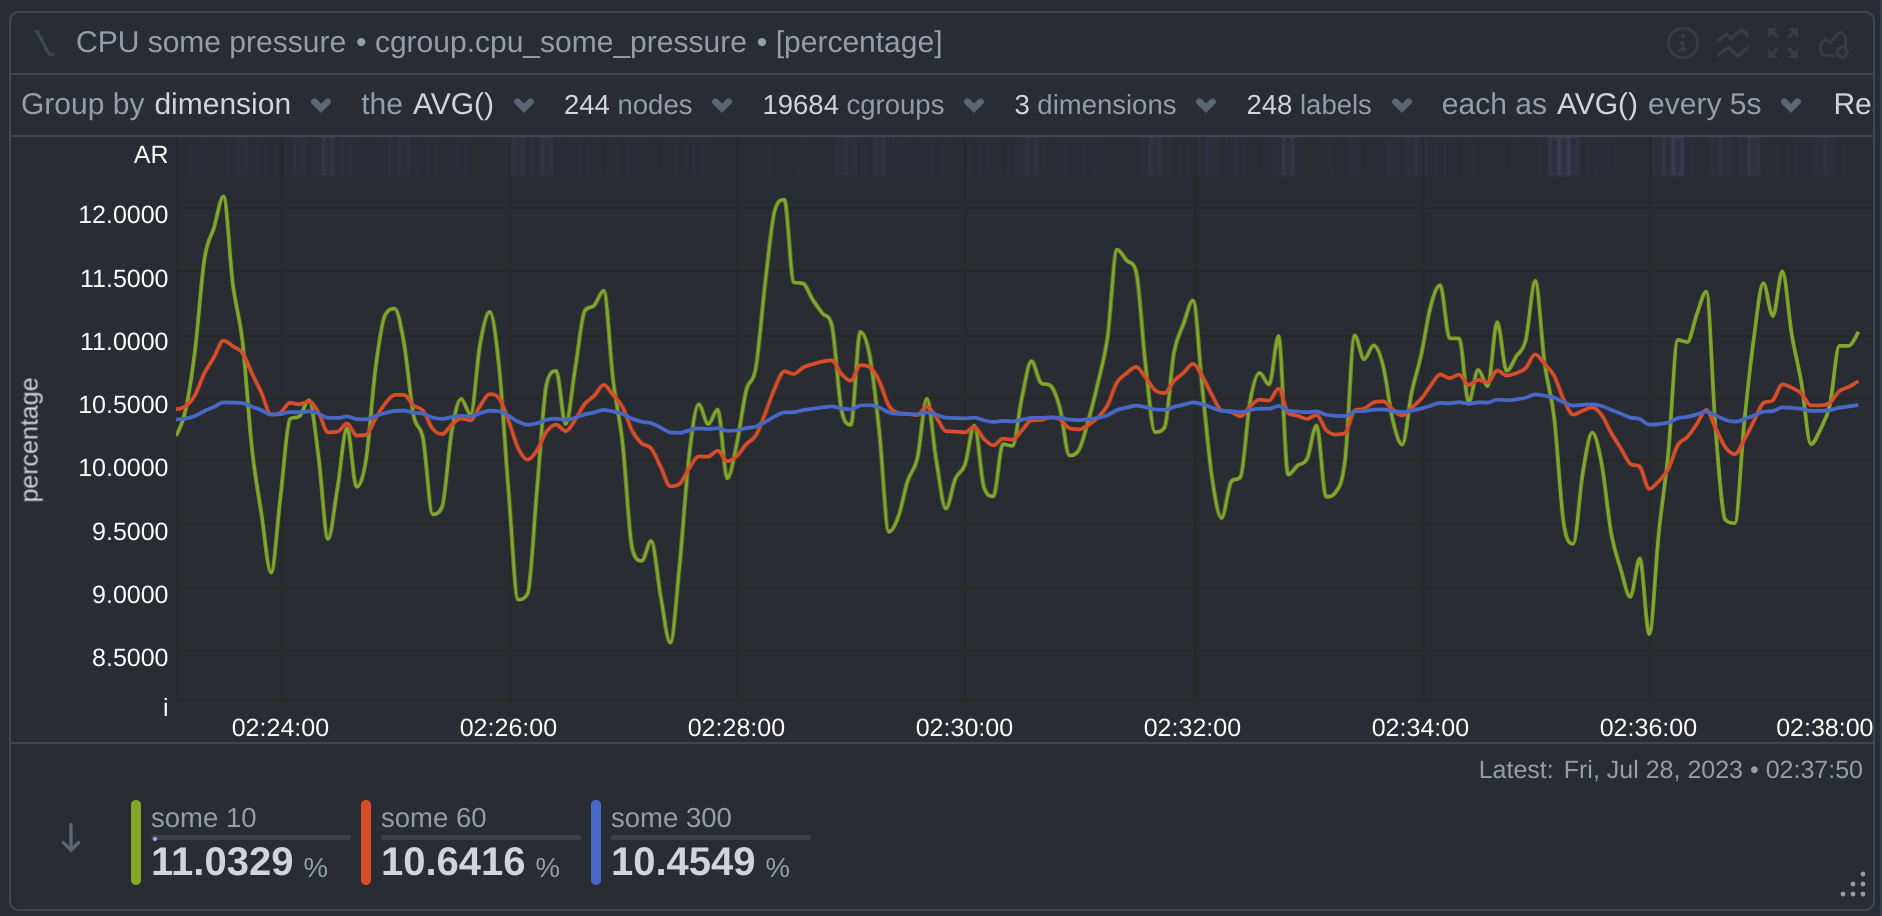
- :rocket: In addition, Netdata Cloud provides virtually unlimited horizontal scalability. It "merges" all the Netdata parents you have into one unified infrastructure at query time. Netdata Cloud itself is probably the biggest single installation monitoring platform ever created, currently monitoring about 100k online servers with about 10k servers changing state (added/removed) per day!
Example: the following chart comes from a single Netdata Parent. As you can see on it, 244 nodes stream to it metrics of about 20k running containers. On this specific chart there are 3 dimensions per container, so a total of about 60k time-series queries are needed to present it.
<br/> <br/>
</details>
### :floppy_disk: My production servers are very sensitive in disk I/O. Can I use Netdata?
Yes, you can!
<details><summary>Click to see detailed answer ...</summary>
<br/> <br/>
Netdata has been designed to spread disk writes across time. Each metric is flushed to disk every 17 minutes, but metrics are flushed evenly across time, at an almost constant rate. Also, metrics are packed into bigger blocks we call `extents` and are compressed with LZ4 before saving them, to minimize the number of I/O operations made.
Netdata also employs direct I/O for all its database operations, ensuring optimized performance. By managing its own caches, Netdata avoids overburdening system caches, facilitating a harmonious coexistence with other applications.
Single node Agents (not Parents), should have a constant rate of about 50 KiB/s or less, with some spikes above that every minute (flushing of tier 1) and higher spikes every hour (flushing of tier 2).
Health Alerts and Machine-Learning run queries to evaluate their expressions and learn from the metrics' patterns. These are also spread over time, so there should be an almost constant read rate too.
To make Netdata not use the disks at all, we suggest the following:
1. Use database mode `alloc` or `ram` to disable writing metric data to disk.
2. Configure streaming to push in real-time all metrics to a Netdata Parent. The Netdata Parent will maintain metrics on disk for this node.
3. Disable ML and health on this node. The Netdata Parent will do them for this node.
4. Use the Netdata Parent to access the dashboard.
Using the above, the Netdata Agent on your production system will not use a disk.
<br/> <br/>
</details>
### :raised_eyebrow: How is Netdata different from a Prometheus and Grafana setup?
Netdata is a "ready to use" monitoring solution. Prometheus and Grafana are tools to build your own monitoring solution.
Netdata is also a lot faster, requires singificantly less resources and puts almost no stress on the server it runs. For a performance comparison check [this blog](https://blog.netdata.cloud/netdata-vs-prometheus-performance-analysis/).
<details><summary>Click to see detailed answer ...</summary>
<br/> <br/>
First, we have to say that Prometheus as a time-series database and Grafana as a visualizer are excellent tools for what they do.
However, we believe that such a setup is missing a key element: A Prometheus and Grafana setup assumes that you know everything about the metrics you collect and you understand deeply how they are structured, they should be queried and visualized.
In reality, this setup has a lot of problems. The vast number of technologies, operating systems, and applications we use in our modern stacks, makes it impossible for any single person to know and understand everything about anything. We get testimonials regularly from Netdata users across the biggest enterprises, that Netdata manages to reveal issues, anomalies and problems they were not aware of and they didn't even have the means to find or troubleshoot.
So, the biggest difference of Netdata to Prometheus, and Grafana, is that we decided that the tool needs to have a much better understanding of the components, the applications, and the metrics it monitors.
- When compared to Prometheus, Netdata needs for each metric much more than just a name, some labels, and a value over time. A metric in Netdata is a structured entity that correlates with other metrics in a certain way and has specific attributes that depict how it should be organized, treated, queried, and visualized. We call this the NIDL (Nodes, Instances, Dimensions, Labels) framework.
Maintaining such an index is a challenge: first, because the raw metrics collected do not provide this information, so we have to add it, and second because we need to maintain this index for the lifetime of each metric, which with our current database retention, it is usually more than a year.
At the same time, Netdata provides better retention than Prometheus due to database tiering, scales easier than Prometheus due to streaming, supports anomaly detection and it has a mertrics scoring engine to find the needle in the haystack when needed.
- When compared to Grafana, Netdata is fully automated. Grafana has more customization capabilities than Netdata, but Netdata presents fully functional dashboards by itself and most importantly it gives you the means to understand, analyze, filter, slice and dice the data without the need for you to edit queries or be aware of any peculiarities the underlying metrics may have.
Furthermore, to help you when you need to find the needle in the haystack, Netdata has advanced troubleshooting tools provided by the Netdata metrics scoring engine, that allows it to score metrics based on their anomaly rate, their differences or similarities for any given time frame.
Still, if you are already familiar with Prometheus and Grafana, Netdata integrates nicely with them, and we have reports from users who use Netdata with Prometheus and Grafana in production.
<br/> <br/>
</details>
### :raised_eyebrow: How is Netdata different from DataDog, New Relic, Dynatrace, X SaaS Provider?
With Netdata your data are always on-prem and your metrics are always high-resolution.
<details><summary>Click to see detailed answer ...</summary>
<br/> <br/>
Most commercial monitoring providers face a significant challenge: they centralize all metrics to their infrastructure and this is, inevitably, expensive. It leads them to one or more of the following:
1. be unrealistically expensive
2. limit the number of metrics they collect
3. limit the resolution of the metrics they collect
As a result, they try to find a balance: collect the least possible data, but collect enough to have something useful out of it.
We, at Netdata, see monitoring in a completely different way: **monitoring systems should be built bottom-up and be rich in insights**, so we focus on each component individually to collect, store, check and visualize everything related to each of them, and we make sure that all components are monitored. Each metric is important.
This is why Netdata trains multiple machine-learning models per metric, based exclusively on their own past (no sampling of data, no sharing of trained models) to detect anomalies based on the specific use case and workload each component is used.
This is also why Netdata alerts are attached to components (instances) and are configured with dynamic thresholds and rolling windows, instead of static values.
The distributed nature of Netdata helps scale this approach: your data is spread inside your infrastructure, as close to the edge as possible. Netdata is not one data lane. Each Netdata Agent is a data lane and all of them together build a massive distributed metrics processing pipeline that ensures all your infrastructure components and applications are monitored and operating as they should.
<br/> <br/>
</details>
### :raised_eyebrow: How is Netdata different from Nagios, Icinga, Zabbix, etc?
Netdata offers real-time, comprehensive monitoring, with a user-friendly interface and the ability to monitor everything, without any custom configuration required.
<details><summary>Click to see detailed answer ...</summary>
<br/> <br/>
While Nagios, Icinga, Zabbix, and other similar tools are powerful and highly customizable, they can be complex to set up and manage. Their flexibility often comes at the cost of ease-of-use, especially for users who are not systems administrators or do not have extensive experience with these tools. Additionally, these tools generally require you to know what you want to monitor in advance and configure it explicitly.
Netdata, on the other hand, takes a different approach. It provides a "ready to use" monitoring solution with a focus on simplicity and comprehensiveness. It automatically detects and starts monitoring many different system metrics and applications out-of-the-box, without any need for custom configuration.
In comparison to these traditional monitoring tools, Netdata:
- Provides real-time, high-resolution metrics, as opposed to the often minute-level granularity that tools like Nagios, Icinga, and Zabbix provide.
- Automatically generates meaningful, organized, and interactive visualizations of the collected data. Unlike other tools, where you have to manually create and organize graphs and dashboards, Netdata takes care of this for you.
- Applies machine learning to each individual metric to detect anomalies, providing more insightful and relevant alerts than static thresholds.
- Is designed to be distributed, so your data is spread inside your infrastructure, as close to the edge as possible. This approach is more scalable and avoids the potential bottleneck of a single centralized server.
- Has a more modern and user-friendly interface, making it easy for anyone, not just experienced administrators, to understand the health and performance of their systems.
Even if you're already using Nagios, Icinga, Zabbix, or similar tools, you can use Netdata alongside them to augment your existing monitoring capabilities with real-time insights and user-friendly dashboards.
<br/> <br/>
</details>
### :flushed: I feel overwhelmed by the amount of information in Netdata. What should I do?
Netdata is designed to provide comprehensive insights, but we understand that the richness of information might sometimes feel overwhelming. Here are some tips on how to navigate and utilize Netdata effectively...
<details><summary>Click to see detailed answer ...</summary>
<br/> <br/>
Netdata is indeed a very comprehensive monitoring tool. It's designed to provide you with as much information as possible about your system and applications, so that you can understand and address any issues that arise. However, we understand that the sheer amount of data can sometimes be overwhelming.
Here are some suggestions on how to manage and navigate this wealth of information:
1. **Start with the Overview Dashboard**<br/>
Netdata's Overview Dashboard provides a high-level summary of your system's status. We have added summary tiles on almost every section, you reveal the information that is more important. This is a great place to start, as it can help you identify any major issues or trends at a glance.
2. **Use the Search Feature**<br/>
If you're looking for specific information, you can use the search feature to find the relevant metrics or charts. This can help you avoid scrolling through all the data.
3. **Customize your Dashboards**<br/>
Netdata allows you to create custom dashboards, which can help you focus on the metrics that are most important to you. Sign-in to Netdata and there you can have your custom dashboards. (coming soon to the agent dashboard too)
4. **Leverage Netdata's Anomaly Detection**<br/>
Netdata uses machine learning to detect anomalies in your metrics. This can help you identify potential issues before they become major problems. We have added an `AR` button above the dashboard table of contents to reveal the anomaly rate per section so that you can easily spot what could need your attention.
5. **Take Advantage of Netdata's Documentation and Blogs**<br/>
Netdata has extensive documentation that can help you understand the different metrics and how to interpret them. You can also find tutorials, guides, and best practices there.
Remember, it's not necessary to understand every single metric or chart right away. Netdata is a powerful tool, and it can take some time to fully explore and understand all of its features. Start with the basics and gradually delve into more complex metrics as you become more comfortable with the tool.
<br/> <br/>
</details>
### :cloud: Do I have to subscribe to Netdata Cloud?
Subscribing to Netdata Cloud is optional but many users find it enhances their experience with Netdata.
<details><summary>Click to see detailed answer ...</summary>
<br/> <br/>
The Netdata Agent dashboard and the Netdata Cloud dashboard are the same. Still, Netdata Cloud provides additional features, that the Netdata Agent is not capable of. These include:
1. Access your infrastructure from anywhere.
2. Have SSO to protect sensitive features.
3. Customizability (custom dashboards and other settings are persisted when you are signed in to Netdata Cloud)
4. Configuration of Alerts and Data Collection from the UI (coming soon)
5. Security (role-based access control - RBAC).
6. Horizontal Scalability ("blend" multiple independent parents in one uniform infrastructure)
7. Central Dispatch of Alert Notifications (even when multiple independent parents are involved)
8. Mobile App for Alert Notifications (coming soon)
So, although it is not required, you can get the most out of your Netdata setup by using Netdata Cloud.
We encourage you to support Netdata by buying a Netdata Cloud subscription. A successful Netdata is a Netdata that evolves and gets improved to provide a simpler, faster and easier monitoring for all of us.
For organizations that need a fully on-prem solution, we provide Netdata Cloud for on-prem installation. [Contact us for more information](mailto:info@netdata.cloud).
<br/> <br/>
</details>
### :mag_right: What does the anonymous telemetry collected by Netdata entail?
Your privacy is our utmost priority. As part of our commitment to improving Netdata, we rely on anonymous telemetry data from our users who choose to leave it enabled. This data greatly informs our decision-making processes and contributes to the future evolution of Netdata.
Should you wish to disable telemetry, instructions for doing so are provided in our installation guides.
<details><summary>Click to see detailed answer ...</summary>
<br/> <br/>
Netdata is in a constant state of growth and evolution. The decisions that guide this development are ideally rooted in data. By analyzing anonymous telemetry data, we can answer questions such as: "What features are being used frequently?", "How do we prioritize between potential new features?" and "What elements of Netdata are most important to our users?"
By leaving anonymous telemetry enabled, users indirectly contribute to shaping Netdata's roadmap, providing invaluable information that helps us prioritize our efforts for the project and the community.
We are aware that for privacy or regulatory reasons, not all environments can allow telemetry. To cater to this, we have simplified the process of disabling telemetry:
- During installation, you can append `--disable-telemetry` to our `kickstart.sh` script, or
- Create the file `/etc/netdata/.opt-out-from-anonymous-statistics` and then restart Netdata.
These steps will disable the anonymous telemetry for your Netdata installation.
Please note, even with telemetry disabled, Netdata still requires a [Netdata Registry](https://learn.netdata.cloud/docs/configuring/securing-netdata-agents/registry) for alert notifications' Call To Action (CTA) functionality. When you click an alert notification, it redirects you to the Netdata Registry, which then directs your web browser to the specific Netdata Agent that issued the alert for further troubleshooting. The Netdata Registry learns the URLs of your agents when you visit their dashboards.
Any Netdata Agent can act as a Netdata Registry. Simply designate one Netdata Agent as your registry, and our global Netdata Registry will no longer be in use. For further information on this, please refer to [this guide](https://learn.netdata.cloud/docs/configuring/securing-netdata-agents/registry).
<br/> <br/>
</details>
### :smirk: Who uses Netdata?
Netdata is a widely adopted project...
<details><summary>Click to see detailed answer ...</summary>
<br/> <br/>
Browse the [Netdata stargazers on GitHub](https://github.com/netdata/netdata/stargazers) to discover users from renowned companies and enterprises, such as ABN AMRO Bank, AMD, Amazon, Baidu, Booking.com, Cisco, Delta, Facebook, Google, IBM, Intel, Logitech, Netflix, Nokia, Qualcomm, Realtek Semiconductor Corp, Redhat, Riot Games, SAP, Samsung, Unity, Valve, and many others.
Netdata also enjoys significant usage in academia, with notable institutions including New York University, Columbia University, New Jersey University, Seoul National University, University College London, among several others.
And, Netdata is also used by numerous governmental organizations worldwide.
In a nutshell, Netdata proves invaluable for:
- **Infrastructure intensive organizations**<br/>
Such as hosting/cloud providers and companies with hundreds or thousands of nodes, who require a high-resolution, real-time monitoring solution for a comprehensive view of all their components and applications.
- **Technology operators**<br/>
Those in need of a standardized, comprehensive solution for round-the-clock operations. Netdata not only facilitates operational automation and provides controlled access for their operations engineers, but also enhances skill development over time.
- **Technology startups**<br/>
Who seek a feature-rich monitoring solution from the get-go.
- **Freelancers**<br/>
Who seek a simple, efficient and straightforward solution without sacrificing performance and outcomes.
- **Professional SysAdmins and DevOps**<br/>
Who appreciate the fine details and understand the value of holistic monitoring from the ground up.
- **Everyone else**<br/>
All of us, who are tired of the inefficiency in the monitoring industry and would love a refreshing change and a breath of fresh air. :slightly_smiling_face:
<br/> <br/>
</details>
### :globe_with_meridians: Is Netdata open-source?
The Netdata Agent back-end is entirely open-source. We ship 3 different versions of the UI: 2 open-source versions and 1 closed-source version.
<details><summary>Click to see detailed answer ...</summary>
<br/> <br/>
The entire back-end of the Netdata Agent is open-source, licensed under GPLv3+. We don't develop a separate enterprise version. All users, including commercial ones, use the same Netdata Agent.
The Netdata Agent is shipped with multiple UI versions:
- `http://agent.ip:19999/v0/`, the original open-source single-node UI, GPLv3+.
- `http://agent.ip:19999/v1/`, the latest open-source single-node UI, GPLv3+.
- `http://agent.ip:19999/v2/`, a snapshot of the latest Netdata Cloud UI as it was at the time the agent was released, licensed to be distributed with Netdata Agents under [NCUL1](https://github.com/netdata/netdata/blob/master/web/gui/v2/LICENSE.md).
When you access a Netdata Agent via `http://agent.ip:19999/` a splash screen attempts to use the latest live version of Netdata Cloud UI (downloaded from Cloudflare). This only happens when the web browser has internet connectivity and Netdata Cloud is not disabled at the agent configuration. Otherwise, it falls back to `http://agent.ip:19999/v2/`.
The Netdata Cloud UI is not open-source. But we thought that it is to the benefit of the community to allow everyone to use it directly with Netdata Agents, for free, even if Netdata Cloud is not used.
<br/> <br/>
</details>
### :moneybag: What is your monetization strategy?
Netdata generates revenue through subscriptions to advanced features of Netdata Cloud and sales of on-premise and private versions of Netdata Cloud.
<details><summary>Click to see detailed answer ...</summary>
<br/> <br/>
Netdata generates revenue from these activities:
1. **Netdata Cloud Subscriptions**<br/>
Direct funding for our project's vision comes from users subscribing to Netdata Cloud's advanced features.
2. **Netdata Cloud On-Prem or Private**<br/>
Purchasing the on-premises or private versions of Netdata Cloud supports our financial growth.
Our Open-Source Community and the free access to Netdata Cloud, contribute to Netdata in the following ways:
- **Netdata Cloud Community Use**<br/>
The free usage of Netdata Cloud demonstrates its market relevance. While this doesn't generate revenue, it reinforces trust among new users and aids in securing appropriate project funding.
- **User Feedback**<br/>
Feedback, especially issues and bug reports, is invaluable. It steers us towards a more resilient and efficient product. This, too, isn't a revenue source but is pivotal for our project's evolution.
- **Anonymous Telemetry Insights**<br/>
Users who keep anonymous telemetry enabled, help us make data informed decisions in refining and enhancing Netdata. This isn't a revenue stream, but knowing which features are used and how, contributes in building a better product for everyone.
We don't monetize, directly or indirectly, users' or "device heuristics" data. Any data collected from community members are exclusively used for the purposes stated above.
Netdata grows financially when tehnnology intensive organizations and operators, need - due to regulatory or business requirements - the entire Netdata suite (including Netdata Cloud) on-prem or private, bundled with top-tier support. It is a win-win case for all parties involved: these companies get a battle tested, robust and reliable solution, while the broader community that helps us build this product, enjoys it at no cost.
<br/> <br/>
</details>
## :book: Documentation
Netdata's documentation is available at [**Netdata Learn**](https://learn.netdata.cloud).
This site also hosts a number of [guides](https://learn.netdata.cloud/guides) to help newer users better understand how
to collect metrics, troubleshoot via charts, export to external databases, and more.
## :tada: Community
<p align="center">
<a href="https://discord.com/invite/mPZ6WZKKG2"><img alt="Discord" src="https://img.shields.io/discord/847502280503590932?logo=discord&logoColor=white&label=chat%20on%20discord"></a>
<a href="https://community.netdata.cloud"><img alt="Discourse topics" src="https://img.shields.io/discourse/topics?server=https%3A%2F%2Fcommunity.netdata.cloud%2F&logo=discourse&label=discourse%20forum"></a>
<a href="https://github.com/netdata/netdata/discussions"><img alt="GitHub Discussions" src="https://img.shields.io/github/discussions/netdata/netdata?logo=github&label=github%20discussions"></a>
</p>
Netdata is an inclusive open-source project and community. Please read our [Code of Conduct](https://github.com/netdata/.github/blob/main/CODE_OF_CONDUCT.md).
Join the Netdata community:
- Chat with us and other community members on [Discord](https://discord.com/invite/mPZ6WZKKG2).
- Start a discussion on [GitHub discussions](https://github.com/netdata/netdata/discussions).
- Open a topic to our [community forums](https://community.netdata.cloud).
> **Meet Up** :people_holding_hands::people_holding_hands::people_holding_hands:<br/>
> The Netdata team and community members have regular online meetups, usually every 2 weeks.<br/>
> **You are welcome to join us!**
> [Click here for the schedule](https://www.meetup.com/netdata/events/).
You can also find Netdata on:<br/>
[Twitter](https://twitter.com/netdatahq) | [YouTube](https://www.youtube.com/c/Netdata) | [Reddit](https://www.reddit.com/r/netdata/) | [LinkedIn](https://www.linkedin.com/company/netdata-cloud/) | [StackShare](https://stackshare.io/netdata) | [Product Hunt](https://www.producthunt.com/posts/netdata-monitoring-agent/) | [Repology](https://repology.org/metapackage/netdata/versions) | [Facebook](https://www.facebook.com/linuxnetdata/)
## :pray: Contribute
Contributions are essential to the success of open-source projects. In other words, we need your help to keep Netdata great!
What is a contribution? All the following are highly valuable to Netdata:
1. **Let us know of the best-practices you believe should be standardized**<br/>
Netdata should out-of-the-box detect as many infrastructure issues as possible. By sharing your knowledge and experiences, you help us build a monitoring solution that has baked into it all the best-practices about infrastructure monitoring.
2. **Let us know if Netdata is not perfect for your use case**<br/>
We aim to support as many use cases as possible and your feedback can be invaluable. Open a GitHub issue, or start a GitHub discussion about it, to discuss how you want to use Netdata and what you need.
Although we can't implement everything imaginable, we try to prioritize development on use-cases that are common to our community, are in the same direction we want Netdata to evolve and are aligned with our roadmap.
3. **Support other community members**<br/>
Join our community on GitHub, Discord and Reddit. Generally, Netdata is relatively easy to set up and configure, but still people may need a little push in the right direction to use it effectively. Supporting other members is a great contribution by itself!
4. **Add or improve integrations you need**<br/>
Integrations tend to be easier and simpler to develop. If you would like to contribute your code to Netdata, we suggest that you start with the integrations you need, which Netdata does not currently support.
General information about contributions:
- Check our [Security Policy](https://github.com/netdata/netdata/security/policy).
- Found a bug? Open a [GitHub issue](https://github.com/netdata/netdata/issues/new?assignees=&labels=bug%2Cneeds+triage&template=BUG_REPORT.yml&title=%5BBug%5D%3A+).
- Read our [Contributing Guide](https://github.com/netdata/.github/blob/main/CONTRIBUTING.md), which contains all the information you need to contribute to Netdata, such as improving our documentation, engaging in the community, and developing new features. We've made it as frictionless as possible, but if you need help, just ping us on our community forums!
Package maintainers should read the guide on [building Netdata from source](https://github.com/netdata/netdata/blob/master/packaging/installer/methods/source.md) for
instructions on building each Netdata component from the source and preparing a package.
## License
Netdata is released under [GPLv3+](https://github.com/netdata/netdata/blob/master/LICENSE). Netdata re-distributes other open-source tools and libraries. Please check the
[third party licenses](https://github.com/netdata/netdata/blob/master/REDISTRIBUTED.md).
The Latest Netdata UI, is distributed under [NCUL1](https://github.com/netdata/netdata/blob/master/web/gui/v2/LICENSE.md). It also uses third party open source components. Check the [UI third party licenses](https://github.com/netdata/netdata/blob/master/web/gui/v2/3D_PARTY_LICENSES.txt)
|
