
diff options
Diffstat (limited to 'src/tools/rust-analyzer/docs/dev/README.md')
| -rw-r--r-- | src/tools/rust-analyzer/docs/dev/README.md | 266 |
1 files changed, 266 insertions, 0 deletions
diff --git a/src/tools/rust-analyzer/docs/dev/README.md b/src/tools/rust-analyzer/docs/dev/README.md new file mode 100644 index 000000000..76bbd1e91 --- /dev/null +++ b/src/tools/rust-analyzer/docs/dev/README.md @@ -0,0 +1,266 @@ +# Contributing Quick Start + +rust-analyzer is an ordinary Rust project, which is organized as a Cargo workspace, builds on stable and doesn't depend on C libraries. +So, just + +``` +$ cargo test +``` + +should be enough to get you started! + +To learn more about how rust-analyzer works, see [./architecture.md](./architecture.md). +It also explains the high-level layout of the source code. +Do skim through that document. + +We also publish rustdoc docs to pages: https://rust-lang.github.io/rust-analyzer/ide/. +Note though, that the internal documentation is very incomplete. + +Various organizational and process issues are discussed in this document. + +# Getting in Touch + +rust-analyzer is a part of the [RLS-2.0 working +group](https://github.com/rust-lang/compiler-team/tree/6a769c13656c0a6959ebc09e7b1f7c09b86fb9c0/working-groups/rls-2.0). +Discussion happens in this Zulip stream: + +https://rust-lang.zulipchat.com/#narrow/stream/185405-t-compiler.2Frust-analyzer + +# Issue Labels + +* [good-first-issue](https://github.com/rust-lang/rust-analyzer/labels/good%20first%20issue) + are good issues to get into the project. +* [E-has-instructions](https://github.com/rust-lang/rust-analyzer/issues?q=is%3Aopen+is%3Aissue+label%3AE-has-instructions) + issues have links to the code in question and tests. +* [Broken Window](https://github.com/rust-lang/rust-analyzer/issues?q=is:issue+is:open+label:%22Broken+Window%22) + are issues which are not necessarily critical by themselves, but which should be fixed ASAP regardless, to avoid accumulation of technical debt. +* [E-easy](https://github.com/rust-lang/rust-analyzer/issues?q=is%3Aopen+is%3Aissue+label%3AE-easy), + [E-medium](https://github.com/rust-lang/rust-analyzer/issues?q=is%3Aopen+is%3Aissue+label%3AE-medium), + [E-hard](https://github.com/rust-lang/rust-analyzer/issues?q=is%3Aopen+is%3Aissue+label%3AE-hard), + [E-unknown](https://github.com/rust-lang/rust-analyzer/issues?q=is%3Aopen+is%3Aissue+label%3AE-unknown), + labels are *estimates* for how hard would be to write a fix. Each triaged issue should have one of these labels. +* [S-actionable](https://github.com/rust-lang/rust-analyzer/issues?q=is%3Aopen+is%3Aissue+label%3AS-actionable) and + [S-unactionable](https://github.com/rust-lang/rust-analyzer/issues?q=is%3Aopen+is%3Aissue+label%3AS-unactionable) + specify if there are concrete steps to resolve or advance an issue. Roughly, actionable issues need only work to be fixed, + while unactionable ones are blocked either on user feedback (providing a reproducible example), or on larger architectural + work or decisions. This classification is descriptive, not prescriptive, and might be wrong: Any unactionable issue might have a simple fix that we missed. + Each triaged issue should have one of these labels. +* [fun](https://github.com/rust-lang/rust-analyzer/issues?q=is%3Aopen+is%3Aissue+label%3Afun) + is for cool, but probably hard stuff. +* [Design](https://github.com/rust-lang/rust-analyzer/issues?q=is%3Aopen+is%3Aissue+label%Design) + is for moderate/large scale architecture discussion. + Also a kind of fun. + These issues should generally include a link to a Zulip discussion thread. + +# Code Style & Review Process + +Do see [./style.md](./style.md). + +# Cookbook + +## CI + +We use GitHub Actions for CI. +Most of the things, including formatting, are checked by `cargo test`. +If `cargo test` passes locally, that's a good sign that CI will be green as well. +The only exception is that some long-running tests are skipped locally by default. +Use `env RUN_SLOW_TESTS=1 cargo test` to run the full suite. + +We use bors to enforce the [not rocket science](https://graydon2.dreamwidth.org/1597.html) rule. + +## Launching rust-analyzer + +Debugging the language server can be tricky. +LSP is rather chatty, so driving it from the command line is not really feasible, driving it via VS Code requires interacting with two processes. + +For this reason, the best way to see how rust-analyzer works is to **find a relevant test and execute it**. +VS Code & Emacs include an action for running a single test. + +Launching a VS Code instance with a locally built language server is also possible. +There's **"Run Extension (Debug Build)"** launch configuration for this in VS Code. + +In general, I use one of the following workflows for fixing bugs and implementing features: + +If the problem concerns only internal parts of rust-analyzer (i.e. I don't need to touch the `rust-analyzer` crate or TypeScript code), there is a unit-test for it. +So, I use **Rust Analyzer: Run** action in VS Code to run this single test, and then just do printf-driven development/debugging. +As a sanity check after I'm done, I use `cargo xtask install --server` and **Reload Window** action in VS Code to verify that the thing works as I expect. + +If the problem concerns only the VS Code extension, I use **Run Installed Extension** launch configuration from `launch.json`. +Notably, this uses the usual `rust-analyzer` binary from `PATH`. +For this, it is important to have the following in your `settings.json` file: +```json +{ + "rust-analyzer.server.path": "rust-analyzer" +} +``` +After I am done with the fix, I use `cargo xtask install --client` to try the new extension for real. + +If I need to fix something in the `rust-analyzer` crate, I feel sad because it's on the boundary between the two processes, and working there is slow. +I usually just `cargo xtask install --server` and poke changes from my live environment. +Note that this uses `--release`, which is usually faster overall, because loading stdlib into debug version of rust-analyzer takes a lot of time. +To speed things up, sometimes I open a temporary hello-world project which has `"rust-analyzer.cargo.noSysroot": true` in `.code/settings.json`. +This flag causes rust-analyzer to skip loading the sysroot, which greatly reduces the amount of things rust-analyzer needs to do, and makes printf's more useful. +Note that you should only use the `eprint!` family of macros for debugging: stdout is used for LSP communication, and `print!` would break it. + +If I need to fix something simultaneously in the server and in the client, I feel even more sad. +I don't have a specific workflow for this case. + +Additionally, I use `cargo run --release -p rust-analyzer -- analysis-stats path/to/some/rust/crate` to run a batch analysis. +This is primarily useful for performance optimizations, or for bug minimization. + +## TypeScript Tests + +If you change files under `editors/code` and would like to run the tests and linter, install npm and run: + +```bash +cd editors/code +npm ci +npm run lint +``` +## How to ... + +* ... add an assist? [#7535](https://github.com/rust-lang/rust-analyzer/pull/7535) +* ... add a new protocol extension? [#4569](https://github.com/rust-lang/rust-analyzer/pull/4569) +* ... add a new configuration option? [#7451](https://github.com/rust-lang/rust-analyzer/pull/7451) +* ... add a new completion? [#6964](https://github.com/rust-lang/rust-analyzer/pull/6964) +* ... allow new syntax in the parser? [#7338](https://github.com/rust-lang/rust-analyzer/pull/7338) + +## Logging + +Logging is done by both rust-analyzer and VS Code, so it might be tricky to figure out where logs go. + +Inside rust-analyzer, we use the [`tracing`](https://docs.rs/tracing/) crate for logging, +and [`tracing-subscriber`](https://docs.rs/tracing-subscriber) for logging frontend. +By default, log goes to stderr, but the stderr itself is processed by VS Code. +`--log-file <PATH>` CLI argument allows logging to file. +Setting the `RA_LOG_FILE=<PATH>` environment variable will also log to file, it will also override `--log-file`. + +To see stderr in the running VS Code instance, go to the "Output" tab of the panel and select `rust-analyzer`. +This shows `eprintln!` as well. +Note that `stdout` is used for the actual protocol, so `println!` will break things. + +To log all communication between the server and the client, there are two choices: + +* You can log on the server side, by running something like + ``` + env RA_LOG=lsp_server=debug code . + ``` +* You can log on the client side, by enabling `"rust-analyzer.trace.server": "verbose"` workspace setting. + These logs are shown in a separate tab in the output and could be used with LSP inspector. + Kudos to [@DJMcNab](https://github.com/DJMcNab) for setting this awesome infra up! + + +There are also several VS Code commands which might be of interest: + +* `Rust Analyzer: Status` shows some memory-usage statistics. + +* `Rust Analyzer: Syntax Tree` shows syntax tree of the current file/selection. + +* `Rust Analyzer: View Hir` shows the HIR expressions within the function containing the cursor. + + You can hover over syntax nodes in the opened text file to see the appropriate + rust code that it refers to and the rust editor will also highlight the proper + text range. + + If you trigger Go to Definition in the inspected Rust source file, + the syntax tree read-only editor should scroll to and select the + appropriate syntax node token. + + 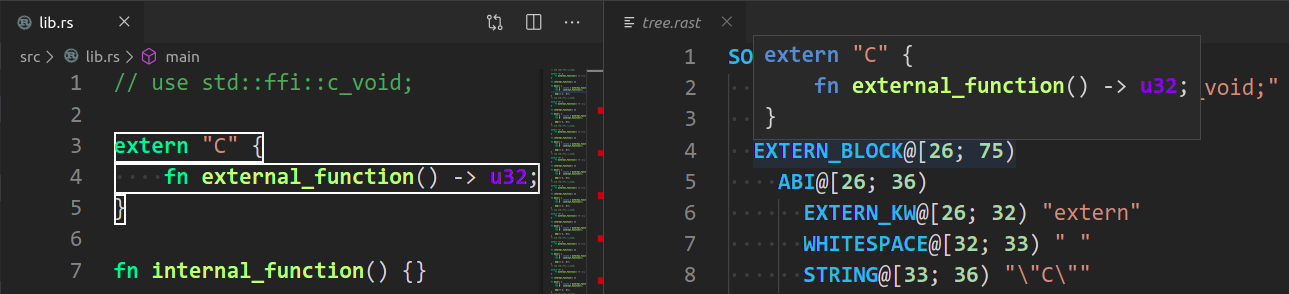 + +## Profiling + +We have a built-in hierarchical profiler, you can enable it by using `RA_PROFILE` env-var: + +``` +RA_PROFILE=* // dump everything +RA_PROFILE=foo|bar|baz // enabled only selected entries +RA_PROFILE=*@3>10 // dump everything, up to depth 3, if it takes more than 10 ms +``` + +In particular, I have `export RA_PROFILE='*>10'` in my shell profile. + +We also have a "counting" profiler which counts number of instances of popular structs. +It is enabled by `RA_COUNT=1`. + +To measure time for from-scratch analysis, use something like this: + +``` +$ cargo run --release -p rust-analyzer -- analysis-stats ../chalk/ +``` + +For measuring time of incremental analysis, use either of these: + +``` +$ cargo run --release -p rust-analyzer -- analysis-bench ../chalk/ --highlight ../chalk/chalk-engine/src/logic.rs +$ cargo run --release -p rust-analyzer -- analysis-bench ../chalk/ --complete ../chalk/chalk-engine/src/logic.rs:94:0 +``` + +Look for `fn benchmark_xxx` tests for a quick way to reproduce performance problems. + +## Release Process + +Release process is handled by `release`, `dist` and `promote` xtasks, `release` being the main one. + +`release` assumes that you have checkouts of `rust-analyzer`, `rust-analyzer.github.io`, and `rust-lang/rust` in the same directory: + +``` +./rust-analyzer +./rust-analyzer.github.io +./rust-rust-analyzer # Note the name! +``` + +The remote for `rust-analyzer` must be called `upstream` (I use `origin` to point to my fork). +In addition, for `xtask promote` (see below), `rust-rust-analyzer` must have a `rust-analyzer` remote pointing to this repository on GitHub. + +`release` calls the GitHub API calls to scrape pull request comments and categorize them in the changelog. +This step uses the `curl` and `jq` applications, which need to be available in `PATH`. +Finally, you need to obtain a GitHub personal access token and set the `GITHUB_TOKEN` environment variable. + +Release steps: + +1. Set the `GITHUB_TOKEN` environment variable. +2. Inside rust-analyzer, run `cargo xtask release`. This will: + * checkout the `release` branch + * reset it to `upstream/nightly` + * push it to `upstream`. This triggers GitHub Actions which: + * runs `cargo xtask dist` to package binaries and VS Code extension + * makes a GitHub release + * publishes the VS Code extension to the marketplace + * call the GitHub API for PR details + * create a new changelog in `rust-analyzer.github.io` +3. While the release is in progress, fill in the changelog +4. Commit & push the changelog +5. Tweet +6. Inside `rust-analyzer`, run `cargo xtask promote` -- this will create a PR to rust-lang/rust updating rust-analyzer's subtree. + Self-approve the PR. + +If the GitHub Actions release fails because of a transient problem like a timeout, you can re-run the job from the Actions console. +If it fails because of something that needs to be fixed, remove the release tag (if needed), fix the problem, then start over. +Make sure to remove the new changelog post created when running `cargo xtask release` a second time. + +We release "nightly" every night automatically and promote the latest nightly to "stable" manually, every week. + +We don't do "patch" releases, unless something truly egregious comes up. +To do a patch release, cherry-pick the fix on top of the current `release` branch and push the branch. +There's no need to write a changelog for a patch release, it's OK to include the notes about the fix into the next weekly one. +Note: we tag releases by dates, releasing a patch release on the same day should work (by overwriting a tag), but I am not 100% sure. + +## Permissions + +There are three sets of people with extra permissions: + +* rust-analyzer GitHub organization [**admins**](https://github.com/orgs/rust-analyzer/people?query=role:owner) (which include current t-compiler leads). + Admins have full access to the org. +* [**review**](https://github.com/orgs/rust-analyzer/teams/review) team in the organization. + Reviewers have `r+` access to all of organization's repositories and publish rights on crates.io. + They also have direct commit access, but all changes should via bors queue. + It's ok to self-approve if you think you know what you are doing! + bors should automatically sync the permissions. + Feel free to request a review or assign any PR to a reviewer with the relevant expertise to bring the work to their attention. + Don't feel pressured to review assigned PRs though. + If you don't feel like reviewing for whatever reason, someone else will pick the review up! +* [**triage**](https://github.com/orgs/rust-analyzer/teams/triage) team in the organization. + This team can label and close issues. + +Note that at the time being you need to be a member of the org yourself to view the links. |