
diff options
| author | Daniel Baumann <daniel.baumann@progress-linux.org> | 2024-05-05 11:19:16 +0000 |
|---|---|---|
| committer | Daniel Baumann <daniel.baumann@progress-linux.org> | 2024-07-24 09:53:24 +0000 |
| commit | b5f8ee61a7f7e9bd291dd26b0585d03eb686c941 (patch) | |
| tree | d4d31289c39fc00da064a825df13a0b98ce95b10 /README.md | |
| parent | Adding upstream version 1.44.3. (diff) | |
| download | netdata-b5f8ee61a7f7e9bd291dd26b0585d03eb686c941.tar.xz netdata-b5f8ee61a7f7e9bd291dd26b0585d03eb686c941.zip | |
Adding upstream version 1.46.3.
Signed-off-by: Daniel Baumann <daniel.baumann@progress-linux.org>
Diffstat (limited to 'README.md')
| -rw-r--r-- | README.md | 220 |
1 files changed, 146 insertions, 74 deletions
@@ -1,3 +1,4 @@ + <p align="center"> <a href="https://www.netdata.cloud#gh-light-mode-only"> <img src="https://www.netdata.cloud/img/readme-images/netdata_readme_logo_light.png" alt="Netdata" width="300"/> @@ -12,16 +13,15 @@ <p align="center"> <a href="https://github.com/netdata/netdata/"><img src="https://img.shields.io/github/stars/netdata/netdata?style=social" alt="GitHub Stars"></a> <br /> - <a href="https://app.netdata.cloud/spaces/netdata-demo?utm_campaign=github_readme_demo_badge"><img src="https://img.shields.io/badge/Live Demo-green" alt="Live Demo"></a> + <a href="https://app.netdata.cloud/spaces/netdata-demo?utm_campaign=github_readme_demo_badge"><img src="https://img.shields.io/badge/Live%20Demo-green" alt="Live Demo"></a> <a href="https://github.com/netdata/netdata/releases/latest"><img src="https://img.shields.io/github/release/netdata/netdata.svg" alt="Latest release"></a> <a href="https://github.com/netdata/netdata-nightlies/releases/latest"><img src="https://img.shields.io/github/release/netdata/netdata-nightlies.svg" alt="Latest nightly build"></a> <br /> <a href="https://bestpractices.coreinfrastructure.org/projects/2231"><img src="https://bestpractices.coreinfrastructure.org/projects/2231/badge" alt="CII Best Practices"></a> <a href="https://scan.coverity.com/projects/netdata-netdata?tab=overview"><img alt="Coverity Scan" src="https://img.shields.io/coverity/scan/netdata"></a> - <a href="https://codeclimate.com/github/netdata/netdata"><img src="https://codeclimate.com/github/netdata/netdata/badges/gpa.svg" alt="Code Climate"></a> <a href="https://www.gnu.org/licenses/gpl-3.0"><img src="https://img.shields.io/badge/License-GPL%20v3%2B-blue.svg" alt="License: GPL v3+"></a> <br /> - <a href="https://discord.com/invite/mPZ6WZKKG2"><img alt="Discord" src="https://img.shields.io/discord/847502280503590932?logo=discord&logoColor=white&label=chat%20on%20discord"></a> + <a href="https://community.netdata.cloud"><img alt="Discourse topics" src="https://img.shields.io/discourse/topics?server=https%3A%2F%2Fcommunity.netdata.cloud%2F&logo=discourse&label=discourse%20forum"></a> <a href="https://github.com/netdata/netdata/discussions"><img alt="GitHub Discussions" src="https://img.shields.io/github/discussions/netdata/netdata?logo=github&label=github%20discussions"></a> </p> @@ -35,42 +35,106 @@ Netdata collects metrics per second and presents them in beautiful low-latency d It scales nicely from just a single server to thousands of servers, even in complex multi/mixed/hybrid cloud environments, and given enough disk space it can keep your metrics for years. -**KEY FEATURES**:<br/> +**WHAT CAN BE MONITORED WITH NETDATA**:<br/> + +Netdata monitors all the following: + +| Component | Linux | FreeBSD | macOS | Windows* | +|------------------------------------------------------------------------------------------------------------:|:--------------------------------:|:-------:|:-----:|:--------------------------------:| +| **System Resources**<small><br/>CPU, Memory and system shared resources</small> | Full | Yes | Yes | Yes | +| **Storage**<small><br/>Disks, Mount points, Filesystems, RAID arrays</small> | Full | Basic | Basic | Basic | +| **Network**<small><br/>Network Interfaces, Protocols, Firewall, etc</small> | Full | Basic | Basic | Basic | +| **Hardware & Sensors**<small><br/>Fans, Temperatures, Controllers, GPUs, etc</small> | Full | Some | Some | Some | +| **O/S Services**<small><br/>Resources, Performance and Status</small> | Yes<small><br/>`systemd`</small> | - | - | Basic | +| **Logs** | Yes<small><br/>`systemd`-journal | - | - | - | +| **Processes**<small><br/>Resources, Performance, OOM, and more</small> | Yes | Yes | Yes | Yes | +| **Network Connections**<small><br/>Live TCP and UDP sockets per PID</small> | Yes | - | - | - | +| **Containers**<small><br/>Docker/containerd, LXC/LXD, Kubernetes, etc</small> | Yes | - | - | - | +| **VMs** (from the host)<small><br/>KVM, qemu, libvirt, Proxmox, etc</small> | Yes<small><br/>`cgroups`</small> | - | - | Yes<small><br/>`Hyper-V`</small> | +| **Synthetic Checks**<small><br/>Test APIs, TCP ports, Ping, Certificates, etc</small> | Yes | Yes | Yes | Yes | +| **Packaged Applications**<small><br/>nginx, apache, postgres, redis, mongodb,<br/>and hundreds more</small> | Yes | Yes | Yes | Yes | +| **Custom Applications**<small><br/>OpenMetrics, StatsD</small> | Yes | Yes | Yes | Yes | + +When Netdata runs on Linux, it monitors every kernel feature available, providing full coverage of all kernel technologies that can be monitored. + +Netdata provides full **enterprise hardware** coverage, monitoring all components that provide hardware error reporting, like PCI AER, RAM EDAC, IPMI, S.M.A.R.T., NVMe, Fans, Power, Voltages, and more. + +<small> * Netdata runs on Linux, FreeBSD and macOS. For Windows, we rely on Windows Exporter (so a Netdata running on Linux, FreeBSD or macOS is required, next to the monitored Windows servers).</small> + +**KEY CHARACTERISTICS**:<br/> -- :boom: **Collects metrics from 800+ integrations**<br/> +- :boom: **Collects data from 800+ integrations**<br/> Operating system metrics, container metrics, virtual machines, hardware sensors, applications metrics, OpenMetrics exporters, StatsD, and logs. - :muscle: **Real-Time, Low-Latency, High-Resolution**<br/> - All metrics are collected per second and are on the dashboard immediately after data collection. Netdata is designed to be fast. + All data are collected per second and are on the dashboard immediately after data collection. - :face_in_clouds: **Unsupervised Anomaly Detection**<br/> - Trains multiple Machine-Learning (ML) models for each metric collected and detects anomalies based on the past behavior of each metric individually. + Trains multiple Machine-Learning (ML) models for each metric and uses AI to detect anomalies based on the past behavior of each metric. - :fire: **Powerful Visualization**<br/> - Clear and precise visualization that allows you to quickly understand any dataset, but also to filter, slice and dice the data directly on the dashboard, without the need to learn any query language. + Fully automated dashboard providing corellated visualization of all metrics, allowing you to understand any dataset at first sight, but also to filter, slice and dice the data directly on the dashboards, without the need to learn a query language. - :bell: **Out of box Alerts**<br/> Comes with hundreds of alerts out of the box to detect common issues and pitfalls, revealing issues that can easily go unnoticed. It supports several notification methods to let you know when your attention is needed. -- 📖 **systemd Journal Logs Explorer**<br/> - Provides a `systemd` journal logs explorer, to view, filter and analyze system and applications logs by directly accessing `systemd` journal files on individual hosts and infrastructure-wide logs centralization servers. - - :sunglasses: **Low Maintenance**<br/> Fully automated in every aspect: automated dashboards, out-of-the-box alerts, auto-detection and auto-discovery of metrics, zero-touch machine-learning, easy scalability and high availability, and CI/CD friendly. - :star: **Open and Extensible**<br/> - Netdata is a modular platform that can be extended in all possible ways and it also integrates nicely with other monitoring solutions. + Netdata is a modular platform that can be extended in all possible ways, and it also integrates nicely with other monitoring solutions. --- -**LATEST BLOG POST**:<br/> +### :boom: NEW: Network Connections Explorer :boom: +Network Connections viewer is currently in the nightly builds of Netdata! + + + +This tool visualizes all the sockets each server has (IPv4 and IPv6, TCP and UDP). It can classify them as `inbound`, `outbound`, `listen` and `local` and allow filtering on them. + +The visualization has 4 sides: + +- `public` (ie. public IPs), +- `private` (i.e. private and reserved IPs), +- `servers` (i.e. listening and inbound sockets), +- `clients` (i.e. sockets towards other servers). + +The position of each application on the chart is determined by the classification of the sockets it has. To the top are clients, to the bottom are servers, to the right are internet facing applications, to the left is internal network applications. + +The size of each application in the chart is determined by the number of sockets it has, and each application is a pie chart representing the percentage of each kind of sockets it has. + +--- + +### :star: Netdata is the most energy-efficient monitoring tool :star: + +<p align="center"> +<a href="https://www.ivanomalavolta.com/files/papers/ICSOC_2023.pdf#gh-dark-mode-only"> + <img src="https://github.com/netdata/netdata/assets/139226121/7118757a-38fb-48d7-b12a-53e709a8e8c0" alt="Energy Efficiency" width="1000"/> +</a> +<a href="https://www.ivanomalavolta.com/files/papers/ICSOC_2023.pdf#gh-light-mode-only"> + <img src="https://github.com/netdata/netdata/assets/139226121/4f64cbb6-05e4-48e3-b7c0-d1b79e37e219" alt="Energy efficiency" width="1000"/> +</a> +</p> + +Dec 11, 2023: [University of Amsterdam published a study](https://twitter.com/IMalavolta/status/1734208439096676680) related to the impact of monitoring tools for Docker based systems, aiming to answer 2 questions: + +1. **What is the impact of monitoring tools on the energy efficiency of Docker-based systems?** +2. **What is the impact of monitoring tools on the performance of Docker-based systems?** + +- 🚀 Netdata excels in energy efficiency: **"... Netdata being the most energy-efficient tool ..."**, as the study says. +- 🚀 Netdata excels in CPU Usage, RAM Usage and Execution Time, and has a similar impact in Network Traffic as Prometheus. + +The study did not normalize the results based on the number of metrics collected. Given that Netdata usually collects significantly more metrics than the other tools, Netdata managed to outperform the other tools, while ingesting a much higher number of metrics. [Read the full study here](https://www.ivanomalavolta.com/files/papers/ICSOC_2023.pdf). + +--- <p align="center"> <a href="https://blog.netdata.cloud/netdata-vs-prometheus-performance-analysis#gh-light-mode-only"> - <img src="https://www.netdata.cloud/img/readme-images/netdata%20vs%20prometheus.png" alt="Netdata" width="500"/> + <img src="https://github.com/netdata/netdata/assets/139226121/6c21ae39-8656-45c3-bc85-4b012679d2bb" alt="Netdata" width="1000"/> </a> <a href="https://blog.netdata.cloud/netdata-vs-prometheus-performance-analysis#gh-dark-mode-only"> - <img src="https://www.netdata.cloud/img/readme-images/netdata%20vs%20prometheus%20dark.png" alt="Netdata" width="500"/> + <img src="https://github.com/netdata/netdata/assets/139226121/f2dbde46-d3dd-4807-bd34-966da4d0ec22" alt="Netdata" width="1000"/> </a> </p> @@ -80,7 +144,7 @@ On the same workload, Netdata uses **35% less CPU**, **49% less RAM**, **12% les NEW: **Netdata and LOGS !** 🥳</br> -Check the [systemd-journal plugin of Netdata](https://github.com/netdata/netdata/tree/master/collectors/systemd-journal.plugin), that allows you to view, explore, analyze and query `systemd` journal logs! +Check the [systemd-journal plugin of Netdata](https://github.com/netdata/netdata/tree/master/src/collectors/systemd-journal.plugin), that allows you to view, explore, analyze and query `systemd` journal logs! 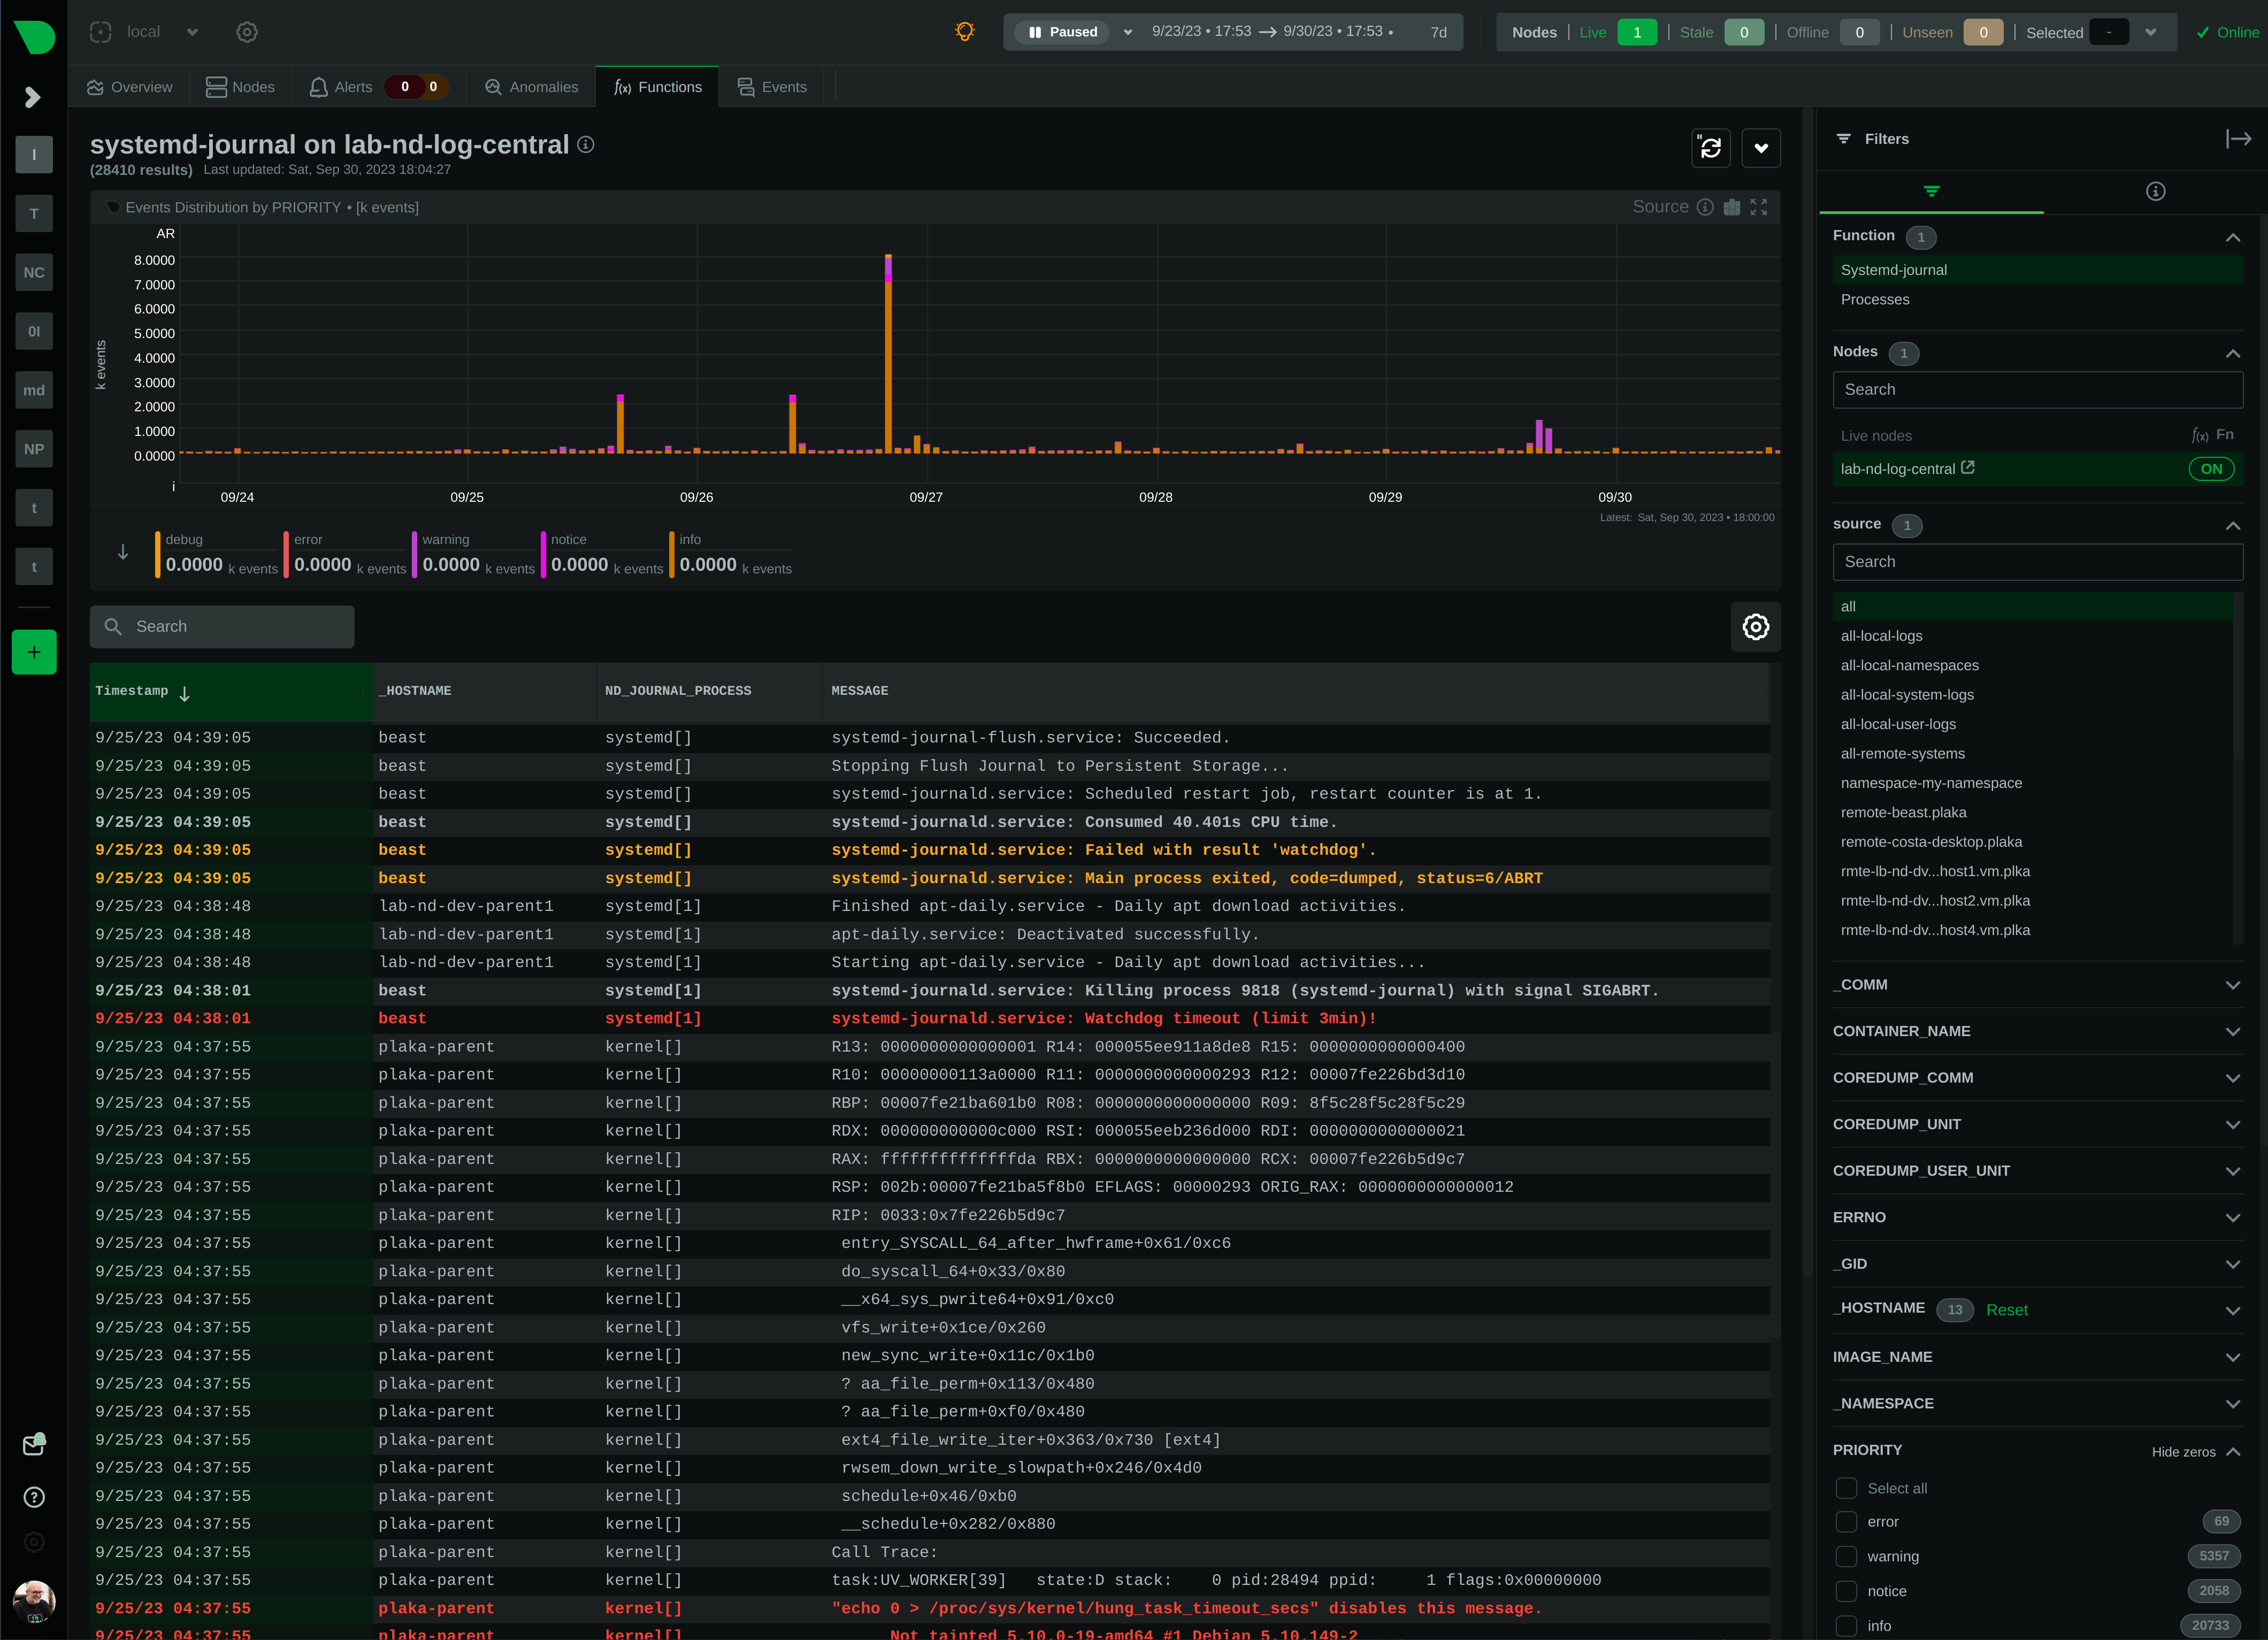 @@ -93,7 +157,7 @@ Check the [systemd-journal plugin of Netdata](https://github.com/netdata/netdata <br /> Netdata actively supports and is a member of the Cloud Native Computing Foundation (CNCF)<br /> <br/> - ...and due to your love :heart: and :star:, <b>Netdata is leading the Observability category</b> at the <a href="https://landscape.cncf.io/card-mode?category=observability-and-analysis&grouping=no&sort=stars">CNCF landscape</a>! + ...and due to your love :heart:, it is one of the most :star:'d projects in the <a href="https://landscape.cncf.io/?item=observability-and-analysis--observability--netdata">CNCF landscape</a>! </p> <br/> @@ -128,37 +192,45 @@ Check the [systemd-journal plugin of Netdata](https://github.com/netdata/netdata <details><summary>Click to see our immediate development plans and a summary view of the last 12 months' releases...</summary> <br/> -| What | Description | When | Status | -|:-----------------------------:|:---------------------------------------------------------------------------------------------------:|:------------:|:-------------------------------------------------------------------------------------------------------:| -| WebRTC | Browser to Agent communication via WebRTC. | later | POC | -| Advanced Troubleshooting | Expanded view of dashboard charts integrating Metrics Correlations, Anomaly Advisor, and many more. | later | interrupted | -| Easy Custom<br/>Dashboards | Drag and drop charts to create custom dashboards on the fly, while troubleshooting! | soon | planned | -| More Customizability | Set default settings for all charts and views! | soon | planned | -| UCUM Units | Migrate all metrics to the Unified Code for Units of Measure. | soon | in progress | -| Click to Activate | Configure Alerts and Data Collectors from the UI! | soon | in progress | -| **Netdata Cloud<br/>On-Prem** | **Netdata Cloud available for On-Prem installation!** | **available** | [fill this form](https://www.netdata.cloud/contact-us/?subject=on-prem) | -| `systemd` journal | View the `systemd` journal logs of your systems on the dashboard. | Oct<br/>2023 | [v1.43](https://github.com/netdata/netdata/releases/tag/v1.43.0) | -| Integrations | Netdata Integrations Marketplace! | Aug<br/>2023 | [v1.42](https://github.com/netdata/netdata/releases#v1420-integrations-marketplace) | -| New Agent UI | Now Netdata Cloud and Netdata Agent share the same dashboard! | Jul<br/>2023 | [v1.41](https://github.com/netdata/netdata/releases/tag/v1.41.0#v1410-one-dashboard) | -| Summary Dashboards | High level tiles everywhere! | Jun<br/>2023 | [v1.40](https://github.com/netdata/netdata/releases/tag/v1.40.0#v1400-visualization-summary-dashboards) | -| Machine Learning | Multiple ML models per metric. | Jun<br/>2023 | [v1.40](https://github.com/netdata/netdata/releases/tag/v1.40.0#v1400-ml-extended-training) | -| SSL | Netdata Agent gets a new SSL layer. | Jun<br/>2023 | [v1.40](https://github.com/netdata/netdata/releases/tag/v1.40.0#v1400-streaming) | -| New Cloud UI | Filter, slice and dice any dataset from the UI! ML-first! | May<br/>2023 | [v1.39](https://github.com/netdata/netdata/releases/tag/v1.39.0) | -| Microsoft Windows | Monitor Windows hosts and apps! | May<br/>2023 | [v1.39](https://github.com/netdata/netdata/releases/tag/v1.39.0#v1390-windows-support) | -| Virtual Nodes | Go collectors can now be assigned to virtual nodes! | May<br/>2023 | [v1.39](https://github.com/netdata/netdata/releases/tag/v1.39.0#v1390-virtual-nodes-and-custom-labels) | -| DBENGINE v2 | Faster, more reliable, far more scalable! | Feb<br/>2023 | [v1.38](https://github.com/netdata/netdata/releases/tag/v1.38.0) | -| Netdata Functions | Netdata beyond metrics! Monitoring anything! | Feb<br/>2023 | [v1.38](https://github.com/netdata/netdata/releases/tag/v1.38.0#v1380-functions) | -| Events Feed | Live feed of events about topology changes and alerts. | Feb<br/>2023 | [v1.38](https://github.com/netdata/netdata/releases/tag/v1.38.0#v1380-feed) | -| Role Based<br/>Access Control | More roles, offering finer control over access to infrastructure. | Feb<br/>2023 | [v1.38](https://github.com/netdata/netdata/releases/tag/v1.38.0#v1380-rbac) | -| Infinite Scalability | Streaming compression. Replication. Active-active clustering. | Nov<br/>2022 | [v1.37](https://github.com/netdata/netdata/releases/tag/v1.37.0) | -| Grafana Plugin | Netdata Cloud as a data source for Grafana. | Nov<br/>2022 | [v1.37](https://github.com/netdata/netdata/releases/tag/v1.37.0#v1370-grafana-plugin) | -| PostgreSQL | Completely rewritten, to reveal all the info, even at the table level. | Nov<br/>2022 | [v1.37](https://github.com/netdata/netdata/releases/tag/v1.37.0#v1370-postgressql) | -| Metrics Correlations | Advanced algorithms to find the needle in the haystack. | Aug<br/>2022 | [v1.36](https://github.com/netdata/netdata/releases/tag/v1.36.0) | -| Database Tiering | Netdata gets unlimited retention! | Aug<br/>2022 | [v1.36](https://github.com/netdata/netdata/releases/tag/v1.36.0#v1360-tiering) | -| Kubernetes | Monitor your Kubernetes workloads. | Aug<br/>2022 | [v1.36](https://github.com/netdata/netdata/releases/tag/v1.36.0#v1360-kubernetes) | -| Machine Learning | Anomaly Rate information on every chart. | Aug<br/>2022 | [v1.36](https://github.com/netdata/netdata/releases/tag/v1.36.0#v1360-anomaly-rate-on-charts) | -| Machine Learning | Anomaly Advisor! Bottom-up unsupervised anomaly detection. | Jun<br/>2022 | [v1.35](https://github.com/netdata/netdata/releases/tag/v1.35.0#v1350-anomaly-advisor-ml) | -| Machine Learning | Metrics Correlation on the Agent. | Jun<br/>2022 | [v1.35](https://github.com/netdata/netdata/releases/tag/v1.35.0#v1350-metric-correlation-agent) | +| What | Description | When | Status | +|:---------------------------------------:|:---------------------------------------------------------------------------------------------------:|:-------------:|:-----------------------------------------------------------------------------------------------------------------------:| +| **Netdata Cloud<br/>On-Prem** | **Netdata Cloud available for On-Prem installation!** | **available** | [fill this form](https://www.netdata.cloud/contact-us/?subject=on-prem) | +| State manager monitor | Centralized and immediate visibility to the state of your apps and services. | soon | planned | +| More Customizable | Set default settings for all charts and views! | soon | in progress | +| AWS Integrated billing | Run Netdata our your AWS instances and get your billing integrated on your AWS account. | soon | in progress | +| Alert Silence Manager R2 | Improvements to the Alert Silencing Manager with recurring schedules and more! | soon | in progress | +| Okta SSO | Facilitate the integration of Netdata into your organizations user management process. | soon | in progress | +| Prometheus/OpenMetrics<br/>improvements | Allow users to configure how metrics should be ingested and presented. | soon | in progress | +| Loki logs | Another Logs integration, bring your Loki logs onto the UI! | soon | in progress | +| UCUM Units | Migrate all metrics to the Unified Code for Units of Measure. | soon | in progress | +| Dynamic Configurations | Configure Alerts and Data Collectors from the UI! | soon | Beta release [v1.45](https://github.com/netdata/netdata/releases/tag/v1.45.0#v1450-dynamic-configuration) - in progress | +| WebRTC | Browser to Agent communication via WebRTC. | later | interrupted | +| Advanced Troubleshooting | Expanded view of dashboard charts integrating Metrics Correlations, Anomaly Advisor, and many more. | later | interrupted | +| Homelab plan | Unlimited Netdata plan targeted for homelabbers or students. | Feb<br/>2024 | [v1.45](https://github.com/netdata/netdata/releases/tag/v1.45.0#v1450-homelab-plan) | +| Easy Custom<br/>Dashboards | Drag and drop charts to create custom dashboards on the fly, while troubleshooting! | Feb<br/>2024 | [v1.45](https://github.com/netdata/netdata/releases/tag/v1.45.0#v1450-custom-dashboards) | +| Netdata Notifications<br/>Mobile App | You can receive and manage alert and reachability notifications from your subscribed spaces. | Jan<br/>2024 | [v1.45](https://github.com/netdata/netdata/releases/tag/v1.45.0#v1450-mobile-app) | +| `systemd` journal | View the `systemd` journal logs of your systems on the dashboard. | Oct<br/>2023 | [v1.43](https://github.com/netdata/netdata/releases/tag/v1.43.0) | +| Integrations | Netdata Integrations Marketplace! | Aug<br/>2023 | [v1.42](https://github.com/netdata/netdata/releases#v1420-integrations-marketplace) | +| New Agent UI | Now Netdata Cloud and Netdata Agent share the same dashboard! | Jul<br/>2023 | [v1.41](https://github.com/netdata/netdata/releases/tag/v1.41.0#v1410-one-dashboard) | +| Summary Dashboards | High level tiles everywhere! | Jun<br/>2023 | [v1.40](https://github.com/netdata/netdata/releases/tag/v1.40.0#v1400-visualization-summary-dashboards) | +| Machine Learning | Multiple ML models per metric. | Jun<br/>2023 | [v1.40](https://github.com/netdata/netdata/releases/tag/v1.40.0#v1400-ml-extended-training) | +| SSL | Netdata Agent gets a new SSL layer. | Jun<br/>2023 | [v1.40](https://github.com/netdata/netdata/releases/tag/v1.40.0#v1400-streaming) | +| New Cloud UI | Filter, slice and dice any dataset from the UI! ML-first! | May<br/>2023 | [v1.39](https://github.com/netdata/netdata/releases/tag/v1.39.0) | +| Microsoft Windows | Monitor Windows hosts and apps! | May<br/>2023 | [v1.39](https://github.com/netdata/netdata/releases/tag/v1.39.0#v1390-windows-support) | +| Virtual Nodes | Go collectors can now be assigned to virtual nodes! | May<br/>2023 | [v1.39](https://github.com/netdata/netdata/releases/tag/v1.39.0#v1390-virtual-nodes-and-custom-labels) | +| DBENGINE v2 | Faster, more reliable, far more scalable! | Feb<br/>2023 | [v1.38](https://github.com/netdata/netdata/releases/tag/v1.38.0) | +| Netdata Functions | Netdata beyond metrics! Monitoring anything! | Feb<br/>2023 | [v1.38](https://github.com/netdata/netdata/releases/tag/v1.38.0#v1380-functions) | +| Events Feed | Live feed of events about topology changes and alerts. | Feb<br/>2023 | [v1.38](https://github.com/netdata/netdata/releases/tag/v1.38.0#v1380-feed) | +| Role Based<br/>Access Control | More roles, offering finer control over access to infrastructure. | Feb<br/>2023 | [v1.38](https://github.com/netdata/netdata/releases/tag/v1.38.0#v1380-rbac) | +| Infinite Scalability | Streaming compression. Replication. Active-active clustering. | Nov<br/>2022 | [v1.37](https://github.com/netdata/netdata/releases/tag/v1.37.0) | +| Grafana Plugin | Netdata Cloud as a data source for Grafana. | Nov<br/>2022 | [v1.37](https://github.com/netdata/netdata/releases/tag/v1.37.0#v1370-grafana-plugin) | +| PostgreSQL | Completely rewritten, to reveal all the info, even at the table level. | Nov<br/>2022 | [v1.37](https://github.com/netdata/netdata/releases/tag/v1.37.0#v1370-postgressql) | +| Metrics Correlations | Advanced algorithms to find the needle in the haystack. | Aug<br/>2022 | [v1.36](https://github.com/netdata/netdata/releases/tag/v1.36.0) | +| Database Tiering | Netdata gets unlimited retention! | Aug<br/>2022 | [v1.36](https://github.com/netdata/netdata/releases/tag/v1.36.0#v1360-tiering) | +| Kubernetes | Monitor your Kubernetes workloads. | Aug<br/>2022 | [v1.36](https://github.com/netdata/netdata/releases/tag/v1.36.0#v1360-kubernetes) | +| Machine Learning | Anomaly Rate information on every chart. | Aug<br/>2022 | [v1.36](https://github.com/netdata/netdata/releases/tag/v1.36.0#v1360-anomaly-rate-on-charts) | +| Machine Learning | Anomaly Advisor! Bottom-up unsupervised anomaly detection. | Jun<br/>2022 | [v1.35](https://github.com/netdata/netdata/releases/tag/v1.35.0#v1350-anomaly-advisor-ml) | +| Machine Learning | Metrics Correlation on the Agent. | Jun<br/>2022 | [v1.35](https://github.com/netdata/netdata/releases/tag/v1.35.0#v1350-metric-correlation-agent) | </details> @@ -183,14 +255,14 @@ Check the [systemd-journal plugin of Netdata](https://github.com/netdata/netdata Netdata can be installed on all Linux, macOS, and FreeBSD systems. We provide binary packages for the most popular operating systems and package managers. - Install on [Ubuntu, Debian CentOS, Fedora, Suse, Red Hat, Arch, Alpine, Gentoo, even BusyBox](https://learn.netdata.cloud/docs/installing/one-line-installer-for-all-linux-systems). - - Install with [Docker](https://learn.netdata.cloud/docs/installing/docker).<br/> + - Install with [Docker](/packaging/docker/README.md).<br/> Netdata is a [Verified Publisher on DockerHub](https://hub.docker.com/r/netdata/netdata) and our users enjoy free unlimited DockerHub pulls :heart_eyes:. - - Install on [MacOS](https://learn.netdata.cloud/docs/installing/macos) :metal:. + - Install on [macOS](https://learn.netdata.cloud/docs/installing/macos) :metal:. - Install on [FreeBSD](https://learn.netdata.cloud/docs/installing/freebsd) and [pfSense](https://learn.netdata.cloud/docs/installing/pfsense). - Install [from source](https://learn.netdata.cloud/docs/installing/build-the-netdata-agent-yourself/compile-from-source-code)  - For Kubernetes deployments [check here](https://learn.netdata.cloud/docs/installation/install-on-specific-environments/kubernetes/). - Check also the [Netdata Deployment Strategies](https://learn.netdata.cloud/docs/architecture/deployment-strategies) to decide how to deploy it in your infrastructure. + Check also the [Netdata Deployment Guides](https://learn.netdata.cloud/docs/deployment-guides/) to decide how to deploy it in your infrastructure. By default, you will have immediately available a local dashboard. Netdata starts a web server for its dashboard at port `19999`. Open up your web browser of choice and navigate to `http://NODE:19999`, replacing `NODE` with the IP address or hostname of your Agent. If installed on localhost, you can access it through `http://localhost:19999`. @@ -246,7 +318,7 @@ navigate to `http://NODE:19999`, replacing `NODE` with the IP address or hostnam - Access your Netdata agents from anywhere - Access sensitive Netdata agent features (like "Netdata Functions": processes, systemd-journal) - - Organize your infra in spaces and rooms + - Organize your infra in spaces and Rooms - Create, manage, and share **custom dashboards** - Invite your team and assign roles to them (Role Based Access Control - RBAC) - Get infinite horizontal scalability (multiple independent Netdata Agents are viewed as one infra) @@ -274,7 +346,7 @@ Netdata is built around a **modular metrics processing pipeline**. Each Netdata Agent can perform the following functions: 1. **`COLLECT` metrics from their sources**<br/> - Uses [internal](https://github.com/netdata/netdata/tree/master/collectors) and [external](https://github.com/netdata/go.d.plugin/tree/master/modules) plugins to collect data from their sources. + Uses [internal](https://github.com/netdata/netdata/tree/master/src/collectors) and [external](https://github.com/netdata/go.d.plugin/tree/master/modules) plugins to collect data from their sources. Netdata auto-detects and collects almost everything from the operating system: including CPU, Interrupts, Memory, Disks, Mount Points, Filesystems, Network Stack, Network Interfaces, Containers, VMs, Processes, `systemd` units, Linux Performance Metrics, Linux eBPF, Hardware Sensors, IPMI, and more. @@ -287,7 +359,7 @@ Each Netdata Agent can perform the following functions: And it also supports synthetic tests / white box tests, so you can ping servers, check API responses, or even check filesystem files and directories to generate metrics, train ML and run alerts and notifications on their status. 2. **`STORE` metrics to a database**<br/> - Uses database engine plugins to store the collected data, either in memory and/or on disk. We have developed our own [`dbengine`](https://github.com/netdata/netdata/tree/master/database/engine#readme) for storing the data in a very efficient manner, allowing Netdata to have less than 1 byte per sample on disk and amazingly fast queries. + Uses database engine plugins to store the collected data, either in memory and/or on disk. We have developed our own [`dbengine`](https://github.com/netdata/netdata/tree/master/src/database/engine#readme) for storing the data in a very efficient manner, allowing Netdata to have less than 1 byte per sample on disk and amazingly fast queries. 3. **`LEARN` the behavior of metrics** (ML)<br/> Trains multiple Machine-Learning (ML) models per metric to learn the behavior of each metric individually. Netdata uses the `kmeans` algorithm and creates by default a model per metric per hour, based on the values collected for that metric over the last 6 hours. The trained models are persisted to disk. @@ -315,28 +387,28 @@ When using Netdata Parents, all the functions of a Netdata Agent (except data co The core of Netdata is developed in C. We have our own `libnetdata`, that provides: - **`DICTIONARY`**<br/> - A high-performance algorithm to maintain both indexed and ordered pools of structures Netdata needs. It uses JudyHS arrays for indexing, although it is modular: any hashtable or tree can be integrated into it. Despite being in C, dictionaries follow object-oriented programming principles, so there are constructors, destructors, automatic memory management, garbage collection, and more. For more see [here](https://github.com/netdata/netdata/tree/master/libnetdata/dictionary). + A high-performance algorithm to maintain both indexed and ordered pools of structures Netdata needs. It uses JudyHS arrays for indexing, although it is modular: any hashtable or tree can be integrated into it. Despite being in C, dictionaries follow object-oriented programming principles, so there are constructors, destructors, automatic memory management, garbage collection, and more. For more see [here](https://github.com/netdata/netdata/tree/master/src/libnetdata/dictionary). - **`ARAL`**<br/> - ARray ALlocator (ARAL) is used to minimize the system allocations made by Netdata. ARAL is optimized for peak performance when multi-threaded. It also allows all structures that use it to be allocated in memory-mapped files (shared memory) instead of RAM. For more see [here](https://github.com/netdata/netdata/tree/master/libnetdata/aral). + ARray ALlocator (ARAL) is used to minimize the system allocations made by Netdata. ARAL is optimized for maximum multithreaded performance. It also allows all structures that use it to be allocated in memory-mapped files (shared memory) instead of RAM. For more see [here](https://github.com/netdata/netdata/tree/master/src/libnetdata/aral). - **`PROCFILE`**<br/> - A high-performance `/proc` (but also any) file parser and text tokenizer. It achieves its performance by keeping files open and adjustings its buffers to read the entire file in one call (which is also required by the Linux kernel). For more see [here](https://github.com/netdata/netdata/tree/master/libnetdata/procfile). + A high-performance `/proc` (but also any) file parser and text tokenizer. It achieves its performance by keeping files open and adjusting its buffers to read the entire file in one call (which is also required by the Linux kernel). For more see [here](https://github.com/netdata/netdata/tree/master/src/libnetdata/procfile). - **`STRING`**<br/> - A string internet mechanism, for string deduplication and indexing (using JudyHS arrays), optimized for multi-threaded usage. For more see [here](https://github.com/netdata/netdata/tree/master/libnetdata/string). + A string internet mechanism, for string deduplication and indexing (using JudyHS arrays), optimized for multithreaded usage. For more see [here](https://github.com/netdata/netdata/tree/master/src/libnetdata/string). - **`ARL`**<br/> - Adaptive Resortable List (ARL), is a very fast list iterator, that keeps the expected items on the list in the same order they are found in input list. So, the first iteration is somewhat slower, but all the following iterations are perfectly aligned for best performance. For more see [here](https://github.com/netdata/netdata/tree/master/libnetdata/adaptive_resortable_list). + Adaptive Resortable List (ARL), is a very fast list iterator, that keeps the expected items on the list in the same order they are found in input list. So, the first iteration is somewhat slower, but all the following iterations are perfectly aligned for best performance. For more see [here](https://github.com/netdata/netdata/tree/master/src/libnetdata/adaptive_resortable_list). - **`BUFFER`**<br/> - A flexible text buffer management system that allows Netdata to automatically handle dynamically sized text buffer allocations. The same mechanism is used for generating consistent JSON output by the Netdata APIs. For more see [here](https://github.com/netdata/netdata/tree/master/libnetdata/buffer). + A flexible text buffer management system that allows Netdata to automatically handle dynamically sized text buffer allocations. The same mechanism is used for generating consistent JSON output by the Netdata APIs. For more see [here](https://github.com/netdata/netdata/tree/master/src/libnetdata/buffer). - **`SPINLOCK`**<br/> Like POSIX `MUTEX` and `RWLOCK` but a lot faster, based on atomic operations, with significantly smaller memory impact, while being portable. - **`PGC`**<br/> - A caching layer that can be used to cache any kind of time-related data, with automatic indexing (based on a tree of JudyL arrays), memory management, evictions, flushing, pressure management. This is extensively used in `dbengine`. For more see [here](https://github.com/netdata/netdata/blob/master/database/engine/README.md). + A caching layer that can be used to cache any kind of time-related data, with automatic indexing (based on a tree of JudyL arrays), memory management, evictions, flushing, pressure management. This is extensively used in `dbengine`. For more see [here](/src/database/engine/README.md). The above, and many more, allow Netdata developers to work on the application fast and with confidence. Most of the business logic in Netdata is a work of mixing the above. @@ -348,7 +420,7 @@ Netdata data collection plugins can be developed in any language. Most of our ap ### :shield: Is Netdata secure? -Of course it is! We do our best to ensure it is! +Of course, it is! We do our best to ensure it is! <details><summary>Click to see detailed answer ...</summary> <br/> <br/> @@ -356,7 +428,7 @@ Of course it is! We do our best to ensure it is! We understand that Netdata is a software piece that is installed on millions of production systems across the world. So, it is important for us, Netdata to be as secure as possible: - We follow the [Open Source Security Foundation](https://bestpractices.coreinfrastructure.org/en/projects/2231) best practices. - - We have given great attention to detail when it comes to security design. Check out our [security design](https://learn.netdata.cloud/docs/architecture/security-and-privacy-design). + - We have given great attention to detail when it comes to security design. Check out our [security design](/docs/security-and-privacy-design/README.md). - Netdata is a popular open-source project and is frequently tested by many security analysts. - Check also our [security policies and advisories published so far](https://github.com/netdata/netdata/security). @@ -457,7 +529,7 @@ Using the above, the Netdata Agent on your production system will not use a disk Netdata is a "ready to use" monitoring solution. Prometheus and Grafana are tools to build your own monitoring solution. -Netdata is also a lot faster, requires singificantly less resources and puts almost no stress on the server it runs. For a performance comparison check [this blog](https://blog.netdata.cloud/netdata-vs-prometheus-performance-analysis/). +Netdata is also a lot faster, requires significantly less resources and puts almost no stress on the server it runs. For a performance comparison check [this blog](https://blog.netdata.cloud/netdata-vs-prometheus-performance-analysis/). <details><summary>Click to see detailed answer ...</summary> <br/> <br/> @@ -474,7 +546,7 @@ So, the biggest difference of Netdata to Prometheus, and Grafana, is that we dec Maintaining such an index is a challenge: first, because the raw metrics collected do not provide this information, so we have to add it, and second because we need to maintain this index for the lifetime of each metric, which with our current database retention, it is usually more than a year. - At the same time, Netdata provides better retention than Prometheus due to database tiering, scales easier than Prometheus due to streaming, supports anomaly detection and it has a mertrics scoring engine to find the needle in the haystack when needed. + At the same time, Netdata provides better retention than Prometheus due to database tiering, scales easier than Prometheus due to streaming, supports anomaly detection and it has a metrics scoring engine to find the needle in the haystack when needed. - When compared to Grafana, Netdata is fully automated. Grafana has more customization capabilities than Netdata, but Netdata presents fully functional dashboards by itself and most importantly it gives you the means to understand, analyze, filter, slice and dice the data without the need for you to edit queries or be aware of any peculiarities the underlying metrics may have. @@ -511,7 +583,7 @@ The distributed nature of Netdata helps scale this approach: your data is spread <br/> <br/> </details> -### :raised_eyebrow: How is Netdata different from Nagios, Icinga, Zabbix, etc? +### :raised_eyebrow: How is Netdata different from Nagios, Icinga, Zabbix, etc.? Netdata offers real-time, comprehensive monitoring, with a user-friendly interface and the ability to monitor everything, without any custom configuration required. @@ -581,7 +653,7 @@ The Netdata Agent dashboard and the Netdata Cloud dashboard are the same. Still, 1. Access your infrastructure from anywhere. 2. Have SSO to protect sensitive features. - 3. Customizability (custom dashboards and other settings are persisted when you are signed in to Netdata Cloud) + 3. Customizable (custom dashboards and other settings are persisted when you are signed in to Netdata Cloud) 4. Configuration of Alerts and Data Collection from the UI (coming soon) 5. Security (role-based access control - RBAC). 6. Horizontal Scalability ("blend" multiple independent parents in one uniform infrastructure) @@ -673,7 +745,7 @@ The Netdata Agent is shipped with multiple UI versions: - `http://agent.ip:19999/v0/`, the original open-source single-node UI, GPLv3+. - `http://agent.ip:19999/v1/`, the latest open-source single-node UI, GPLv3+. -- `http://agent.ip:19999/v2/`, a snapshot of the latest Netdata Cloud UI as it was at the time the agent was released, licensed to be distributed with Netdata Agents under [NCUL1](https://github.com/netdata/netdata/blob/master/web/gui/v2/LICENSE.md). +- `http://agent.ip:19999/v2/`, a snapshot of the latest Netdata Cloud UI as it was at the time the agent was released, licensed to be distributed with Netdata Agents under [NCUL1](/src/web/gui/v2/LICENSE.md). When you access a Netdata Agent via `http://agent.ip:19999/` a splash screen attempts to use the latest live version of Netdata Cloud UI (downloaded from Cloudflare). This only happens when the web browser has internet connectivity and Netdata Cloud is not disabled at the agent configuration. Otherwise, it falls back to `http://agent.ip:19999/v2/`. @@ -710,7 +782,7 @@ Our Open-Source Community and the free access to Netdata Cloud, contribute to Ne We don't monetize, directly or indirectly, users' or "device heuristics" data. Any data collected from community members are exclusively used for the purposes stated above. -Netdata grows financially when tehnnology intensive organizations and operators, need - due to regulatory or business requirements - the entire Netdata suite (including Netdata Cloud) on-prem or private, bundled with top-tier support. It is a win-win case for all parties involved: these companies get a battle tested, robust and reliable solution, while the broader community that helps us build this product, enjoys it at no cost. +Netdata grows financially when technology intensive organizations and operators, need - due to regulatory or business requirements - the entire Netdata suite (including Netdata Cloud) on-prem or private, bundled with top-tier support. It is a win-win case for all parties involved: these companies get a battle tested, robust and reliable solution, while the broader community that helps us build this product, enjoys it at no cost. <br/> <br/> </details> @@ -725,7 +797,7 @@ to collect metrics, troubleshoot via charts, export to external databases, and m ## :tada: Community <p align="center"> - <a href="https://discord.com/invite/mPZ6WZKKG2"><img alt="Discord" src="https://img.shields.io/discord/847502280503590932?logo=discord&logoColor=white&label=chat%20on%20discord"></a> + <a href="https://discord.com/invite/2mEmfW735j"><img alt="Discord" src="https://img.shields.io/discord/847502280503590932?logo=discord&logoColor=white&label=chat%20on%20discord"></a> <a href="https://community.netdata.cloud"><img alt="Discourse topics" src="https://img.shields.io/discourse/topics?server=https%3A%2F%2Fcommunity.netdata.cloud%2F&logo=discourse&label=discourse%20forum"></a> <a href="https://github.com/netdata/netdata/discussions"><img alt="GitHub Discussions" src="https://img.shields.io/github/discussions/netdata/netdata?logo=github&label=github%20discussions"></a> </p> @@ -734,7 +806,7 @@ Netdata is an inclusive open-source project and community. Please read our [Code Join the Netdata community: -- Chat with us and other community members on [Discord](https://discord.com/invite/mPZ6WZKKG2). +- Chat with us and other community members on [Discord](https://discord.com/invite/2mEmfW735j). - Start a discussion on [GitHub discussions](https://github.com/netdata/netdata/discussions). - Open a topic to our [community forums](https://community.netdata.cloud). @@ -772,12 +844,12 @@ General information about contributions: - Found a bug? Open a [GitHub issue](https://github.com/netdata/netdata/issues/new?assignees=&labels=bug%2Cneeds+triage&template=BUG_REPORT.yml&title=%5BBug%5D%3A+). - Read our [Contributing Guide](https://github.com/netdata/.github/blob/main/CONTRIBUTING.md), which contains all the information you need to contribute to Netdata, such as improving our documentation, engaging in the community, and developing new features. We've made it as frictionless as possible, but if you need help, just ping us on our community forums! -Package maintainers should read the guide on [building Netdata from source](https://github.com/netdata/netdata/blob/master/packaging/installer/methods/source.md) for +Package maintainers should read the guide on [building Netdata from source](/packaging/installer/methods/source.md) for instructions on building each Netdata component from the source and preparing a package. ## License Netdata is released under [GPLv3+](https://github.com/netdata/netdata/blob/master/LICENSE). Netdata re-distributes other open-source tools and libraries. Please check the -[third party licenses](https://github.com/netdata/netdata/blob/master/REDISTRIBUTED.md). +[third party licenses](/REDISTRIBUTED.md). -The Latest Netdata UI, is distributed under [NCUL1](https://github.com/netdata/netdata/blob/master/web/gui/v2/LICENSE.md). It also uses third party open source components. Check the [UI third party licenses](https://github.com/netdata/netdata/blob/master/web/gui/v2/3D_PARTY_LICENSES.txt) +The Latest Netdata UI, is distributed under [NCUL1](/src/web/gui/v2/LICENSE.md). It also uses third party open source components. Check the [UI third party licenses](https://github.com/netdata/netdata/blob/master/src/web/gui/v2/3D_PARTY_LICENSES.txt) |