
diff options
| author | Daniel Baumann <daniel.baumann@progress-linux.org> | 2023-10-17 09:30:20 +0000 |
|---|---|---|
| committer | Daniel Baumann <daniel.baumann@progress-linux.org> | 2023-10-17 09:30:20 +0000 |
| commit | 386ccdd61e8256c8b21ee27ee2fc12438fc5ca98 (patch) | |
| tree | c9fbcacdb01f029f46133a5ba7ecd610c2bcb041 /collectors/systemd-journal.plugin/README.md | |
| parent | Adding upstream version 1.42.4. (diff) | |
| download | netdata-386ccdd61e8256c8b21ee27ee2fc12438fc5ca98.tar.xz netdata-386ccdd61e8256c8b21ee27ee2fc12438fc5ca98.zip | |
Adding upstream version 1.43.0.upstream/1.43.0
Signed-off-by: Daniel Baumann <daniel.baumann@progress-linux.org>
Diffstat (limited to 'collectors/systemd-journal.plugin/README.md')
| -rw-r--r-- | collectors/systemd-journal.plugin/README.md | 673 |
1 files changed, 673 insertions, 0 deletions
diff --git a/collectors/systemd-journal.plugin/README.md b/collectors/systemd-journal.plugin/README.md index e69de29bb..51aa1b7cd 100644 --- a/collectors/systemd-journal.plugin/README.md +++ b/collectors/systemd-journal.plugin/README.md @@ -0,0 +1,673 @@ + +# `systemd` journal plugin + +[KEY FEATURES](#key-features) | [JOURNAL SOURCES](#journal-sources) | [JOURNAL FIELDS](#journal-fields) | +[PLAY MODE](#play-mode) | [FULL TEXT SEARCH](#full-text-search) | [PERFORMANCE](#query-performance) | +[CONFIGURATION](#configuration-and-maintenance) | [FAQ](#faq) + +The `systemd` journal plugin by Netdata makes viewing, exploring and analyzing `systemd` journal logs simple and +efficient. +It automatically discovers available journal sources, allows advanced filtering, offers interactive visual +representations and supports exploring the logs of both individual servers and the logs on infrastructure wide +journal centralization servers. + +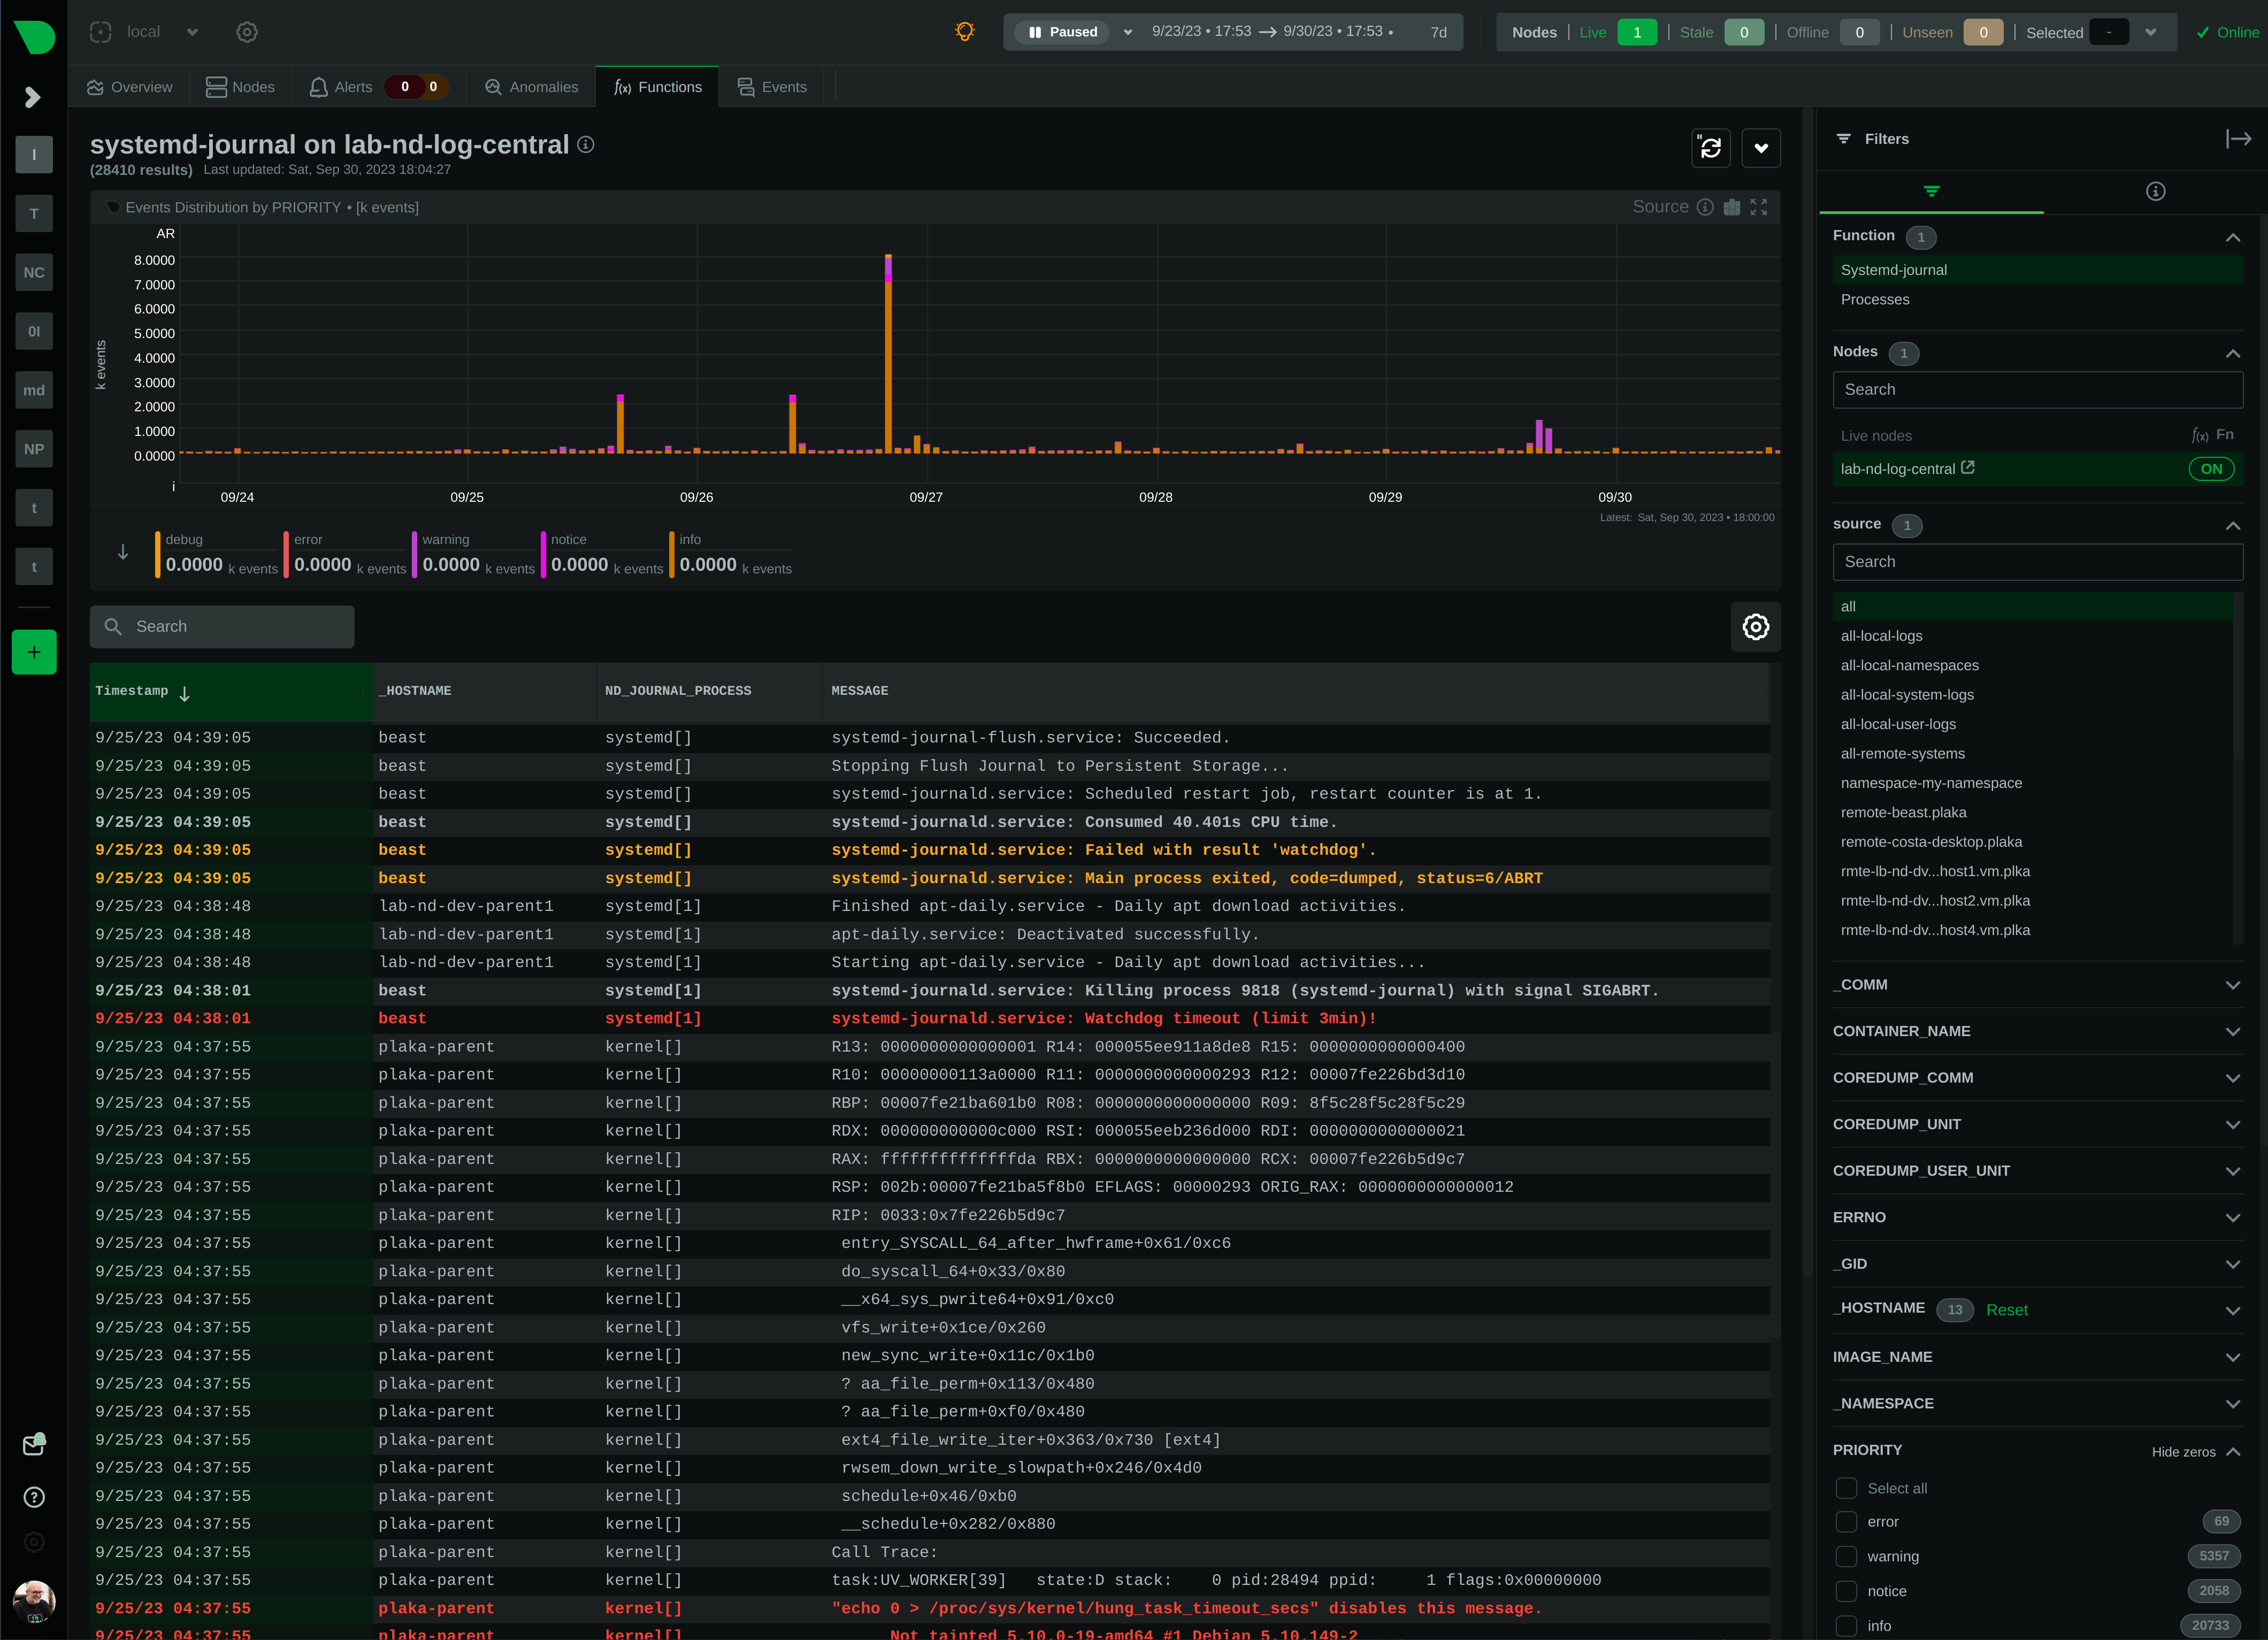 + +## Key features + +- Works on both **individual servers** and **journal centralization servers**. +- Supports `persistent` and `volatile` journals. +- Supports `system`, `user`, `namespaces` and `remote` journals. +- Allows filtering on **any journal field** or **field value**, for any time-frame. +- Allows **full text search** (`grep`) on all journal fields, for any time-frame. +- Provides a **histogram** for log entries over time, with a break down per field-value, for any field and any + time-frame. +- Works directly on journal files, without any other third-party components. +- Supports coloring log entries, the same way `journalctl` does. +- In PLAY mode provides the same experience as `journalctl -f`, showing new log entries immediately after they are + received. + +### Prerequisites + +`systemd-journal.plugin` is a Netdata Function Plugin. + +To protect your privacy, as with all Netdata Functions, a free Netdata Cloud user account is required to access it. +For more information check [this discussion](https://github.com/netdata/netdata/discussions/16136). + +### Limitations + +#### Plugin availability + +The following are limitations related to the availability of the plugin: + +- This plugin is not available when Netdata is installed in a container. The problem is that `libsystemd` is not + available in Alpine Linux (there is a `libsystemd`, but it is a dummy that returns failure on all calls). We plan to + change this, by shipping Netdata containers based on Debian. +- For the same reason (lack of `systemd` support for Alpine Linux), the plugin is not available on `static` builds of + Netdata (which are based on `muslc`, not `glibc`). +- On old systemd systems (like Centos 7), the plugin runs always in "full data query" mode, which makes it slower. The + reason, is that systemd API is missing some important calls we need to use the field indexes of `systemd` journal. + However, when running in this mode, the plugin offers also negative matches on the data (like filtering for all logs + that do not have set some field), and this is the reason "full data query" mode is also offered as an option even on + newer versions of `systemd`. + +To use the plugin, install one of our native distribution packages, or install it from source. + +#### `systemd` journal features + +The following are limitations related to the features of `systemd` journal: + +- This plugin does not support binary field values. `systemd` journal has the ability to assign fields with binary data. + This plugin assumes all fields contain text values (text in this context includes numbers). +- This plugin does not support multiple values per field for any given log entry. `systemd` journal has the ability to + accept the same field key, multiple times, with multiple values on a single log entry. This plugin will present the + last value and ignore the others for this log entry. +- This plugin will only read journal files located in `/var/log/journal` or `/run/log/journal`. `systemd-remote` has the + ability to store journal files anywhere (user configured). If journal files are not located in `/var/log/journal` + or `/run/log/journal` (and any of their subdirectories), the plugin will not find them. + +Other than the above, this plugin supports all features of `systemd` journals. + +## Journal Sources + +The plugin automatically detects the available journal sources, based on the journal files available in +`/var/log/journal` (persistent logs) and `/run/log/journal` (volatile logs). + +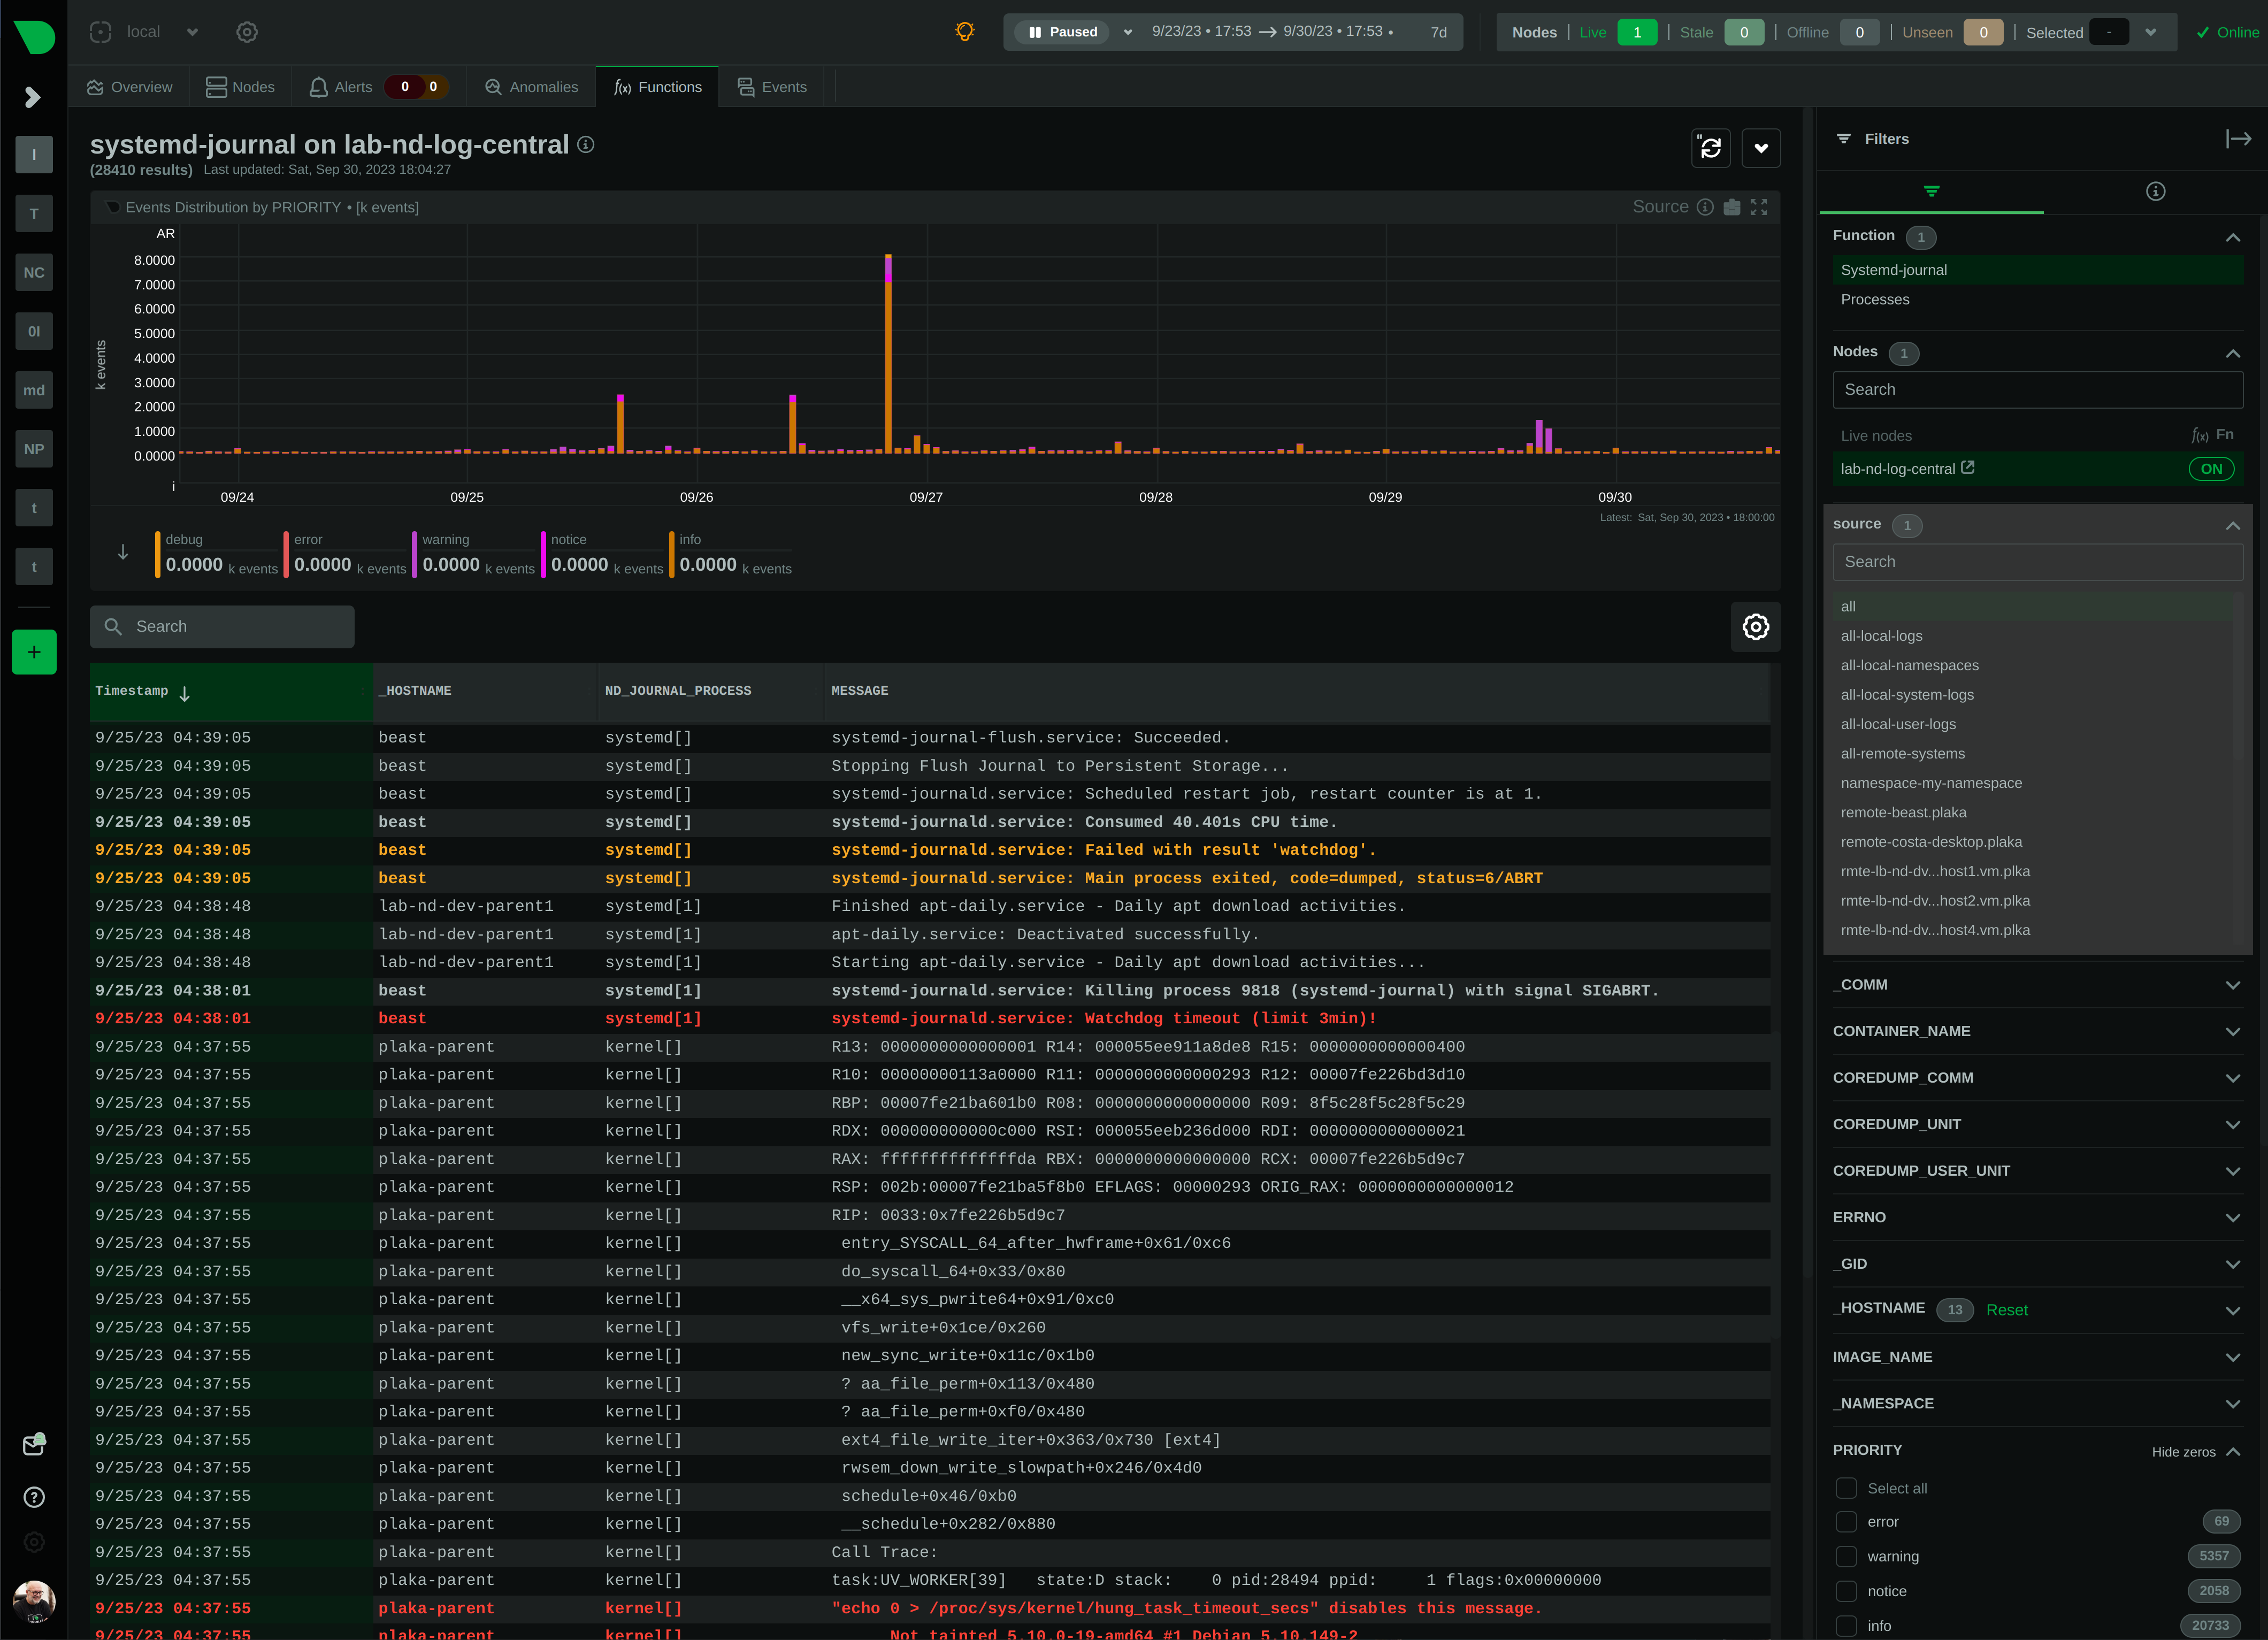 + +The plugin, by default, merges all journal sources together, to provide a unified view of all log messages available. + +> To improve query performance, we recommend selecting the relevant journal source, before doing more analysis on the +> logs. + +### `system` journals + +`system` journals are the default journals available on all `systemd` based systems. + +`system` journals contain: + +- kernel log messages (via `kmsg`), +- audit records, originating from the kernel audit subsystem, +- messages received by `systemd-journald` via `syslog`, +- messages received via the standard output and error of service units, +- structured messages received via the native journal API. + +### `user` journals + +Unlike `journalctl`, the Netdata plugin allows viewing, exploring and querying the journal files of **all users**. + +By default, each user, with a UID outside the range of system users (0 - 999), dynamic service users, +and the nobody user (65534), will get their own set of `user` journal files. For more information about +this policy check [Users, Groups, UIDs and GIDs on systemd Systems](https://systemd.io/UIDS-GIDS/). + +Keep in mind that `user` journals are merged with the `system` journals when they are propagated to a journal +centralization server. So, at the centralization server, the `remote` journals contain both the `system` and `user` +journals of the sender. + +### `namespaces` journals + +The plugin auto-detects the namespaces available and provides a list of all namespaces at the "sources" list on the UI. + +Journal namespaces are both a mechanism for logically isolating the log stream of projects consisting +of one or more services from the rest of the system and a mechanism for improving performance. + +`systemd` service units may be assigned to a specific journal namespace through the `LogNamespace=` unit file setting. + +Keep in mind that namespaces require special configuration to be propagated to a journal centralization server. +This makes them a little more difficult to handle, from the administration perspective. + +### `remote` journals + +Remote journals are created by `systemd-journal-remote`. This `systemd` feature allows creating logs centralization +points within your infrastructure, based exclusively on `systemd`. + +Usually `remote` journals are named by the IP of the server sending these logs. The Netdata plugin automatically +extracts these IPs and performs a reverse DNS lookup to find their hostnames. When this is successful, +`remote` journals are named by the hostnames of the origin servers. + +For information about configuring a journals' centralization server, +check [this FAQ item](#how-do-i-configure-a-journals-centralization-server). + +## Journal Fields + +`systemd` journals are designed to support multiple fields per log entry. The power of `systemd` journals is that, +unlike other log management systems, it supports dynamic and variable fields for each log message, +while all fields and their values are indexed for fast querying. + +This means that each application can log messages annotated with its own unique fields and values, and `systemd` +journals will automatically index all of them, without any configuration or manual action. + +For a description of the most frequent fields found in `systemd` journals, check `man systemd.journal-fields`. + +Fields found in the journal files are automatically added to the UI in multiple places to help you explore +and filter the data. + +The plugin automatically enriches certain fields to make them more user-friendly: + +- `_BOOT_ID`: the hex value is annotated with the timestamp of the first message encountered for this boot id. +- `PRIORITY`: the numeric value is replaced with the human-readable name of each priority. +- `SYSLOG_FACILITY`: the encoded value is replaced with the human-readable name of each facility. +- `ERRNO`: the numeric value is annotated with the short name of each value. +- `_UID` `_AUDIT_LOGINUID`, `_SYSTEMD_OWNER_UID`, `OBJECT_UID`, `OBJECT_SYSTEMD_OWNER_UID`, `OBJECT_AUDIT_LOGINUID`: + the local user database is consulted to annotate them with usernames. +- `_GID`, `OBJECT_GID`: the local group database is consulted to annotate them with group names. +- `_CAP_EFFECTIVE`: the encoded value is annotated with a human-readable list of the linux capabilities. +- `_SOURCE_REALTIME_TIMESTAMP`: the numeric value is annotated with human-readable datetime in UTC. + +The values of all other fields are presented as found in the journals. + +> IMPORTANT: +> The UID and GID annotations are added during presentation and are taken from the server running the plugin. +> For `remote` sources, the names presented may not reflect the actual user and group names on the origin server. +> The numeric value will still be visible though, as-is on the origin server. + +The annotations are not searchable with full-text search. They are only added for the presentation of the fields. + +### Journal fields as columns in the table + +All journal fields available in the journal files are offered as columns on the UI. Use the gear button above the table: + +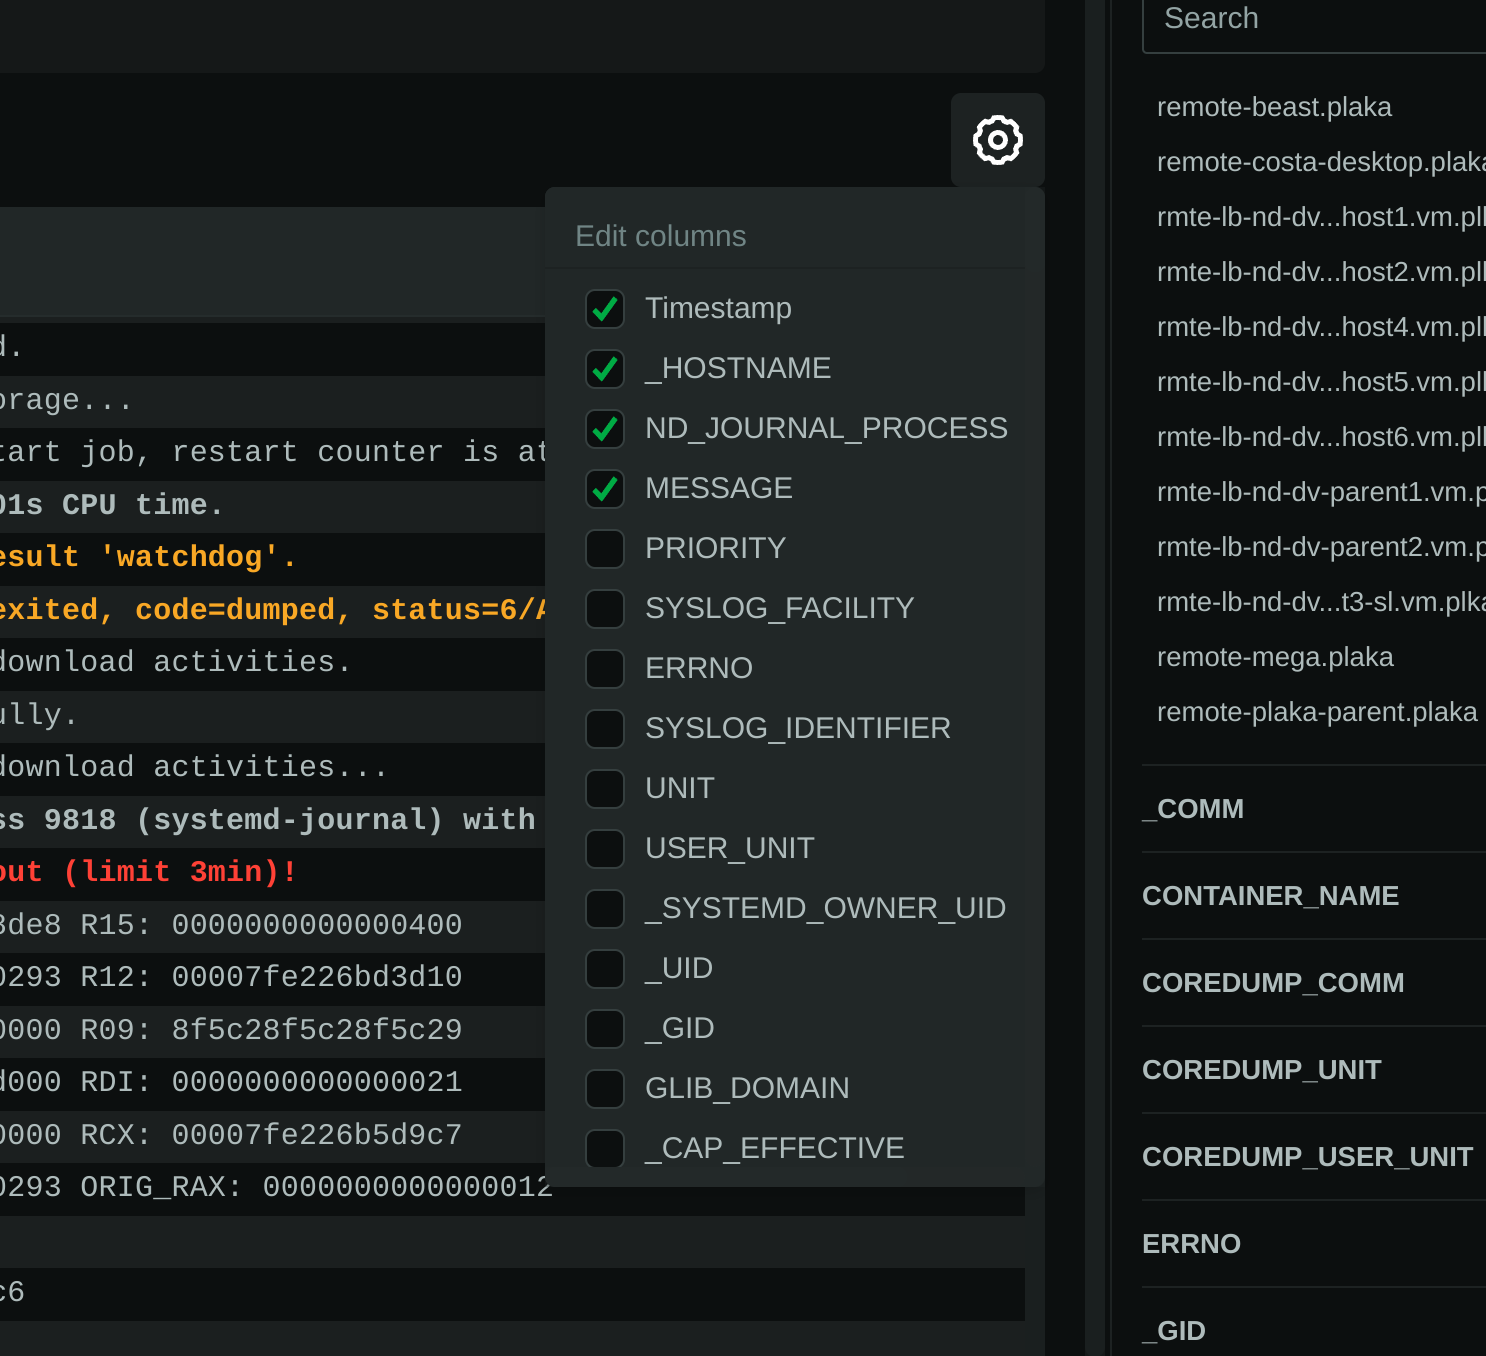 + +### Journal fields as additional info to each log entry + +When you click a log line, the `info` sidebar will open on the right of the screen, to provide the full list of fields +related to this log line. You can close this `info` sidebar, by selecting the filter icon at its top. + +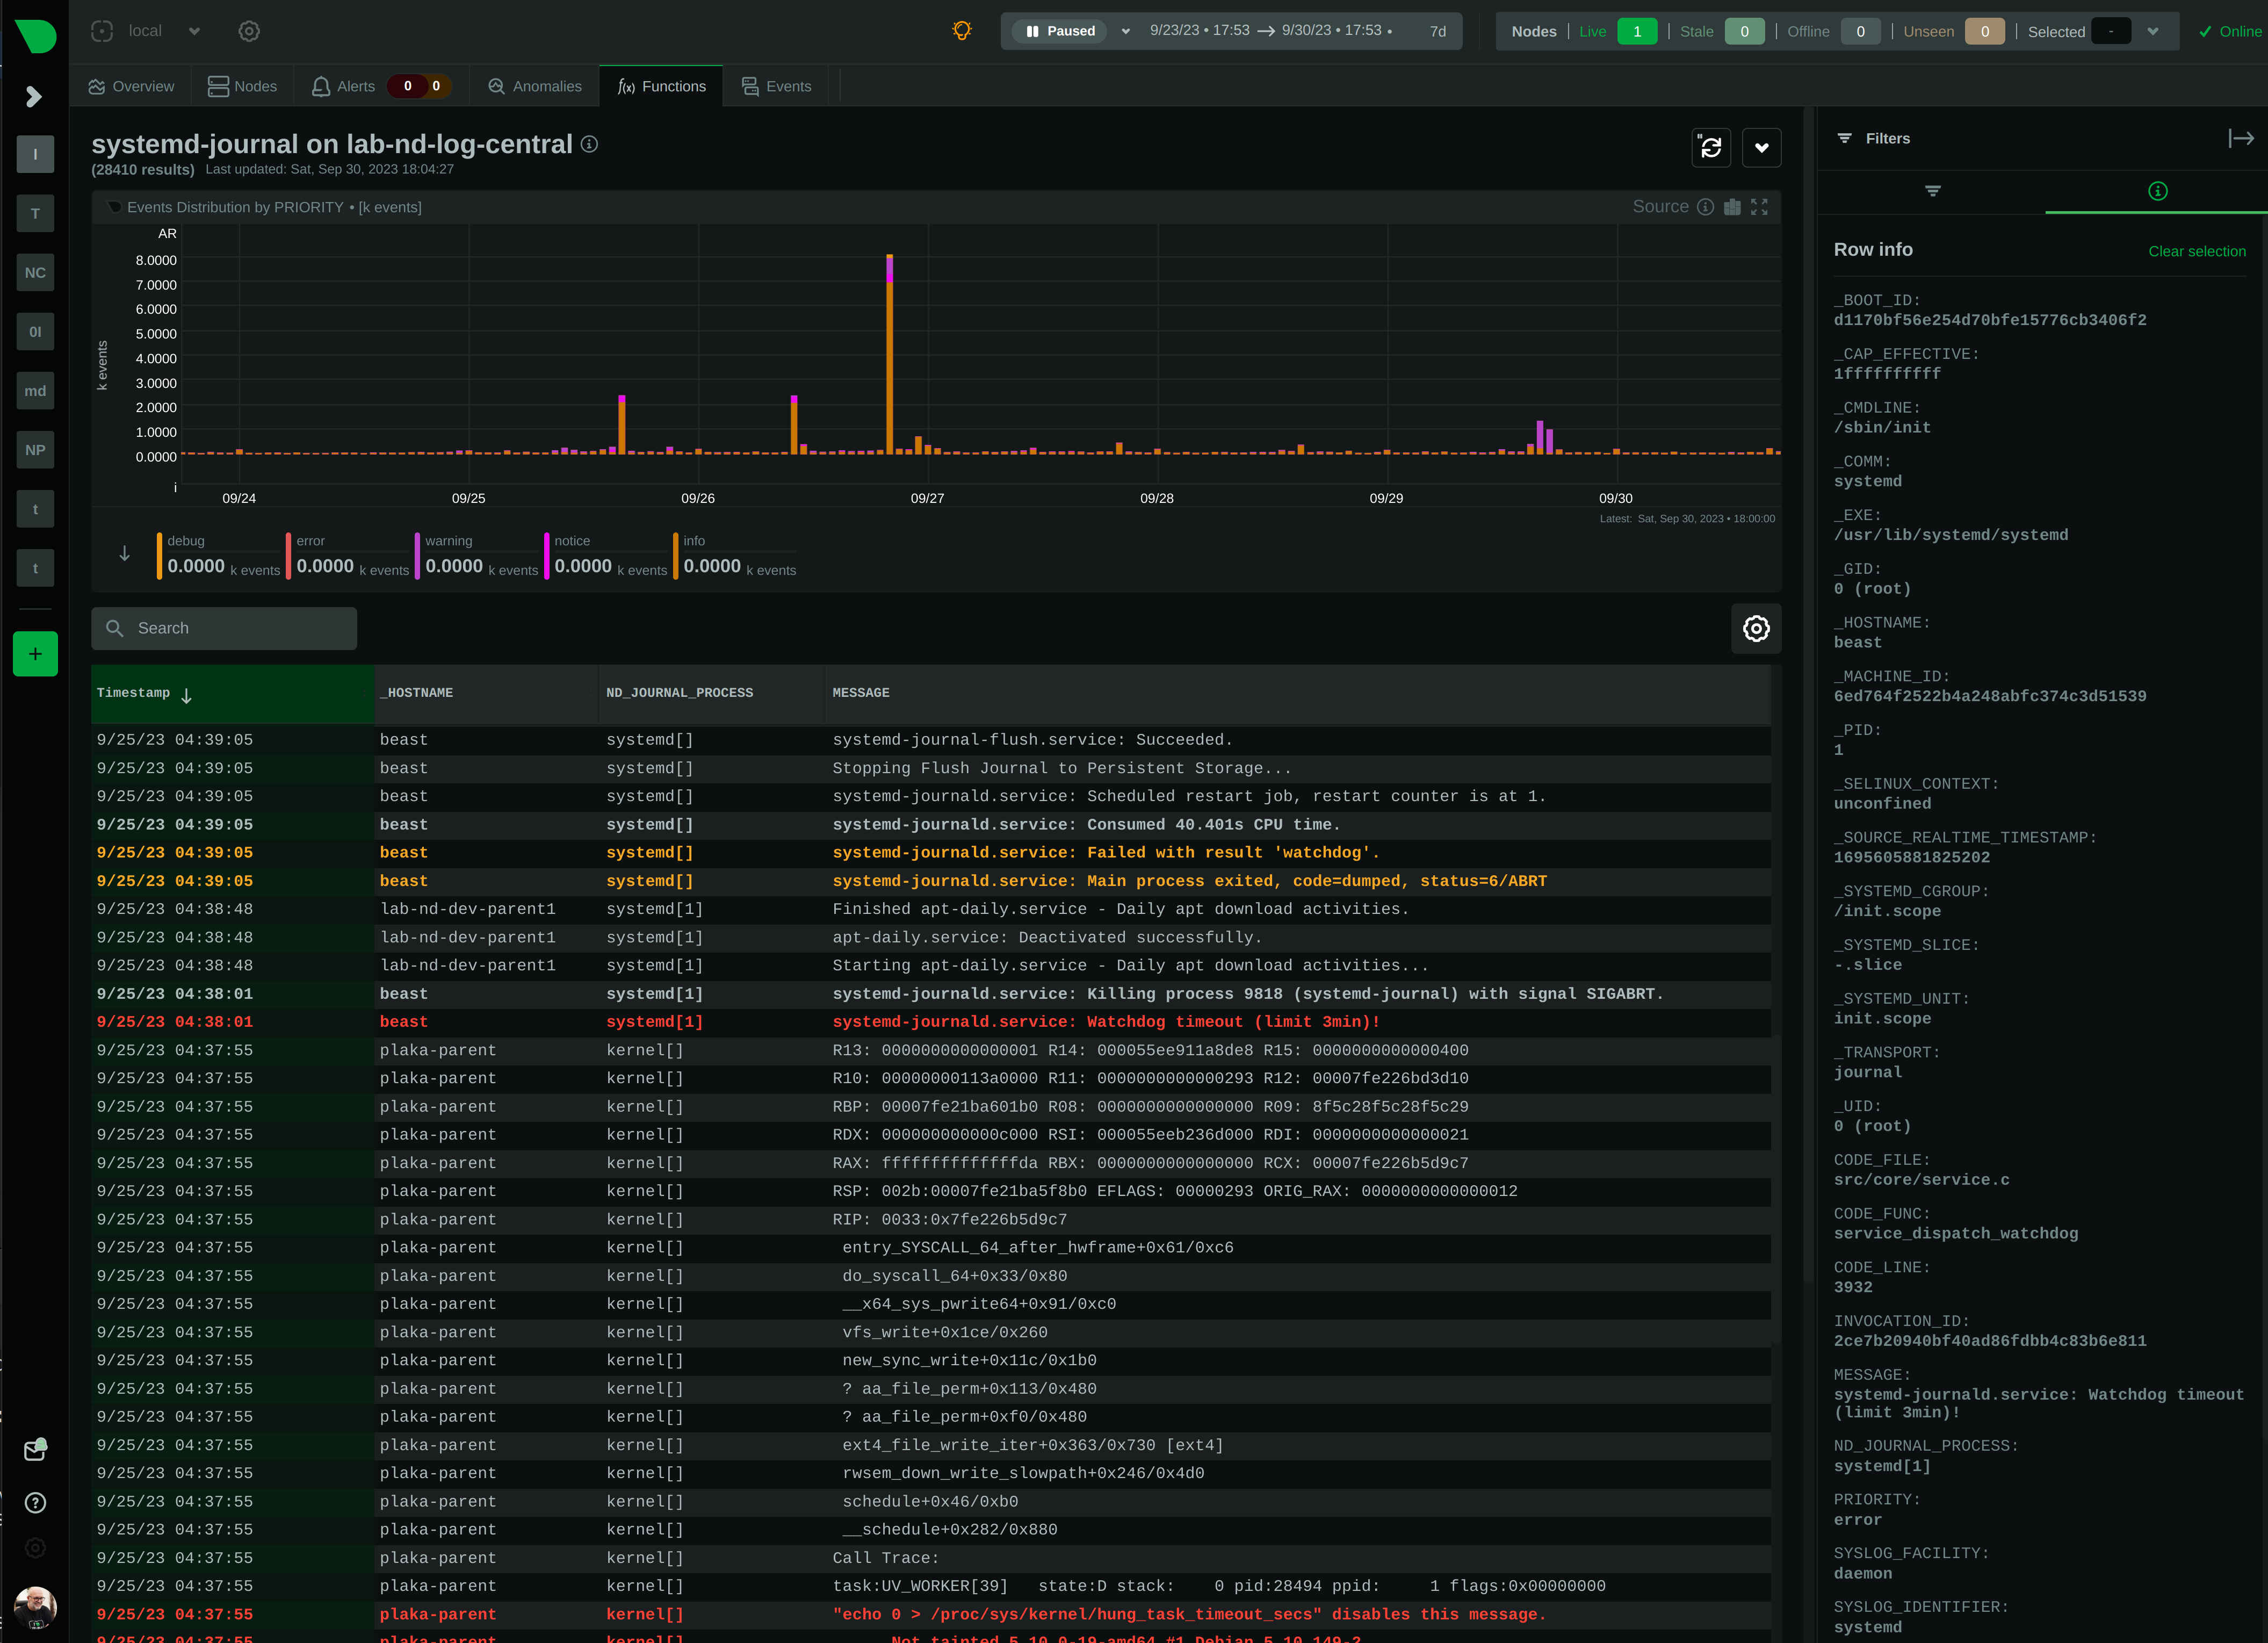 + +### Journal fields as filters + +The plugin presents a select list of fields as filters to the query, with counters for each of the possible values +for the field. This list can used to quickly check which fields and values are available for the entire time-frame +of the query. + +Internally the plugin has: + +1. A white-list of fields, to be presented as filters. +2. A black-list of fields, to prevent them from becoming filters. This list includes fields with a very high + cardinality, like timestamps, unique message ids, etc. This is mainly for protecting the server's performance, + to avoid building in memory indexes for the fields that almost each of their values is unique. + +Keep in mind that the values presented in the filters, and their sorting is affected by the "full data queries" +setting: + +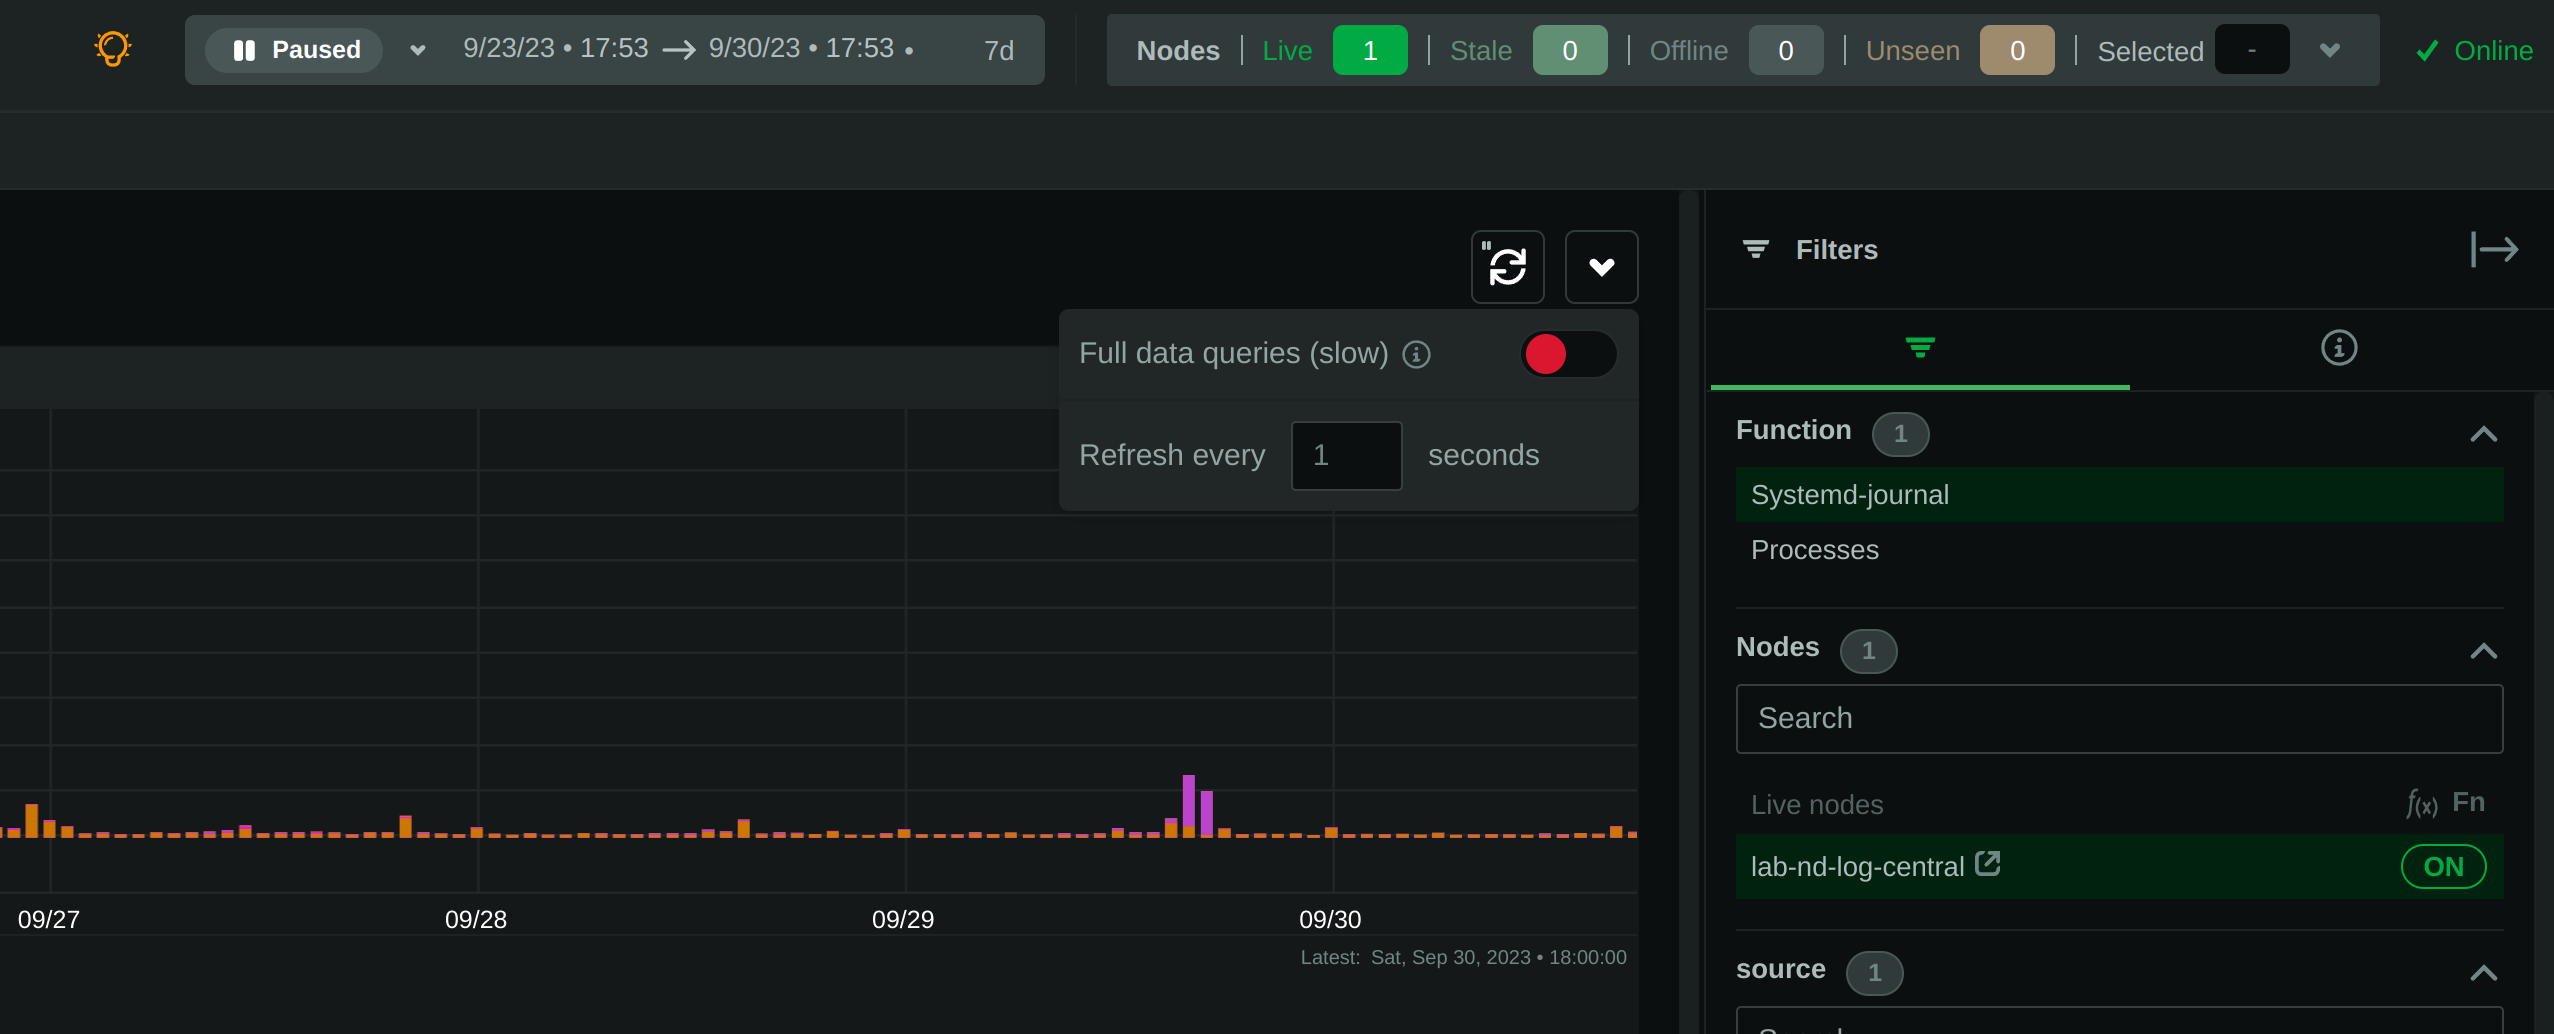 + +When "full data queries" is off, empty values are hidden and cannot be selected. This is due to a limitation of +`libsystemd` that does not allow negative or empty matches. Also, values with zero counters may appear in the list. + +When "full data queries" is on, Netdata is applying all filtering to the data (not `libsystemd`), but this means +that all the data of the entire time-frame, without any filtering applied, have to be read by the plugin to prepare +the response required. So, "full data queries" can be significantly slower over long time-frames. + +### Journal fields as histogram sources + +The plugin presents a histogram of the number of log entries across time. + +The data source of this histogram can be any of the fields that are available as filters. +For each of the values this field has, across the entire time-frame of the query, the histogram will get corresponding +dimensions, showing the number of log entries, per value, over time. + +The granularity of the histogram is adjusted automatically to have about 150 columns visible on screen. + +The histogram presented by the plugin is interactive: + +- **Zoom**, either with the global date-time picker, or the zoom tool in the histogram's toolbox. +- **Pan**, either with global date-time picker, or by dragging with the mouse the chart to the left or the right. +- **Click**, to quickly jump to the highlighted point in time in the log entries. + +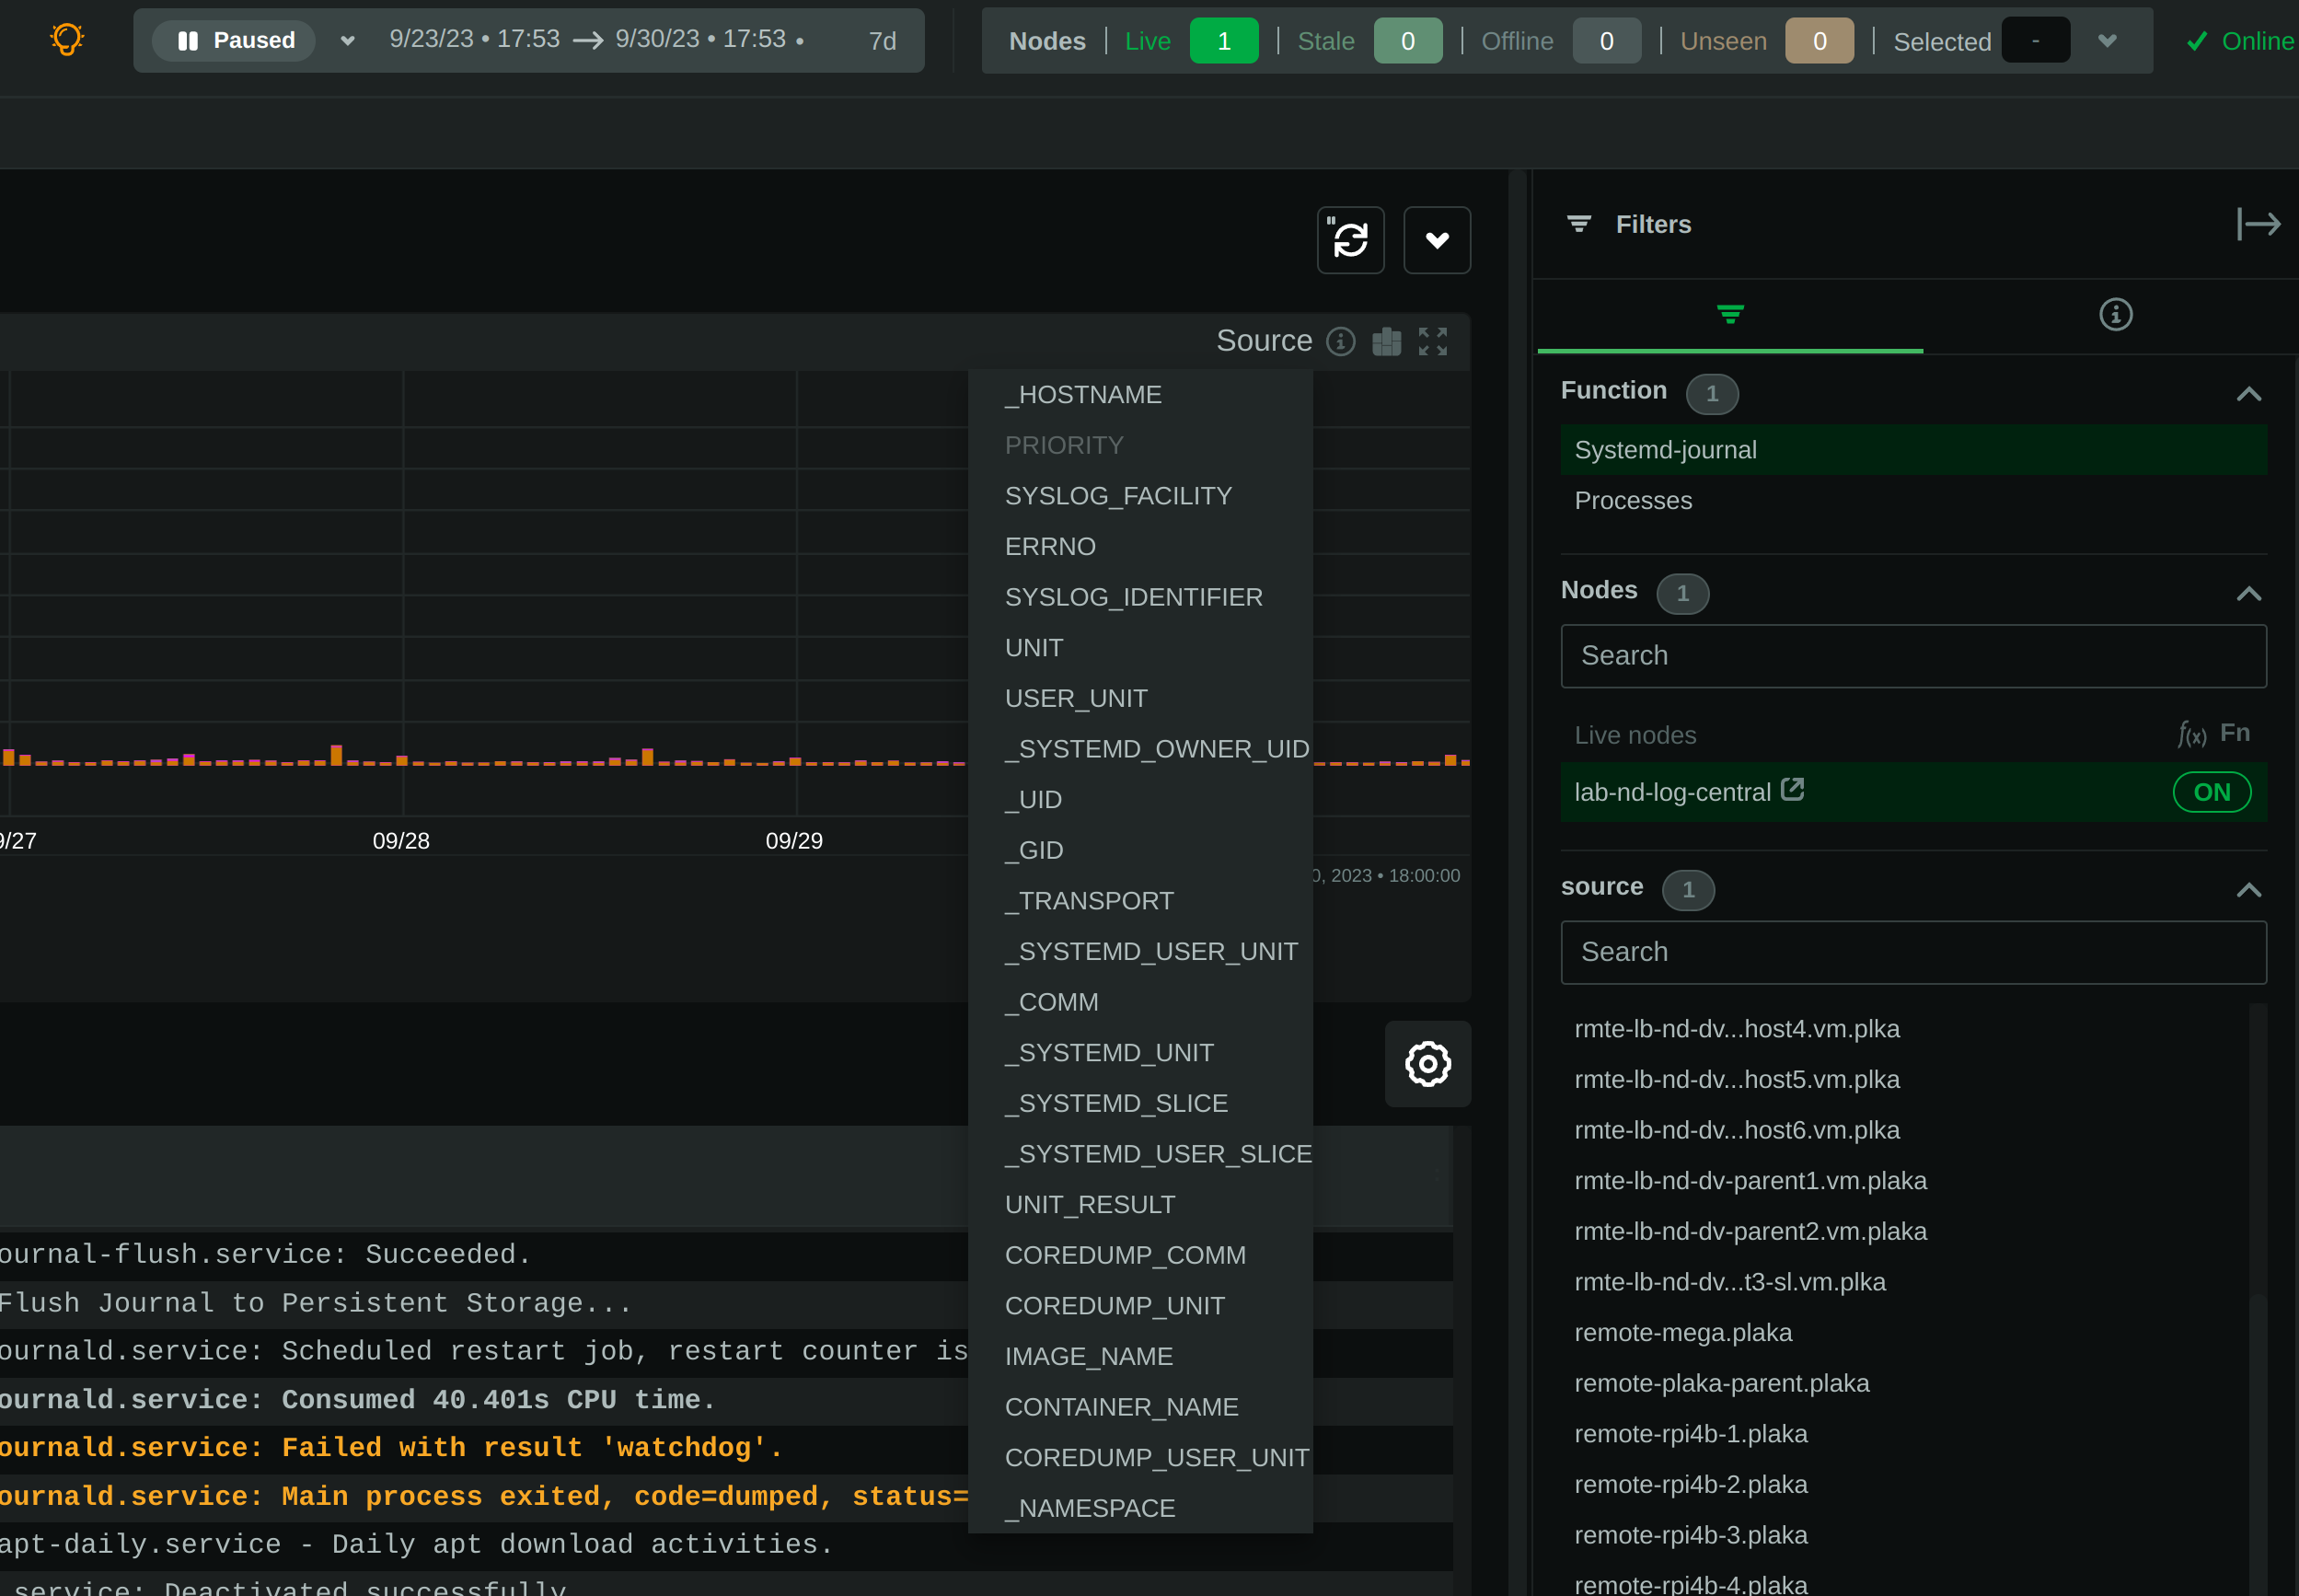 + +## PLAY mode + +The plugin supports PLAY mode, to continuously update the screen with new log entries found in the journal files. +Just hit the "play" button at the top of the Netdata dashboard screen. + +On centralized log servers, PLAY mode provides a unified view of all the new logs encountered across the entire +infrastructure, +from all hosts sending logs to the central logs server via `systemd-remote`. + +## Full-text search + +The plugin supports searching for any text on all fields of the log entries. + +Full text search is combined with the selected filters. + +The text box accepts asterisks `*` as wildcards. So, `a*b*c` means match anything that contains `a`, then `b` and +then `c` with anything between them. + +## Query performance + +Journal files are designed to be accessed by multiple readers and one writer, concurrently. + +Readers (like this Netdata plugin), open the journal files and `libsystemd`, behind the scenes, maps regions +of the files into memory, to satisfy each query. + +On logs aggregation servers, the performance of the queries depend on the following factors: + +1. The **number of files** involved in each query. + + This is why we suggest to select a source when possible. + +2. The **speed of the disks** hosting the journal files. + + Journal files perform a lot of reading while querying, so the fastest the disks, the faster the query will finish. + +3. The **memory available** for caching parts of the files. + + Increased memory will help the kernel cache the most frequently used parts of the journal files, avoiding disk I/O + and speeding up queries. + +4. The **number of filters** applied. + + Queries are significantly faster when just a few filters are selected. + +In general, for a faster experience, **keep a low number of rows within the visible timeframe**. + +Even on long timeframes, selecting a couple of filters that will result in a **few dozen thousand** log entries +will provide fast / rapid responses, usually less than a second. To the contrary, viewing timeframes with **millions +of entries** may result in longer delays. + +The plugin aborts journal queries when your browser cancels inflight requests. This allows you to work on the UI +while there are background queries running. + +At the time of this writing, this Netdata plugin is about 25-30 times faster than `journalctl` on queries that access +multiple journal files, over long time-frames. + +During the development of this plugin, we submitted, to `systemd`, a number of patches to improve `journalctl` +performance by a factor of 14: + +- https://github.com/systemd/systemd/pull/29365 +- https://github.com/systemd/systemd/pull/29366 +- https://github.com/systemd/systemd/pull/29261 + +However, even after these patches are merged, `journalctl` will still be 2x slower than this Netdata plugin, +on multi-journal queries. + +The problem lies in the way `libsystemd` handles multi-journal file queries. To overcome this problem, +the Netdata plugin queries each file individually and it then it merges the results to be returned. +This is transparent, thanks to the `facets` library in `libnetdata` that handles on-the-fly indexing, filtering, +and searching of any dataset, independently of its source. + +## Configuration and maintenance + +This Netdata plugin does not require any configuration or maintenance. + +## FAQ + +### Can I use this plugin on journals' centralization servers? + +Yes. You can centralize your logs using `systemd-journal-remote`, and then install Netdata +on this logs centralization server to explore the logs of all your infrastructure. + +This plugin will automatically provide multi-node views of your logs and also give you the ability to combine the logs +of multiple servers, as you see fit. + +Check [configuring a logs centralization server](#configuring-a-journals-centralization-server). + +### Can I use this plugin from a parent Netdata? + +Yes. When your nodes are connected to a Netdata parent, all their functions are available +via the parent's UI. So, from the parent UI, you can access the functions of all your nodes. + +Keep in mind that to protect your privacy, in order to access Netdata functions, you need a +free Netdata Cloud account. + +### Is any of my data exposed to Netdata Cloud from this plugin? + +No. When you access the agent directly, none of your data passes through Netdata Cloud. +You need a free Netdata Cloud account only to verify your identity and enable the use of +Netdata Functions. Once this is done, all the data flow directly from your Netdata agent +to your web browser. + +Also check [this discussion](https://github.com/netdata/netdata/discussions/16136). + +When you access Netdata via `https://app.netdata.cloud`, your data travel via Netdata Cloud, +but they are not stored in Netdata Cloud. This is to allow you access your Netdata agents from +anywhere. All communication from/to Netdata Cloud is encrypted. + +### What are `volatile` and `persistent` journals? + +`systemd` `journald` allows creating both `volatile` journals in a `tmpfs` ram drive, +and `persistent` journals stored on disk. + +`volatile` journals are particularly useful when the system monitored is sensitive to +disk I/O, or does not have any writable disks at all. + +For more information check `man systemd-journald`. + +### I centralize my logs with Loki. Why to use Netdata for my journals? + +`systemd` journals have almost infinite cardinality at their labels and all of them are indexed, +even if every single message has unique fields and values. + +When you send `systemd` journal logs to Loki, even if you use the `relabel_rules` argument to +`loki.source.journal` with a JSON format, you need to specify which of the fields from journald +you want inherited by Loki. This means you need to know the most important fields beforehand. +At the same time you loose all the flexibility `systemd` journal provides: +**indexing on all fields and all their values**. + +Loki generally assumes that all logs are like a table. All entries in a stream share the same +fields. But journald does exactly the opposite. Each log entry is unique and may have its own unique fields. + +So, Loki and `systemd-journal` are good for different use cases. + +`systemd-journal` already runs in your systems. You use it today. It is there inside all your systems +collecting the system and applications logs. And for its use case, it has advantages over other +centralization solutions. So, why not use it? + +### Is it worth to build a `systemd` logs centralization server? + +Yes. It is simple, fast and the software to do it is already in your systems. + +For application and system logs, `systemd` journal is ideal and the visibility you can get +by centralizing your system logs and the use of this Netdata plugin, is unparalleled. + +### How do I configure a journals' centralization server? + +A short summary to get journal server running can be found below. +There are two strategies you can apply, when it comes down to a centralized server for `systemd` journal logs. + +1. _Active sources_, where the centralized server fetches the logs from each individual server +2. _Passive sources_, where the centralized server accepts a log stream from an individual server. + +For more options and reference to documentation, check `man systemd-journal-remote` and `man systemd-journal-upload`. + +#### _passive_ journals' centralization without encryption + +> ℹ️ _passive_ is a journal server that waits for clients to push their metrics to it. + +> ⚠️ **IMPORTANT** +> These instructions will copy your logs to a central server, without any encryption or authorization. +> DO NOT USE THIS ON NON-TRUSTED NETWORKS. + +##### _passive_ server, without encryption + +On the centralization server install `systemd-journal-remote`: + +```sh +# change this according to your distro +sudo apt-get install systemd-journal-remote +``` + +Make sure the journal transfer protocol is `http`: + +```sh +sudo cp /lib/systemd/system/systemd-journal-remote.service /etc/systemd/system/ + +# edit it to make sure it says: +# --listen-http=-3 +# not: +# --listen-https=-3 +sudo nano /etc/systemd/system/systemd-journal-remote.service + +# reload systemd +sudo systemctl daemon-reload +``` + +Optionally, if you want to change the port (the default is `19532`), edit `systemd-journal-remote.socket` + +```sh +# edit the socket file +sudo systemctl edit systemd-journal-remote.socket +``` + +and add the following lines into the instructed place, and choose your desired port; save and exit. + +```sh +[Socket] +ListenStream=<DESIRED_PORT> +``` + +Finally, enable it, so that it will start automatically upon receiving a connection: + +``` +# enable systemd-journal-remote +sudo systemctl enable --now systemd-journal-remote.socket +sudo systemctl enable systemd-journal-remote.service +``` + +`systemd-journal-remote` is now listening for incoming journals from remote hosts. + +##### _passive_ client, without encryption + +On the clients, install `systemd-journal-remote`: + +```sh +# change this according to your distro +sudo apt-get install systemd-journal-remote +``` + +Edit `/etc/systemd/journal-upload.conf` and set the IP address and the port of the server, like so: + +``` +[Upload] +URL=http://centralization.server.ip:19532 +``` + +Edit `systemd-journal-upload`, and add `Restart=always` to make sure the client will keep trying to push logs, even if the server is temporarily not there, like this: + +```sh +sudo systemctl edit systemd-journal-upload +``` + +At the top, add: + +``` +[Service] +Restart=always +``` + +Enable and start `systemd-journal-upload`, like this: + +```sh +sudo systemctl enable systemd-journal-upload +sudo systemctl start systemd-journal-upload +``` + +##### verify it works + +To verify the central server is receiving logs, run this on the central server: + +```sh +sudo ls -l /var/log/journal/remote/ +``` + +You should see new files from the client's IP. + +Also, `systemctl status systemd-journal-remote` should show something like this: + +``` +systemd-journal-remote.service - Journal Remote Sink Service + Loaded: loaded (/etc/systemd/system/systemd-journal-remote.service; indirect; preset: disabled) + Active: active (running) since Sun 2023-10-15 14:29:46 EEST; 2h 24min ago +TriggeredBy: ● systemd-journal-remote.socket + Docs: man:systemd-journal-remote(8) + man:journal-remote.conf(5) + Main PID: 2118153 (systemd-journal) + Status: "Processing requests..." + Tasks: 1 (limit: 154152) + Memory: 2.2M + CPU: 71ms + CGroup: /system.slice/systemd-journal-remote.service + └─2118153 /usr/lib/systemd/systemd-journal-remote --listen-http=-3 --output=/var/log/journal/remote/ +``` + +Note the `status: "Processing requests..."` and the PID under `CGroup`. + +On the client `systemctl status systemd-journal-upload` should show something like this: + +``` +● systemd-journal-upload.service - Journal Remote Upload Service + Loaded: loaded (/lib/systemd/system/systemd-journal-upload.service; enabled; vendor preset: disabled) + Drop-In: /etc/systemd/system/systemd-journal-upload.service.d + └─override.conf + Active: active (running) since Sun 2023-10-15 10:39:04 UTC; 3h 17min ago + Docs: man:systemd-journal-upload(8) + Main PID: 4169 (systemd-journal) + Status: "Processing input..." + Tasks: 1 (limit: 13868) + Memory: 3.5M + CPU: 1.081s + CGroup: /system.slice/systemd-journal-upload.service + └─4169 /lib/systemd/systemd-journal-upload --save-state +``` + +Note the `Status: "Processing input..."` and the PID under `CGroup`. + +#### _passive_ journals' centralization with encryption using self-signed certificates + +> ℹ️ _passive_ is a journal server that waits for clients to push their metrics to it. + +##### _passive_ server, with encryption and self-singed certificates + +On the centralization server install `systemd-journal-remote` and `openssl`: + +```sh +# change this according to your distro +sudo apt-get install systemd-journal-remote openssl +``` + +Make sure the journal transfer protocol is `https`: + +```sh +sudo cp /lib/systemd/system/systemd-journal-remote.service /etc/systemd/system/ + +# edit it to make sure it says: +# --listen-https=-3 +# not: +# --listen-http=-3 +sudo nano /etc/systemd/system/systemd-journal-remote.service + +# reload systemd +sudo systemctl daemon-reload +``` + +Optionally, if you want to change the port (the default is `19532`), edit `systemd-journal-remote.socket` + +```sh +# edit the socket file +sudo systemctl edit systemd-journal-remote.socket +``` + +and add the following lines into the instructed place, and choose your desired port; save and exit. + +```sh +[Socket] +ListenStream=<DESIRED_PORT> +``` + +Finally, enable it, so that it will start automatically upon receiving a connection: + +```sh +# enable systemd-journal-remote +sudo systemctl enable --now systemd-journal-remote.socket +sudo systemctl enable systemd-journal-remote.service +``` + +`systemd-journal-remote` is now listening for incoming journals from remote hosts. + +Use [this script](https://gist.github.com/ktsaou/d62b8a6501cf9a0da94f03cbbb71c5c7) to create a self-signed certificates authority and certificates for all your servers. + +```sh +wget -O systemd-journal-self-signed-certs.sh "https://gist.githubusercontent.com/ktsaou/d62b8a6501cf9a0da94f03cbbb71c5c7/raw/c346e61e0a66f45dc4095d254bd23917f0a01bd0/systemd-journal-self-signed-certs.sh" +chmod 755 systemd-journal-self-signed-certs.sh +``` + +Edit the script and at its top, set your settings: + +```sh +# The directory to save the generated certificates (and everything about this certificate authority). +# This is only used on the node generating the certificates (usually on the journals server). +DIR="/etc/ssl/systemd-journal-remote" + +# The journals centralization server name (the CN of the server certificate). +SERVER="server-hostname" + +# All the DNS names or IPs this server is reachable at (the certificate will include them). +# Journal clients can use any of them to connect to this server. +# systemd-journal-upload validates its URL= hostname, against this list. +SERVER_ALIASES=("DNS:server-hostname1" "DNS:server-hostname2" "IP:1.2.3.4" "IP:10.1.1.1" "IP:172.16.1.1") + +# All the names of the journal clients that will be sending logs to the server (the CNs of their certificates). +# These names are used by systemd-journal-remote to name the journal files in /var/log/journal/remote/. +# Also the remote hosts will be presented using these names on Netdata dashboards. +CLIENTS=("vm1" "vm2" "vm3" "add_as_may_as_needed") +``` + +Then run the script: + +```sh +sudo ./systemd-journal-self-signed-certs.sh +``` + +The script will create the directory `/etc/ssl/systemd-journal-remote` and in it you will find all the certificates needed. + +There will also be files named `runme-on-XXX.sh`. There will be 1 script for the server and 1 script for each of the clients. You can copy and paste (or `scp`) these scripts on your server and each of your clients and run them as root: + +```sh +scp /etc/ssl/systemd-journal-remote/runme-on-XXX.sh XXX:/tmp/ +``` + +Once the above is done, `ssh` to each server/client and do: + +```sh +sudo bash /tmp/runme-on-XXX.sh +``` + +The scripts install the needed certificates, fix their file permissions to be accessible by systemd-journal-remote/upload, change `/etc/systemd/journal-remote.conf` (on the server) or `/etc/systemd/journal-upload.conf` on the clients and restart the relevant services. + + +##### _passive_ client, with encryption and self-singed certificates + +On the clients, install `systemd-journal-remote`: + +```sh +# change this according to your distro +sudo apt-get install systemd-journal-remote +``` + +Edit `/etc/systemd/journal-upload.conf` and set the IP address and the port of the server, like so: + +``` +[Upload] +URL=https://centralization.server.ip:19532 +``` + +Make sure that `centralization.server.ip` is one of the `SERVER_ALIASES` when you created the certificates. + +Edit `systemd-journal-upload`, and add `Restart=always` to make sure the client will keep trying to push logs, even if the server is temporarily not there, like this: + +```sh +sudo systemctl edit systemd-journal-upload +``` + +At the top, add: + +``` +[Service] +Restart=always +``` + +Enable and start `systemd-journal-upload`, like this: + +```sh +sudo systemctl enable systemd-journal-upload +``` + +Copy the relevant `runme-on-XXX.sh` script as described on server setup and run it: + +```sh +sudo bash /tmp/runme-on-XXX.sh +``` + + +#### Limitations when using a logs centralization server + +As of this writing `namespaces` support by `systemd` is limited: + +- Docker containers cannot log to namespaces. Check [this issue](https://github.com/moby/moby/issues/41879). +- `systemd-journal-upload` automatically uploads `system` and `user` journals, but not `namespaces` journals. For this + you need to spawn a `systemd-journal-upload` per namespace. + |