diff options
| author | Daniel Baumann <daniel.baumann@progress-linux.org> | 2023-05-08 16:27:04 +0000 |
|---|---|---|
| committer | Daniel Baumann <daniel.baumann@progress-linux.org> | 2023-05-08 16:27:04 +0000 |
| commit | a836a244a3d2bdd4da1ee2641e3e957850668cea (patch) | |
| tree | cb87c75b3677fab7144f868435243f864048a1e6 /docs/agent-cloud.md | |
| parent | Adding upstream version 1.38.1. (diff) | |
| download | netdata-a836a244a3d2bdd4da1ee2641e3e957850668cea.tar.xz netdata-a836a244a3d2bdd4da1ee2641e3e957850668cea.zip | |
Adding upstream version 1.39.0.upstream/1.39.0
Signed-off-by: Daniel Baumann <daniel.baumann@progress-linux.org>
Diffstat (limited to 'docs/agent-cloud.md')
| -rw-r--r-- | docs/agent-cloud.md | 78 |
1 files changed, 0 insertions, 78 deletions
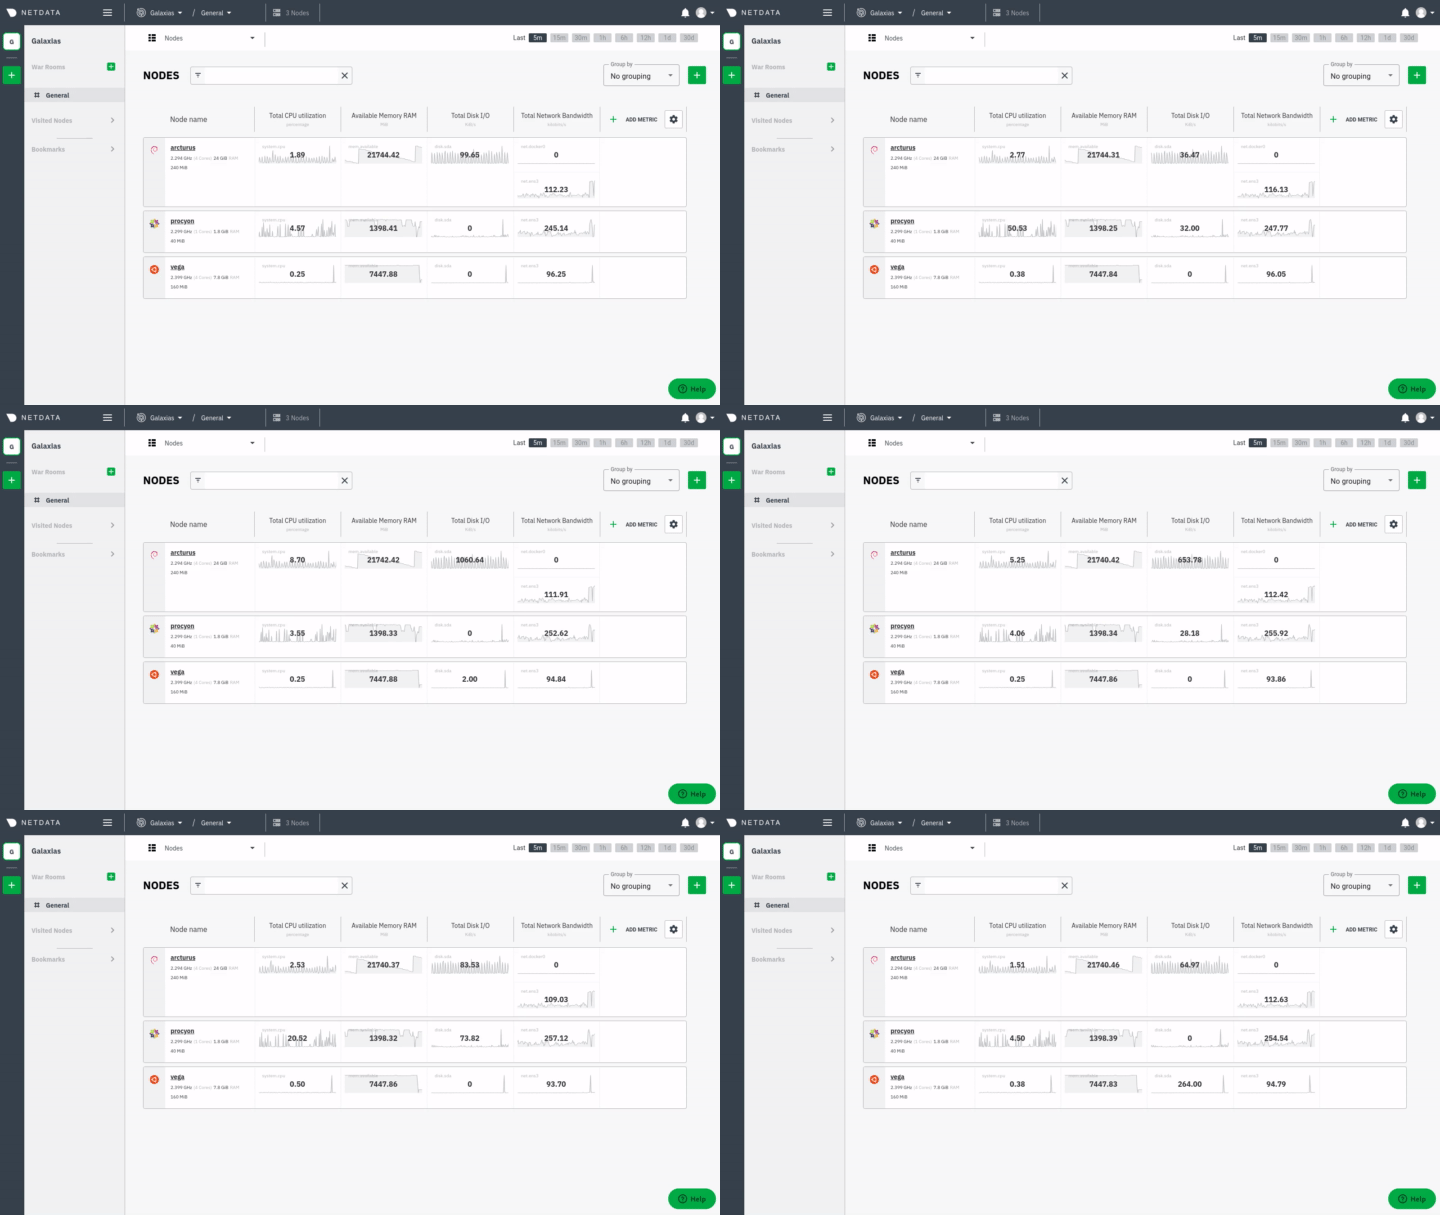
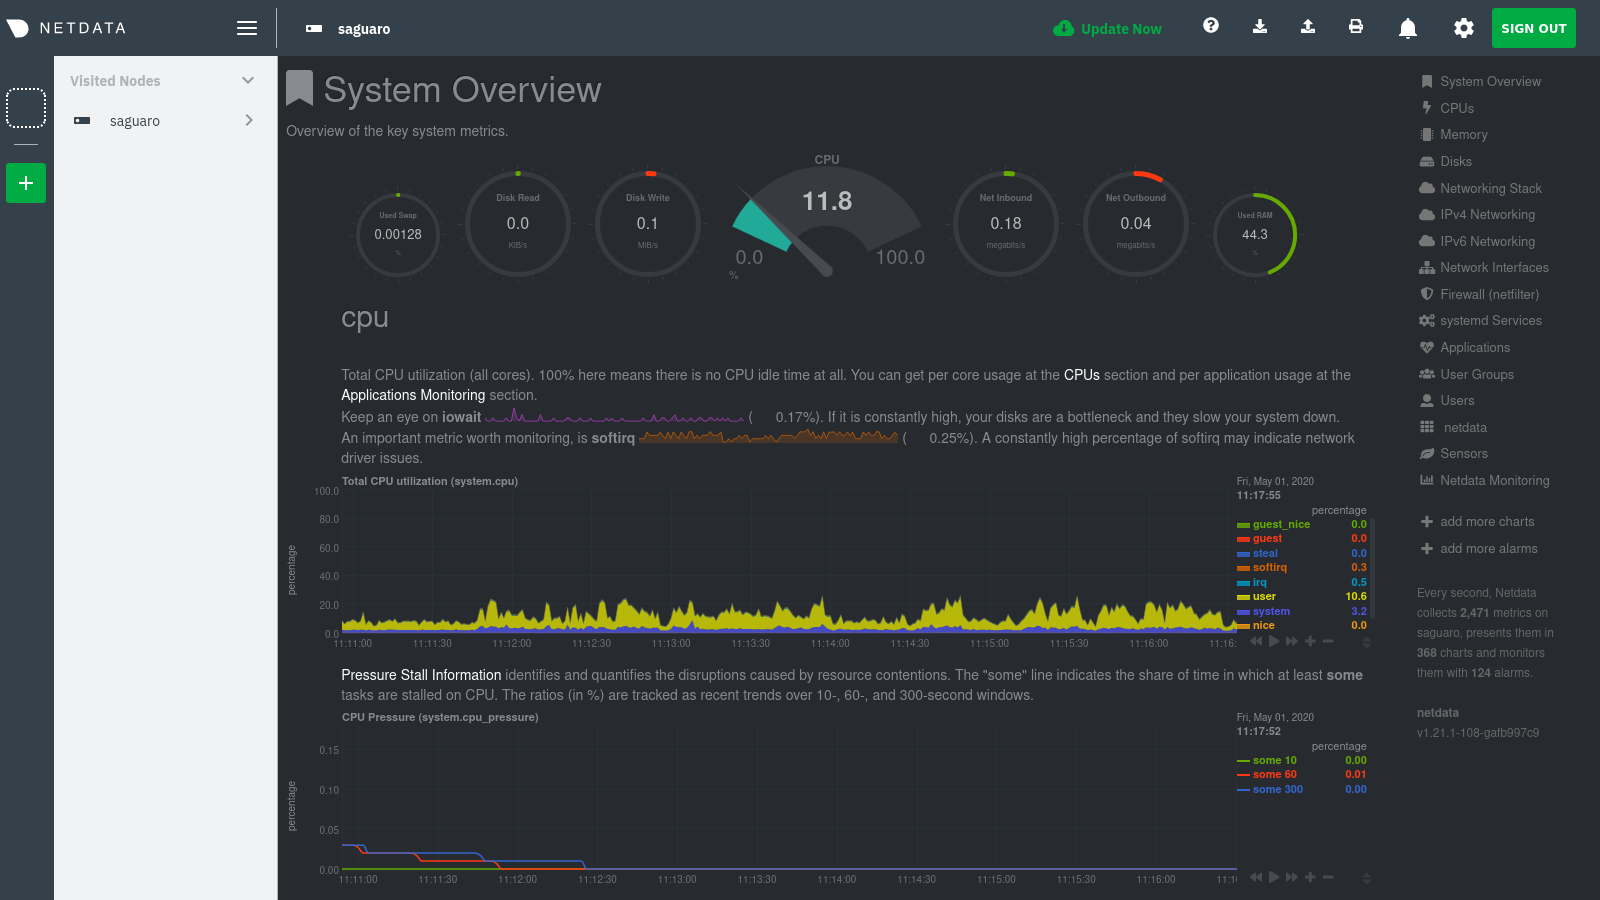
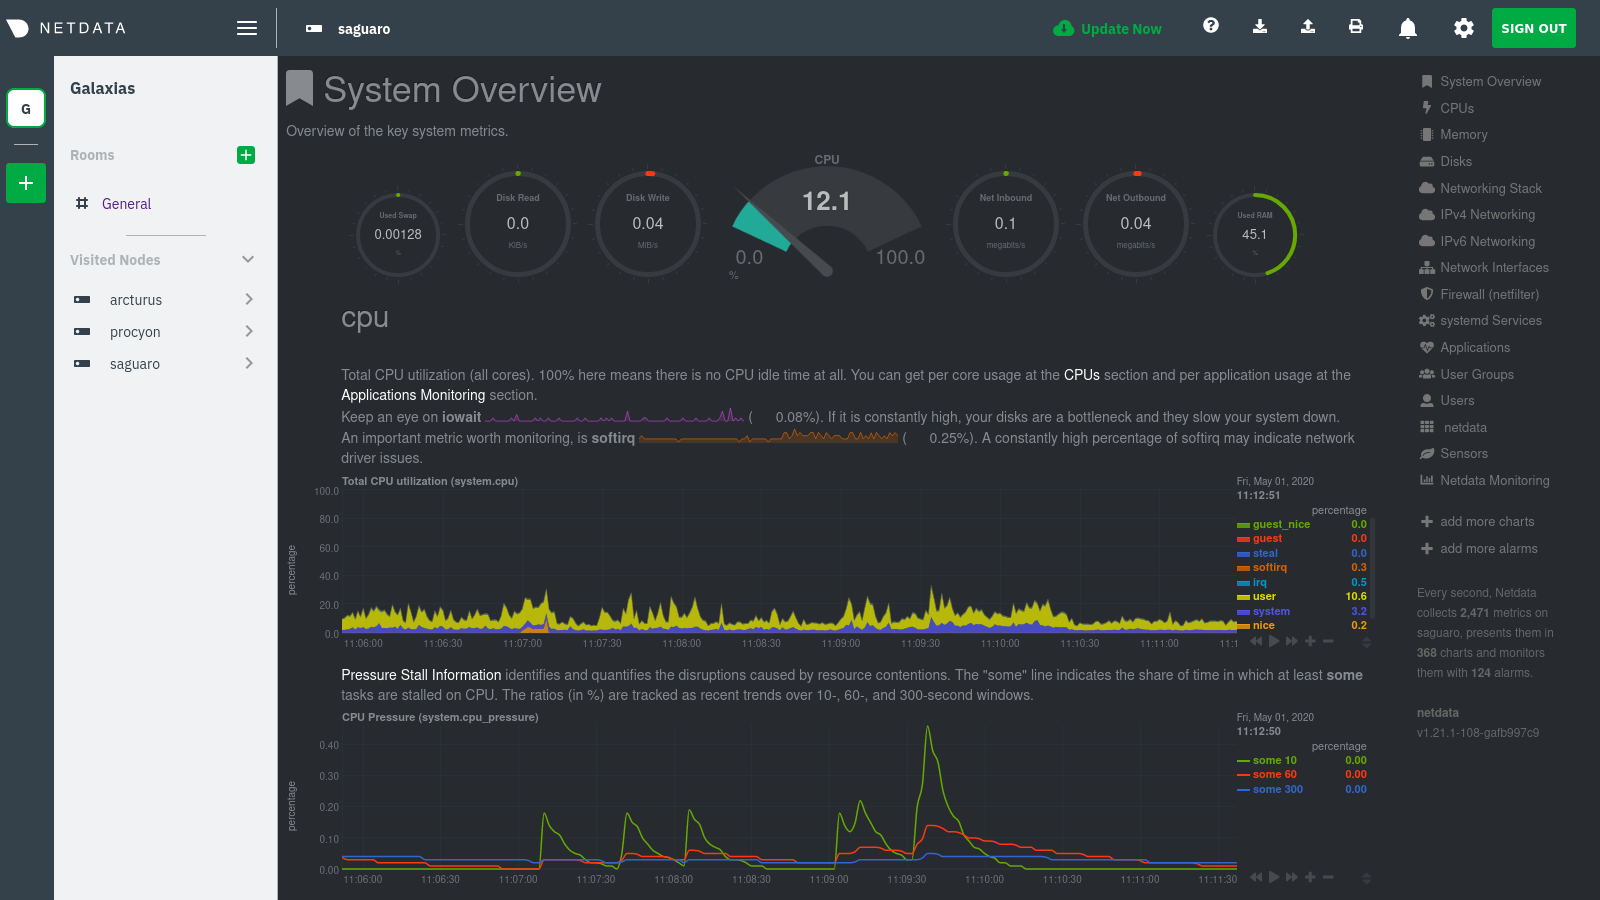
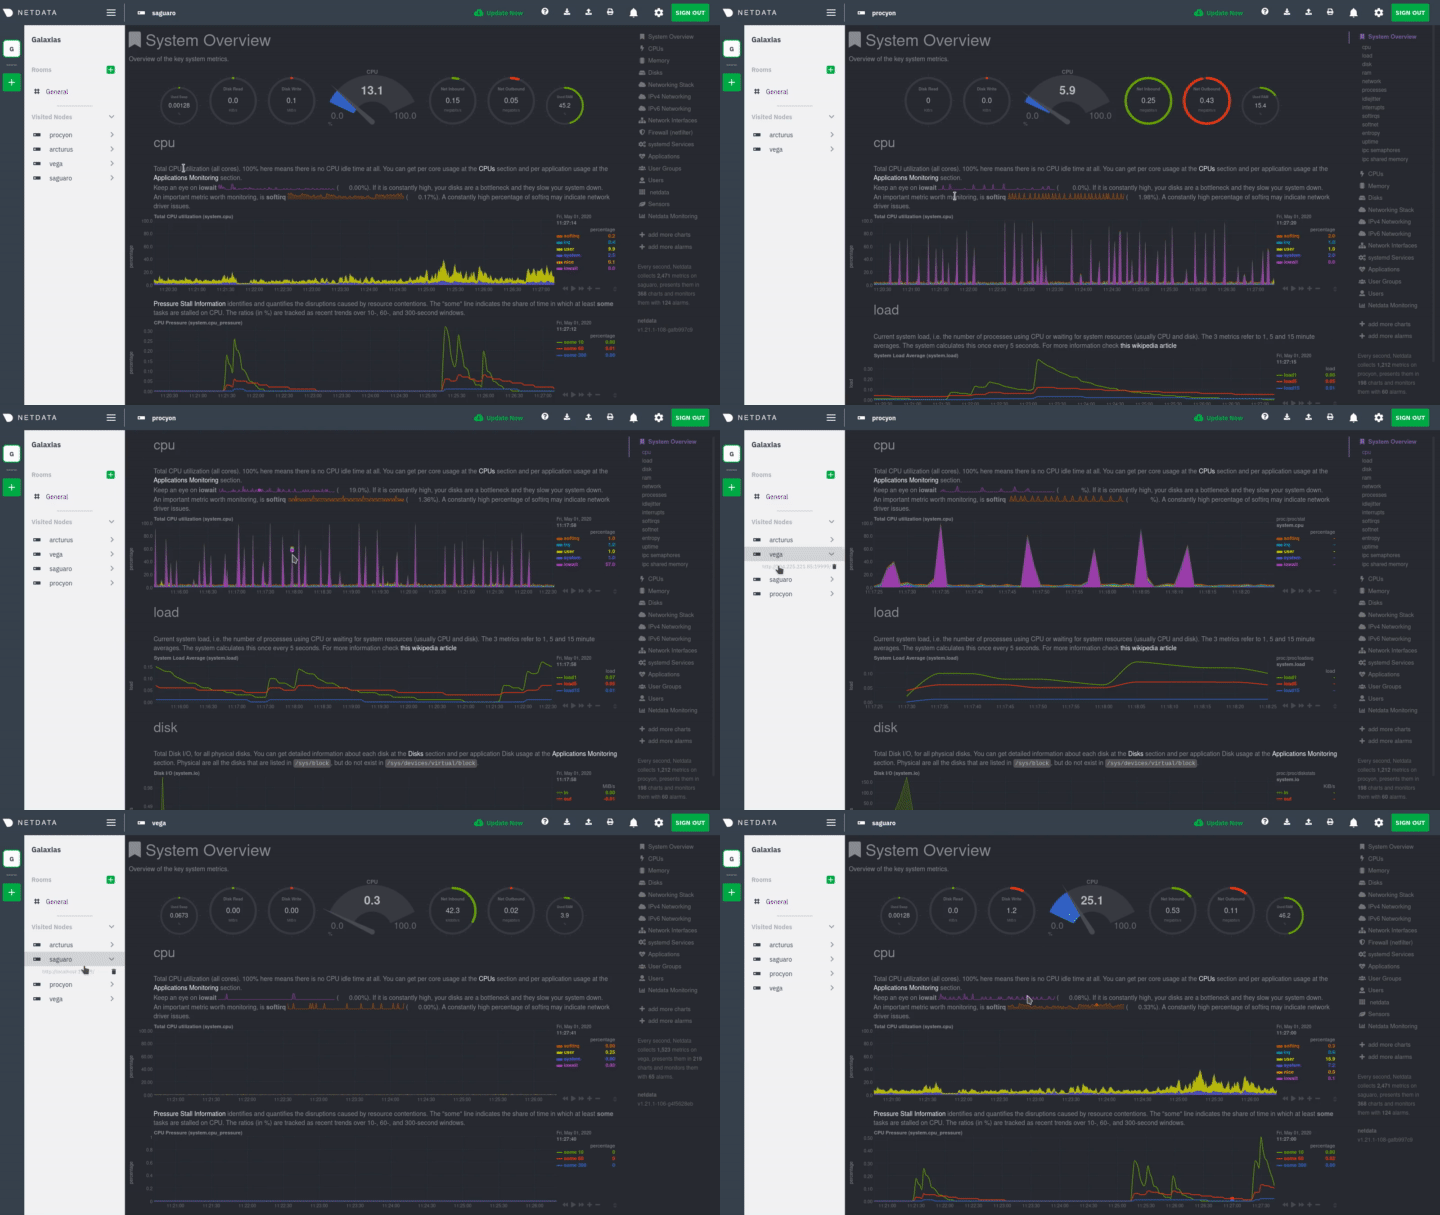
diff --git a/docs/agent-cloud.md b/docs/agent-cloud.md deleted file mode 100644 index b5b996617..000000000 --- a/docs/agent-cloud.md +++ /dev/null @@ -1,78 +0,0 @@ -<!-- -title: "Use the Agent with Netdata Cloud" -date: 2020-05-04 -custom_edit_url: https://github.com/netdata/netdata/edit/master/docs/agent-cloud.md ---> - -# Use the Agent with Netdata Cloud - -While the Netdata Agent is an enormously powerful _distributed_ health monitoring and performance troubleshooting tool, -many of its users need to monitor dozens or hundreds of systems at the same time. That's why we built Netdata Cloud, a -hosted web interface that gives you real-time visibility into your entire infrastructure. - -There are two main ways to use your Agent(s) with Netdata Cloud. You can use both these methods simultaneously, or just -one, based on your needs: - -- Use Netdata Cloud's web interface for monitoring an entire infrastructure, with any number of Agents, in one - centralized dashboard. -- Use **Visited nodes** to quickly navigate between the dashboards of nodes you've recently visited. - -## Monitor an infrastructure with Netdata Cloud - -We designed Netdata Cloud to help you see health and performance metrics, plus active alarms, in a single interface. -Here's what a small infrastructure might look like: - - - -[Read more about Netdata Cloud](https://github.com/netdata/netdata/blob/master/docs/cloud/cloud.mdx) to better -understand how it gives you real-time -visibility into your entire infrastructure, and why you might consider using it. - -Next, [get started in 5 minutes](https://github.com/netdata/netdata/blob/master/docs/cloud/get-started.mdx), or read our -[connection to Cloud reference](https://github.com/netdata/netdata/blob/master/claim/README.md) for a complete -investigation of Cloud's security and encryption features, plus instructions for Docker containers. - -## Navigate between dashboards with Visited nodes - -If you don't want to use Netdata Cloud's web interface, you can still connect multiple nodes through the **Visited -nodes** menu, which appears on the left-hand side of the dashboard. - -You can use the Visited nodes menu to navigate between the dashboards of many different Agent-monitored systems quickly. - -To add nodes to your Visited nodes menu, you first need to navigate to that node's dashboard, then click the **Sign in** -button at the top of the dashboard. On the screen that appears, which states your node is requesting access to your -Netdata Cloud account, sign in with your preferred method. - -Cloud redirects you back to your node's dashboard, which is now connected to your Netdata Cloud account. You can now see -the Visited nodes menu, which is populated by a single node. - - - -If you previously went through the Cloud onboarding process to create a Space and War Room, you will also see these in -the Visited Nodes menu. You can click on your Space or any of your War Rooms to navigate to Netdata Cloud and continue -monitoring your infrastructure from there. - - - -To add more Agents to your Visited nodes menu, visit them and sign in again. This process connects that node to your -Cloud account and further populates the menu. - -Once you've added more than one node, you can use the menu to switch between various dashboards without remembering IP -addresses or hostnames or saving bookmarks for every node you want to monitor. - - - -## What's next? - -The Agent-Cloud integration is highly adaptable to the needs of any infrastructure or user. If you want to learn more -about how you might want to use or configure Cloud, we recommend the following: - -- Get an overview of Cloud's features by - reading [Cloud documentation](https://github.com/netdata/netdata/blob/master/docs/cloud/cloud.mdx). -- Follow the - 5-minute [get started with Cloud](https://github.com/netdata/netdata/blob/master/docs/cloud/cloud.mdx) - guide to finish - onboarding and connect your first nodes. -- Better understand how agents connect securely to the Cloud - with [connect agent to Cloud](https://github.com/netdata/netdata/blob/master/claim/README.md) and - [Agent-Cloud link](https://github.com/netdata/netdata/blob/master/aclk/README.md) documentation. |
