
diff options
| author | Daniel Baumann <daniel.baumann@progress-linux.org> | 2023-02-06 16:11:30 +0000 |
|---|---|---|
| committer | Daniel Baumann <daniel.baumann@progress-linux.org> | 2023-02-06 16:11:30 +0000 |
| commit | aa2fe8ccbfcb117efa207d10229eeeac5d0f97c7 (patch) | |
| tree | 941cbdd387b41c1a81587c20a6df9f0e5e0ff7ab /docs/guides/monitor/kubernetes-k8s-netdata.md | |
| parent | Adding upstream version 1.37.1. (diff) | |
| download | netdata-aa2fe8ccbfcb117efa207d10229eeeac5d0f97c7.tar.xz netdata-aa2fe8ccbfcb117efa207d10229eeeac5d0f97c7.zip | |
Adding upstream version 1.38.0.upstream/1.38.0
Signed-off-by: Daniel Baumann <daniel.baumann@progress-linux.org>
Diffstat (limited to 'docs/guides/monitor/kubernetes-k8s-netdata.md')
| -rw-r--r-- | docs/guides/monitor/kubernetes-k8s-netdata.md | 28 |
1 files changed, 14 insertions, 14 deletions
diff --git a/docs/guides/monitor/kubernetes-k8s-netdata.md b/docs/guides/monitor/kubernetes-k8s-netdata.md index 5cfefe892..5732fc96c 100644 --- a/docs/guides/monitor/kubernetes-k8s-netdata.md +++ b/docs/guides/monitor/kubernetes-k8s-netdata.md @@ -46,7 +46,7 @@ To follow this tutorial, you need: - A free Netdata Cloud account. [Sign up](https://app.netdata.cloud/sign-up?cloudRoute=/spaces) if you don't have one already. - A working cluster running Kubernetes v1.9 or newer, with a Netdata deployment and connected parent/child nodes. See - our [Kubernetes deployment process](/packaging/installer/methods/kubernetes.md) for details on deployment and + our [Kubernetes deployment process](https://github.com/netdata/netdata/blob/master/packaging/installer/methods/kubernetes.md) for details on deployment and conneting to Cloud. - The [`kubectl`](https://kubernetes.io/docs/reference/kubectl/overview/) command line tool, within [one minor version difference](https://kubernetes.io/docs/tasks/tools/install-kubectl/#before-you-begin) of your cluster, on an @@ -104,7 +104,7 @@ To get started, [sign in](https://app.netdata.cloud/sign-in?cloudRoute=/spaces) to the War Room you connected your cluster to, if not **General**. Netdata Cloud is already visualizing your Kubernetes metrics, streamed in real-time from each node, in the -[Overview](https://learn.netdata.cloud/docs/cloud/visualize/overview): +[Overview](https://github.com/netdata/netdata/blob/master/docs/cloud/visualize/overview.md): 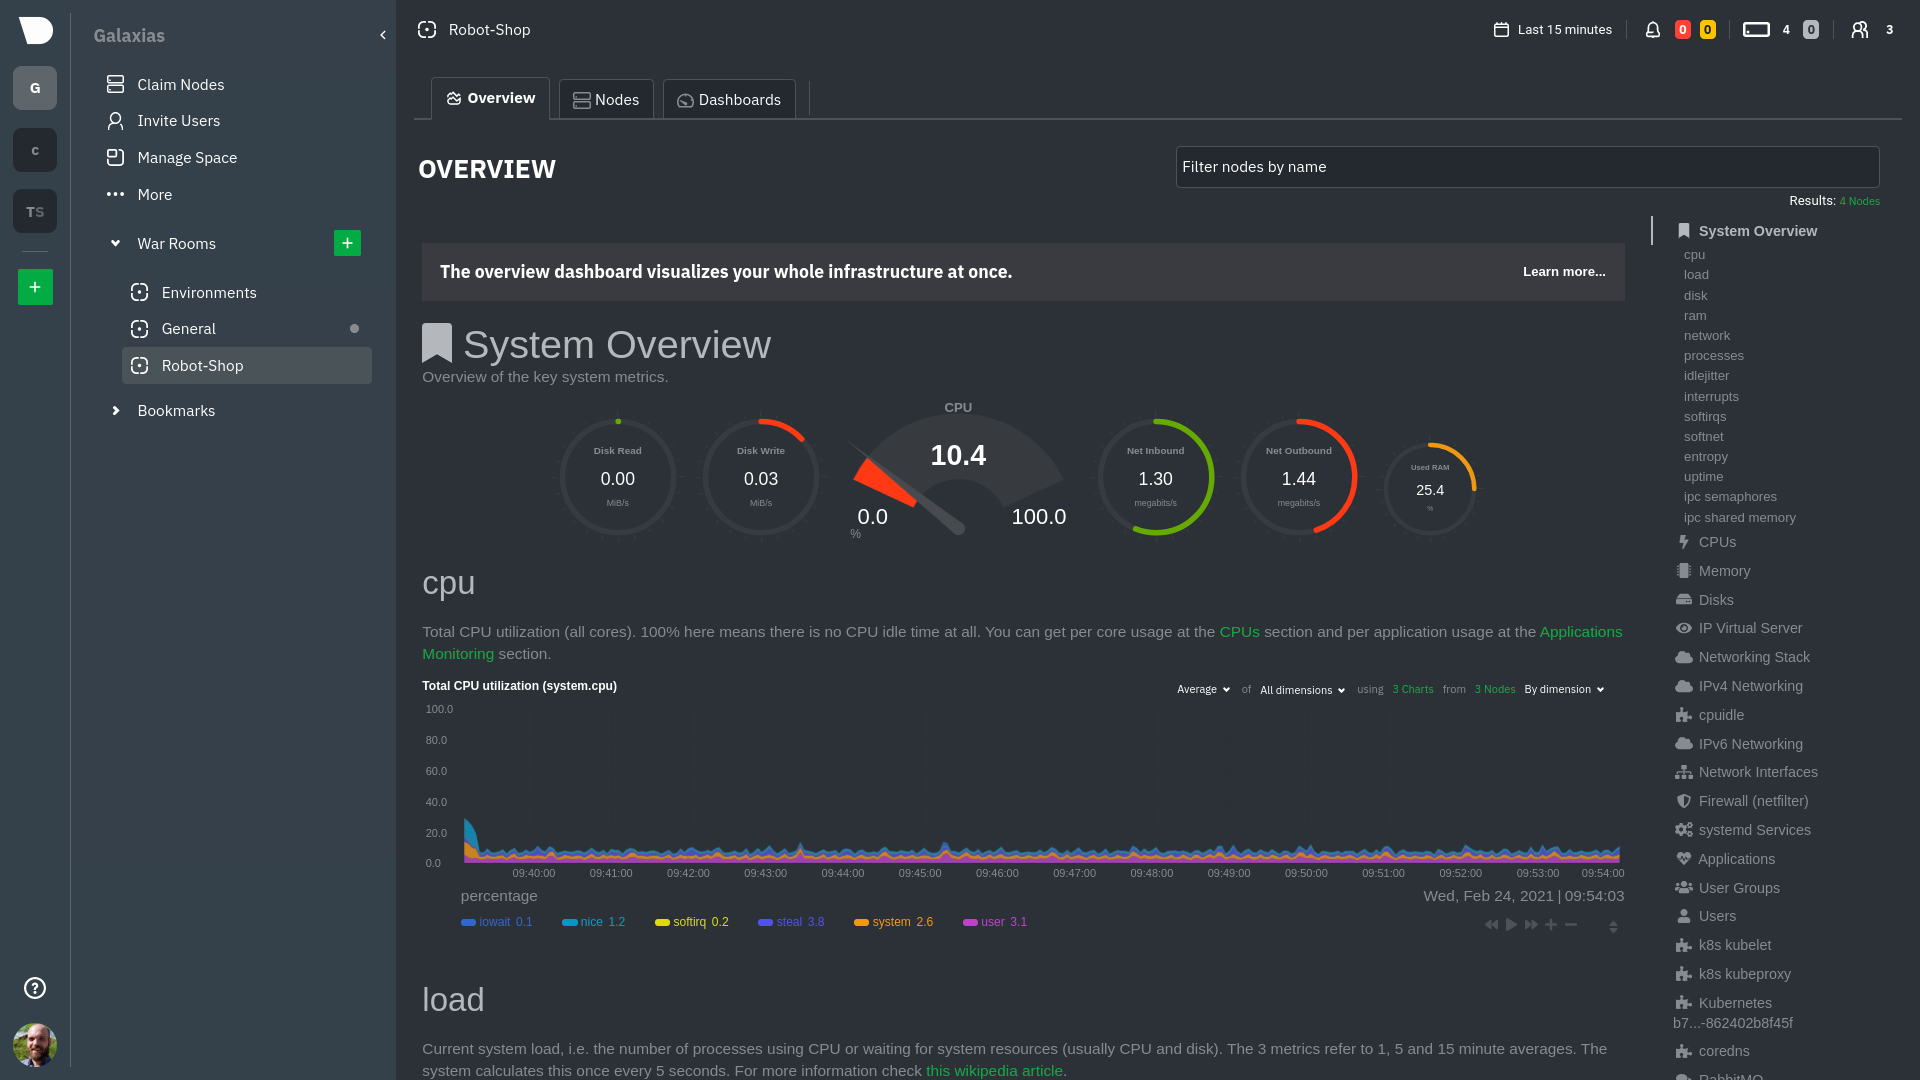 @@ -126,8 +126,8 @@ cluster](https://user-images.githubusercontent.com/1153921/109042169-19c8fa00-76 For example, the chart above shows a spike in the CPU utilization from `rabbitmq` every minute or so, along with a baseline CPU utilization of 10-15% across the cluster. -Read about the [Overview](https://learn.netdata.cloud/docs/cloud/visualize/overview) and some best practices on [viewing -an overview of your infrastructure](/docs/visualize/overview-infrastructure.md) for details on using composite charts to +Read about the [Overview](https://github.com/netdata/netdata/blob/master/docs/cloud/visualize/overview.md) and some best practices on [viewing +an overview of your infrastructure](https://github.com/netdata/netdata/blob/master/docs/visualize/overview-infrastructure.md) for details on using composite charts to drill down into per-node performance metrics. ## Pod and container metrics @@ -154,7 +154,7 @@ Let's explore the most colorful box by hovering over it. container](https://user-images.githubusercontent.com/1153921/109049544-a8417980-7695-11eb-80a7-109b4a645a27.png) The **Context** tab shows `rabbitmq-5bb66bb6c9-6xr5b` as the container's image name, which means this container is -running a [RabbitMQ](https://learn.netdata.cloud/docs/agent/collectors/go.d.plugin/modules/rabbitmq) workload. +running a [RabbitMQ](https://github.com/netdata/go.d.plugin/blob/master/modules/rabbitmq/README.md) workload. Click the **Metrics** tab to see real-time metrics from that container. Unsurprisingly, it shows a spike in CPU utilization at regular intervals. @@ -173,7 +173,7 @@ different namespaces.  -Each composite chart has a [definition bar](https://learn.netdata.cloud/docs/cloud/visualize/overview#definition-bar) +Each composite chart has a [definition bar](https://github.com/netdata/netdata/blob/master/docs/cloud/visualize/overview.md#definition-bar) for complete customization. For example, grouping the top chart by `k8s_container_name` reveals new information.  @@ -183,20 +183,20 @@ for complete customization. For example, grouping the top chart by `k8s_containe Netdata has a [service discovery plugin](https://github.com/netdata/agent-service-discovery), which discovers and creates configuration files for [compatible services](https://github.com/netdata/helmchart#service-discovery-and-supported-services) and any endpoints covered by -our [generic Prometheus collector](https://learn.netdata.cloud/docs/agent/collectors/go.d.plugin/modules/prometheus). +our [generic Prometheus collector](https://github.com/netdata/go.d.plugin/blob/master/modules/prometheus/README.md). Netdata uses these files to collect metrics from any compatible application as they run _inside_ of a pod. Service discovery happens without manual intervention as pods are created, destroyed, or moved between nodes. Service metrics show up on the Overview as well, beneath the **Kubernetes** section, and are labeled according to the service in question. For example, the **RabbitMQ** section has numerous charts from the [`rabbitmq` -collector](https://learn.netdata.cloud/docs/agent/collectors/go.d.plugin/modules/rabbitmq): +collector](https://github.com/netdata/go.d.plugin/blob/master/modules/rabbitmq/README.md):  > The robot-shop cluster has more supported services, such as MySQL, which are not visible with zero configuration. This > is usually because of services running on non-default ports, using non-default names, or required passwords. Read up -> on [configuring service discovery](/packaging/installer/methods/kubernetes.md#configure-service-discovery) to collect +> on [configuring service discovery](https://github.com/netdata/netdata/blob/master/packaging/installer/methods/kubernetes.md#configure-service-discovery) to collect > more service metrics. Service metrics are essential to infrastructure monitoring, as they're the best indicator of the end-user experience, @@ -210,7 +210,7 @@ Netdata also automatically collects metrics from two essential Kubernetes proces The **k8s kubelet** section visualizes metrics from the Kubernetes agent responsible for managing every pod on a given node. This also happens without any configuration thanks to the [kubelet -collector](https://learn.netdata.cloud/docs/agent/collectors/go.d.plugin/modules/k8s_kubelet). +collector](https://github.com/netdata/go.d.plugin/blob/master/modules/k8s_kubelet/README.md). Monitoring each node's kubelet can be invaluable when diagnosing issues with your Kubernetes cluster. For example, you can see if the number of running containers/pods has dropped, which could signal a fault or crash in a particular @@ -226,7 +226,7 @@ configuration-related errors, and the actual vs. desired numbers of volumes, plu The **k8s kube-proxy** section displays metrics about the network proxy that runs on each node in your Kubernetes cluster. kube-proxy lets pods communicate with each other and accept sessions from outside your cluster. Its metrics are collected by the [kube-proxy -collector](https://learn.netdata.cloud/docs/agent/collectors/go.d.plugin/modules/k8s_kubeproxy). +collector](https://github.com/netdata/go.d.plugin/blob/master/modules/k8s_kubeproxy/README.md). With Netdata, you can monitor how often your k8s proxies are syncing proxy rules between nodes. Dramatic changes in these figures could indicate an anomaly in your cluster that's worthy of further investigation. @@ -246,9 +246,9 @@ clusters of all sizes. - [Netdata Helm chart](https://github.com/netdata/helmchart) - [Netdata service discovery](https://github.com/netdata/agent-service-discovery) - [Netdata Agent · `kubelet` - collector](https://learn.netdata.cloud/docs/agent/collectors/go.d.plugin/modules/k8s_kubelet) + collector](https://github.com/netdata/go.d.plugin/blob/master/modules/k8s_kubelet/README.md) - [Netdata Agent · `kube-proxy` - collector](https://learn.netdata.cloud/docs/agent/collectors/go.d.plugin/modules/k8s_kubeproxy) -- [Netdata Agent · `cgroups.plugin`](/collectors/cgroups.plugin/README.md) + collector](https://github.com/netdata/go.d.plugin/blob/master/modules/k8s_kubeproxy/README.md) +- [Netdata Agent · `cgroups.plugin`](https://github.com/netdata/netdata/blob/master/collectors/cgroups.plugin/README.md) |