diff options
| author | Daniel Baumann <daniel.baumann@progress-linux.org> | 2023-02-06 16:11:30 +0000 |
|---|---|---|
| committer | Daniel Baumann <daniel.baumann@progress-linux.org> | 2023-02-06 16:11:30 +0000 |
| commit | aa2fe8ccbfcb117efa207d10229eeeac5d0f97c7 (patch) | |
| tree | 941cbdd387b41c1a81587c20a6df9f0e5e0ff7ab /docs/monitor | |
| parent | Adding upstream version 1.37.1. (diff) | |
| download | netdata-aa2fe8ccbfcb117efa207d10229eeeac5d0f97c7.tar.xz netdata-aa2fe8ccbfcb117efa207d10229eeeac5d0f97c7.zip | |
Adding upstream version 1.38.0.upstream/1.38.0
Signed-off-by: Daniel Baumann <daniel.baumann@progress-linux.org>
Diffstat (limited to 'docs/monitor')
| -rw-r--r-- | docs/monitor/configure-alarms.md | 26 | ||||
| -rw-r--r-- | docs/monitor/enable-notifications.md | 78 | ||||
| -rw-r--r-- | docs/monitor/view-active-alarms.md | 14 |
3 files changed, 65 insertions, 53 deletions
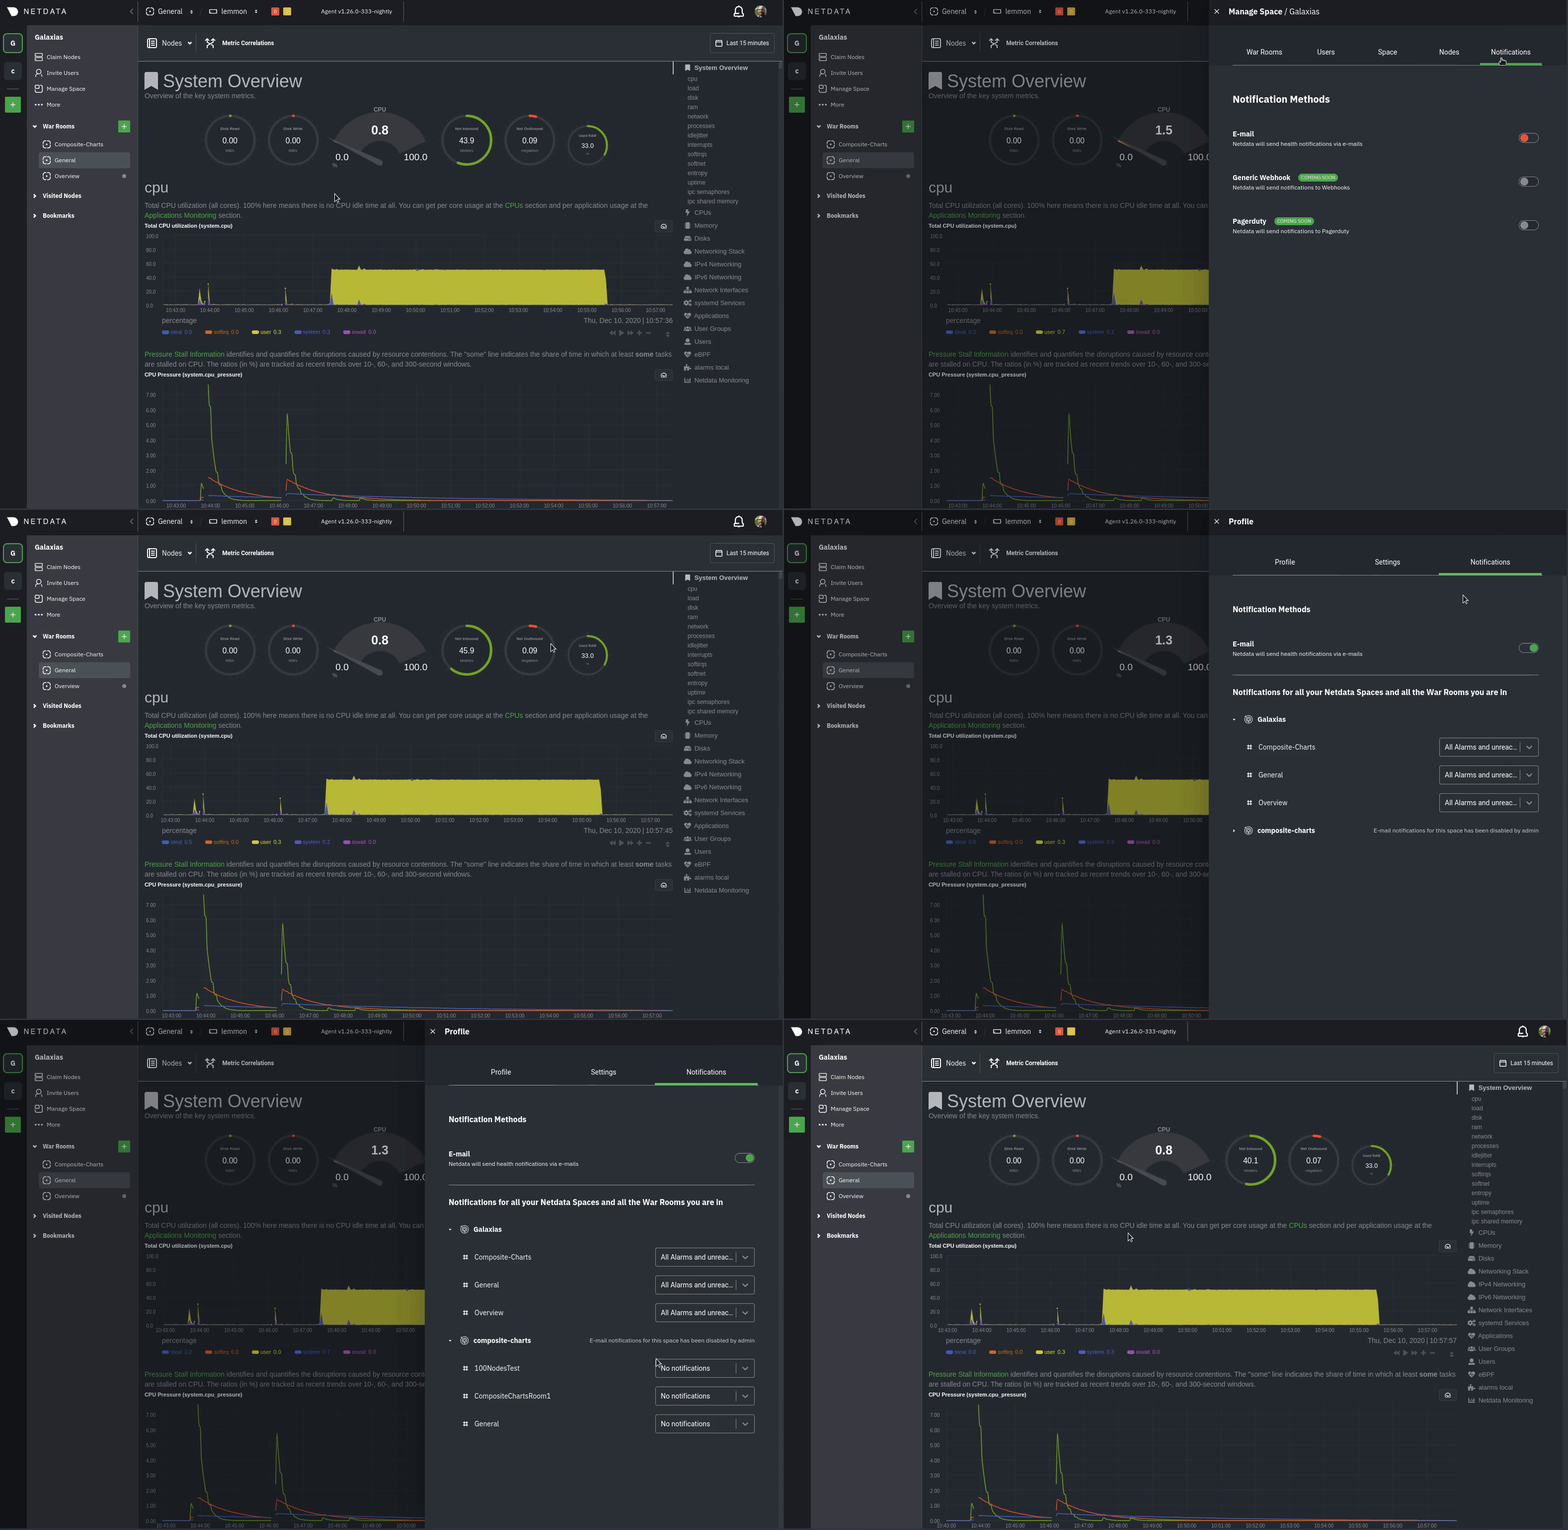
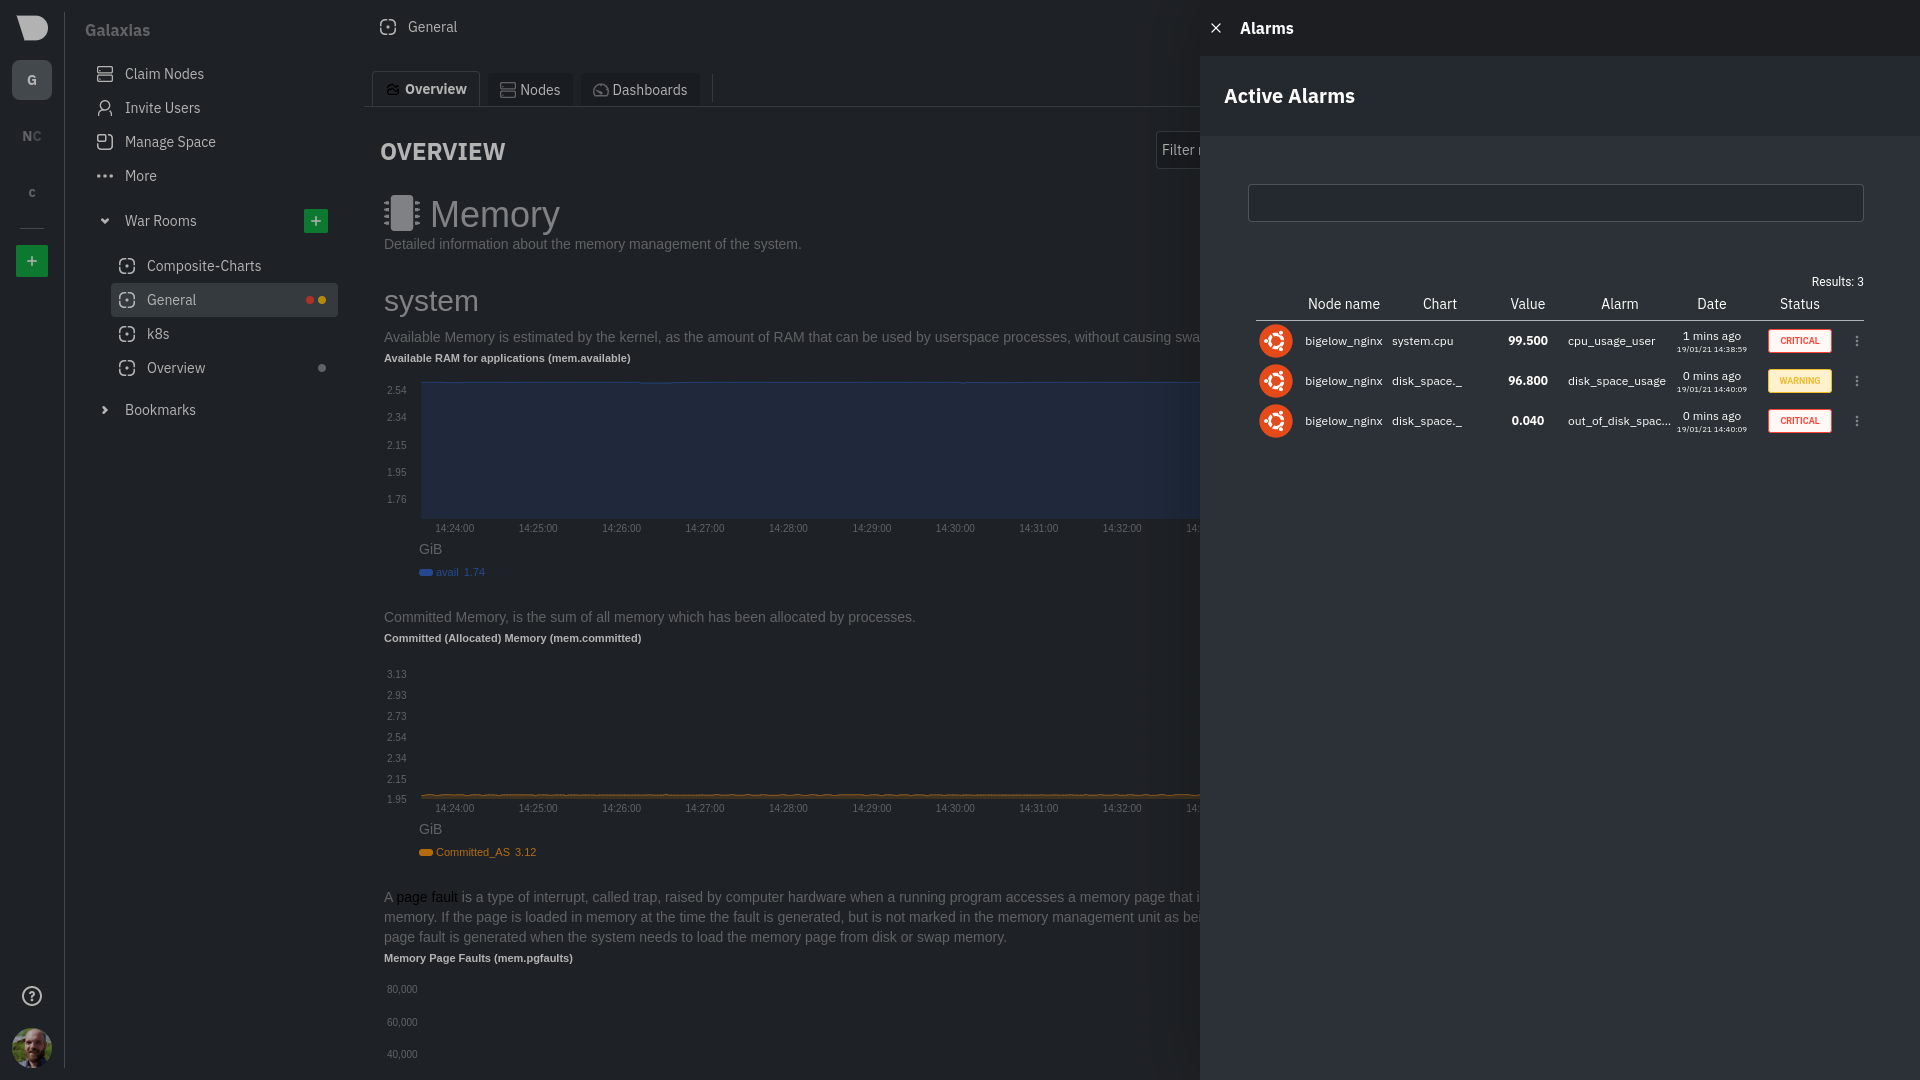
diff --git a/docs/monitor/configure-alarms.md b/docs/monitor/configure-alarms.md index ac458115..4b5b8134 100644 --- a/docs/monitor/configure-alarms.md +++ b/docs/monitor/configure-alarms.md @@ -1,7 +1,11 @@ <!-- title: "Configure health alarms" description: "Netdata's health monitoring watchdog is incredibly adaptable to your infrastructure's unique needs, with configurable health alarms." -custom_edit_url: https://github.com/netdata/netdata/edit/master/docs/monitor/configure-alarms.md +custom_edit_url: "https://github.com/netdata/netdata/edit/master/docs/monitor/configure-alarms.md" +sidebar_label: "Configure health alarms" +learn_status: "Published" +learn_topic_type: "Tasks" +learn_rel_path: "Setup" --> # Configure health alarms @@ -10,19 +14,19 @@ Netdata's health watchdog is highly configurable, with support for dynamic thres more. You can tweak any of the existing alarms based on your infrastructure's topology or specific monitoring needs, or create new entities. -You can use health alarms in conjunction with any of Netdata's [collectors](/docs/collect/how-collectors-work.md) (see -the [supported collector list](/collectors/COLLECTORS.md)) to monitor the health of your systems, containers, and +You can use health alarms in conjunction with any of Netdata's [collectors](https://github.com/netdata/netdata/blob/master/docs/collect/how-collectors-work.md) (see +the [supported collector list](https://github.com/netdata/netdata/blob/master/collectors/COLLECTORS.md)) to monitor the health of your systems, containers, and applications in real time. While you can see active alarms both on the local dashboard and Netdata Cloud, all health alarms are configured _per node_ via individual Netdata Agents. If you want to deploy a new alarm across your -[infrastructure](/docs/quickstart/infrastructure.md), you must configure each node with the same health configuration +[infrastructure](https://github.com/netdata/netdata/blob/master/docs/quickstart/infrastructure.md), you must configure each node with the same health configuration files. ## Edit health configuration files -All of Netdata's [health configuration files](/health/REFERENCE.md#health-configuration-files) are in Netdata's config -directory, inside the `health.d/` directory. Navigate to your [Netdata config directory](/docs/configure/nodes.md) and +All of Netdata's [health configuration files](https://github.com/netdata/netdata/blob/master/health/REFERENCE.md#health-configuration-files) are in Netdata's config +directory, inside the `health.d/` directory. Navigate to your [Netdata config directory](https://github.com/netdata/netdata/blob/master/docs/configure/nodes.md) and use `edit-config` to make changes to any of these files. For example, to edit the `cpu.conf` health configuration file, run: @@ -73,10 +77,10 @@ one line in a given health entity. To silence any single alarm, change the `to:` While tuning existing alarms may work in some cases, you may need to write entirely new health entities based on how your systems, containers, and applications work. -Read Netdata's [health reference](/health/REFERENCE.md#health-entity-reference) for a full listing of the format, +Read Netdata's [health reference](https://github.com/netdata/netdata/blob/master/health/REFERENCE.md#health-entity-reference) for a full listing of the format, syntax, and functionality of health entities. -To write a new health entity into a new file, navigate to your [Netdata config directory](/docs/configure/nodes.md), +To write a new health entity into a new file, navigate to your [Netdata config directory](https://github.com/netdata/netdata/blob/master/docs/configure/nodes.md), then use `touch` to create a new file in the `health.d/` directory. Use `edit-config` to start editing the file. As an example, let's create a `ram-usage.conf` file. @@ -117,7 +121,7 @@ Let's look into each of the lines to see how they create a working health entity - `every`: How often to perform the `lookup` calculation to decide whether or not to trigger this alarm. - `warn`/`crit`: The value at which Netdata should trigger a warning or critical alarm. This example uses simple syntax, but most pre-configured health entities use - [hysteresis](/health/REFERENCE.md#special-use-of-the-conditional-operator) to avoid superfluous notifications. + [hysteresis](https://github.com/netdata/netdata/blob/master/health/REFERENCE.md#special-use-of-the-conditional-operator) to avoid superfluous notifications. - `info`: A description of the alarm, which will appear in the dashboard and notifications. In human-readable format: @@ -140,9 +144,9 @@ without restarting all of Netdata, run `netdatacli reload-health` or `killall -U ## What's next? With your health entities configured properly, it's time to [enable -notifications](/docs/monitor/enable-notifications.md) to get notified whenever a node reaches a warning or critical +notifications](https://github.com/netdata/netdata/blob/master/docs/monitor/enable-notifications.md) to get notified whenever a node reaches a warning or critical state. -To build complex, dynamic alarms, read our guide on [dimension templates](/docs/guides/monitor/dimension-templates.md). +To build complex, dynamic alarms, read our guide on [dimension templates](https://github.com/netdata/netdata/blob/master/docs/guides/monitor/dimension-templates.md). diff --git a/docs/monitor/enable-notifications.md b/docs/monitor/enable-notifications.md index 438eef39..99c24b64 100644 --- a/docs/monitor/enable-notifications.md +++ b/docs/monitor/enable-notifications.md @@ -1,7 +1,11 @@ <!-- title: "Enable alarm notifications" description: "Send Netdata alarms from a centralized place with Netdata Cloud, or configure nodes individually, to enable incident response and faster resolution." -custom_edit_url: https://github.com/netdata/netdata/edit/master/docs/monitor/enable-notifications.md +custom_edit_url: "https://github.com/netdata/netdata/edit/master/docs/monitor/enable-notifications.md" +sidebar_label: "Enable alarm notifications" +learn_status: "Published" +learn_topic_type: "Tasks" +learn_rel_path: "Setup" --> # Enable alarm notifications @@ -10,7 +14,7 @@ Netdata offers two ways to receive alarm notifications on external platforms. Th parallel, which means you can enable both at the same time to send alarm notifications to any number of endpoints. Both methods use a node's health alarms to generate the content of alarm notifications. Read the doc on [configuring -alarms](/docs/monitor/configure-alarms.md) to change the preconfigured thresholds or to create tailored alarms for your +alarms](https://github.com/netdata/netdata/blob/master/docs/monitor/configure-alarms.md) to change the preconfigured thresholds or to create tailored alarms for your infrastructure. Netdata Cloud offers [centralized alarm notifications](#netdata-cloud) via email, which leverages the health status @@ -26,7 +30,7 @@ response process. ## Netdata Cloud Netdata Cloud's [centralized alarm -notifications](https://learn.netdata.cloud/docs/cloud/alerts-notifications/notifications) is a zero-configuration way to +notifications](https://github.com/netdata/netdata/blob/master/docs/cloud/alerts-notifications/notifications.mdx) is a zero-configuration way to get notified when an anomaly or incident strikes any node or application in your infrastructure. The advantage of using centralized alarm notifications from Netdata Cloud is that you don't have to worry about configuring each node in your infrastructure. @@ -41,13 +45,13 @@ choose what types of notifications to receive from each War Room.  -See the [centralized alarm notifications](https://learn.netdata.cloud/docs/cloud/alerts-notifications/notifications) +See the [centralized alarm notifications](https://github.com/netdata/netdata/blob/master/docs/cloud/alerts-notifications/notifications.mdx) reference doc for further details about what information is conveyed in an email notification, flood protection, and more. ## Netdata Agent -The Netdata Agent's [notification system](/health/notifications/README.md) runs on every node and dispatches +The Netdata Agent's [notification system](https://github.com/netdata/netdata/blob/master/health/notifications/README.md) runs on every node and dispatches notifications based on configured endpoints and roles. You can enable multiple endpoints on any one node _and_ use Agent notifications in parallel with centralized alarm notifications in Netdata Cloud. @@ -59,33 +63,33 @@ notification platform. ### Supported notification endpoints -- [**alerta.io**](/health/notifications/alerta/README.md) -- [**Amazon SNS**](/health/notifications/awssns/README.md) -- [**Custom endpoint**](/health/notifications/custom/README.md) -- [**Discord**](/health/notifications/discord/README.md) -- [**Dynatrace**](/health/notifications/dynatrace/README.md) -- [**Email**](/health/notifications/email/README.md) -- [**Flock**](/health/notifications/flock/README.md) -- [**Google Hangouts**](/health/notifications/hangouts/README.md) -- [**Gotify**](/health/notifications/gotify/README.md) -- [**IRC**](/health/notifications/irc/README.md) -- [**Kavenegar**](/health/notifications/kavenegar/README.md) -- [**Matrix**](/health/notifications/matrix/README.md) -- [**Messagebird**](/health/notifications/messagebird/README.md) -- [**Microsoft Teams**](/health/notifications/msteams/README.md) -- [**Netdata Agent dashboard**](/health/notifications/web/README.md) -- [**Opsgenie**](/health/notifications/opsgenie/README.md) -- [**PagerDuty**](/health/notifications/pagerduty/README.md) -- [**Prowl**](/health/notifications/prowl/README.md) -- [**PushBullet**](/health/notifications/pushbullet/README.md) -- [**PushOver**](/health/notifications/pushover/README.md) -- [**Rocket.Chat**](/health/notifications/rocketchat/README.md) -- [**Slack**](/health/notifications/slack/README.md) -- [**SMS Server Tools 3**](/health/notifications/smstools3/README.md) -- [**StackPulse**](/health/notifications/stackpulse/README.md) -- [**Syslog**](/health/notifications/syslog/README.md) -- [**Telegram**](/health/notifications/telegram/README.md) -- [**Twilio**](/health/notifications/twilio/README.md) +- [**alerta.io**](https://github.com/netdata/netdata/blob/master/health/notifications/alerta/README.md) +- [**Amazon SNS**](https://github.com/netdata/netdata/blob/master/health/notifications/awssns/README.md) +- [**Custom endpoint**](https://github.com/netdata/netdata/blob/master/health/notifications/custom/README.md) +- [**Discord**](https://github.com/netdata/netdata/blob/master/health/notifications/discord/README.md) +- [**Dynatrace**](https://github.com/netdata/netdata/blob/master/health/notifications/dynatrace/README.md) +- [**Email**](https://github.com/netdata/netdata/blob/master/health/notifications/email/README.md) +- [**Flock**](https://github.com/netdata/netdata/blob/master/health/notifications/flock/README.md) +- [**Google Hangouts**](https://github.com/netdata/netdata/blob/master/health/notifications/hangouts/README.md) +- [**Gotify**](https://github.com/netdata/netdata/blob/master/health/notifications/gotify/README.md) +- [**IRC**](https://github.com/netdata/netdata/blob/master/health/notifications/irc/README.md) +- [**Kavenegar**](https://github.com/netdata/netdata/blob/master/health/notifications/kavenegar/README.md) +- [**Matrix**](https://github.com/netdata/netdata/blob/master/health/notifications/matrix/README.md) +- [**Messagebird**](https://github.com/netdata/netdata/blob/master/health/notifications/messagebird/README.md) +- [**Microsoft Teams**](https://github.com/netdata/netdata/blob/master/health/notifications/msteams/README.md) +- [**Netdata Agent dashboard**](https://github.com/netdata/netdata/blob/master/health/notifications/web/README.md) +- [**Opsgenie**](https://github.com/netdata/netdata/blob/master/health/notifications/opsgenie/README.md) +- [**PagerDuty**](https://github.com/netdata/netdata/blob/master/health/notifications/pagerduty/README.md) +- [**Prowl**](https://github.com/netdata/netdata/blob/master/health/notifications/prowl/README.md) +- [**PushBullet**](https://github.com/netdata/netdata/blob/master/health/notifications/pushbullet/README.md) +- [**PushOver**](https://github.com/netdata/netdata/blob/master/health/notifications/pushover/README.md) +- [**Rocket.Chat**](https://github.com/netdata/netdata/blob/master/health/notifications/rocketchat/README.md) +- [**Slack**](https://github.com/netdata/netdata/blob/master/health/notifications/slack/README.md) +- [**SMS Server Tools 3**](https://github.com/netdata/netdata/blob/master/health/notifications/smstools3/README.md) +- [**StackPulse**](https://github.com/netdata/netdata/blob/master/health/notifications/stackpulse/README.md) +- [**Syslog**](https://github.com/netdata/netdata/blob/master/health/notifications/syslog/README.md) +- [**Telegram**](https://github.com/netdata/netdata/blob/master/health/notifications/telegram/README.md) +- [**Twilio**](https://github.com/netdata/netdata/blob/master/health/notifications/twilio/README.md) ### Enable Slack notifications @@ -95,7 +99,7 @@ want to see alarm notifications from Netdata. Click the green **Add to Slack** b On the following page, you'll receive a **Webhook URL**. That's what you'll need to configure Netdata, so keep it handy. -Navigate to your [Netdata config directory](/docs/configure/nodes.md#the-netdata-config-directory) and use `edit-config` to +Navigate to your [Netdata config directory](https://github.com/netdata/netdata/blob/master/docs/configure/nodes.md#the-netdata-config-directory) and use `edit-config` to open the `health_alarm_notify.conf` file: ```bash @@ -130,7 +134,7 @@ Next, run the `alarm-notify` script using the `test` option. You should receive three notifications in your Slack channel for each health status change: `WARNING`, `CRITICAL`, and `CLEAR`. -See the [Agent Slack notifications](/health/notifications/slack/README.md) doc for more options and information. +See the [Agent Slack notifications](https://github.com/netdata/netdata/blob/master/health/notifications/slack/README.md) doc for more options and information. ## What's next? @@ -138,10 +142,10 @@ Now that you have health entities configured to your infrastructure's needs and or incidents, your health monitoring setup is complete. To make your dashboards most useful during root cause analysis, use Netdata's [distributed data -architecture](/docs/store/distributed-data-architecture.md) for the best-in-class performance and scalability. +architecture](https://github.com/netdata/netdata/blob/master/docs/store/distributed-data-architecture.md) for the best-in-class performance and scalability. ### Related reference documentation -- [Netdata Cloud · Alarm notifications](https://learn.netdata.cloud/docs/cloud/alerts-notifications/notifications) -- [Netdata Agent · Notifications](/health/notifications/README.md) +- [Netdata Cloud · Alarm notifications](https://github.com/netdata/netdata/blob/master/docs/cloud/alerts-notifications/notifications.mdx) +- [Netdata Agent · Notifications](https://github.com/netdata/netdata/blob/master/health/notifications/README.md) diff --git a/docs/monitor/view-active-alarms.md b/docs/monitor/view-active-alarms.md index be218268..07c22fe1 100644 --- a/docs/monitor/view-active-alarms.md +++ b/docs/monitor/view-active-alarms.md @@ -1,7 +1,11 @@ <!-- title: "View active health alarms" description: "View active alarms and their rich data to discover and resolve anomalies and performance issues across your infrastructure." -custom_edit_url: https://github.com/netdata/netdata/edit/master/docs/monitor/view-active-alarms.md +custom_edit_url: "https://github.com/netdata/netdata/edit/master/docs/monitor/view-active-alarms.md" +sidebar_label: "View active health alarms" +learn_status: "Published" +learn_topic_type: "Concepts" +learn_rel_path: "Operations/Alerts" --> # View active health alarms @@ -14,7 +18,7 @@ performance issue affects your node or the applications it runs. A War Room's [alarms indicator](https://learn.netdata.cloud/docs/cloud/war-rooms#indicators) displays the number of active `critical` (red) and `warning` (yellow) alerts for the nodes in this War Room. Click on either the critical or warning badges to open a pre-filtered modal displaying only those types of [active -alarms](https://learn.netdata.cloud/docs/cloud/alerts-notifications/view-active-alerts). +alarms](https://github.com/netdata/netdata/blob/master/docs/cloud/alerts-notifications/view-active-alerts.mdx).  @@ -61,15 +65,15 @@ With the three icons beneath that and the **role** designation, you can: 3. Copy the code to embed the badge onto another web page using an `<embed>` element. The table on the right-hand side displays information about the health entity that triggered the alarm, which you can -use as a reference to [configure alarms](/docs/monitor/configure-alarms.md). +use as a reference to [configure alarms](https://github.com/netdata/netdata/blob/master/docs/monitor/configure-alarms.md). ## What's next? With the information that appears on Netdata Cloud and the local dashboard about active alarms, you can [configure -alarms](/docs/monitor/configure-alarms.md) to match your infrastructure's needs or your team's goals. +alarms](https://github.com/netdata/netdata/blob/master/docs/monitor/configure-alarms.md) to match your infrastructure's needs or your team's goals. If you're happy with the pre-configured alarms, skip ahead to [enable -notifications](/docs/monitor/enable-notifications.md) to use Netdata Cloud's centralized alarm notifications and/or +notifications](https://github.com/netdata/netdata/blob/master/docs/monitor/enable-notifications.md) to use Netdata Cloud's centralized alarm notifications and/or per-node notifications to endpoints like Slack, PagerDuty, Twilio, and more. |
