
diff options
| author | Daniel Baumann <daniel.baumann@progress-linux.org> | 2021-02-07 11:49:00 +0000 |
|---|---|---|
| committer | Daniel Baumann <daniel.baumann@progress-linux.org> | 2021-02-07 12:42:05 +0000 |
| commit | 2e85f9325a797977eea9dfea0a925775ddd211d9 (patch) | |
| tree | 452c7f30d62fca5755f659b99e4e53c7b03afc21 /docs/tutorials | |
| parent | Releasing debian version 1.19.0-4. (diff) | |
| download | netdata-2e85f9325a797977eea9dfea0a925775ddd211d9.tar.xz netdata-2e85f9325a797977eea9dfea0a925775ddd211d9.zip | |
Merging upstream version 1.29.0.
Signed-off-by: Daniel Baumann <daniel.baumann@progress-linux.org>
Diffstat (limited to 'docs/tutorials')
| -rw-r--r-- | docs/tutorials/dimension-templates.md | 171 | ||||
| -rw-r--r-- | docs/tutorials/longer-metrics-storage.md | 158 | ||||
| -rw-r--r-- | docs/tutorials/monitor-hadoop-cluster.md | 199 |
3 files changed, 0 insertions, 528 deletions
diff --git a/docs/tutorials/dimension-templates.md b/docs/tutorials/dimension-templates.md deleted file mode 100644 index 741a8d70d..000000000 --- a/docs/tutorials/dimension-templates.md +++ /dev/null @@ -1,171 +0,0 @@ -# Use dimension templates to create dynamic alarms - -Your ability to monitor the health of your systems and applications relies on your ability to create and maintain -the best set of alarms for your particular needs. - -In v1.18 of Netdata, we introduced **dimension templates** for alarms, which simplifies the process of writing [alarm -entities](../../health/README.md#entities-in-the-health-files) for charts with many dimensions. - -Dimension templates can condense many individual entities into one—no more copy-pasting one entity and changing the -`alarm`/`template` and `lookup` lines for each dimension you'd like to monitor. - -They are, however, an advanced health monitoring feature. For more basic instructions on creating your first alarm, -check out our [health monitoring documentation](../../health/), which also includes -[examples](../../health/README.md#examples). - -## The fundamentals of `foreach` - -Our dimension templates update creates a new `foreach` parameter to the existing [`lookup` -line](../../health/README.md#alarm-line-lookup). This is where the magic happens. - -You use the `foreach` parameter to specify which dimensions you want to monitor with this single alarm. You can separate -them with a comma (`,`) or a pipe (`|`). You can also use a [Netdata simple pattern](../../libnetdata/simple_pattern/README.md) -to create many alarms with a regex-like syntax. - -The `foreach` parameter _has_ to be the last parameter in your `lookup` line, and if you have both `of` and `foreach` in -the same `lookup` line, Netdata will ignore the `of` parameter and use `foreach` instead. - -Let's get into some examples so you can see how the new parameter works. - -> ⚠️ The following entities are examples to showcase the functionality and syntax of dimension templates. They are not -> meant to be run as-is on production systems. - -## Condensing entities with `foreach` - -Let's say you want to monitor the `system`, `user`, and `nice` dimensions in your system's overall CPU utilization. -Before dimension templates, you would need the following three entities: - -```yaml - alarm: cpu_system - on: system.cpu -lookup: average -10m percentage of system - every: 1m - warn: $this > 50 - crit: $this > 80 - - alarm: cpu_user - on: system.cpu -lookup: average -10m percentage of user - every: 1m - warn: $this > 50 - crit: $this > 80 - - alarm: cpu_nice - on: system.cpu -lookup: average -10m percentage of nice - every: 1m - warn: $this > 50 - crit: $this > 80 -``` - -With dimension templates, you can condense these into a single alarm. Take note of the `alarm` and `lookup` lines. - -```yaml - alarm: cpu_template - on: system.cpu -lookup: average -10m percentage foreach system,user,nice - every: 1m - warn: $this > 50 - crit: $this > 80 -``` - -The `alarm` line specifies the naming scheme Netdata will use. You can use whatever naming scheme you'd like, with `.` -and `_` being the only allowed symbols. - -The `lookup` line has changed from `of` to `foreach`, and we're now passing three dimensions. - -In this example, Netdata will create three alarms with the names `cpu_template_system`, `cpu_template_user`, and -`cpu_template_nice`. Every minute, each alarm will use the same database query to calculate the average CPU usage for -the `system`, `user`, and `nice` dimensions over the last 10 minutes and send out alarms if necessary. - -You can find these three alarms active by clicking on the **Alarms** button in the top navigation, and then clicking on -the **All** tab and scrolling to the **system - cpu** collapsible section. - -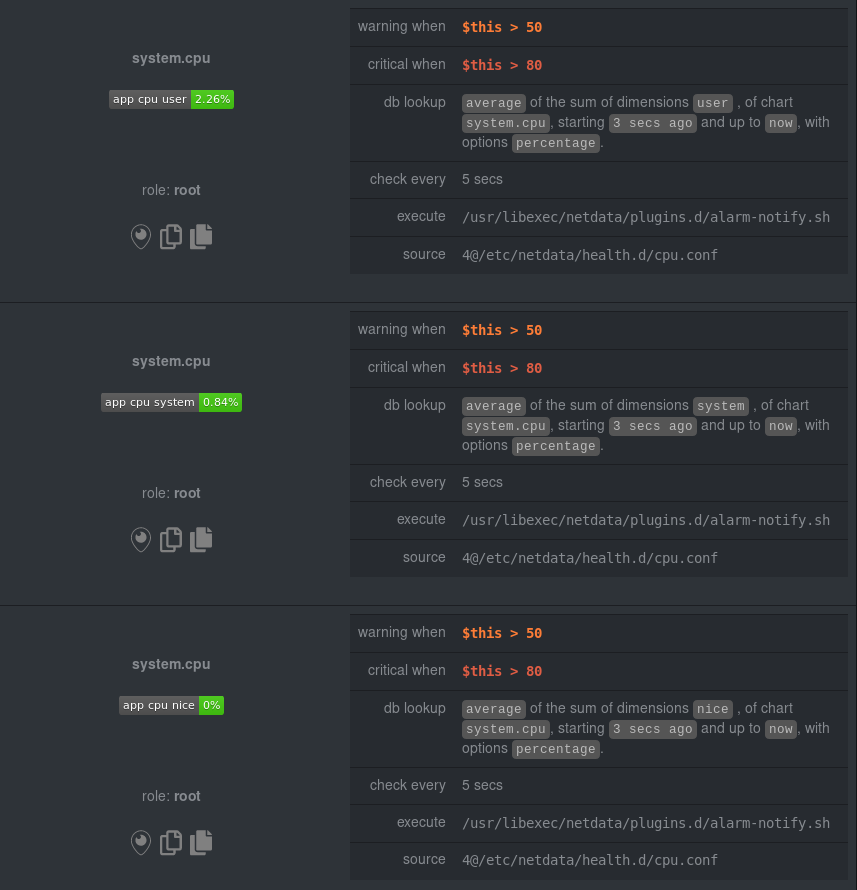 - -Let's look at some other examples of how `foreach` works so you can best apply it in your configurations. - -### Using a Netdata simple pattern in `foreach` - -In the last example, we used `foreach system,user,nice` to create three distinct alarms using dimension templates. But -what if you want to quickly create alarms for _all_ the dimensions of a given chart? - -Use a [simple pattern](../../libnetdata/simple_pattern/README.md)! One example of a simple pattern is a single wildcard -(`*`). - -Instead of monitoring system CPU usage, let's monitor per-application CPU usage using the `apps.cpu` chart. Passing a -wildcard as the simple pattern tells Netdata to create a separate alarm for _every_ process on your system: - -```yaml - alarm: app_cpu - on: apps.cpu -lookup: average -10m percentage foreach * - every: 1m - warn: $this > 50 - crit: $this > 80 -``` - -This entity will now create alarms for every dimension in the `apps.cpu` chart. Given that most `apps.cpu` charts have -10 or more dimensions, using the wildcard ensures you catch every CPU-hogging process. - -To learn more about how to use simple patterns with dimension templates, see our [simple patterns -documentation](../../libnetdata/simple_pattern/README.md). - -## Using `foreach` with alarm templates - -Dimension templates also work with [alarm templates](../../health/README.md#entities-in-the-health-files). Alarm -templates help you create alarms for all the charts with a given context—for example, all the cores of your system's -CPU. - -By combining the two, you can create dozens of individual alarms with a single template entity. Here's how you would -create alarms for the `system`, `user`, and `nice` dimensions for every chart in the `cpu.cpu` context—or, in other -words, every CPU core. - -```yaml -template: cpu_template - on: cpu.cpu - lookup: average -10m percentage foreach system,user,nice - every: 1m - warn: $this > 50 - crit: $this > 80 -``` - -On a system with a 6-core, 12-thread Ryzen 5 1600 CPU, this one entity creates alarms on the following charts and -dimensions: - -- `cpu.cpu0` - - `cpu_template_user` - - `cpu_template_system` - - `cpu_template_nice` -- `cpu.cpu1` - - `cpu_template_user` - - `cpu_template_system` - - `cpu_template_nice` -- `cpu.cpu2` - - `cpu_template_user` - - `cpu_template_system` - - `cpu_template_nice` -- ... -- `cpu.cpu11` - - `cpu_template_user` - - `cpu_template_system` - - `cpu_template_nice` - -And how just a few of those dimension template-generated alarms look like in the Netdata dashboard. - -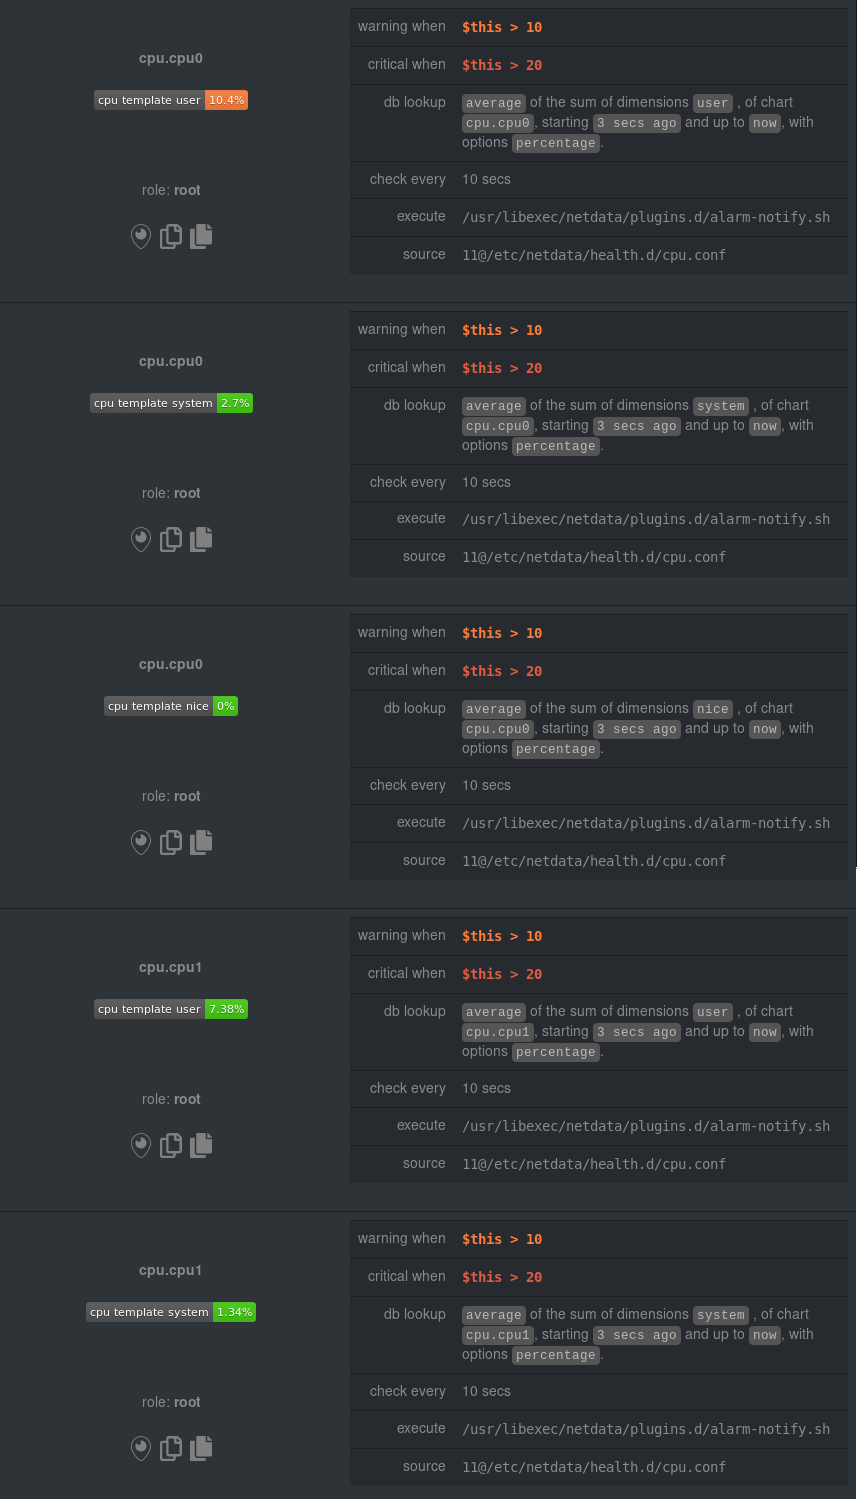 - -All in all, this single entity creates 36 individual alarms. Much easier than writing 36 separate entities in your -health configuration files! - -## What's next? - -We hope you're excited about the possibilities of using dimension templates! Maybe they'll inspire you to build new -alarms that will help you better monitor the health of your systems. - -Or, at the very least, simplify your configuration files. - -For information about other advanced features in Netdata's health monitoring toolkit, check out our [health -documentation](../../health/). And if you have some cool alarms you built using dimension templates, - -[](<>) diff --git a/docs/tutorials/longer-metrics-storage.md b/docs/tutorials/longer-metrics-storage.md deleted file mode 100644 index fb64ca01e..000000000 --- a/docs/tutorials/longer-metrics-storage.md +++ /dev/null @@ -1,158 +0,0 @@ -# Change how long Netdata stores metrics - -Netdata helps you collect thousands of system and application metrics every second, but what about storing them for the -long term? - -Many people think Netdata can only store about an hour's worth of real-time metrics, but that's just the default -configuration today. With the right settings, Netdata is quite capable of efficiently storing hours or days worth of -historical, per-second metrics without having to rely on a [backend](../../backends/). - -This tutorial gives two options for configuring Netdata to store more metrics. **We recommend the default [database -engine](#using-the-database-engine)**, but you can stick with or switch to the round-robin database if you prefer. - -Let's get started. - -## Using the database engine - -The database engine uses RAM to store recent metrics while also using a "spill to disk" feature that takes advantage of -available disk space for long-term metrics storage. This feature of the database engine allows you to store a much -larger dataset than your system's available RAM. - -The database engine is currently the default method of storing metrics, but if you're not sure which database you're -using, check out your `netdata.conf` file and look for the `memory mode` setting: - -```conf -[global] - memory mode = dbengine -``` - -If `memory mode` is set to anything but `dbengine`, change it and restart Netdata using the standard command for -restarting services on your system. You're now using the database engine! - -> Learn more about how we implemented the database engine, and our vision for its future, on our blog: [_How and why -> we're bringing long-term storage to Netdata_](https://blog.netdata.cloud/posts/db-engine/). - -What makes the database engine efficient? While it's structured like a traditional database, the database engine splits -data between RAM and disk. The database engine caches and indexes data on RAM to keep memory usage low, and then -compresses older metrics onto disk for long-term storage. - -When the Netdata dashboard queries for historical metrics, the database engine will use its cache, stored in RAM, to -return relevant metrics for visualization in charts. - -Now, given that the database engine uses _both_ RAM and disk, there are two other settings to consider: `page cache -size` and `dbengine disk space`. - -```conf -[global] - page cache size = 32 - dbengine disk space = 256 -``` - -`page cache size` sets the maximum amount of RAM (in MiB) the database engine will use for caching and indexing. -`dbengine disk space` sets the maximum disk space (again, in MiB) the database engine will use for storing compressed -metrics. - -Based on our testing, these default settings will retain about a day's worth of metrics when Netdata collects roughly -4,000 metrics every second. If you increase either `page cache size` or `dbengine disk space`, Netdata will retain even -more historical metrics. - -But before you change these options too dramatically, read up on the [database engine's memory -footprint](../../database/engine/README.md#memory-requirements). - -With the database engine active, you can back up your `/var/cache/netdata/dbengine/` folder to another location for -redundancy. - -Now that you know how to switch to the database engine, let's cover the default round-robin database for those who -aren't ready to make the move. - -## Using the round-robin database - -In previous versions, Netdata used a round-robin database to store 1 hour of per-second metrics. - -To see if you're still using this database, or if you would like to switch to it, open your `netdata.conf` file and see -if `memory mode` option is set to `save`. - -```conf -[global] - memory mode = save -``` - -If `memory mode` is set to `save`, then you're using the round-robin database. If so, the `history` option is set to -`3600`, which is the equivalent to 3,600 seconds, or one hour. - -To increase your historical metrics, you can increase `history` to the number of seconds you'd like to store: - -```conf -[global] - # 2 hours = 2 * 60 * 60 = 7200 seconds - history = 7200 - # 4 hours = 4 * 60 * 60 = 14440 seconds - history = 14440 - # 24 hours = 24 * 60 * 60 = 86400 seconds - history = 86400 -``` - -And so on. - -Next, check to see how many metrics Netdata collects on your system, and how much RAM that uses. Visit the Netdata -dashboard and look at the bottom-right corner of the interface. You'll find a sentence similar to the following: - -> Every second, Netdata collects 1,938 metrics, presents them in 299 charts and monitors them with 81 alarms. Netdata is -> using 25 MB of memory on **netdata-linux** for 1 hour, 6 minutes and 36 seconds of real-time history. - -On this desktop system, using a Ryzen 5 1600 and 16GB of RAM, the round-robin databases uses 25 MB of RAM to store just -over an hour's worth of data for nearly 2,000 metrics. - -To increase the `history` option, you need to edit your `netdata.conf` file and increase the `history` setting. In most -installations, you'll find it at `/etc/netdata/netdata.conf`, but some operating systems place it at -`/opt/netdata/etc/netdata/netdata.conf`. - -Use `/etc/netdata/edit-config netdata.conf`, or your favorite text editor, to replace `3600` with the number of seconds -you'd like to store. - -You should base this number on two things: How much history you need for your use case, and how much RAM you're willing -to dedicate to Netdata. - -> Take care when you change the `history` option on production systems. Netdata is configured to stop its process if -> your system starts running out of RAM, but you can never be too careful. Out of memory situations are very bad. - -How much RAM will a longer history use? Let's use a little math. - -The round-robin database needs 4 bytes for every value Netdata collects. If Netdata collects metrics every second, -that's 4 bytes, per second, per metric. - -```text -4 bytes * X seconds * Y metrics = RAM usage in bytes -``` - -Let's assume your system collects 1,000 metrics per second. - -```text -4 bytes * 3600 seconds * 1,000 metrics = 14400000 bytes = 14.4 MB RAM -``` - -With that formula, you can calculate the RAM usage for much larger history settings. - -```conf -# 2 hours at 1,000 metrics per second -4 bytes * 7200 seconds * 1,000 metrics = 28800000 bytes = 28.8 MB RAM -# 2 hours at 2,000 metrics per second -4 bytes * 7200 seconds * 2,000 metrics = 57600000 bytes = 57.6 MB RAM -# 4 hours at 2,000 metrics per second -4 bytes * 14440 seconds * 2,000 metrics = 115520000 bytes = 115.52 MB RAM -# 24 hours at 1,000 metrics per second -4 bytes * 86400 seconds * 1,000 metrics = 345600000 bytes = 345.6 MB RAM -``` - -## What's next? - -Now that you have either configured database engine or round-robin database engine to store more metrics, you'll -probably want to see it in action! - -For more information about how to pan charts to view historical metrics, see our documentation on [using -charts](../../web/README.md#using-charts). - -And if you'd now like to reduce Netdata's resource usage, view our [performance guide](../../docs/Performance.md) for -our best practices on optimization. - -[](<>) diff --git a/docs/tutorials/monitor-hadoop-cluster.md b/docs/tutorials/monitor-hadoop-cluster.md deleted file mode 100644 index f5f3315ad..000000000 --- a/docs/tutorials/monitor-hadoop-cluster.md +++ /dev/null @@ -1,199 +0,0 @@ -# Monitor a Hadoop cluster with Netdata - -Hadoop is an [Apache project](https://hadoop.apache.org/) is a framework for processing large sets of data across a -distributed cluster of systems. - -And while Hadoop is designed to be a highly-available and fault-tolerant service, those who operate a Hadoop cluster -will want to monitor the health and performance of their [Hadoop Distributed File System -(HDFS)](https://hadoop.apache.org/docs/r1.2.1/hdfs_design.html) and [Zookeeper](https://zookeeper.apache.org/) -implementations. - -Netdata comes with built-in and pre-configured support for monitoring both HDFS and Zookeeper. - -This tutorial assumes you have a Hadoop cluster, with HDFS and Zookeeper, running already. If you don't, please follow -the [official Hadoop -instructions](http://hadoop.apache.org/docs/stable/hadoop-project-dist/hadoop-common/SingleCluster.html) or an -alternative, like the guide available from -[DigitalOcean](https://www.digitalocean.com/community/tutorials/how-to-install-hadoop-in-stand-alone-mode-on-ubuntu-18-04). - -For more specifics on the collection modules used in this tutorial, read the respective pages in our documentation: - -- [HDFS](../../collectors/go.d.plugin/modules/hdfs/README.md) -- [Zookeeper](../../collectors/go.d.plugin/modules/zookeeper/README.md) - -## Set up your HDFS and Zookeeper installations - -As with all data sources, Netdata can auto-detect HDFS and Zookeeper nodes if you installed them using the standard -installation procedure. - -For Netdata to collect HDFS metrics, it needs to be able to access the node's `/jmx` endpoint. You can test whether an -JMX endpoint is accessible by using `curl HDFS-IP:PORT/jmx`. For a NameNode, you should see output similar to the -following: - -```json -{ - "beans" : [ { - "name" : "Hadoop:service=NameNode,name=JvmMetrics", - "modelerType" : "JvmMetrics", - "MemNonHeapUsedM" : 65.67851, - "MemNonHeapCommittedM" : 67.3125, - "MemNonHeapMaxM" : -1.0, - "MemHeapUsedM" : 154.46341, - "MemHeapCommittedM" : 215.0, - "MemHeapMaxM" : 843.0, - "MemMaxM" : 843.0, - "GcCount" : 15, - "GcTimeMillis" : 305, - "GcNumWarnThresholdExceeded" : 0, - "GcNumInfoThresholdExceeded" : 0, - "GcTotalExtraSleepTime" : 92, - "ThreadsNew" : 0, - "ThreadsRunnable" : 6, - "ThreadsBlocked" : 0, - "ThreadsWaiting" : 7, - "ThreadsTimedWaiting" : 34, - "ThreadsTerminated" : 0, - "LogFatal" : 0, - "LogError" : 0, - "LogWarn" : 2, - "LogInfo" : 348 - }, - { ... } - ] -} -``` - -The JSON result for a DataNode's `/jmx` endpoint is slightly different: - -```json -{ - "beans" : [ { - "name" : "Hadoop:service=DataNode,name=DataNodeActivity-dev-slave-01.dev.loc -al-9866", - "modelerType" : "DataNodeActivity-dev-slave-01.dev.local-9866", - "tag.SessionId" : null, - "tag.Context" : "dfs", - "tag.Hostname" : "dev-slave-01.dev.local", - "BytesWritten" : 500960407, - "TotalWriteTime" : 463, - "BytesRead" : 80689178, - "TotalReadTime" : 41203, - "BlocksWritten" : 16, - "BlocksRead" : 16, - "BlocksReplicated" : 4, - ... - }, - { ... } - ] -} -``` - -If Netdata can't access the `/jmx` endpoint for either a NameNode or DataNode, it will not be able to auto-detect and -collect metrics from your HDFS implementation. - -Zookeeper auto-detection relies on an accessible client port and a whitelisted `mntr` command. For more details on -`mntr`, see Zookeeper's documentation on [cluster -options](https://zookeeper.apache.org/doc/current/zookeeperAdmin.html#sc_clusterOptions) and [Zookeeper -commands](https://zookeeper.apache.org/doc/current/zookeeperAdmin.html#sc_zkCommands). - -## Configure the HDFS and Zookeeper modules - -To configure Netdata's HDFS module, navigate to your Netdata directory (typically at `/etc/netdata/`) and use -`edit-config` to initialize and edit your HDFS configuration file. - -```bash -cd /etc/netdata/ -sudo ./edit-config go.d/hdfs.conf -``` - -At the bottom of the file, you will see two example jobs, both of which are commented out: - -```yaml -# [ JOBS ] -#jobs: -# - name: namenode -# url: http://127.0.0.1:9870/jmx -# -# - name: datanode -# url: http://127.0.0.1:9864/jmx -``` - -Uncomment these lines and edit the `url` value(s) according to your setup. Now's the time to add any other configuration -details, which you can find inside of the `hdfs.conf` file itself. Most production implementations will require TLS -certificates. - -The result for a simple HDFS setup, running entirely on `localhost` and without certificate authentication, might look -like this: - -```yaml -# [ JOBS ] -jobs: - - name: namenode - url: http://127.0.0.1:9870/jmx - - - name: datanode - url: http://127.0.0.1:9864/jmx -``` - -At this point, Netdata should be configured to collect metrics from your HDFS servers. Let's move on to Zookeeper. - -Next, use `edit-config` again to initialize/edit your `zookeeper.conf` file. - -```bash -cd /etc/netdata/ -sudo ./edit-config go.d/zookeeper.conf -``` - -As with the `hdfs.conf` file, head to the bottom, uncomment the example jobs, and tweak the `address` values according -to your setup. Again, you may need to add additional configuration options, like TLS certificates. - -```yaml -jobs: - - name : local - address : 127.0.0.1:2181 - - - name : remote - address : 203.0.113.10:2182 -``` - -Finally, restart Netdata. - -```sh -sudo service restart netdata -``` - -Upon restart, Netdata should recognize your HDFS/Zookeeper servers, enable the HDFS and Zookeeper modules, and begin -showing real-time metrics for both in your Netdata dashboard. 🎉 - -## Configuring HDFS and Zookeeper alarms - -The Netdata community helped us create sane defaults for alarms related to both HDFS and Zookeeper. You may want to -investigate these to ensure they work well with your Hadoop implementation. - -- [HDFS alarms](https://raw.githubusercontent.com/netdata/netdata/master/health/health.d/hdfs.conf) -- [Zookeeper alarms](https://raw.githubusercontent.com/netdata/netdata/master/health/health.d/zookeeper.conf) - -You can also access/edit these files directly with `edit-config`: - -```bash -sudo /etc/netdata/edit-config health.d/hdfs.conf -sudo /etc/netdata/edit-config health.d/zookeeper.conf -``` - -For more information about editing the defaults or writing new alarm entities, see our [health monitoring -documentation](../../health/README.md). - -## What's next? - -If you're having issues with Netdata auto-detecting your HDFS/Zookeeper servers, or want to help improve how Netdata -collects or presents metrics from these services, feel free to [file an -issue](https://github.com/netdata/netdata/issues/new?labels=bug%2C+needs+triage&template=bug_report.md). - -- Read up on the [HDFS configuration - file](https://github.com/netdata/go.d.plugin/blob/master/config/go.d/hdfs.conf) to understand how to configure - global options or per-job options, such as username/password, TLS certificates, timeouts, and more. -- Read up on the [Zookeeper configuration - file](https://github.com/netdata/go.d.plugin/blob/master/config/go.d/zookeeper.conf) to understand how to configure - global options or per-job options, timeouts, TLS certificates, and more. - -[](<>) |