diff options
| author | Daniel Baumann <daniel.baumann@progress-linux.org> | 2022-04-14 18:12:10 +0000 |
|---|---|---|
| committer | Daniel Baumann <daniel.baumann@progress-linux.org> | 2022-04-14 18:12:10 +0000 |
| commit | b5321aff06d6ea8d730d62aec2ffd8e9271c1ffc (patch) | |
| tree | 36c41e35994786456154f9d3bf88c324763aeea4 /web/gui/custom | |
| parent | Adding upstream version 1.33.1. (diff) | |
| download | netdata-b5321aff06d6ea8d730d62aec2ffd8e9271c1ffc.tar.xz netdata-b5321aff06d6ea8d730d62aec2ffd8e9271c1ffc.zip | |
Adding upstream version 1.34.0.upstream/1.34.0
Signed-off-by: Daniel Baumann <daniel.baumann@progress-linux.org>
Diffstat (limited to 'web/gui/custom')
| -rw-r--r-- | web/gui/custom/README.md | 3 |
1 files changed, 1 insertions, 2 deletions
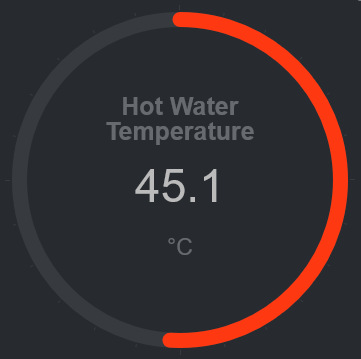
diff --git a/web/gui/custom/README.md b/web/gui/custom/README.md index a646e4b5c..cdd5d4260 100644 --- a/web/gui/custom/README.md +++ b/web/gui/custom/README.md @@ -581,7 +581,7 @@ Negative values are rendered counter-clockwise. This is a chart that displays the hotwater temperature in the given range of 40 to 50. ```html -<div data-netdata="stiebeleltron_system.hotwater.hotwatertemp" +<div data-netdata="acme_system.hotwater.hotwatertemp" data-title="Hot Water Temperature" data-decimal-digits="1" data-chart-library="easypiechart" @@ -602,4 +602,3 @@ to 50.  -[]() |
