
diff options
Diffstat (limited to '')
| l---------[-rw-r--r--] | collectors/python.d.plugin/pandas/README.md | 97 |
1 files changed, 1 insertions, 96 deletions
diff --git a/collectors/python.d.plugin/pandas/README.md b/collectors/python.d.plugin/pandas/README.md index 19b11d5be..2fabe63c1 100644..120000 --- a/collectors/python.d.plugin/pandas/README.md +++ b/collectors/python.d.plugin/pandas/README.md @@ -1,96 +1 @@ -# Ingest structured data (Pandas) - -<a href="https://pandas.pydata.org/" target="_blank"> - <img src="https://pandas.pydata.org/docs/_static/pandas.svg" alt="Pandas" width="100px" height="50px" /> - </a> - -[Pandas](https://pandas.pydata.org/) is a de-facto standard in reading and processing most types of structured data in Python. -If you have metrics appearing in a CSV, JSON, XML, HTML, or [other supported format](https://pandas.pydata.org/docs/user_guide/io.html), -either locally or via some HTTP endpoint, you can easily ingest and present those metrics in Netdata, by leveraging the Pandas collector. - -The collector uses [pandas](https://pandas.pydata.org/) to pull data and do pandas-based -preprocessing, before feeding to Netdata. - -## Requirements - -This collector depends on some Python (Python 3 only) packages that can usually be installed via `pip` or `pip3`. - -```bash -sudo pip install pandas requests -``` - -Note: If you would like to use [`pandas.read_sql`](https://pandas.pydata.org/docs/reference/api/pandas.read_sql.html) to query a database, you will need to install the below packages as well. - -```bash -sudo pip install 'sqlalchemy<2.0' psycopg2-binary -``` - -## Configuration - -Below is an example configuration to query some json weather data from [Open-Meteo](https://open-meteo.com), -do some data wrangling on it and save in format as expected by Netdata. - -```yaml -# example pulling some hourly temperature data -temperature: - name: "temperature" - update_every: 3 - chart_configs: - - name: "temperature_by_city" - title: "Temperature By City" - family: "temperature.today" - context: "pandas.temperature" - type: "line" - units: "Celsius" - df_steps: > - pd.DataFrame.from_dict( - {city: requests.get( - f'https://api.open-meteo.com/v1/forecast?latitude={lat}&longitude={lng}&hourly=temperature_2m' - ).json()['hourly']['temperature_2m'] - for (city,lat,lng) - in [ - ('dublin', 53.3441, -6.2675), - ('athens', 37.9792, 23.7166), - ('london', 51.5002, -0.1262), - ('berlin', 52.5235, 13.4115), - ('paris', 48.8567, 2.3510), - ] - } - ); # use dictionary comprehension to make multiple requests; - df.describe(); # get aggregate stats for each city; - df.transpose()[['mean', 'max', 'min']].reset_index(); # just take mean, min, max; - df.rename(columns={'index':'city'}); # some column renaming; - df.pivot(columns='city').mean().to_frame().reset_index(); # force to be one row per city; - df.rename(columns={0:'degrees'}); # some column renaming; - pd.concat([df, df['city']+'_'+df['level_0']], axis=1); # add new column combining city and summary measurement label; - df.rename(columns={0:'measurement'}); # some column renaming; - df[['measurement', 'degrees']].set_index('measurement'); # just take two columns we want; - df.sort_index(); # sort by city name; - df.transpose(); # transpose so its just one wide row; -``` - -`chart_configs` is a list of dictionary objects where each one defines the sequence of `df_steps` to be run using [`pandas`](https://pandas.pydata.org/), -and the `name`, `title` etc to define the -[CHART variables](https://github.com/netdata/netdata/blob/master/docs/guides/python-collector.md#create-charts) -that will control how the results will look in netdata. - -The example configuration above would result in a `data` dictionary like the below being collected by Netdata -at each time step. They keys in this dictionary will be the "dimensions" of the chart. - -```javascript -{'athens_max': 26.2, 'athens_mean': 19.45952380952381, 'athens_min': 12.2, 'berlin_max': 17.4, 'berlin_mean': 10.764285714285714, 'berlin_min': 5.7, 'dublin_max': 15.3, 'dublin_mean': 12.008928571428571, 'dublin_min': 6.6, 'london_max': 18.9, 'london_mean': 12.510714285714286, 'london_min': 5.2, 'paris_max': 19.4, 'paris_mean': 12.054166666666665, 'paris_min': 4.8} -``` - -Which, given the above configuration would end up as a chart like below in Netdata. - -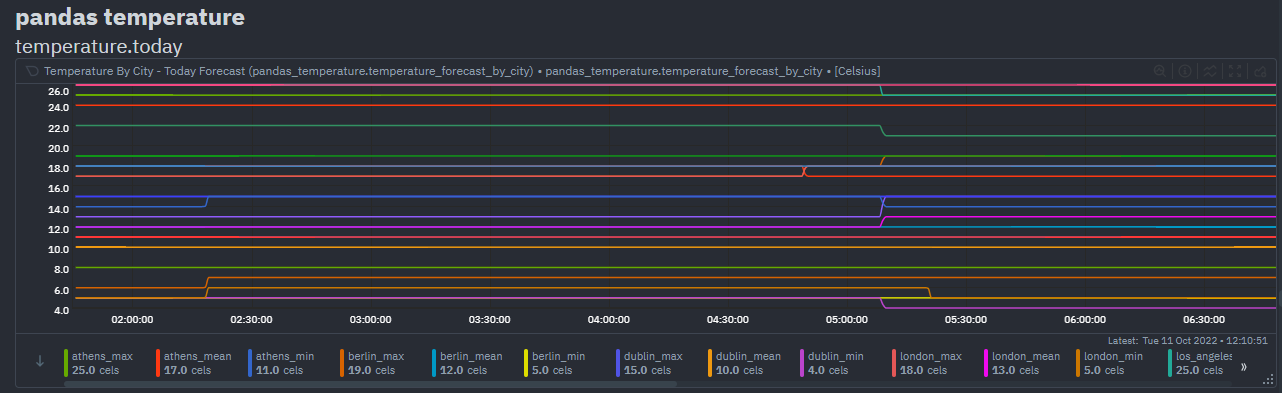 - -## Notes -- Each line in `df_steps` must return a pandas -[DataFrame](https://pandas.pydata.org/docs/reference/api/pandas.DataFrame.html) object (`df`) at each step. -- You can use -[this colab notebook](https://colab.research.google.com/drive/1VYrddSegZqGtkWGFuiUbMbUk5f3rW6Hi?usp=sharing) -to mock up and work on your `df_steps` iteratively before adding them to your config. -- This collector is expecting one row in the final pandas DataFrame. It is that first row that will be taken -as the most recent values for each dimension on each chart using (`df.to_dict(orient='records')[0]`). -See [pd.to_dict()](https://pandas.pydata.org/docs/reference/api/pandas.DataFrame.to_dict.html). +integrations/pandas.md
\ No newline at end of file |