
diff options
Diffstat (limited to 'collectors/python.d.plugin/zscores')
| -rw-r--r-- | collectors/python.d.plugin/zscores/Makefile.inc | 12 | ||||
| -rw-r--r-- | collectors/python.d.plugin/zscores/README.md | 146 | ||||
| -rw-r--r-- | collectors/python.d.plugin/zscores/zscores.chart.py | 146 | ||||
| -rw-r--r-- | collectors/python.d.plugin/zscores/zscores.conf | 108 |
4 files changed, 412 insertions, 0 deletions
diff --git a/collectors/python.d.plugin/zscores/Makefile.inc b/collectors/python.d.plugin/zscores/Makefile.inc new file mode 100644 index 000000000..d8b182415 --- /dev/null +++ b/collectors/python.d.plugin/zscores/Makefile.inc @@ -0,0 +1,12 @@ +# SPDX-License-Identifier: GPL-3.0-or-later + +# THIS IS NOT A COMPLETE Makefile +# IT IS INCLUDED BY ITS PARENT'S Makefile.am +# IT IS REQUIRED TO REFERENCE ALL FILES RELATIVE TO THE PARENT + +# install these files +dist_python_DATA += zscores/zscores.chart.py +dist_pythonconfig_DATA += zscores/zscores.conf + +# do not install these files, but include them in the distribution +dist_noinst_DATA += zscores/README.md zscores/Makefile.inc diff --git a/collectors/python.d.plugin/zscores/README.md b/collectors/python.d.plugin/zscores/README.md new file mode 100644 index 000000000..0b4472374 --- /dev/null +++ b/collectors/python.d.plugin/zscores/README.md @@ -0,0 +1,146 @@ +<!-- +--- +title: "zscores" +description: "Use statistical anomaly detection to narrow your focus and shorten root cause analysis." +custom_edit_url: https://github.com/netdata/netdata/edit/master/collectors/python.d.plugin/zscores/README.md +--- +--> + +# Z-Scores - basic anomaly detection for your key metrics and charts + +Smoothed, rolling [Z-Scores](https://en.wikipedia.org/wiki/Standard_score) for selected metrics or charts. + +This collector uses the [Netdata rest api](https://learn.netdata.cloud/docs/agent/web/api) to get the `mean` and `stddev` +for each dimension on specified charts over a time range (defined by `train_secs` and `offset_secs`). For each dimension +it will calculate a Z-Score as `z = (x - mean) / stddev` (clipped at `z_clip`). Scores are then smoothed over +time (`z_smooth_n`) and, if `mode: 'per_chart'`, aggregated across dimensions to a smoothed, rolling chart level Z-Score +at each time step. + +## Charts + +Two charts are produced: + +- **Z-Score** (`zscores.z`): This chart shows the calculated Z-Score per chart (or dimension if `mode='per_dim'`). +- **Z-Score >3** (`zscores.3stddev`): This chart shows a `1` if the absolute value of the Z-Score is greater than 3 or + a `0` otherwise. + +Below is an example of the charts produced by this collector and a typical example of how they would look when things +are 'normal' on the system. Most of the zscores tend to bounce randomly around a range typically between 0 to +3 (or -3 +to +3 if `z_abs: 'false'`), a few charts might stay steady at a more constant higher value depending on your +configuration and the typical workload on your system (typically those charts that do not change that much have a +smaller range of values on which to calculate a zscore and so tend to have a higher typical zscore). + +So really its a combination of the zscores values themselves plus, perhaps more importantly, how they change when +something strange occurs on your system which can be most useful. + +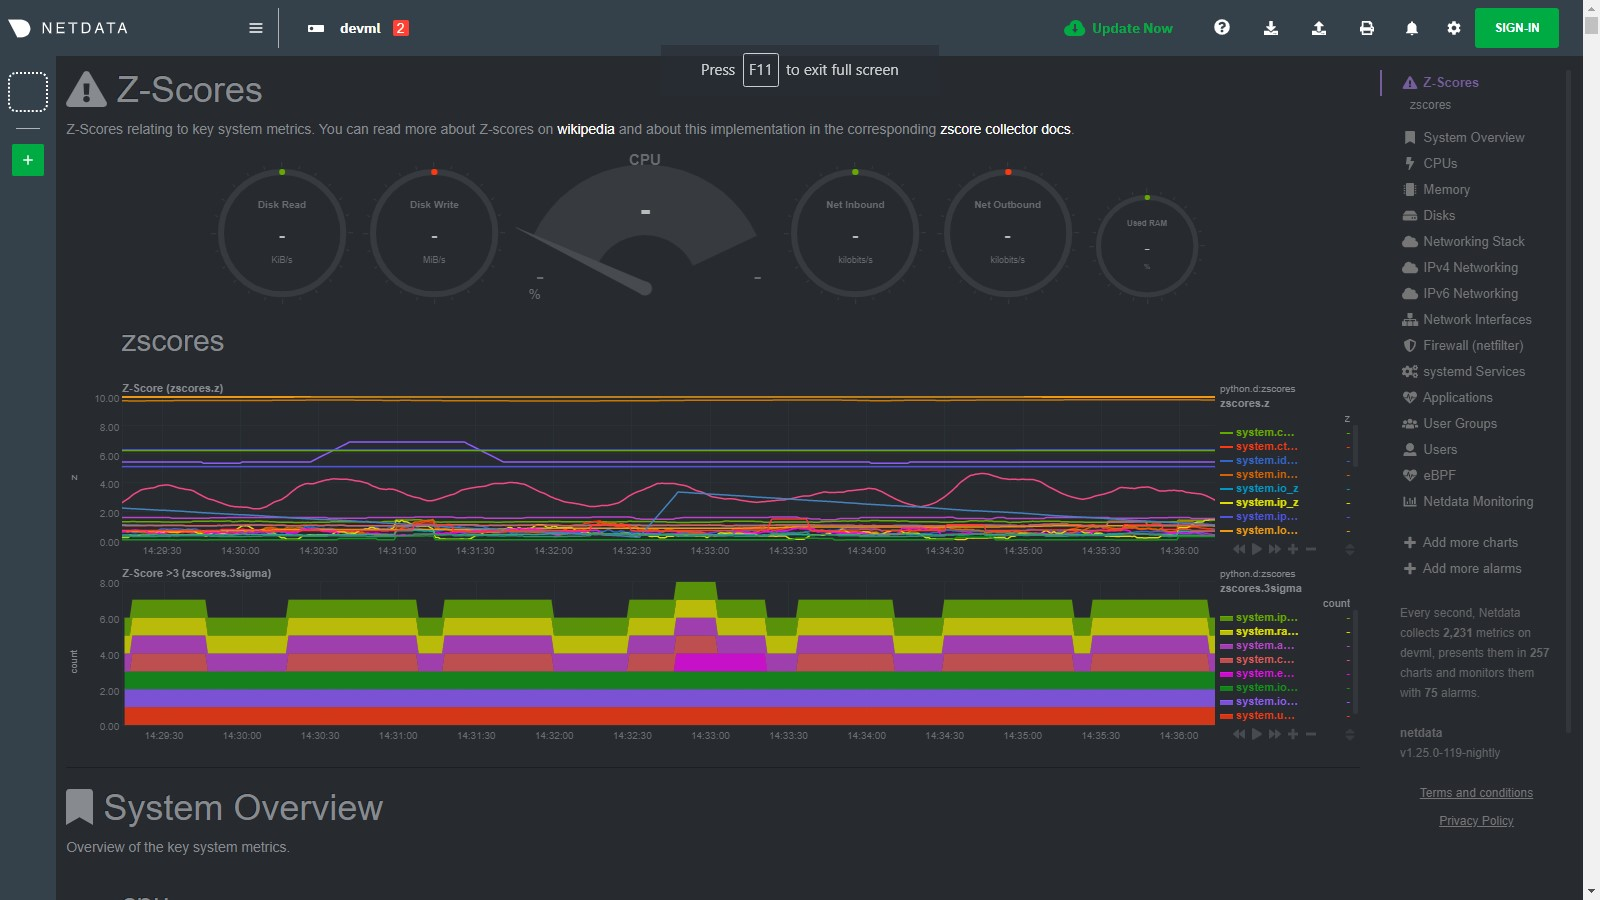 + +For example, if we go onto the system and run a command +like [`stress-ng --all 2`](https://wiki.ubuntu.com/Kernel/Reference/stress-ng) to create some stress, we see many charts +begin to have zscores that jump outside the typical range. When the absolute zscore for a chart is greater than 3 you +will see a corresponding line appear on the `zscores.3stddev` chart to make it a bit clearer what charts might be worth +looking at first (for more background information on why 3 stddev +see [here](https://en.wikipedia.org/wiki/68%E2%80%9395%E2%80%9399.7_rule#:~:text=In%20the%20empirical%20sciences%20the,99.7%25%20probability%20as%20near%20certainty.)) +. + +In the example below we basically took a sledge hammer to our system so its not suprising that lots of charts light up +after we run the stress command. In a more realistic setting you might just see a handful of charts with strange zscores +and that could be a good indication of where to look first. + +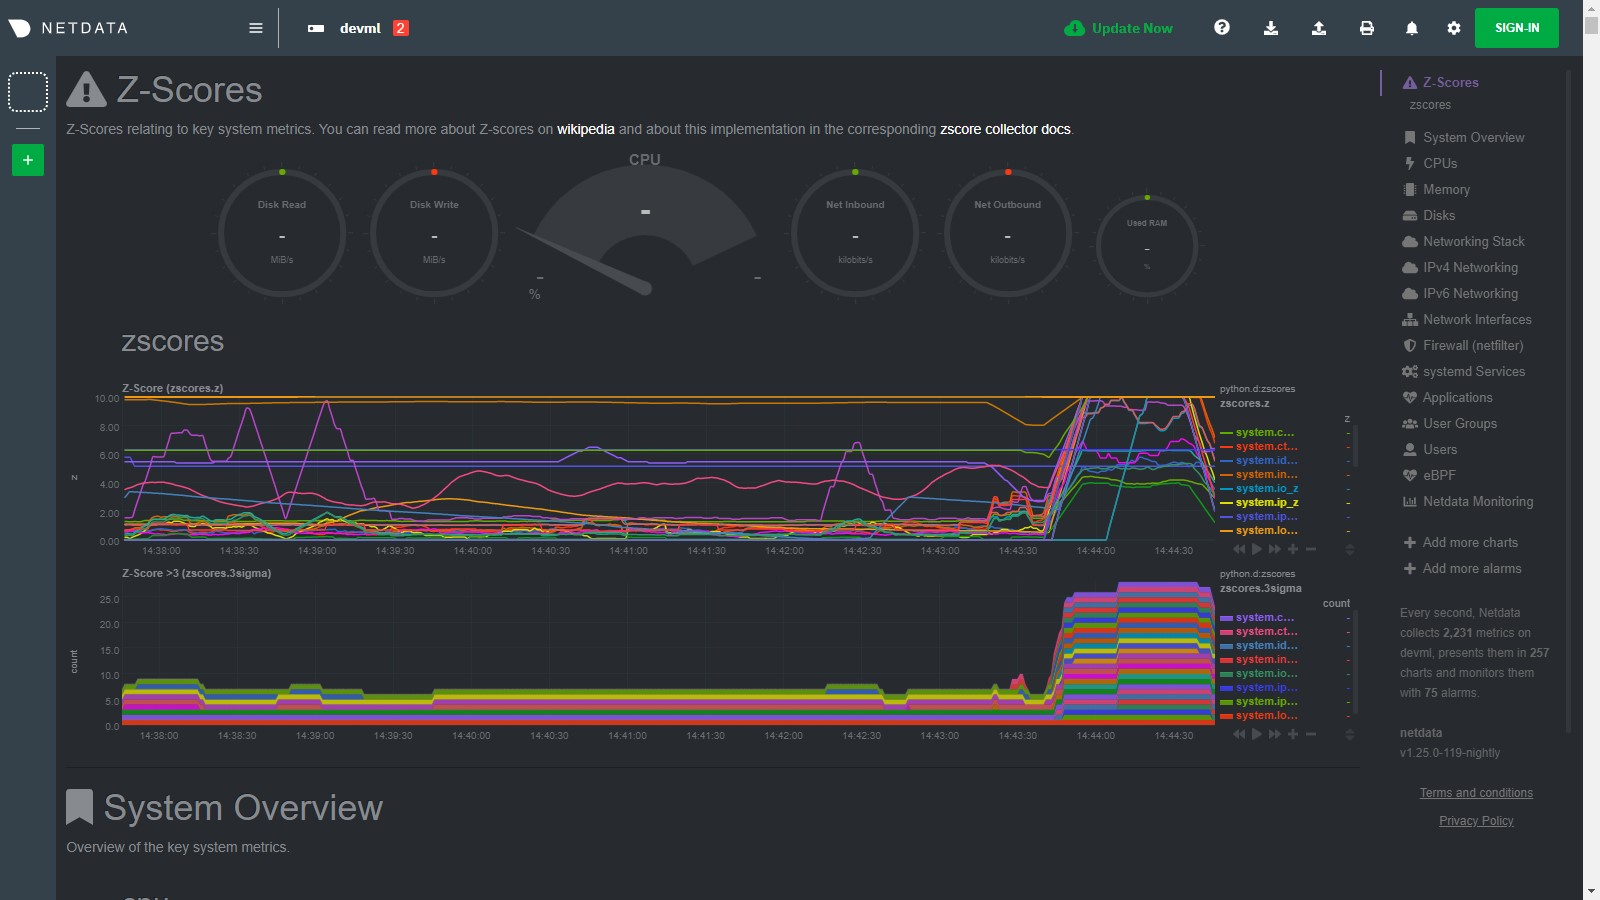 + +Then as the issue passes the zscores should settle back down into their normal range again as they are calculated in a +rolling and smoothed way (as defined by your `zscores.conf` file). + +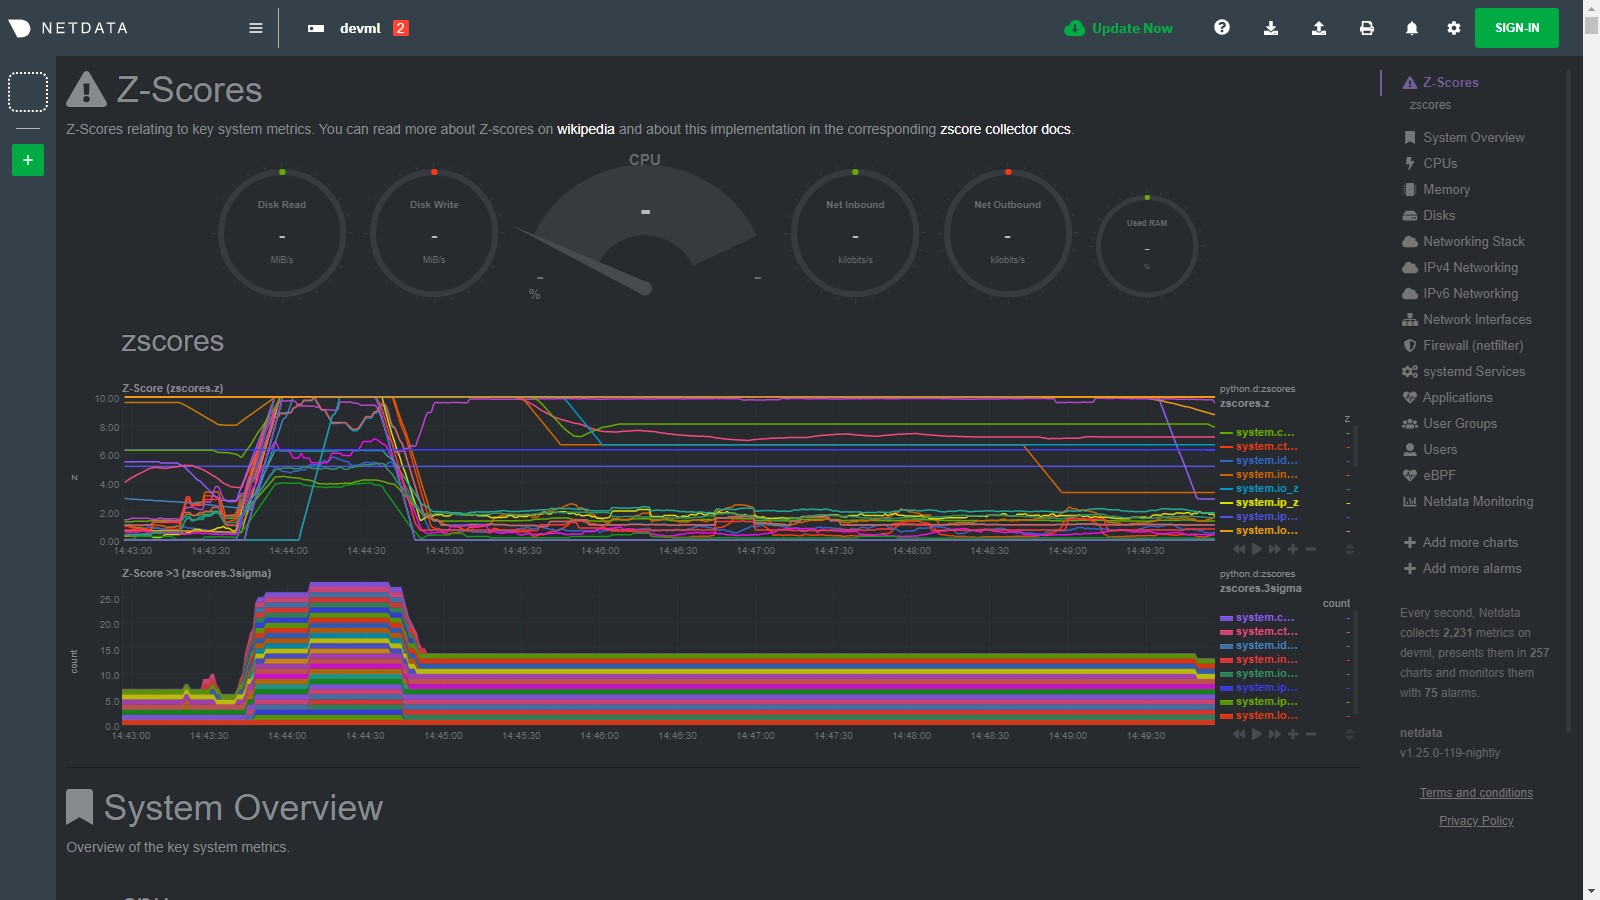 + +## Requirements + +This collector will only work with Python 3 and requires the below packages be installed. + +```bash +# become netdata user +sudo su -s /bin/bash netdata +# install required packages +pip3 install numpy pandas requests netdata-pandas==0.0.38 +``` + +## Configuration + +Install the underlying Python requirements, Enable the collector and restart Netdata. + +```bash +cd /etc/netdata/ +sudo ./edit-config python.d.conf +# Set `zscores: no` to `zscores: yes` +sudo systemctl restart netdata +``` + +The configuration for the zscores collector defines how it will behave on your system and might take some +experimentation with over time to set it optimally. Out of the box, the config comes with +some [sane defaults](https://www.netdata.cloud/blog/redefining-monitoring-netdata/) to get you started. + +If you are unsure about any of the below configuration options then it's best to just ignore all this and leave +the `zscores.conf` files alone to begin with. Then you can return to it later if you would like to tune things a bit +more once the collector is running for a while. + +Edit the `python.d/zscores.conf` configuration file using `edit-config` from the your +agent's [config directory](https://learn.netdata.cloud/guides/step-by-step/step-04#find-your-netdataconf-file), which is +usually at `/etc/netdata`. + +```bash +cd /etc/netdata # Replace this path with your Netdata config directory, if different +sudo ./edit-config python.d/zscores.conf +``` + +The default configuration should look something like this. Here you can see each parameter (with sane defaults) and some +information about each one and what it does. + +```bash +# what host to pull data from +host: '127.0.0.1:19999' +# What charts to pull data for - A regex like 'system\..*|' or 'system\..*|apps.cpu|apps.mem' etc. +charts_regex: 'system\..*' +# length of time to base calulcations off for mean and stddev +train_secs: 14400 # use last 4 hours to work out the mean and stddev for the zscore +# offset preceeding latest data to ignore when calculating mean and stddev +offset_secs: 300 # ignore last 5 minutes of data when calculating the mean and stddev +# recalculate the mean and stddev every n steps of the collector +train_every_n: 900 # recalculate mean and stddev every 15 minutes +# smooth the z score by averaging it over last n values +z_smooth_n: 15 # take a rolling average of the last 15 zscore values to reduce sensitivity to temporary 'spikes' +# cap absolute value of zscore (before smoothing) for better stability +z_clip: 10 # cap each zscore at 10 so as to avoid really large individual zscores swamping any rolling average +# set z_abs: 'true' to make all zscores be absolute values only. +z_abs: 'true' +# burn in period in which to initially calculate mean and stddev on every step +burn_in: 2 # on startup of the collector continually update the mean and stddev in case any gaps or inital calculations fail to return +# mode can be to get a zscore 'per_dim' or 'per_chart' +mode: 'per_chart' # 'per_chart' means individual dimension level smoothed zscores will be aggregated to one zscore per chart per time step +# per_chart_agg is how you aggregate from dimension to chart when mode='per_chart' +per_chart_agg: 'mean' # 'absmax' will take the max absolute value accross all dimensions but will maintain the sign. 'mean' will just average. +``` + +## Notes + +- Python 3 is required as the [`netdata-pandas`](https://github.com/netdata/netdata-pandas) package uses python async + libraries ([asks](https://pypi.org/project/asks/) and [trio](https://pypi.org/project/trio/)) to make asynchronous + calls to the netdata rest api to get the required data for each chart when calculating the mean and stddev. +- It may take a few hours or so for the collector to 'settle' into it's typical behaviour in terms of the scores you + will see in the normal running of your system. +- The zscore you see for each chart when using `mode: 'per_chart'` as actually an aggregated zscore accross all the + dimensions on the underlying chart. +- If you set `mode: 'per_dim'` then you will see a zscore for each dimension on each chart as opposed to one per chart. +- As this collector does some calculations itself in python you may want to try it out first on a test or development + system to get a sense of its performance characteristics. Most of the work in calculating the mean and stddev will be + pushed down to the underlying Netdata C libraries via the rest api. But some data wrangling and calculations are then + done using [Pandas](https://pandas.pydata.org/) and [Numpy](https://numpy.org/) within the collector itself. +- On a development n1-standard-2 (2 vCPUs, 7.5 GB memory) vm running Ubuntu 18.04 LTS and not doing any work some of the + typical performance characteristics we saw from running this collector were: + - A runtime (`netdata.runtime_zscores`) of ~50ms when doing scoring and ~500ms when recalculating the mean and + stddev. + - Typically 3%-3.5% cpu usage from scoring, jumping to ~35% for one second when recalculating the mean and stddev. + - About ~50mb of ram (`apps.mem`) being continually used by the `python.d.plugin`. +- If you activate this collector on a fresh node, it might take a little while to build up enough data to calculate a + proper zscore. So until you actually have `train_secs` of available data the mean and stddev calculated will be subject + to more noise.
\ No newline at end of file diff --git a/collectors/python.d.plugin/zscores/zscores.chart.py b/collectors/python.d.plugin/zscores/zscores.chart.py new file mode 100644 index 000000000..48397d8dd --- /dev/null +++ b/collectors/python.d.plugin/zscores/zscores.chart.py @@ -0,0 +1,146 @@ +# -*- coding: utf-8 -*- +# Description: zscores netdata python.d module +# Author: andrewm4894 +# SPDX-License-Identifier: GPL-3.0-or-later + +from datetime import datetime +import re + +import requests +import numpy as np +import pandas as pd + +from bases.FrameworkServices.SimpleService import SimpleService +from netdata_pandas.data import get_data, get_allmetrics + +priority = 60000 +update_every = 5 +disabled_by_default = True + +ORDER = [ + 'z', + '3stddev' +] + +CHARTS = { + 'z': { + 'options': ['z', 'Z Score', 'z', 'Z Score', 'z', 'line'], + 'lines': [] + }, + '3stddev': { + 'options': ['3stddev', 'Z Score >3', 'count', '3 Stddev', '3stddev', 'stacked'], + 'lines': [] + }, +} + + +class Service(SimpleService): + def __init__(self, configuration=None, name=None): + SimpleService.__init__(self, configuration=configuration, name=name) + self.host = self.configuration.get('host', '127.0.0.1:19999') + self.charts_regex = re.compile(self.configuration.get('charts_regex', 'system.*')) + self.charts_to_exclude = self.configuration.get('charts_to_exclude', '').split(',') + self.charts_in_scope = [ + c for c in + list(filter(self.charts_regex.match, + requests.get(f'http://{self.host}/api/v1/charts').json()['charts'].keys())) + if c not in self.charts_to_exclude + ] + self.train_secs = self.configuration.get('train_secs', 14400) + self.offset_secs = self.configuration.get('offset_secs', 300) + self.train_every_n = self.configuration.get('train_every_n', 900) + self.z_smooth_n = self.configuration.get('z_smooth_n', 15) + self.z_clip = self.configuration.get('z_clip', 10) + self.z_abs = bool(self.configuration.get('z_abs', True)) + self.burn_in = self.configuration.get('burn_in', 2) + self.mode = self.configuration.get('mode', 'per_chart') + self.per_chart_agg = self.configuration.get('per_chart_agg', 'mean') + self.order = ORDER + self.definitions = CHARTS + self.collected_dims = {'z': set(), '3stddev': set()} + self.df_mean = pd.DataFrame() + self.df_std = pd.DataFrame() + self.df_z_history = pd.DataFrame() + + def check(self): + _ = get_allmetrics(self.host, self.charts_in_scope, wide=True, col_sep='.') + return True + + def validate_charts(self, chart, data, algorithm='absolute', multiplier=1, divisor=1): + """If dimension not in chart then add it. + """ + for dim in data: + if dim not in self.collected_dims[chart]: + self.collected_dims[chart].add(dim) + self.charts[chart].add_dimension([dim, dim, algorithm, multiplier, divisor]) + + for dim in list(self.collected_dims[chart]): + if dim not in data: + self.collected_dims[chart].remove(dim) + self.charts[chart].del_dimension(dim, hide=False) + + def train_model(self): + """Calculate the mean and stddev for all relevant metrics and store them for use in calulcating zscore at each timestep. + """ + before = int(datetime.now().timestamp()) - self.offset_secs + after = before - self.train_secs + + self.df_mean = get_data( + self.host, self.charts_in_scope, after, before, points=10, group='average', col_sep='.' + ).mean().to_frame().rename(columns={0: "mean"}) + + self.df_std = get_data( + self.host, self.charts_in_scope, after, before, points=10, group='stddev', col_sep='.' + ).mean().to_frame().rename(columns={0: "std"}) + + def create_data(self, df_allmetrics): + """Use x, mean, stddev to generate z scores and 3stddev flags via some pandas manipulation. + Returning two dictionaries of dimensions and measures, one for each chart. + + :param df_allmetrics <pd.DataFrame>: pandas dataframe with latest data from api/v1/allmetrics. + :return: (<dict>,<dict>) tuple of dictionaries, one for zscores and the other for a flag if abs(z)>3. + """ + # calculate clipped z score for each available metric + df_z = pd.concat([self.df_mean, self.df_std, df_allmetrics], axis=1, join='inner') + df_z['z'] = ((df_z['value'] - df_z['mean']) / df_z['std']).clip(-self.z_clip, self.z_clip).fillna(0) * 100 + if self.z_abs: + df_z['z'] = df_z['z'].abs() + + # append last z_smooth_n rows of zscores to history table in wide format + self.df_z_history = self.df_z_history.append( + df_z[['z']].reset_index().pivot_table(values='z', columns='index'), sort=True + ).tail(self.z_smooth_n) + + # get average zscore for last z_smooth_n for each metric + df_z_smooth = self.df_z_history.melt(value_name='z').groupby('index')['z'].mean().to_frame() + df_z_smooth['3stddev'] = np.where(abs(df_z_smooth['z']) > 300, 1, 0) + data_z = df_z_smooth['z'].add_suffix('_z').to_dict() + + # aggregate to chart level if specified + if self.mode == 'per_chart': + df_z_smooth['chart'] = ['.'.join(x[0:2]) + '_z' for x in df_z_smooth.index.str.split('.').to_list()] + if self.per_chart_agg == 'absmax': + data_z = \ + list(df_z_smooth.groupby('chart').agg({'z': lambda x: max(x, key=abs)})['z'].to_dict().values())[0] + else: + data_z = list(df_z_smooth.groupby('chart').agg({'z': [self.per_chart_agg]})['z'].to_dict().values())[0] + + data_3stddev = {} + for k in data_z: + data_3stddev[k.replace('_z', '')] = 1 if abs(data_z[k]) > 300 else 0 + + return data_z, data_3stddev + + def get_data(self): + + if self.runs_counter <= self.burn_in or self.runs_counter % self.train_every_n == 0: + self.train_model() + + data_z, data_3stddev = self.create_data( + get_allmetrics(self.host, self.charts_in_scope, wide=True, col_sep='.').transpose()) + data = {**data_z, **data_3stddev} + + self.validate_charts('z', data_z, divisor=100) + self.validate_charts('3stddev', data_3stddev) + + return data diff --git a/collectors/python.d.plugin/zscores/zscores.conf b/collectors/python.d.plugin/zscores/zscores.conf new file mode 100644 index 000000000..fab18c787 --- /dev/null +++ b/collectors/python.d.plugin/zscores/zscores.conf @@ -0,0 +1,108 @@ +# netdata python.d.plugin configuration for example +# +# This file is in YaML format. Generally the format is: +# +# name: value +# +# There are 2 sections: +# - global variables +# - one or more JOBS +# +# JOBS allow you to collect values from multiple sources. +# Each source will have its own set of charts. +# +# JOB parameters have to be indented (using spaces only, example below). + +# ---------------------------------------------------------------------- +# Global Variables +# These variables set the defaults for all JOBs, however each JOB +# may define its own, overriding the defaults. + +# update_every sets the default data collection frequency. +# If unset, the python.d.plugin default is used. +update_every: 5 + +# priority controls the order of charts at the netdata dashboard. +# Lower numbers move the charts towards the top of the page. +# If unset, the default for python.d.plugin is used. +# priority: 60000 + +# penalty indicates whether to apply penalty to update_every in case of failures. +# Penalty will increase every 5 failed updates in a row. Maximum penalty is 10 minutes. +# penalty: yes + +# autodetection_retry sets the job re-check interval in seconds. +# The job is not deleted if check fails. +# Attempts to start the job are made once every autodetection_retry. +# This feature is disabled by default. +# autodetection_retry: 0 + +# ---------------------------------------------------------------------- +# JOBS (data collection sources) +# +# The default JOBS share the same *name*. JOBS with the same name +# are mutually exclusive. Only one of them will be allowed running at +# any time. This allows autodetection to try several alternatives and +# pick the one that works. +# +# Any number of jobs is supported. +# +# All python.d.plugin JOBS (for all its modules) support a set of +# predefined parameters. These are: +# +# job_name: +# name: myname # the JOB's name as it will appear at the +# # dashboard (by default is the job_name) +# # JOBs sharing a name are mutually exclusive +# update_every: 1 # the JOB's data collection frequency +# priority: 60000 # the JOB's order on the dashboard +# penalty: yes # the JOB's penalty +# autodetection_retry: 0 # the JOB's re-check interval in seconds +# +# Additionally to the above, example also supports the following: +# +# - none +# +# ---------------------------------------------------------------------- +# AUTO-DETECTION JOBS +# only one of them will run (they have the same name) + +local: + name: 'local' + + # what host to pull data from + host: '127.0.0.1:19999' + + # what charts to pull data for - A regex like 'system\..*|' or 'system\..*|apps.cpu|apps.mem' etc. + charts_regex: 'system\..*' + + # Charts to exclude, useful if you would like to exclude some specific charts. + # Note: should be a ',' separated string like 'chart.name,chart.name'. + charts_to_exclude: 'system.uptime' + + # length of time to base calculations off for mean and stddev + train_secs: 14400 # use last 4 hours to work out the mean and stddev for the zscore + + # offset preceeding latest data to ignore when calculating mean and stddev + offset_secs: 300 # ignore last 5 minutes of data when calculating the mean and stddev + + # recalculate the mean and stddev every n steps of the collector + train_every_n: 900 # recalculate mean and stddev every 15 minutes + + # smooth the z score by averaging it over last n values + z_smooth_n: 15 # take a rolling average of the last 15 zscore values to reduce sensitivity to temporary 'spikes' + + # cap absolute value of zscore (before smoothing) for better stability + z_clip: 10 # cap each zscore at 10 so as to avoid really large individual zscores swamping any rolling average + + # set z_abs: 'true' to make all zscores be absolute values only. + z_abs: 'true' + + # burn in period in which to initially calculate mean and stddev on every step + burn_in: 2 # on startup of the collector continually update the mean and stddev in case any gaps or inital calculations fail to return + + # mode can be to get a zscore 'per_dim' or 'per_chart' + mode: 'per_chart' # 'per_chart' means individual dimension level smoothed zscores will be aggregated to one zscore per chart per time step + + # per_chart_agg is how you aggregate from dimension to chart when mode='per_chart' + per_chart_agg: 'mean' # 'absmax' will take the max absolute value accross all dimensions but will maintain the sign. 'mean' will just average. |