
diff options
Diffstat (limited to 'collectors/python.d.plugin/zscores')
| l---------[-rw-r--r--] | collectors/python.d.plugin/zscores/README.md | 159 | ||||
| -rw-r--r-- | collectors/python.d.plugin/zscores/integrations/python.d_zscores.md | 194 |
2 files changed, 195 insertions, 158 deletions
diff --git a/collectors/python.d.plugin/zscores/README.md b/collectors/python.d.plugin/zscores/README.md index dcb685c98..159ce0787 100644..120000 --- a/collectors/python.d.plugin/zscores/README.md +++ b/collectors/python.d.plugin/zscores/README.md @@ -1,158 +1 @@ -# Basic anomaly detection using Z-scores - -By using smoothed, rolling [Z-Scores](https://en.wikipedia.org/wiki/Standard_score) for selected metrics or charts you can narrow down your focus and shorten root cause analysis. - -This collector uses the [Netdata rest api](https://github.com/netdata/netdata/blob/master/web/api/README.md) to get the `mean` and `stddev` -for each dimension on specified charts over a time range (defined by `train_secs` and `offset_secs`). For each dimension -it will calculate a Z-Score as `z = (x - mean) / stddev` (clipped at `z_clip`). Scores are then smoothed over -time (`z_smooth_n`) and, if `mode: 'per_chart'`, aggregated across dimensions to a smoothed, rolling chart level Z-Score -at each time step. - -## Charts - -Two charts are produced: - -- **Z-Score** (`zscores.z`): This chart shows the calculated Z-Score per chart (or dimension if `mode='per_dim'`). -- **Z-Score >3** (`zscores.3stddev`): This chart shows a `1` if the absolute value of the Z-Score is greater than 3 or - a `0` otherwise. - -Below is an example of the charts produced by this collector and a typical example of how they would look when things -are 'normal' on the system. Most of the zscores tend to bounce randomly around a range typically between 0 to +3 (or -3 -to +3 if `z_abs: 'false'`), a few charts might stay steady at a more constant higher value depending on your -configuration and the typical workload on your system (typically those charts that do not change that much have a -smaller range of values on which to calculate a zscore and so tend to have a higher typical zscore). - -So really its a combination of the zscores values themselves plus, perhaps more importantly, how they change when -something strange occurs on your system which can be most useful. - -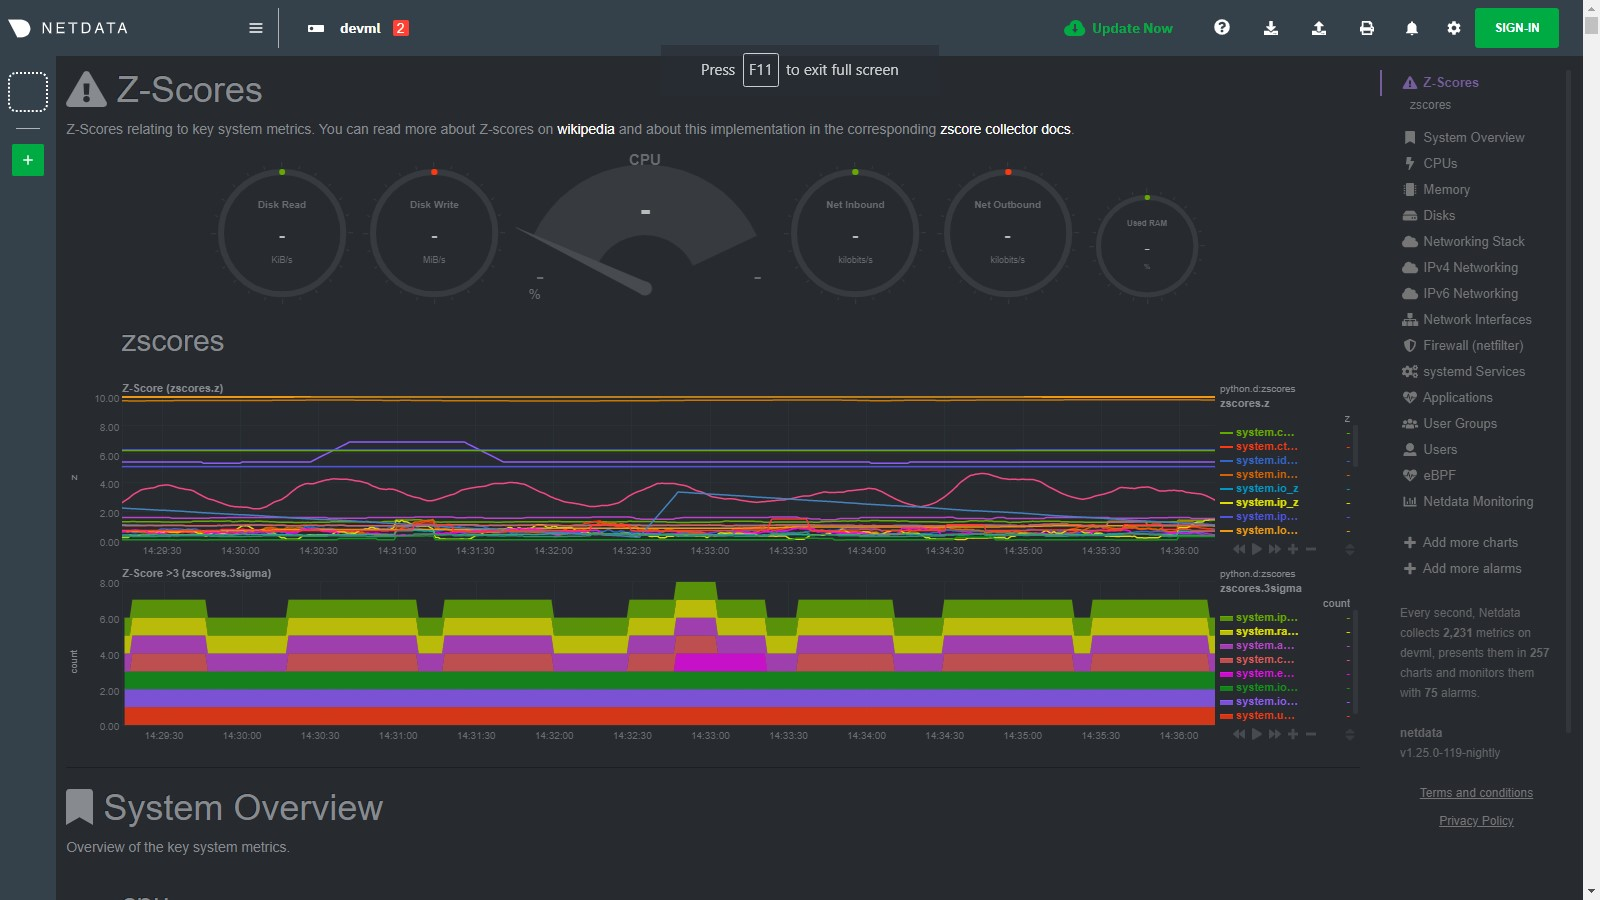 - -For example, if we go onto the system and run a command -like [`stress-ng --all 2`](https://wiki.ubuntu.com/Kernel/Reference/stress-ng) to create some stress, we see many charts -begin to have zscores that jump outside the typical range. When the absolute zscore for a chart is greater than 3 you -will see a corresponding line appear on the `zscores.3stddev` chart to make it a bit clearer what charts might be worth -looking at first (for more background information on why 3 stddev -see [here](https://en.wikipedia.org/wiki/68%E2%80%9395%E2%80%9399.7_rule#:~:text=In%20the%20empirical%20sciences%20the,99.7%25%20probability%20as%20near%20certainty.)) -. - -In the example below we basically took a sledge hammer to our system so its not surprising that lots of charts light up -after we run the stress command. In a more realistic setting you might just see a handful of charts with strange zscores -and that could be a good indication of where to look first. - -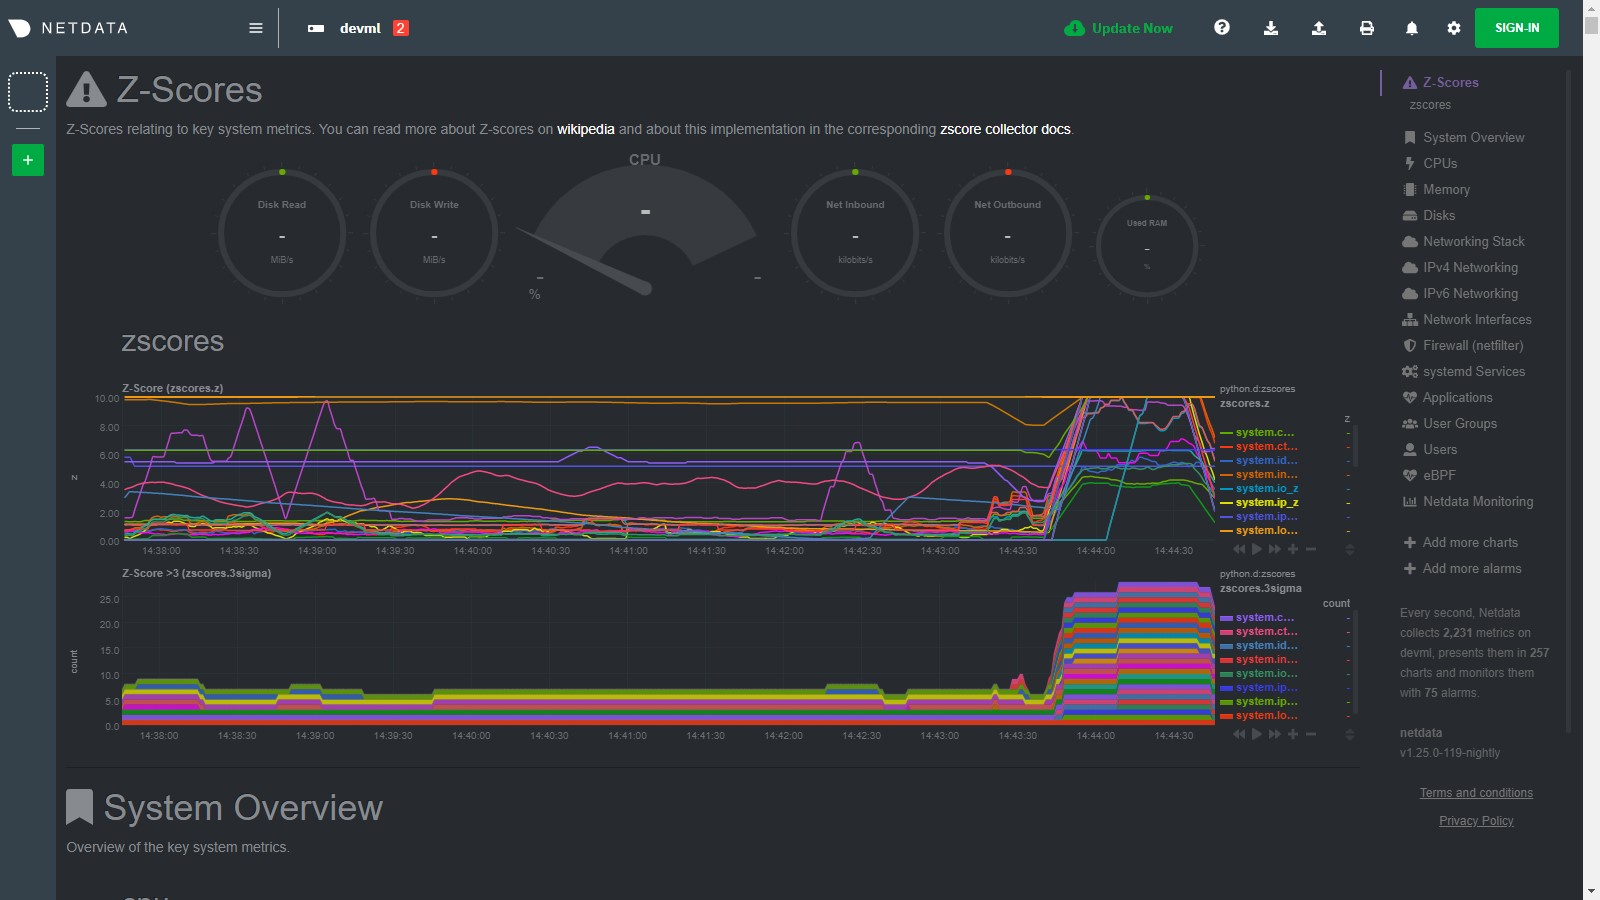 - -Then as the issue passes the zscores should settle back down into their normal range again as they are calculated in a -rolling and smoothed way (as defined by your `zscores.conf` file). - -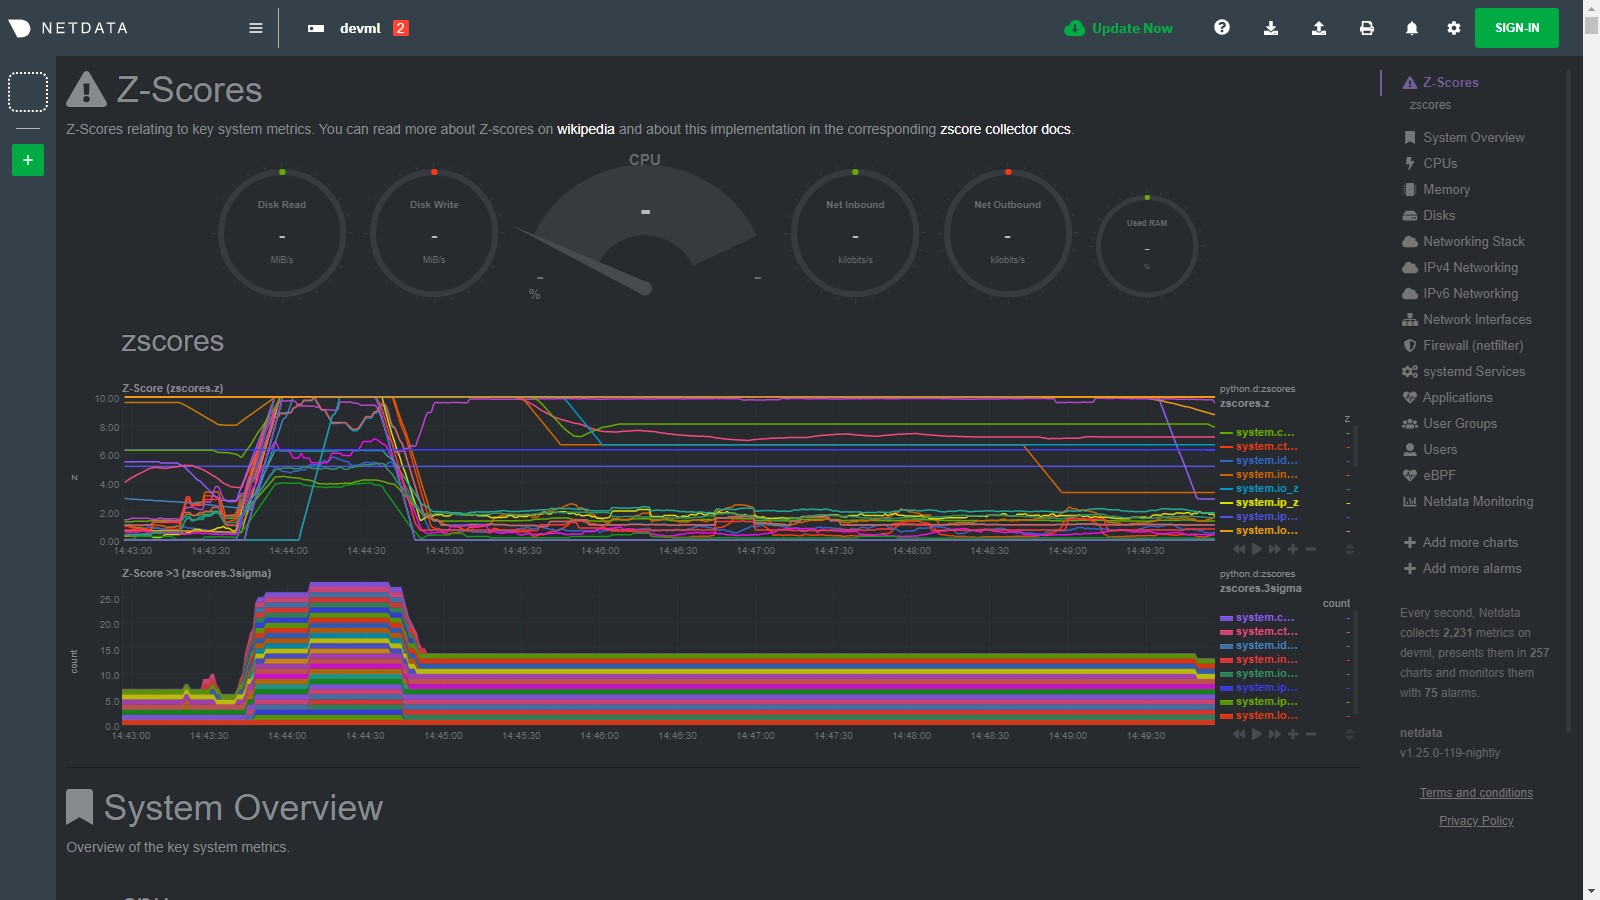 - -## Requirements - -This collector will only work with Python 3 and requires the below packages be installed. - -```bash -# become netdata user -sudo su -s /bin/bash netdata -# install required packages -pip3 install numpy pandas requests netdata-pandas==0.0.38 -``` - -## Configuration - -Install the underlying Python requirements, Enable the collector and restart Netdata. - -```bash -cd /etc/netdata/ -sudo ./edit-config python.d.conf -# Set `zscores: no` to `zscores: yes` -sudo systemctl restart netdata -``` - -The configuration for the zscores collector defines how it will behave on your system and might take some -experimentation with over time to set it optimally. Out of the box, the config comes with -some [sane defaults](https://www.netdata.cloud/blog/redefining-monitoring-netdata/) to get you started. - -If you are unsure about any of the below configuration options then it's best to just ignore all this and leave -the `zscores.conf` files alone to begin with. Then you can return to it later if you would like to tune things a bit -more once the collector is running for a while. - -Edit the `python.d/zscores.conf` configuration file using `edit-config` from the your -agent's [config directory](https://github.com/netdata/netdata/blob/master/docs/configure/nodes.md#the-netdata-config-directory), which is -usually at `/etc/netdata`. - -```bash -cd /etc/netdata # Replace this path with your Netdata config directory, if different -sudo ./edit-config python.d/zscores.conf -``` - -The default configuration should look something like this. Here you can see each parameter (with sane defaults) and some -information about each one and what it does. - -```bash -# what host to pull data from -host: '127.0.0.1:19999' -# What charts to pull data for - A regex like 'system\..*|' or 'system\..*|apps.cpu|apps.mem' etc. -charts_regex: 'system\..*' -# length of time to base calculations off for mean and stddev -train_secs: 14400 # use last 4 hours to work out the mean and stddev for the zscore -# offset preceding latest data to ignore when calculating mean and stddev -offset_secs: 300 # ignore last 5 minutes of data when calculating the mean and stddev -# recalculate the mean and stddev every n steps of the collector -train_every_n: 900 # recalculate mean and stddev every 15 minutes -# smooth the z score by averaging it over last n values -z_smooth_n: 15 # take a rolling average of the last 15 zscore values to reduce sensitivity to temporary 'spikes' -# cap absolute value of zscore (before smoothing) for better stability -z_clip: 10 # cap each zscore at 10 so as to avoid really large individual zscores swamping any rolling average -# set z_abs: 'true' to make all zscores be absolute values only. -z_abs: 'true' -# burn in period in which to initially calculate mean and stddev on every step -burn_in: 2 # on startup of the collector continually update the mean and stddev in case any gaps or initial calculations fail to return -# mode can be to get a zscore 'per_dim' or 'per_chart' -mode: 'per_chart' # 'per_chart' means individual dimension level smoothed zscores will be aggregated to one zscore per chart per time step -# per_chart_agg is how you aggregate from dimension to chart when mode='per_chart' -per_chart_agg: 'mean' # 'absmax' will take the max absolute value across all dimensions but will maintain the sign. 'mean' will just average. -``` - -## Notes - -- Python 3 is required as the [`netdata-pandas`](https://github.com/netdata/netdata-pandas) package uses python async - libraries ([asks](https://pypi.org/project/asks/) and [trio](https://pypi.org/project/trio/)) to make asynchronous - calls to the netdata rest api to get the required data for each chart when calculating the mean and stddev. -- It may take a few hours or so for the collector to 'settle' into it's typical behaviour in terms of the scores you - will see in the normal running of your system. -- The zscore you see for each chart when using `mode: 'per_chart'` as actually an aggregated zscore across all the - dimensions on the underlying chart. -- If you set `mode: 'per_dim'` then you will see a zscore for each dimension on each chart as opposed to one per chart. -- As this collector does some calculations itself in python you may want to try it out first on a test or development - system to get a sense of its performance characteristics. Most of the work in calculating the mean and stddev will be - pushed down to the underlying Netdata C libraries via the rest api. But some data wrangling and calculations are then - done using [Pandas](https://pandas.pydata.org/) and [Numpy](https://numpy.org/) within the collector itself. -- On a development n1-standard-2 (2 vCPUs, 7.5 GB memory) vm running Ubuntu 18.04 LTS and not doing any work some of the - typical performance characteristics we saw from running this collector were: - - A runtime (`netdata.runtime_zscores`) of ~50ms when doing scoring and ~500ms when recalculating the mean and - stddev. - - Typically 3%-3.5% cpu usage from scoring, jumping to ~35% for one second when recalculating the mean and stddev. - - About ~50mb of ram (`apps.mem`) being continually used by the `python.d.plugin`. -- If you activate this collector on a fresh node, it might take a little while to build up enough data to calculate a - proper zscore. So until you actually have `train_secs` of available data the mean and stddev calculated will be subject - to more noise. -### Troubleshooting - -To troubleshoot issues with the `zscores` module, run the `python.d.plugin` with the debug option enabled. The -output will give you the output of the data collection job or error messages on why the collector isn't working. - -First, navigate to your plugins directory, usually they are located under `/usr/libexec/netdata/plugins.d/`. If that's -not the case on your system, open `netdata.conf` and look for the setting `plugins directory`. Once you're in the -plugin's directory, switch to the `netdata` user. - -```bash -cd /usr/libexec/netdata/plugins.d/ -sudo su -s /bin/bash netdata -``` - -Now you can manually run the `zscores` module in debug mode: - -```bash -./python.d.plugin zscores debug trace -``` - +integrations/python.d_zscores.md
\ No newline at end of file diff --git a/collectors/python.d.plugin/zscores/integrations/python.d_zscores.md b/collectors/python.d.plugin/zscores/integrations/python.d_zscores.md new file mode 100644 index 000000000..1ebe865f0 --- /dev/null +++ b/collectors/python.d.plugin/zscores/integrations/python.d_zscores.md @@ -0,0 +1,194 @@ +<!--startmeta +custom_edit_url: "https://github.com/netdata/netdata/edit/master/collectors/python.d.plugin/zscores/README.md" +meta_yaml: "https://github.com/netdata/netdata/edit/master/collectors/python.d.plugin/zscores/metadata.yaml" +sidebar_label: "python.d zscores" +learn_status: "Published" +learn_rel_path: "Data Collection/Other" +message: "DO NOT EDIT THIS FILE DIRECTLY, IT IS GENERATED BY THE COLLECTOR'S metadata.yaml FILE" +endmeta--> + +# python.d zscores + +Plugin: python.d.plugin +Module: zscores + +<img src="https://img.shields.io/badge/maintained%20by-Netdata-%2300ab44" /> + +## Overview + +By using smoothed, rolling [Z-Scores](https://en.wikipedia.org/wiki/Standard_score) for selected metrics or charts you can narrow down your focus and shorten root cause analysis. + + +This collector uses the [Netdata rest api](https://github.com/netdata/netdata/blob/master/web/api/README.md) to get the `mean` and `stddev` +for each dimension on specified charts over a time range (defined by `train_secs` and `offset_secs`). + +For each dimension it will calculate a Z-Score as `z = (x - mean) / stddev` (clipped at `z_clip`). Scores are then smoothed over +time (`z_smooth_n`) and, if `mode: 'per_chart'`, aggregated across dimensions to a smoothed, rolling chart level Z-Score at each time step. + + +This collector is supported on all platforms. + +This collector supports collecting metrics from multiple instances of this integration, including remote instances. + + +### Default Behavior + +#### Auto-Detection + +This integration doesn't support auto-detection. + +#### Limits + +The default configuration for this integration does not impose any limits on data collection. + +#### Performance Impact + +The default configuration for this integration is not expected to impose a significant performance impact on the system. + + +## Metrics + +Metrics grouped by *scope*. + +The scope defines the instance that the metric belongs to. An instance is uniquely identified by a set of labels. + + + +### Per python.d zscores instance + +These metrics refer to the entire monitored application. + +This scope has no labels. + +Metrics: + +| Metric | Dimensions | Unit | +|:------|:----------|:----| +| zscores.z | a dimension per chart or dimension | z | +| zscores.3stddev | a dimension per chart or dimension | count | + + + +## Alerts + +There are no alerts configured by default for this integration. + + +## Setup + +### Prerequisites + +#### Python Requirements + +This collector will only work with Python 3 and requires the below packages be installed. + +```bash +# become netdata user +sudo su -s /bin/bash netdata +# install required packages +pip3 install numpy pandas requests netdata-pandas==0.0.38 +``` + + + +### Configuration + +#### File + +The configuration file name for this integration is `python.d/zscores.conf`. + + +You can edit the configuration file using the `edit-config` script from the +Netdata [config directory](https://github.com/netdata/netdata/blob/master/docs/configure/nodes.md#the-netdata-config-directory). + +```bash +cd /etc/netdata 2>/dev/null || cd /opt/netdata/etc/netdata +sudo ./edit-config python.d/zscores.conf +``` +#### Options + +There are 2 sections: + +* Global variables +* One or more JOBS that can define multiple different instances to monitor. + +The following options can be defined globally: priority, penalty, autodetection_retry, update_every, but can also be defined per JOB to override the global values. + +Additionally, the following collapsed table contains all the options that can be configured inside a JOB definition. + +Every configuration JOB starts with a `job_name` value which will appear in the dashboard, unless a `name` parameter is specified. + + +<details><summary>Config options</summary> + +| Name | Description | Default | Required | +|:----|:-----------|:-------|:--------:| +| charts_regex | what charts to pull data for - A regex like `system\..*/` or `system\..*/apps.cpu/apps.mem` etc. | system\..* | True | +| train_secs | length of time (in seconds) to base calculations off for mean and stddev. | 14400 | True | +| offset_secs | offset (in seconds) preceding latest data to ignore when calculating mean and stddev. | 300 | True | +| train_every_n | recalculate the mean and stddev every n steps of the collector. | 900 | True | +| z_smooth_n | smooth the z score (to reduce sensitivity to spikes) by averaging it over last n values. | 15 | True | +| z_clip | cap absolute value of zscore (before smoothing) for better stability. | 10 | True | +| z_abs | set z_abs: 'true' to make all zscores be absolute values only. | true | True | +| burn_in | burn in period in which to initially calculate mean and stddev on every step. | 2 | True | +| mode | mode can be to get a zscore 'per_dim' or 'per_chart'. | per_chart | True | +| per_chart_agg | per_chart_agg is how you aggregate from dimension to chart when mode='per_chart'. | mean | True | +| update_every | Sets the default data collection frequency. | 5 | False | +| priority | Controls the order of charts at the netdata dashboard. | 60000 | False | +| autodetection_retry | Sets the job re-check interval in seconds. | 0 | False | +| penalty | Indicates whether to apply penalty to update_every in case of failures. | yes | False | + +</details> + +#### Examples + +##### Default + +Default configuration. + +```yaml +local: + name: 'local' + host: '127.0.0.1:19999' + charts_regex: 'system\..*' + charts_to_exclude: 'system.uptime' + train_secs: 14400 + offset_secs: 300 + train_every_n: 900 + z_smooth_n: 15 + z_clip: 10 + z_abs: 'true' + burn_in: 2 + mode: 'per_chart' + per_chart_agg: 'mean' + +``` + + +## Troubleshooting + +### Debug Mode + +To troubleshoot issues with the `zscores` collector, run the `python.d.plugin` with the debug option enabled. The output +should give you clues as to why the collector isn't working. + +- Navigate to the `plugins.d` directory, usually at `/usr/libexec/netdata/plugins.d/`. If that's not the case on + your system, open `netdata.conf` and look for the `plugins` setting under `[directories]`. + + ```bash + cd /usr/libexec/netdata/plugins.d/ + ``` + +- Switch to the `netdata` user. + + ```bash + sudo -u netdata -s + ``` + +- Run the `python.d.plugin` to debug the collector: + + ```bash + ./python.d.plugin zscores debug trace + ``` + + |