
diff options
Diffstat (limited to 'collectors/python.d.plugin')
17 files changed, 1045 insertions, 34 deletions
diff --git a/collectors/python.d.plugin/Makefile.am b/collectors/python.d.plugin/Makefile.am index 1de2d1d54..38eb90f79 100644 --- a/collectors/python.d.plugin/Makefile.am +++ b/collectors/python.d.plugin/Makefile.am @@ -48,6 +48,7 @@ include beanstalk/Makefile.inc include bind_rndc/Makefile.inc include boinc/Makefile.inc include ceph/Makefile.inc +include changefinder/Makefile.inc include chrony/Makefile.inc include couchdb/Makefile.inc include dnsdist/Makefile.inc @@ -109,6 +110,7 @@ include uwsgi/Makefile.inc include varnish/Makefile.inc include w1sensor/Makefile.inc include web_log/Makefile.inc +include zscores/Makefile.inc pythonmodulesdir=$(pythondir)/python_modules dist_pythonmodules_DATA = \ diff --git a/collectors/python.d.plugin/README.md b/collectors/python.d.plugin/README.md index 312986e48..9170350fb 100644 --- a/collectors/python.d.plugin/README.md +++ b/collectors/python.d.plugin/README.md @@ -93,7 +93,7 @@ have made to do your development on). ```bash # clone your fork (done once at the start but shown here for clarity) -#git clone --branch my-example-collector https://github.com/mygithubusername/netdata.git --depth=100 +#git clone --branch my-example-collector https://github.com/mygithubusername/netdata.git --depth=100 --recursive # go into your netdata source folder cd netdata # git pull your latest changes (assuming you built from a fork you are using to develop on) @@ -127,7 +127,7 @@ CHART = { ]} ``` -All names are better explained in the [External Plugins](../) section. +All names are better explained in the [External Plugins](/collectors/plugins.d/README.md) section. Parameters like `priority` and `update_every` are handled by `python.d.plugin`. ### `Service` class diff --git a/collectors/python.d.plugin/anomalies/README.md b/collectors/python.d.plugin/anomalies/README.md index bcbfdbcd7..9d24e8685 100644 --- a/collectors/python.d.plugin/anomalies/README.md +++ b/collectors/python.d.plugin/anomalies/README.md @@ -35,18 +35,26 @@ Then, as the issue passes, the anomaly probabilities should settle back down int ## Requirements - This collector will only work with Python 3 and requires the packages below be installed. +- Typically you will not need to do this, but, if needed, to ensure Python 3 is used you can add the below line to the `[plugin:python.d]` section of `netdata.conf` + +```conf +[plugin:python.d] + # update every = 1 + command options = -ppython3 +``` + +Install the required python libraries. ```bash # become netdata user sudo su -s /bin/bash netdata # install required packages for the netdata user -pip3 install --user netdata-pandas==0.0.32 numba==0.50.1 scikit-learn==0.23.2 pyod==0.8.3 +pip3 install --user netdata-pandas==0.0.38 numba==0.50.1 scikit-learn==0.23.2 pyod==0.8.3 ``` ## Configuration -Install the Python requirements above, enable the collector and [restart -Netdata](/docs/configure/start-stop-restart.md). +Install the Python requirements above, enable the collector and restart Netdata. ```bash cd /etc/netdata/ @@ -69,7 +77,7 @@ sudo ./edit-config python.d/anomalies.conf The default configuration should look something like this. Here you can see each parameter (with sane defaults) and some information about each one and what it does. -```yaml +```conf # ---------------------------------------------------------------------- # JOBS (data collection sources) @@ -87,6 +95,9 @@ local: # Use http or https to pull data protocol: 'http' + # SSL verify parameter for requests.get() calls + tls_verify: true + # What charts to pull data for - A regex like 'system\..*|' or 'system\..*|apps.cpu|apps.mem' etc. charts_regex: 'system\..*' @@ -229,4 +240,4 @@ If you would like to go deeper on what exactly the anomalies collector is doing - Good [blog post](https://www.anodot.com/blog/what-is-anomaly-detection/) from Anodot on time series anomaly detection. Anodot also have some great whitepapers in this space too that some may find useful. - Novelty and outlier detection in the [scikit-learn documentation](https://scikit-learn.org/stable/modules/outlier_detection.html). -[]() +[]()
\ No newline at end of file diff --git a/collectors/python.d.plugin/anomalies/anomalies.chart.py b/collectors/python.d.plugin/anomalies/anomalies.chart.py index 97dbb1d1e..61b51d9c0 100644 --- a/collectors/python.d.plugin/anomalies/anomalies.chart.py +++ b/collectors/python.d.plugin/anomalies/anomalies.chart.py @@ -3,6 +3,7 @@ # Author: andrewm4894 # SPDX-License-Identifier: GPL-3.0-or-later +import sys import time from datetime import datetime import re @@ -51,14 +52,17 @@ class Service(SimpleService): self.basic_init() self.charts_init() self.custom_models_init() + self.data_init() self.model_params_init() self.models_init() + self.collected_dims = {'probability': set(), 'anomaly': set()} def check(self): - _ = get_allmetrics_async( - host_charts_dict=self.host_charts_dict, host_prefix=True, host_sep='::', wide=True, sort_cols=True, - protocol=self.protocol, numeric_only=True, float_size='float32', user=self.username, pwd=self.password - ) + python_version = float('{}.{}'.format(sys.version_info[0], sys.version_info[1])) + if python_version < 3.6: + self.error("anomalies collector only works with Python>=3.6") + if len(self.host_charts_dict[self.host]) > 0: + _ = get_allmetrics_async(host_charts_dict=self.host_charts_dict, protocol=self.protocol, user=self.username, pwd=self.password) return True def basic_init(self): @@ -70,17 +74,18 @@ class Service(SimpleService): self.host = self.configuration.get('host', '127.0.0.1:19999') self.username = self.configuration.get('username', None) self.password = self.configuration.get('password', None) + self.tls_verify = self.configuration.get('tls_verify', True) self.fitted_at = {} self.df_allmetrics = pd.DataFrame() - self.data_latest = {} self.last_train_at = 0 self.include_average_prob = bool(self.configuration.get('include_average_prob', True)) + self.reinitialize_at_every_step = bool(self.configuration.get('reinitialize_at_every_step', False)) def charts_init(self): """Do some initialisation of charts in scope related variables. """ self.charts_regex = re.compile(self.configuration.get('charts_regex','None')) - self.charts_available = [c for c in list(requests.get(f'{self.protocol}://{self.host}/api/v1/charts').json().get('charts', {}).keys())] + self.charts_available = [c for c in list(requests.get(f'{self.protocol}://{self.host}/api/v1/charts', verify=self.tls_verify).json().get('charts', {}).keys())] self.charts_in_scope = list(filter(self.charts_regex.match, self.charts_available)) self.charts_to_exclude = self.configuration.get('charts_to_exclude', '').split(',') if len(self.charts_to_exclude) > 0: @@ -115,6 +120,14 @@ class Service(SimpleService): self.models_in_scope = [f'{self.host}::{c}' for c in self.charts_in_scope] self.host_charts_dict = {self.host: self.charts_in_scope} self.model_display_names = {model: model.split('::')[1] if '::' in model else model for model in self.models_in_scope} + #self.info(f'self.host_charts_dict (len={len(self.host_charts_dict[self.host])}): {self.host_charts_dict}') + + def data_init(self): + """Initialize some empty data objects. + """ + self.data_probability_latest = {f'{m}_prob': 0 for m in self.charts_in_scope} + self.data_anomaly_latest = {f'{m}_anomaly': 0 for m in self.charts_in_scope} + self.data_latest = {**self.data_probability_latest, **self.data_anomaly_latest} def model_params_init(self): """Model parameters initialisation. @@ -153,12 +166,55 @@ class Service(SimpleService): self.models = {model: HBOS(contamination=self.contamination) for model in self.models_in_scope} self.custom_model_scalers = {model: MinMaxScaler() for model in self.models_in_scope} - def validate_charts(self, name, data, algorithm='absolute', multiplier=1, divisor=1): + def model_init(self, model): + """Model initialisation of a single model. + """ + if self.model == 'pca': + self.models[model] = PCA(contamination=self.contamination) + elif self.model == 'loda': + self.models[model] = LODA(contamination=self.contamination) + elif self.model == 'iforest': + self.models[model] = IForest(n_estimators=50, bootstrap=True, behaviour='new', contamination=self.contamination) + elif self.model == 'cblof': + self.models[model] = CBLOF(n_clusters=3, contamination=self.contamination) + elif self.model == 'feature_bagging': + self.models[model] = FeatureBagging(base_estimator=PCA(contamination=self.contamination), contamination=self.contamination) + elif self.model == 'copod': + self.models[model] = COPOD(contamination=self.contamination) + elif self.model == 'hbos': + self.models[model] = HBOS(contamination=self.contamination) + else: + self.models[model] = HBOS(contamination=self.contamination) + self.custom_model_scalers[model] = MinMaxScaler() + + def reinitialize(self): + """Reinitialize charts, models and data to a begining state. + """ + self.charts_init() + self.custom_models_init() + self.data_init() + self.model_params_init() + self.models_init() + + def save_data_latest(self, data, data_probability, data_anomaly): + """Save the most recent data objects to be used if needed in the future. + """ + self.data_latest = data + self.data_probability_latest = data_probability + self.data_anomaly_latest = data_anomaly + + def validate_charts(self, chart, data, algorithm='absolute', multiplier=1, divisor=1): """If dimension not in chart then add it. """ for dim in data: - if dim not in self.charts[name]: - self.charts[name].add_dimension([dim, dim, algorithm, multiplier, divisor]) + if dim not in self.collected_dims[chart]: + self.collected_dims[chart].add(dim) + self.charts[chart].add_dimension([dim, dim, algorithm, multiplier, divisor]) + + for dim in list(self.collected_dims[chart]): + if dim not in data: + self.collected_dims[chart].remove(dim) + self.charts[chart].del_dimension(dim, hide=False) def add_custom_models_dims(self, df): """Given a df, select columns used by custom models, add custom model name as prefix, and append to df. @@ -242,8 +298,9 @@ class Service(SimpleService): # get training data df_train = get_data( host_charts_dict=self.host_charts_dict, host_prefix=True, host_sep='::', after=after, before=before, - sort_cols=True, numeric_only=True, protocol=self.protocol, float_size='float32', user=self.username, pwd=self.password - ).ffill() + sort_cols=True, numeric_only=True, protocol=self.protocol, float_size='float32', user=self.username, pwd=self.password, + verify=self.tls_verify + ).ffill() if self.custom_models: df_train = self.add_custom_models_dims(df_train) @@ -262,6 +319,8 @@ class Service(SimpleService): models_to_train = list(self.models.keys()) self.n_fit_fail, self.n_fit_success = 0, 0 for model in models_to_train: + if model not in self.models: + self.model_init(model) X_train = self.make_features( df_train[df_train.columns[df_train.columns.str.startswith(f'{model}|')]].values, train=True, model=model) @@ -303,13 +362,16 @@ class Service(SimpleService): data_probability, data_anomaly = {}, {} for model in self.fitted_at.keys(): model_display_name = self.model_display_names[model] - X_model = np.nan_to_num(self.make_features( - self.df_allmetrics[self.df_allmetrics.columns[self.df_allmetrics.columns.str.startswith(f'{model}|')]].values, - model=model)[-1,:].reshape(1, -1)) try: + X_model = np.nan_to_num( + self.make_features( + self.df_allmetrics[self.df_allmetrics.columns[self.df_allmetrics.columns.str.startswith(f'{model}|')]].values, + model=model + )[-1,:].reshape(1, -1) + ) data_probability[model_display_name + '_prob'] = np.nan_to_num(self.models[model].predict_proba(X_model)[-1][1]) * 10000 data_anomaly[model_display_name + '_anomaly'] = self.models[model].predict(X_model)[-1] - except Exception: + except Exception as _: #self.info(e) if model_display_name + '_prob' in self.data_latest: #self.info(f'prediction failed for {model} at run_counter {self.runs_counter}, using last prediction instead.') @@ -323,27 +385,42 @@ class Service(SimpleService): def get_data(self): + # initialize to whats available right now + if self.reinitialize_at_every_step or len(self.host_charts_dict[self.host]) == 0: + self.charts_init() + self.custom_models_init() + self.model_params_init() + # if not all models have been trained then train those we need to - if len(self.fitted_at) < len(self.models): + if len(self.fitted_at) < len(self.models_in_scope): self.train( - models_to_train=[m for m in self.models if m not in self.fitted_at], + models_to_train=[m for m in self.models_in_scope if m not in self.fitted_at], train_data_after=self.initial_train_data_after, - train_data_before=self.initial_train_data_before) + train_data_before=self.initial_train_data_before + ) # retrain all models as per schedule from config elif self.train_every_n > 0 and self.runs_counter % self.train_every_n == 0: + self.reinitialize() self.train() # roll forward previous predictions around a training step to avoid the possibility of having the training itself trigger an anomaly if (self.runs_counter - self.last_train_at) <= self.train_no_prediction_n: - data = self.data_latest + data_probability = self.data_probability_latest + data_anomaly = self.data_anomaly_latest else: data_probability, data_anomaly = self.predict() if self.include_average_prob: - data_probability['average_prob'] = np.mean(list(data_probability.values())) - data = {**data_probability, **data_anomaly} - self.validate_charts('probability', data_probability, divisor=100) - self.validate_charts('anomaly', data_anomaly) + average_prob = np.mean(list(data_probability.values())) + data_probability['average_prob'] = 0 if np.isnan(average_prob) else average_prob + + data = {**data_probability, **data_anomaly} - self.data_latest = data + self.validate_charts('probability', data_probability, divisor=100) + self.validate_charts('anomaly', data_anomaly) + + self.save_data_latest(data, data_probability, data_anomaly) + + #self.info(f'len(data)={len(data)}') + #self.info(f'data') return data diff --git a/collectors/python.d.plugin/anomalies/anomalies.conf b/collectors/python.d.plugin/anomalies/anomalies.conf index 9950534aa..0dc40ef2c 100644 --- a/collectors/python.d.plugin/anomalies/anomalies.conf +++ b/collectors/python.d.plugin/anomalies/anomalies.conf @@ -44,6 +44,9 @@ local: # Use http or https to pull data protocol: 'http' + # SSL verify parameter for requests.get() calls + tls_verify: true + # What charts to pull data for - A regex like 'system\..*|' or 'system\..*|apps.cpu|apps.mem' etc. charts_regex: 'system\..*' diff --git a/collectors/python.d.plugin/changefinder/Makefile.inc b/collectors/python.d.plugin/changefinder/Makefile.inc new file mode 100644 index 000000000..01a92408b --- /dev/null +++ b/collectors/python.d.plugin/changefinder/Makefile.inc @@ -0,0 +1,13 @@ +# SPDX-License-Identifier: GPL-3.0-or-later + +# THIS IS NOT A COMPLETE Makefile +# IT IS INCLUDED BY ITS PARENT'S Makefile.am +# IT IS REQUIRED TO REFERENCE ALL FILES RELATIVE TO THE PARENT + +# install these files +dist_python_DATA += changefinder/changefinder.chart.py +dist_pythonconfig_DATA += changefinder/changefinder.conf + +# do not install these files, but include them in the distribution +dist_noinst_DATA += changefinder/README.md changefinder/Makefile.inc + diff --git a/collectors/python.d.plugin/changefinder/README.md b/collectors/python.d.plugin/changefinder/README.md new file mode 100644 index 000000000..e1c1d4ba4 --- /dev/null +++ b/collectors/python.d.plugin/changefinder/README.md @@ -0,0 +1,218 @@ +<!-- +title: "Online change point detection with Netdata" +description: "Use ML-driven change point detection to narrow your focus and shorten root cause analysis." +custom_edit_url: https://github.com/netdata/netdata/edit/master/collectors/python.d.plugin/changefinder/README.md +--> + +# Online changepoint detection with Netdata + +This collector uses the Python [changefinder](https://github.com/shunsukeaihara/changefinder) library to +perform [online](https://en.wikipedia.org/wiki/Online_machine_learning) [changepoint detection](https://en.wikipedia.org/wiki/Change_detection) +on your Netdata charts and/or dimensions. + +Instead of this collector just _collecting_ data, it also does some computation on the data it collects to return a +changepoint score for each chart or dimension you configure it to work on. This is +an [online](https://en.wikipedia.org/wiki/Online_machine_learning) machine learning algorithim so there is no batch step +to train the model, instead it evolves over time as more data arrives. That makes this particualr algorithim quite cheap +to compute at each step of data collection (see the notes section below for more details) and it should scale fairly +well to work on lots of charts or hosts (if running on a parent node for example). + +> As this is a somewhat unique collector and involves often subjective concepts like changepoints and anomalies, we would love to hear any feedback on it from the community. Please let us know on the [community forum](https://community.netdata.cloud/t/changefinder-collector-feedback/972) or drop us a note at [analytics-ml-team@netdata.cloud](mailto:analytics-ml-team@netdata.cloud) for any and all feedback, both positive and negative. This sort of feedback is priceless to help us make complex features more useful. + +## Charts + +Two charts are available: + +### ChangeFinder Scores (`changefinder.scores`) + +This chart shows the percentile of the score that is output from the ChangeFinder library (it is turned off by default +but available with `show_scores: true`). + +A high observed score is more likley to be a valid changepoint worth exploring, even more so when multiple charts or +dimensions have high changepoint scores at the same time or very close together. + +### ChangeFinder Flags (`changefinder.flags`) + +This chart shows `1` or `0` if the latest score has a percentile value that exceeds the `cf_threshold` threshold. By +default, any scores that are in the 99th or above percentile will raise a flag on this chart. + +The raw changefinder score itself can be a little noisey and so limiting ourselves to just periods where it surpasses +the 99th percentile can help manage the "[signal to noise ratio](https://en.wikipedia.org/wiki/Signal-to-noise_ratio)" +better. + +The `cf_threshold` paramater might be one you want to play around with to tune things specifically for the workloads on +your node and the specific charts you want to monitor. For example, maybe the 95th percentile might work better for you +than the 99th percentile. + +Below is an example of the chart produced by this collector. The first 3/4 of the period looks normal in that we see a +few individual changes being picked up somewhat randomly over time. But then at around 14:59 towards the end of the +chart we see two periods with 'spikes' of multiple changes for a small period of time. This is the sort of pattern that +might be a sign something on the system that has changed sufficiently enough to merit some investigation. + + + +## Requirements + +- This collector will only work with Python 3 and requires the packages below be installed. + +```bash +# become netdata user +sudo su -s /bin/bash netdata +# install required packages for the netdata user +pip3 install --user numpy==1.19.5 changefinder==0.03 scipy==1.5.4 +``` + +**Note**: if you need to tell Netdata to use Python 3 then you can pass the below command in the python plugin section +of your `netdata.conf` file. + +```yaml +[ plugin:python.d ] + # update every = 1 + command options = -ppython3 +``` + +## Configuration + +Install the Python requirements above, enable the collector and restart Netdata. + +```bash +cd /etc/netdata/ +sudo ./edit-config python.d.conf +# Set `changefinder: no` to `changefinder: yes` +sudo systemctl restart netdata +``` + +The configuration for the changefinder collector defines how it will behave on your system and might take some +experimentation with over time to set it optimally for your node. Out of the box, the config comes with +some [sane defaults](https://www.netdata.cloud/blog/redefining-monitoring-netdata/) to get you started that try to +balance the flexibility and power of the ML models with the goal of being as cheap as possible in term of cost on the +node resources. + +_**Note**: If you are unsure about any of the below configuration options then it's best to just ignore all this and +leave the `changefinder.conf` file alone to begin with. Then you can return to it later if you would like to tune things +a bit more once the collector is running for a while and you have a feeling for its performance on your node._ + +Edit the `python.d/changefinder.conf` configuration file using `edit-config` from the your +agent's [config directory](/docs/configure/nodes.md), which is usually at `/etc/netdata`. + +```bash +cd /etc/netdata # Replace this path with your Netdata config directory, if different +sudo ./edit-config python.d/changefinder.conf +``` + +The default configuration should look something like this. Here you can see each parameter (with sane defaults) and some +information about each one and what it does. + +```yaml +# ---------------------------------------------------------------------- +# JOBS (data collection sources) + +# Pull data from local Netdata node. +local: + + # A friendly name for this job. + name: 'local' + + # What host to pull data from. + host: '127.0.0.1:19999' + + # What charts to pull data for - A regex like 'system\..*|' or 'system\..*|apps.cpu|apps.mem' etc. + charts_regex: 'system\..*' + + # Charts to exclude, useful if you would like to exclude some specific charts. + # Note: should be a ',' separated string like 'chart.name,chart.name'. + charts_to_exclude: '' + + # Get ChangeFinder scores 'per_dim' or 'per_chart'. + mode: 'per_chart' + + # Default parameters that can be passed to the changefinder library. + cf_r: 0.5 + cf_order: 1 + cf_smooth: 15 + + # The percentile above which scores will be flagged. + cf_threshold: 99 + + # The number of recent scores to use when calculating the percentile of the changefinder score. + n_score_samples: 14400 + + # Set to true if you also want to chart the percentile scores in addition to the flags. + # Mainly useful for debugging or if you want to dive deeper on how the scores are evolving over time. + show_scores: false +``` + +## Troubleshooting + +To see any relevant log messages you can use a command like below. + +```bash +grep 'changefinder' /var/log/netdata/error.log +``` + +If you would like to log in as `netdata` user and run the collector in debug mode to see more detail. + +```bash +# become netdata user +sudo su -s /bin/bash netdata +# run collector in debug using `nolock` option if netdata is already running the collector itself. +/usr/libexec/netdata/plugins.d/python.d.plugin changefinder debug trace nolock +``` + +## Notes + +- It may take an hour or two (depending on your choice of `n_score_samples`) for the collector to 'settle' into it's + typical behaviour in terms of the trained models and scores you will see in the normal running of your node. Mainly + this is because it can take a while to build up a proper distribution of previous scores in over to convert the raw + score returned by the ChangeFinder algorithim into a percentile based on the most recent `n_score_samples` that have + already been produced. So when you first turn the collector on, it will have a lot of flags in the beginning and then + should 'settle down' once it has built up enough history. This is a typical characteristic of online machine learning + approaches which need some initial window of time before they can be useful. +- As this collector does most of the work in Python itself, you may want to try it out first on a test or development + system to get a sense of its performance characteristics on a node similar to where you would like to use it. +- On a development n1-standard-2 (2 vCPUs, 7.5 GB memory) vm running Ubuntu 18.04 LTS and not doing any work some of the + typical performance characteristics we saw from running this collector (with defaults) were: + - A runtime (`netdata.runtime_changefinder`) of ~30ms. + - Typically ~1% additional cpu usage. + - About ~85mb of ram (`apps.mem`) being continually used by the `python.d.plugin` under default configuration. + +## Useful links and further reading + +- [PyPi changefinder](https://pypi.org/project/changefinder/) reference page. +- [GitHub repo](https://github.com/shunsukeaihara/changefinder) for the changefinder library. +- Relevant academic papers: + - Yamanishi K, Takeuchi J. A unifying framework for detecting outliers and change points from nonstationary time + series data. 8th ACM SIGKDD international conference on Knowledge discovery and data mining - KDD02. 2002: + 676. ([pdf](https://citeseerx.ist.psu.edu/viewdoc/download?doi=10.1.1.12.3469&rep=rep1&type=pdf)) + - Kawahara Y, Sugiyama M. Sequential Change-Point Detection Based on Direct Density-Ratio Estimation. SIAM + International Conference on Data Mining. 2009: + 389–400. ([pdf](https://onlinelibrary.wiley.com/doi/epdf/10.1002/sam.10124)) + - Liu S, Yamada M, Collier N, Sugiyama M. Change-point detection in time-series data by relative density-ratio + estimation. Neural Networks. Jul.2013 43:72–83. [PubMed: 23500502] ([pdf](https://arxiv.org/pdf/1203.0453.pdf)) + - T. Iwata, K. Nakamura, Y. Tokusashi, and H. Matsutani, “Accelerating Online Change-Point Detection Algorithm using + 10 GbE FPGA NIC,” Proc. International European Conference on Parallel and Distributed Computing (Euro-Par’18) + Workshops, vol.11339, pp.506–517, Aug. + 2018 ([pdf](https://www.arc.ics.keio.ac.jp/~matutani/papers/iwata_heteropar2018.pdf)) +- The [ruptures](https://github.com/deepcharles/ruptures) python package is also a good place to learn more about + changepoint detection (mostly offline as opposed to online but deals with similar concepts). +- A nice [blog post](https://techrando.com/2019/08/14/a-brief-introduction-to-change-point-detection-using-python/) + showing some of the other options and libraries for changepoint detection in Python. +- [Bayesian changepoint detection](https://github.com/hildensia/bayesian_changepoint_detection) library - we may explore + implementing a collector for this or integrating this approach into this collector at a future date if there is + interest and it proves computationaly feasible. +- You might also find the + Netdata [anomalies collector](https://github.com/netdata/netdata/tree/master/collectors/python.d.plugin/anomalies) + interesting. +- [Anomaly Detection](https://en.wikipedia.org/wiki/Anomaly_detection) wikipedia page. +- [Anomaly Detection YouTube playlist](https://www.youtube.com/playlist?list=PL6Zhl9mK2r0KxA6rB87oi4kWzoqGd5vp0) + maintained by [andrewm4894](https://github.com/andrewm4894/) from Netdata. +- [awesome-TS-anomaly-detection](https://github.com/rob-med/awesome-TS-anomaly-detection) Github list of useful tools, + libraries and resources. +- [Mendeley public group](https://www.mendeley.com/community/interesting-anomaly-detection-papers/) with some + interesting anomaly detection papers we have been reading. +- Good [blog post](https://www.anodot.com/blog/what-is-anomaly-detection/) from Anodot on time series anomaly detection. + Anodot also have some great whitepapers in this space too that some may find useful. +- Novelty and outlier detection in + the [scikit-learn documentation](https://scikit-learn.org/stable/modules/outlier_detection.html). + +[]() diff --git a/collectors/python.d.plugin/changefinder/changefinder.chart.py b/collectors/python.d.plugin/changefinder/changefinder.chart.py new file mode 100644 index 000000000..c18e5600a --- /dev/null +++ b/collectors/python.d.plugin/changefinder/changefinder.chart.py @@ -0,0 +1,185 @@ +# -*- coding: utf-8 -*- +# Description: changefinder netdata python.d module +# Author: andrewm4894 +# SPDX-License-Identifier: GPL-3.0-or-later + +from json import loads +import re + +from bases.FrameworkServices.UrlService import UrlService + +import numpy as np +import changefinder +from scipy.stats import percentileofscore + +update_every = 5 +disabled_by_default = True + +ORDER = [ + 'scores', + 'flags' +] + +CHARTS = { + 'scores': { + 'options': [None, 'ChangeFinder', 'score', 'Scores', 'scores', 'line'], + 'lines': [] + }, + 'flags': { + 'options': [None, 'ChangeFinder', 'flag', 'Flags', 'flags', 'stacked'], + 'lines': [] + } +} + +DEFAULT_PROTOCOL = 'http' +DEFAULT_HOST = '127.0.0.1:19999' +DEFAULT_CHARTS_REGEX = 'system.*' +DEFAULT_MODE = 'per_chart' +DEFAULT_CF_R = 0.5 +DEFAULT_CF_ORDER = 1 +DEFAULT_CF_SMOOTH = 15 +DEFAULT_CF_DIFF = False +DEFAULT_CF_THRESHOLD = 99 +DEFAULT_N_SCORE_SAMPLES = 14400 +DEFAULT_SHOW_SCORES = False + + +class Service(UrlService): + def __init__(self, configuration=None, name=None): + UrlService.__init__(self, configuration=configuration, name=name) + self.order = ORDER + self.definitions = CHARTS + self.protocol = self.configuration.get('protocol', DEFAULT_PROTOCOL) + self.host = self.configuration.get('host', DEFAULT_HOST) + self.url = '{}://{}/api/v1/allmetrics?format=json'.format(self.protocol, self.host) + self.charts_regex = re.compile(self.configuration.get('charts_regex', DEFAULT_CHARTS_REGEX)) + self.charts_to_exclude = self.configuration.get('charts_to_exclude', '').split(',') + self.mode = self.configuration.get('mode', DEFAULT_MODE) + self.n_score_samples = int(self.configuration.get('n_score_samples', DEFAULT_N_SCORE_SAMPLES)) + self.show_scores = int(self.configuration.get('show_scores', DEFAULT_SHOW_SCORES)) + self.cf_r = float(self.configuration.get('cf_r', DEFAULT_CF_R)) + self.cf_order = int(self.configuration.get('cf_order', DEFAULT_CF_ORDER)) + self.cf_smooth = int(self.configuration.get('cf_smooth', DEFAULT_CF_SMOOTH)) + self.cf_diff = bool(self.configuration.get('cf_diff', DEFAULT_CF_DIFF)) + self.cf_threshold = float(self.configuration.get('cf_threshold', DEFAULT_CF_THRESHOLD)) + self.collected_dims = {'scores': set(), 'flags': set()} + self.models = {} + self.x_latest = {} + self.scores_latest = {} + self.scores_samples = {} + + def get_score(self, x, model): + """Update the score for the model based on most recent data, flag if it's percentile passes self.cf_threshold. + """ + + # get score + if model not in self.models: + # initialise empty model if needed + self.models[model] = changefinder.ChangeFinder(r=self.cf_r, order=self.cf_order, smooth=self.cf_smooth) + # if the update for this step fails then just fallback to last known score + try: + score = self.models[model].update(x) + self.scores_latest[model] = score + except Exception as _: + score = self.scores_latest.get(model, 0) + score = 0 if np.isnan(score) else score + + # update sample scores used to calculate percentiles + if model in self.scores_samples: + self.scores_samples[model].append(score) + else: + self.scores_samples[model] = [score] + self.scores_samples[model] = self.scores_samples[model][-self.n_score_samples:] + + # convert score to percentile + score = percentileofscore(self.scores_samples[model], score) + + # flag based on score percentile + flag = 1 if score >= self.cf_threshold else 0 + + return score, flag + + def validate_charts(self, chart, data, algorithm='absolute', multiplier=1, divisor=1): + """If dimension not in chart then add it. + """ + if not self.charts: + return + + for dim in data: + if dim not in self.collected_dims[chart]: + self.collected_dims[chart].add(dim) + self.charts[chart].add_dimension([dim, dim, algorithm, multiplier, divisor]) + + for dim in list(self.collected_dims[chart]): + if dim not in data: + self.collected_dims[chart].remove(dim) + self.charts[chart].del_dimension(dim, hide=False) + + def diff(self, x, model): + """Take difference of data. + """ + x_diff = x - self.x_latest.get(model, 0) + self.x_latest[model] = x + x = x_diff + return x + + def _get_data(self): + + # pull data from self.url + raw_data = self._get_raw_data() + if raw_data is None: + return None + + raw_data = loads(raw_data) + + # filter to just the data for the charts specified + charts_in_scope = list(filter(self.charts_regex.match, raw_data.keys())) + charts_in_scope = [c for c in charts_in_scope if c not in self.charts_to_exclude] + + data_score = {} + data_flag = {} + + # process each chart + for chart in charts_in_scope: + + if self.mode == 'per_chart': + + # average dims on chart and run changefinder on that average + x = [raw_data[chart]['dimensions'][dim]['value'] for dim in raw_data[chart]['dimensions']] + x = [x for x in x if x is not None] + + if len(x) > 0: + + x = sum(x) / len(x) + x = self.diff(x, chart) if self.cf_diff else x + + score, flag = self.get_score(x, chart) + if self.show_scores: + data_score['{}_score'.format(chart)] = score * 100 + data_flag[chart] = flag + + else: + + # run changefinder on each individual dim + for dim in raw_data[chart]['dimensions']: + + chart_dim = '{}|{}'.format(chart, dim) + + x = raw_data[chart]['dimensions'][dim]['value'] + x = x if x else 0 + x = self.diff(x, chart_dim) if self.cf_diff else x + + score, flag = self.get_score(x, chart_dim) + if self.show_scores: + data_score['{}_score'.format(chart_dim)] = score * 100 + data_flag[chart_dim] = flag + + self.validate_charts('flags', data_flag) + + if self.show_scores & len(data_score) > 0: + data_score['average_score'] = sum(data_score.values()) / len(data_score) + self.validate_charts('scores', data_score, divisor=100) + + data = {**data_score, **data_flag} + + return data diff --git a/collectors/python.d.plugin/changefinder/changefinder.conf b/collectors/python.d.plugin/changefinder/changefinder.conf new file mode 100644 index 000000000..56a681f1e --- /dev/null +++ b/collectors/python.d.plugin/changefinder/changefinder.conf @@ -0,0 +1,74 @@ +# netdata python.d.plugin configuration for example +# +# This file is in YaML format. Generally the format is: +# +# name: value +# +# There are 2 sections: +# - global variables +# - one or more JOBS +# +# JOBS allow you to collect values from multiple sources. +# Each source will have its own set of charts. +# +# JOB parameters have to be indented (using spaces only, example below). + +# ---------------------------------------------------------------------- +# Global Variables +# These variables set the defaults for all JOBs, however each JOB +# may define its own, overriding the defaults. + +# update_every sets the default data collection frequency. +# If unset, the python.d.plugin default is used. +# update_every: 5 + +# priority controls the order of charts at the netdata dashboard. +# Lower numbers move the charts towards the top of the page. +# If unset, the default for python.d.plugin is used. +# priority: 60000 + +# penalty indicates whether to apply penalty to update_every in case of failures. +# Penalty will increase every 5 failed updates in a row. Maximum penalty is 10 minutes. +# penalty: yes + +# autodetection_retry sets the job re-check interval in seconds. +# The job is not deleted if check fails. +# Attempts to start the job are made once every autodetection_retry. +# This feature is disabled by default. +# autodetection_retry: 0 + +# ---------------------------------------------------------------------- +# JOBS (data collection sources) + +local: + + # A friendly name for this job. + name: 'local' + + # What host to pull data from. + host: '127.0.0.1:19999' + + # What charts to pull data for - A regex like 'system\..*|' or 'system\..*|apps.cpu|apps.mem' etc. + charts_regex: 'system\..*' + + # Charts to exclude, useful if you would like to exclude some specific charts. + # Note: should be a ',' separated string like 'chart.name,chart.name'. + charts_to_exclude: '' + + # Get ChangeFinder scores 'per_dim' or 'per_chart'. + mode: 'per_chart' + + # Default parameters that can be passed to the changefinder library. + cf_r: 0.5 + cf_order: 1 + cf_smooth: 15 + + # The percentile above which scores will be flagged. + cf_threshold: 99 + + # The number of recent scores to use when calculating the percentile of the changefinder score. + n_score_samples: 14400 + + # Set to true if you also want to chart the percentile scores in addition to the flags. + # Mainly useful for debugging or if you want to dive deeper on how the scores are evolving over time. + show_scores: false diff --git a/collectors/python.d.plugin/nvidia_smi/README.md b/collectors/python.d.plugin/nvidia_smi/README.md index 9bfb2094b..f8ce824df 100644 --- a/collectors/python.d.plugin/nvidia_smi/README.md +++ b/collectors/python.d.plugin/nvidia_smi/README.md @@ -12,7 +12,13 @@ Monitors performance metrics (memory usage, fan speed, pcie bandwidth utilizatio ## Requirements and Notes - You must have the `nvidia-smi` tool installed and your NVIDIA GPU(s) must support the tool. Mostly the newer high end models used for AI / ML and Crypto or Pro range, read more about [nvidia_smi](https://developer.nvidia.com/nvidia-system-management-interface). -- You must enable this plugin as its disabled by default due to minor performance issues. +- You must enable this plugin, as its disabled by default due to minor performance issues: + ```bash + cd /etc/netdata # Replace this path with your Netdata config directory, if different + sudo ./edit-config python.d.conf + ``` + Remove the '#' before nvidia_smi so it reads: `nvidia_smi: yes`. + - On some systems when the GPU is idle the `nvidia-smi` tool unloads and there is added latency again when it is next queried. If you are running GPUs under constant workload this isn't likely to be an issue. - Currently the `nvidia-smi` tool is being queried via cli. Updating the plugin to use the nvidia c/c++ API directly should resolve this issue. See discussion here: <https://github.com/netdata/netdata/pull/4357> - Contributions are welcome. diff --git a/collectors/python.d.plugin/python.d.conf b/collectors/python.d.plugin/python.d.conf index 61cfd6093..af58b451c 100644 --- a/collectors/python.d.plugin/python.d.conf +++ b/collectors/python.d.plugin/python.d.conf @@ -38,6 +38,7 @@ apache_cache: no # boinc: yes # ceph: yes chrony: no +# changefinder: no # couchdb: yes # dns_query_time: yes # dnsdist: yes @@ -107,3 +108,4 @@ nginx_log: no # varnish: yes # w1sensor: yes # web_log: yes +# zscores: no diff --git a/collectors/python.d.plugin/python_modules/bases/charts.py b/collectors/python.d.plugin/python_modules/bases/charts.py index 93be43d14..2526af8ce 100644 --- a/collectors/python.d.plugin/python_modules/bases/charts.py +++ b/collectors/python.d.plugin/python_modules/bases/charts.py @@ -24,7 +24,7 @@ DIMENSION_SET = "SET '{id}' = {value}\n" CHART_VARIABLE_SET = "VARIABLE CHART '{id}' = {value}\n" RUNTIME_CHART_CREATE = "CHART netdata.runtime_{job_name} '' 'Execution time for {job_name}' 'ms' 'python.d' " \ - "netdata.pythond_runtime line 145000 {update_every}\n" \ + "netdata.pythond_runtime line 145000 {update_every} '' 'python.d.plugin' '{module_name}'\n" \ "DIMENSION run_time 'run time' absolute 1 1\n" @@ -45,6 +45,7 @@ def create_runtime_chart(func): chart = RUNTIME_CHART_CREATE.format( job_name=self.name, update_every=self._runtime_counters.update_every, + module_name=self.module_name, ) safe_print(chart) ok = func(*args, **kwargs) diff --git a/collectors/python.d.plugin/smartd_log/smartd_log.chart.py b/collectors/python.d.plugin/smartd_log/smartd_log.chart.py index e4a19d411..402035f14 100644 --- a/collectors/python.d.plugin/smartd_log/smartd_log.chart.py +++ b/collectors/python.d.plugin/smartd_log/smartd_log.chart.py @@ -50,6 +50,7 @@ ATTR199 = '199' ATTR202 = '202' ATTR206 = '206' ATTR233 = '233' +ATTR249 = '249' ATTR_READ_ERR_COR = 'read-total-err-corrected' ATTR_READ_ERR_UNC = 'read-total-unc-errors' ATTR_WRITE_ERR_COR = 'write-total-err-corrected' @@ -330,7 +331,13 @@ CHARTS = { 'lines': [], 'attrs': [ATTR233], 'algo': ABSOLUTE, - } + }, + 'nand_writes_1gib': { + 'options': [None, 'NAND Writes', 'GiB', 'wear', 'smartd_log.nand_writes_1gib', 'line'], + 'lines': [], + 'attrs': [ATTR249], + 'algo': ABSOLUTE, + }, } # NOTE: 'parse_temp' decodes ATA 194 raw value. Not heavily tested. Written by @Ferroin diff --git a/collectors/python.d.plugin/zscores/Makefile.inc b/collectors/python.d.plugin/zscores/Makefile.inc new file mode 100644 index 000000000..d8b182415 --- /dev/null +++ b/collectors/python.d.plugin/zscores/Makefile.inc @@ -0,0 +1,12 @@ +# SPDX-License-Identifier: GPL-3.0-or-later + +# THIS IS NOT A COMPLETE Makefile +# IT IS INCLUDED BY ITS PARENT'S Makefile.am +# IT IS REQUIRED TO REFERENCE ALL FILES RELATIVE TO THE PARENT + +# install these files +dist_python_DATA += zscores/zscores.chart.py +dist_pythonconfig_DATA += zscores/zscores.conf + +# do not install these files, but include them in the distribution +dist_noinst_DATA += zscores/README.md zscores/Makefile.inc diff --git a/collectors/python.d.plugin/zscores/README.md b/collectors/python.d.plugin/zscores/README.md new file mode 100644 index 000000000..0b4472374 --- /dev/null +++ b/collectors/python.d.plugin/zscores/README.md @@ -0,0 +1,146 @@ +<!-- +--- +title: "zscores" +description: "Use statistical anomaly detection to narrow your focus and shorten root cause analysis." +custom_edit_url: https://github.com/netdata/netdata/edit/master/collectors/python.d.plugin/zscores/README.md +--- +--> + +# Z-Scores - basic anomaly detection for your key metrics and charts + +Smoothed, rolling [Z-Scores](https://en.wikipedia.org/wiki/Standard_score) for selected metrics or charts. + +This collector uses the [Netdata rest api](https://learn.netdata.cloud/docs/agent/web/api) to get the `mean` and `stddev` +for each dimension on specified charts over a time range (defined by `train_secs` and `offset_secs`). For each dimension +it will calculate a Z-Score as `z = (x - mean) / stddev` (clipped at `z_clip`). Scores are then smoothed over +time (`z_smooth_n`) and, if `mode: 'per_chart'`, aggregated across dimensions to a smoothed, rolling chart level Z-Score +at each time step. + +## Charts + +Two charts are produced: + +- **Z-Score** (`zscores.z`): This chart shows the calculated Z-Score per chart (or dimension if `mode='per_dim'`). +- **Z-Score >3** (`zscores.3stddev`): This chart shows a `1` if the absolute value of the Z-Score is greater than 3 or + a `0` otherwise. + +Below is an example of the charts produced by this collector and a typical example of how they would look when things +are 'normal' on the system. Most of the zscores tend to bounce randomly around a range typically between 0 to +3 (or -3 +to +3 if `z_abs: 'false'`), a few charts might stay steady at a more constant higher value depending on your +configuration and the typical workload on your system (typically those charts that do not change that much have a +smaller range of values on which to calculate a zscore and so tend to have a higher typical zscore). + +So really its a combination of the zscores values themselves plus, perhaps more importantly, how they change when +something strange occurs on your system which can be most useful. + +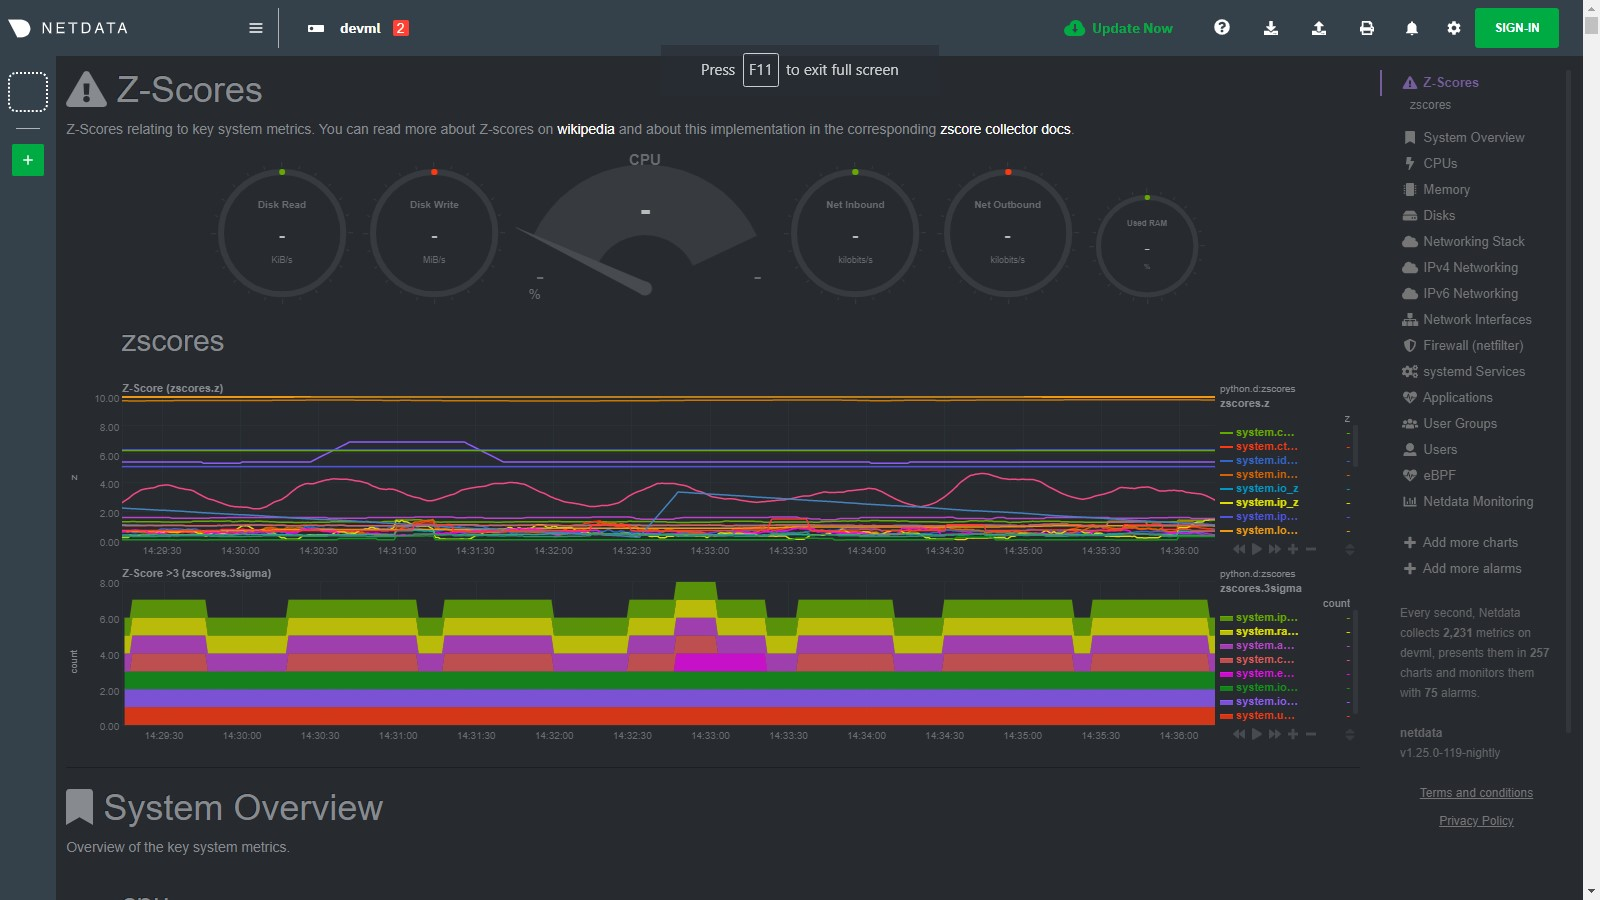 + +For example, if we go onto the system and run a command +like [`stress-ng --all 2`](https://wiki.ubuntu.com/Kernel/Reference/stress-ng) to create some stress, we see many charts +begin to have zscores that jump outside the typical range. When the absolute zscore for a chart is greater than 3 you +will see a corresponding line appear on the `zscores.3stddev` chart to make it a bit clearer what charts might be worth +looking at first (for more background information on why 3 stddev +see [here](https://en.wikipedia.org/wiki/68%E2%80%9395%E2%80%9399.7_rule#:~:text=In%20the%20empirical%20sciences%20the,99.7%25%20probability%20as%20near%20certainty.)) +. + +In the example below we basically took a sledge hammer to our system so its not suprising that lots of charts light up +after we run the stress command. In a more realistic setting you might just see a handful of charts with strange zscores +and that could be a good indication of where to look first. + +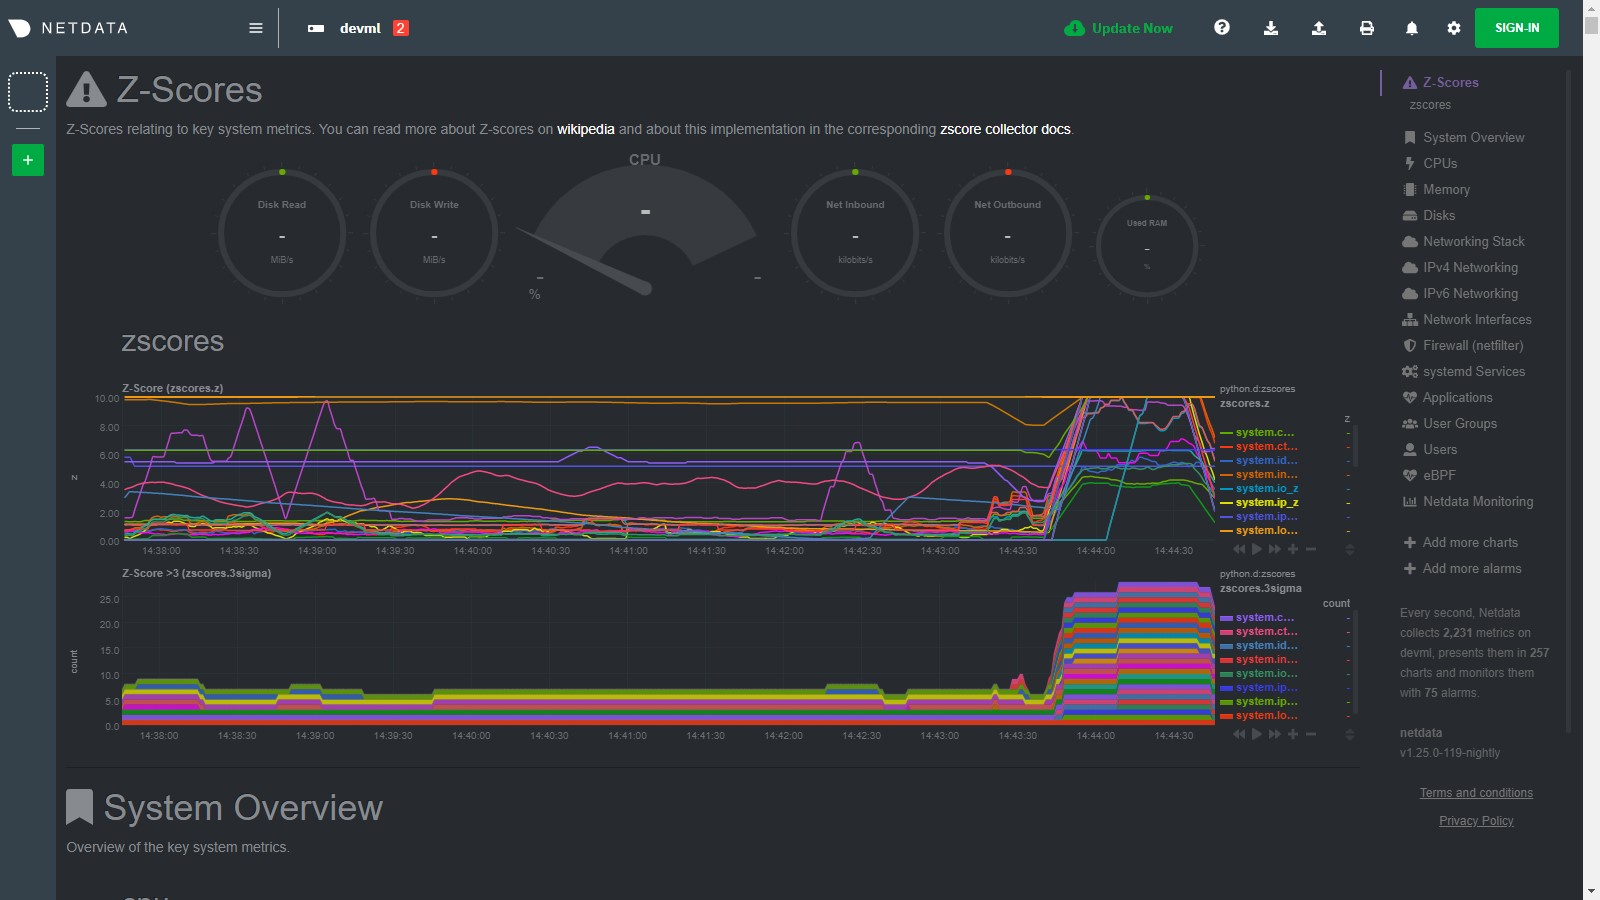 + +Then as the issue passes the zscores should settle back down into their normal range again as they are calculated in a +rolling and smoothed way (as defined by your `zscores.conf` file). + +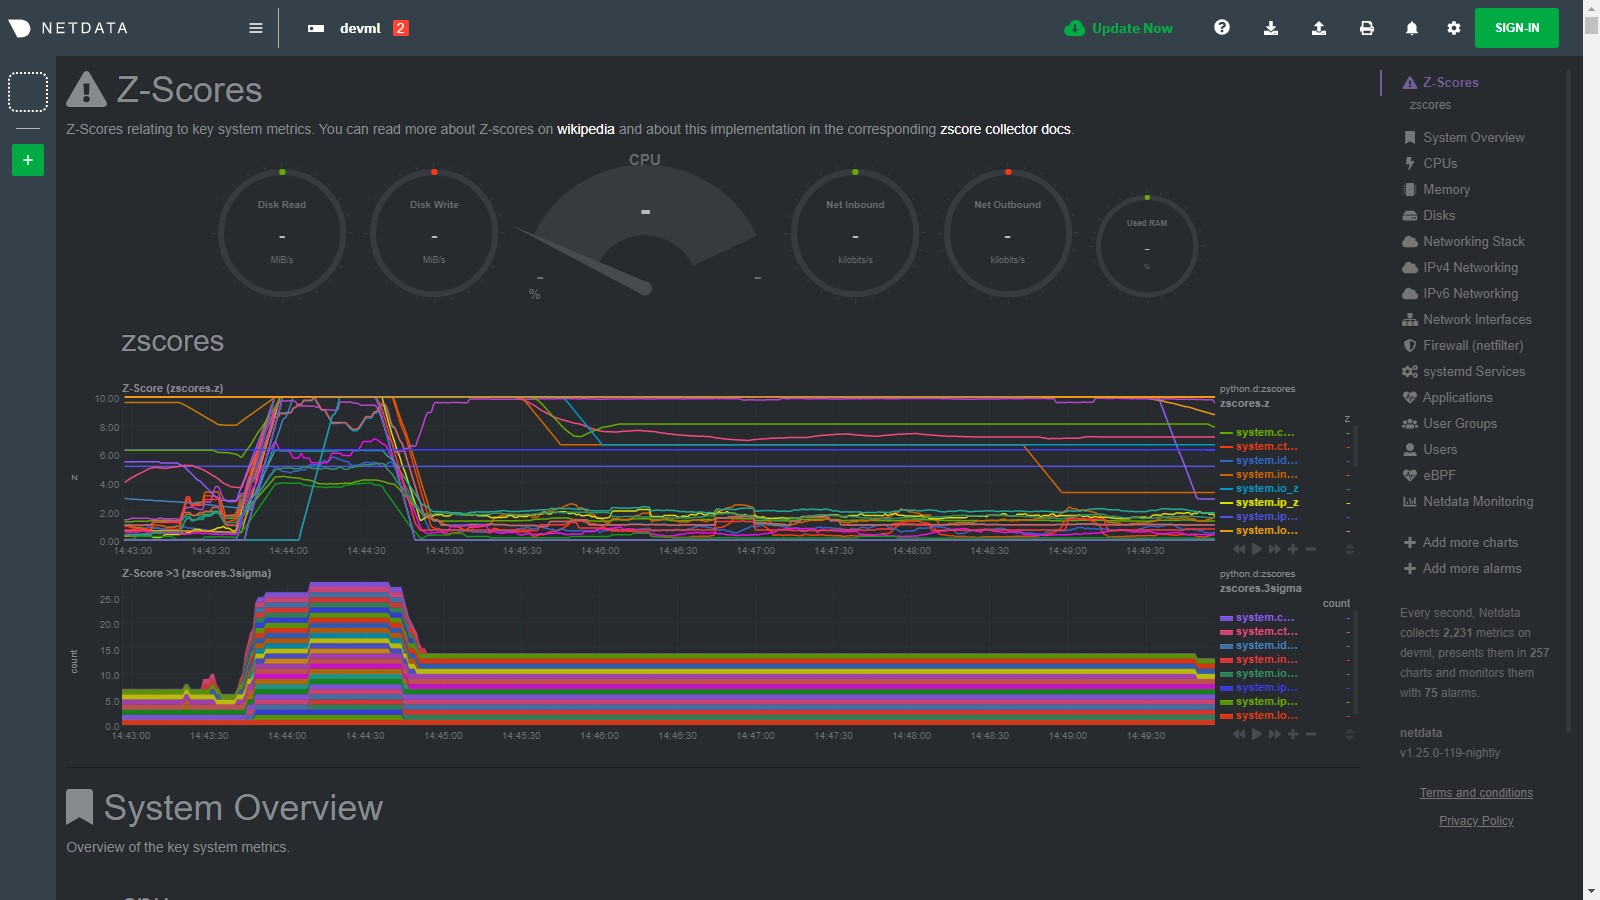 + +## Requirements + +This collector will only work with Python 3 and requires the below packages be installed. + +```bash +# become netdata user +sudo su -s /bin/bash netdata +# install required packages +pip3 install numpy pandas requests netdata-pandas==0.0.38 +``` + +## Configuration + +Install the underlying Python requirements, Enable the collector and restart Netdata. + +```bash +cd /etc/netdata/ +sudo ./edit-config python.d.conf +# Set `zscores: no` to `zscores: yes` +sudo systemctl restart netdata +``` + +The configuration for the zscores collector defines how it will behave on your system and might take some +experimentation with over time to set it optimally. Out of the box, the config comes with +some [sane defaults](https://www.netdata.cloud/blog/redefining-monitoring-netdata/) to get you started. + +If you are unsure about any of the below configuration options then it's best to just ignore all this and leave +the `zscores.conf` files alone to begin with. Then you can return to it later if you would like to tune things a bit +more once the collector is running for a while. + +Edit the `python.d/zscores.conf` configuration file using `edit-config` from the your +agent's [config directory](https://learn.netdata.cloud/guides/step-by-step/step-04#find-your-netdataconf-file), which is +usually at `/etc/netdata`. + +```bash +cd /etc/netdata # Replace this path with your Netdata config directory, if different +sudo ./edit-config python.d/zscores.conf +``` + +The default configuration should look something like this. Here you can see each parameter (with sane defaults) and some +information about each one and what it does. + +```bash +# what host to pull data from +host: '127.0.0.1:19999' +# What charts to pull data for - A regex like 'system\..*|' or 'system\..*|apps.cpu|apps.mem' etc. +charts_regex: 'system\..*' +# length of time to base calulcations off for mean and stddev +train_secs: 14400 # use last 4 hours to work out the mean and stddev for the zscore +# offset preceeding latest data to ignore when calculating mean and stddev +offset_secs: 300 # ignore last 5 minutes of data when calculating the mean and stddev +# recalculate the mean and stddev every n steps of the collector +train_every_n: 900 # recalculate mean and stddev every 15 minutes +# smooth the z score by averaging it over last n values +z_smooth_n: 15 # take a rolling average of the last 15 zscore values to reduce sensitivity to temporary 'spikes' +# cap absolute value of zscore (before smoothing) for better stability +z_clip: 10 # cap each zscore at 10 so as to avoid really large individual zscores swamping any rolling average +# set z_abs: 'true' to make all zscores be absolute values only. +z_abs: 'true' +# burn in period in which to initially calculate mean and stddev on every step +burn_in: 2 # on startup of the collector continually update the mean and stddev in case any gaps or inital calculations fail to return +# mode can be to get a zscore 'per_dim' or 'per_chart' +mode: 'per_chart' # 'per_chart' means individual dimension level smoothed zscores will be aggregated to one zscore per chart per time step +# per_chart_agg is how you aggregate from dimension to chart when mode='per_chart' +per_chart_agg: 'mean' # 'absmax' will take the max absolute value accross all dimensions but will maintain the sign. 'mean' will just average. +``` + +## Notes + +- Python 3 is required as the [`netdata-pandas`](https://github.com/netdata/netdata-pandas) package uses python async + libraries ([asks](https://pypi.org/project/asks/) and [trio](https://pypi.org/project/trio/)) to make asynchronous + calls to the netdata rest api to get the required data for each chart when calculating the mean and stddev. +- It may take a few hours or so for the collector to 'settle' into it's typical behaviour in terms of the scores you + will see in the normal running of your system. +- The zscore you see for each chart when using `mode: 'per_chart'` as actually an aggregated zscore accross all the + dimensions on the underlying chart. +- If you set `mode: 'per_dim'` then you will see a zscore for each dimension on each chart as opposed to one per chart. +- As this collector does some calculations itself in python you may want to try it out first on a test or development + system to get a sense of its performance characteristics. Most of the work in calculating the mean and stddev will be + pushed down to the underlying Netdata C libraries via the rest api. But some data wrangling and calculations are then + done using [Pandas](https://pandas.pydata.org/) and [Numpy](https://numpy.org/) within the collector itself. +- On a development n1-standard-2 (2 vCPUs, 7.5 GB memory) vm running Ubuntu 18.04 LTS and not doing any work some of the + typical performance characteristics we saw from running this collector were: + - A runtime (`netdata.runtime_zscores`) of ~50ms when doing scoring and ~500ms when recalculating the mean and + stddev. + - Typically 3%-3.5% cpu usage from scoring, jumping to ~35% for one second when recalculating the mean and stddev. + - About ~50mb of ram (`apps.mem`) being continually used by the `python.d.plugin`. +- If you activate this collector on a fresh node, it might take a little while to build up enough data to calculate a + proper zscore. So until you actually have `train_secs` of available data the mean and stddev calculated will be subject + to more noise.
\ No newline at end of file diff --git a/collectors/python.d.plugin/zscores/zscores.chart.py b/collectors/python.d.plugin/zscores/zscores.chart.py new file mode 100644 index 000000000..48397d8dd --- /dev/null +++ b/collectors/python.d.plugin/zscores/zscores.chart.py @@ -0,0 +1,146 @@ +# -*- coding: utf-8 -*- +# Description: zscores netdata python.d module +# Author: andrewm4894 +# SPDX-License-Identifier: GPL-3.0-or-later + +from datetime import datetime +import re + +import requests +import numpy as np +import pandas as pd + +from bases.FrameworkServices.SimpleService import SimpleService +from netdata_pandas.data import get_data, get_allmetrics + +priority = 60000 +update_every = 5 +disabled_by_default = True + +ORDER = [ + 'z', + '3stddev' +] + +CHARTS = { + 'z': { + 'options': ['z', 'Z Score', 'z', 'Z Score', 'z', 'line'], + 'lines': [] + }, + '3stddev': { + 'options': ['3stddev', 'Z Score >3', 'count', '3 Stddev', '3stddev', 'stacked'], + 'lines': [] + }, +} + + +class Service(SimpleService): + def __init__(self, configuration=None, name=None): + SimpleService.__init__(self, configuration=configuration, name=name) + self.host = self.configuration.get('host', '127.0.0.1:19999') + self.charts_regex = re.compile(self.configuration.get('charts_regex', 'system.*')) + self.charts_to_exclude = self.configuration.get('charts_to_exclude', '').split(',') + self.charts_in_scope = [ + c for c in + list(filter(self.charts_regex.match, + requests.get(f'http://{self.host}/api/v1/charts').json()['charts'].keys())) + if c not in self.charts_to_exclude + ] + self.train_secs = self.configuration.get('train_secs', 14400) + self.offset_secs = self.configuration.get('offset_secs', 300) + self.train_every_n = self.configuration.get('train_every_n', 900) + self.z_smooth_n = self.configuration.get('z_smooth_n', 15) + self.z_clip = self.configuration.get('z_clip', 10) + self.z_abs = bool(self.configuration.get('z_abs', True)) + self.burn_in = self.configuration.get('burn_in', 2) + self.mode = self.configuration.get('mode', 'per_chart') + self.per_chart_agg = self.configuration.get('per_chart_agg', 'mean') + self.order = ORDER + self.definitions = CHARTS + self.collected_dims = {'z': set(), '3stddev': set()} + self.df_mean = pd.DataFrame() + self.df_std = pd.DataFrame() + self.df_z_history = pd.DataFrame() + + def check(self): + _ = get_allmetrics(self.host, self.charts_in_scope, wide=True, col_sep='.') + return True + + def validate_charts(self, chart, data, algorithm='absolute', multiplier=1, divisor=1): + """If dimension not in chart then add it. + """ + for dim in data: + if dim not in self.collected_dims[chart]: + self.collected_dims[chart].add(dim) + self.charts[chart].add_dimension([dim, dim, algorithm, multiplier, divisor]) + + for dim in list(self.collected_dims[chart]): + if dim not in data: + self.collected_dims[chart].remove(dim) + self.charts[chart].del_dimension(dim, hide=False) + + def train_model(self): + """Calculate the mean and stddev for all relevant metrics and store them for use in calulcating zscore at each timestep. + """ + before = int(datetime.now().timestamp()) - self.offset_secs + after = before - self.train_secs + + self.df_mean = get_data( + self.host, self.charts_in_scope, after, before, points=10, group='average', col_sep='.' + ).mean().to_frame().rename(columns={0: "mean"}) + + self.df_std = get_data( + self.host, self.charts_in_scope, after, before, points=10, group='stddev', col_sep='.' + ).mean().to_frame().rename(columns={0: "std"}) + + def create_data(self, df_allmetrics): + """Use x, mean, stddev to generate z scores and 3stddev flags via some pandas manipulation. + Returning two dictionaries of dimensions and measures, one for each chart. + + :param df_allmetrics <pd.DataFrame>: pandas dataframe with latest data from api/v1/allmetrics. + :return: (<dict>,<dict>) tuple of dictionaries, one for zscores and the other for a flag if abs(z)>3. + """ + # calculate clipped z score for each available metric + df_z = pd.concat([self.df_mean, self.df_std, df_allmetrics], axis=1, join='inner') + df_z['z'] = ((df_z['value'] - df_z['mean']) / df_z['std']).clip(-self.z_clip, self.z_clip).fillna(0) * 100 + if self.z_abs: + df_z['z'] = df_z['z'].abs() + + # append last z_smooth_n rows of zscores to history table in wide format + self.df_z_history = self.df_z_history.append( + df_z[['z']].reset_index().pivot_table(values='z', columns='index'), sort=True + ).tail(self.z_smooth_n) + + # get average zscore for last z_smooth_n for each metric + df_z_smooth = self.df_z_history.melt(value_name='z').groupby('index')['z'].mean().to_frame() + df_z_smooth['3stddev'] = np.where(abs(df_z_smooth['z']) > 300, 1, 0) + data_z = df_z_smooth['z'].add_suffix('_z').to_dict() + + # aggregate to chart level if specified + if self.mode == 'per_chart': + df_z_smooth['chart'] = ['.'.join(x[0:2]) + '_z' for x in df_z_smooth.index.str.split('.').to_list()] + if self.per_chart_agg == 'absmax': + data_z = \ + list(df_z_smooth.groupby('chart').agg({'z': lambda x: max(x, key=abs)})['z'].to_dict().values())[0] + else: + data_z = list(df_z_smooth.groupby('chart').agg({'z': [self.per_chart_agg]})['z'].to_dict().values())[0] + + data_3stddev = {} + for k in data_z: + data_3stddev[k.replace('_z', '')] = 1 if abs(data_z[k]) > 300 else 0 + + return data_z, data_3stddev + + def get_data(self): + + if self.runs_counter <= self.burn_in or self.runs_counter % self.train_every_n == 0: + self.train_model() + + data_z, data_3stddev = self.create_data( + get_allmetrics(self.host, self.charts_in_scope, wide=True, col_sep='.').transpose()) + data = {**data_z, **data_3stddev} + + self.validate_charts('z', data_z, divisor=100) + self.validate_charts('3stddev', data_3stddev) + + return data diff --git a/collectors/python.d.plugin/zscores/zscores.conf b/collectors/python.d.plugin/zscores/zscores.conf new file mode 100644 index 000000000..fab18c787 --- /dev/null +++ b/collectors/python.d.plugin/zscores/zscores.conf @@ -0,0 +1,108 @@ +# netdata python.d.plugin configuration for example +# +# This file is in YaML format. Generally the format is: +# +# name: value +# +# There are 2 sections: +# - global variables +# - one or more JOBS +# +# JOBS allow you to collect values from multiple sources. +# Each source will have its own set of charts. +# +# JOB parameters have to be indented (using spaces only, example below). + +# ---------------------------------------------------------------------- +# Global Variables +# These variables set the defaults for all JOBs, however each JOB +# may define its own, overriding the defaults. + +# update_every sets the default data collection frequency. +# If unset, the python.d.plugin default is used. +update_every: 5 + +# priority controls the order of charts at the netdata dashboard. +# Lower numbers move the charts towards the top of the page. +# If unset, the default for python.d.plugin is used. +# priority: 60000 + +# penalty indicates whether to apply penalty to update_every in case of failures. +# Penalty will increase every 5 failed updates in a row. Maximum penalty is 10 minutes. +# penalty: yes + +# autodetection_retry sets the job re-check interval in seconds. +# The job is not deleted if check fails. +# Attempts to start the job are made once every autodetection_retry. +# This feature is disabled by default. +# autodetection_retry: 0 + +# ---------------------------------------------------------------------- +# JOBS (data collection sources) +# +# The default JOBS share the same *name*. JOBS with the same name +# are mutually exclusive. Only one of them will be allowed running at +# any time. This allows autodetection to try several alternatives and +# pick the one that works. +# +# Any number of jobs is supported. +# +# All python.d.plugin JOBS (for all its modules) support a set of +# predefined parameters. These are: +# +# job_name: +# name: myname # the JOB's name as it will appear at the +# # dashboard (by default is the job_name) +# # JOBs sharing a name are mutually exclusive +# update_every: 1 # the JOB's data collection frequency +# priority: 60000 # the JOB's order on the dashboard +# penalty: yes # the JOB's penalty +# autodetection_retry: 0 # the JOB's re-check interval in seconds +# +# Additionally to the above, example also supports the following: +# +# - none +# +# ---------------------------------------------------------------------- +# AUTO-DETECTION JOBS +# only one of them will run (they have the same name) + +local: + name: 'local' + + # what host to pull data from + host: '127.0.0.1:19999' + + # what charts to pull data for - A regex like 'system\..*|' or 'system\..*|apps.cpu|apps.mem' etc. + charts_regex: 'system\..*' + + # Charts to exclude, useful if you would like to exclude some specific charts. + # Note: should be a ',' separated string like 'chart.name,chart.name'. + charts_to_exclude: 'system.uptime' + + # length of time to base calculations off for mean and stddev + train_secs: 14400 # use last 4 hours to work out the mean and stddev for the zscore + + # offset preceeding latest data to ignore when calculating mean and stddev + offset_secs: 300 # ignore last 5 minutes of data when calculating the mean and stddev + + # recalculate the mean and stddev every n steps of the collector + train_every_n: 900 # recalculate mean and stddev every 15 minutes + + # smooth the z score by averaging it over last n values + z_smooth_n: 15 # take a rolling average of the last 15 zscore values to reduce sensitivity to temporary 'spikes' + + # cap absolute value of zscore (before smoothing) for better stability + z_clip: 10 # cap each zscore at 10 so as to avoid really large individual zscores swamping any rolling average + + # set z_abs: 'true' to make all zscores be absolute values only. + z_abs: 'true' + + # burn in period in which to initially calculate mean and stddev on every step + burn_in: 2 # on startup of the collector continually update the mean and stddev in case any gaps or inital calculations fail to return + + # mode can be to get a zscore 'per_dim' or 'per_chart' + mode: 'per_chart' # 'per_chart' means individual dimension level smoothed zscores will be aggregated to one zscore per chart per time step + + # per_chart_agg is how you aggregate from dimension to chart when mode='per_chart' + per_chart_agg: 'mean' # 'absmax' will take the max absolute value accross all dimensions but will maintain the sign. 'mean' will just average. |