
diff options
Diffstat (limited to 'collectors/python.d.plugin')
27 files changed, 581 insertions, 2554 deletions
diff --git a/collectors/python.d.plugin/Makefile.am b/collectors/python.d.plugin/Makefile.am index 9377ebe8d..1bbbf8ca0 100644 --- a/collectors/python.d.plugin/Makefile.am +++ b/collectors/python.d.plugin/Makefile.am @@ -66,14 +66,13 @@ include megacli/Makefile.inc include memcached/Makefile.inc include mongodb/Makefile.inc include monit/Makefile.inc -include nginx_plus/Makefile.inc include nvidia_smi/Makefile.inc include nsd/Makefile.inc include ntpd/Makefile.inc include openldap/Makefile.inc include oracledb/Makefile.inc +include pandas/Makefile.inc include postfix/Makefile.inc -include postgres/Makefile.inc include proxysql/Makefile.inc include puppet/Makefile.inc include rabbitmq/Makefile.inc diff --git a/collectors/python.d.plugin/alarms/README.md b/collectors/python.d.plugin/alarms/README.md index ee1e59971..8dc666f5b 100644 --- a/collectors/python.d.plugin/alarms/README.md +++ b/collectors/python.d.plugin/alarms/README.md @@ -58,6 +58,9 @@ local: # a "," separated list of words you want to filter alarm names for. For example 'cpu,load' would filter for only # alarms with "cpu" or "load" in alarm name. Default includes all. alarm_contains_words: '' + # a "," separated list of words you want to exclude based on alarm name. For example 'cpu,load' would exclude + # all alarms with "cpu" or "load" in alarm name. Default excludes None. + alarm_excludes_words: '' ``` It will default to pulling all alarms at each time step from the Netdata rest api at `http://127.0.0.1:19999/api/v1/alarms?all` diff --git a/collectors/python.d.plugin/alarms/alarms.chart.py b/collectors/python.d.plugin/alarms/alarms.chart.py index 314b0e7a8..d19427358 100644 --- a/collectors/python.d.plugin/alarms/alarms.chart.py +++ b/collectors/python.d.plugin/alarms/alarms.chart.py @@ -39,6 +39,7 @@ DEFAULT_URL = 'http://127.0.0.1:19999/api/v1/alarms?all' DEFAULT_COLLECT_ALARM_VALUES = False DEFAULT_ALARM_STATUS_CHART_TYPE = 'line' DEFAULT_ALARM_CONTAINS_WORDS = '' +DEFAULT_ALARM_EXCLUDES_WORDS = '' class Service(UrlService): def __init__(self, configuration=None, name=None): @@ -51,6 +52,8 @@ class Service(UrlService): self.collected_dims = {'alarms': set(), 'values': set()} self.alarm_contains_words = self.configuration.get('alarm_contains_words', DEFAULT_ALARM_CONTAINS_WORDS) self.alarm_contains_words_list = [alarm_contains_word.lstrip(' ').rstrip(' ') for alarm_contains_word in self.alarm_contains_words.split(',')] + self.alarm_excludes_words = self.configuration.get('alarm_excludes_words', DEFAULT_ALARM_EXCLUDES_WORDS) + self.alarm_excludes_words_list = [alarm_excludes_word.lstrip(' ').rstrip(' ') for alarm_excludes_word in self.alarm_excludes_words.split(',')] def _get_data(self): raw_data = self._get_raw_data() @@ -62,6 +65,9 @@ class Service(UrlService): if self.alarm_contains_words != '': alarms = {alarm_name: alarms[alarm_name] for alarm_name in alarms for alarm_contains_word in self.alarm_contains_words_list if alarm_contains_word in alarm_name} + if self.alarm_excludes_words != '': + alarms = {alarm_name: alarms[alarm_name] for alarm_name in alarms for alarm_excludes_word in + self.alarm_excludes_words_list if alarm_excludes_word not in alarm_name} data = {a: self.sm[alarms[a]['status']] for a in alarms if alarms[a]['status'] in self.sm} self.update_charts('alarms', data) diff --git a/collectors/python.d.plugin/alarms/alarms.conf b/collectors/python.d.plugin/alarms/alarms.conf index cd48d4411..06d76c3b3 100644 --- a/collectors/python.d.plugin/alarms/alarms.conf +++ b/collectors/python.d.plugin/alarms/alarms.conf @@ -55,3 +55,6 @@ local: # a "," separated list of words you want to filter alarm names for. For example 'cpu,load' would filter for only # alarms with "cpu" or "load" in alarm name. Default includes all. alarm_contains_words: '' + # a "," separated list of words you want to exclude based on alarm name. For example 'cpu,load' would exclude + # all alarms with "cpu" or "load" in alarm name. Default excludes None. + alarm_excludes_words: '' diff --git a/collectors/python.d.plugin/nginx_plus/Makefile.inc b/collectors/python.d.plugin/nginx_plus/Makefile.inc deleted file mode 100644 index d3fdeaf2b..000000000 --- a/collectors/python.d.plugin/nginx_plus/Makefile.inc +++ /dev/null @@ -1,13 +0,0 @@ -# SPDX-License-Identifier: GPL-3.0-or-later - -# THIS IS NOT A COMPLETE Makefile -# IT IS INCLUDED BY ITS PARENT'S Makefile.am -# IT IS REQUIRED TO REFERENCE ALL FILES RELATIVE TO THE PARENT - -# install these files -dist_python_DATA += nginx_plus/nginx_plus.chart.py -dist_pythonconfig_DATA += nginx_plus/nginx_plus.conf - -# do not install these files, but include them in the distribution -dist_noinst_DATA += nginx_plus/README.md nginx_plus/Makefile.inc - diff --git a/collectors/python.d.plugin/nginx_plus/README.md b/collectors/python.d.plugin/nginx_plus/README.md deleted file mode 100644 index 489ac9c2a..000000000 --- a/collectors/python.d.plugin/nginx_plus/README.md +++ /dev/null @@ -1,165 +0,0 @@ -<!-- -title: "NGINX Plus monitoring with Netdata" -custom_edit_url: https://github.com/netdata/netdata/edit/master/collectors/python.d.plugin/nginx_plus/README.md -sidebar_label: "NGINX Plus" ---> - -# NGINX Plus monitoring with Netdata - -Monitors one or more NGINX Plus servers depending on configuration. Servers can be either local or remote. - -Example nginx_plus configuration can be found in 'python.d/nginx_plus.conf' - -It produces following charts: - -1. **Requests total** in requests/s - - - total - -2. **Requests current** in requests - - - current - -3. **Connection Statistics** in connections/s - - - accepted - - dropped - -4. **Workers Statistics** in workers - - - idle - - active - -5. **SSL Handshakes** in handshakes/s - - - successful - - failed - -6. **SSL Session Reuses** in sessions/s - - - reused - -7. **SSL Memory Usage** in percent - - - usage - -8. **Processes** in processes - - - respawned - -For every server zone: - -1. **Processing** in requests - -- processing - -2. **Requests** in requests/s - - - requests - -3. **Responses** in requests/s - - - 1xx - - 2xx - - 3xx - - 4xx - - 5xx - -4. **Traffic** in kilobits/s - - - received - - sent - -For every upstream: - -1. **Peers Requests** in requests/s - - - peer name (dimension per peer) - -2. **All Peers Responses** in responses/s - - - 1xx - - 2xx - - 3xx - - 4xx - - 5xx - -3. **Peer Responses** in requests/s (for every peer) - - - 1xx - - 2xx - - 3xx - - 4xx - - 5xx - -4. **Peers Connections** in active - - - peer name (dimension per peer) - -5. **Peers Connections Usage** in percent - - - peer name (dimension per peer) - -6. **All Peers Traffic** in KB - - - received - - sent - -7. **Peer Traffic** in KB/s (for every peer) - - - received - - sent - -8. **Peer Timings** in ms (for every peer) - - - header - - response - -9. **Memory Usage** in percent - - - usage - -10. **Peers Status** in state - - - peer name (dimension per peer) - -11. **Peers Total Downtime** in seconds - - - peer name (dimension per peer) - -For every cache: - -1. **Traffic** in KB - - - served - - written - - bypass - -2. **Memory Usage** in percent - - - usage - -## Configuration - -Edit the `python.d/nginx_plus.conf` configuration file using `edit-config` from the Netdata [config -directory](/docs/configure/nodes.md), which is typically at `/etc/netdata`. - -```bash -cd /etc/netdata # Replace this path with your Netdata config directory, if different -sudo ./edit-config python.d/nginx_plus.conf -``` - -Needs only `url` to server's `status`. - -Here is an example for a local server: - -```yaml -local: - url : 'http://localhost/status' -``` - -Without configuration, module fail to start. - ---- - - diff --git a/collectors/python.d.plugin/nginx_plus/nginx_plus.chart.py b/collectors/python.d.plugin/nginx_plus/nginx_plus.chart.py deleted file mode 100644 index a6c035f68..000000000 --- a/collectors/python.d.plugin/nginx_plus/nginx_plus.chart.py +++ /dev/null @@ -1,487 +0,0 @@ -# -*- coding: utf-8 -*- -# Description: nginx_plus netdata python.d module -# Author: Ilya Mashchenko (ilyam8) -# SPDX-License-Identifier: GPL-3.0-or-later - -import re - -from collections import defaultdict -from copy import deepcopy -from json import loads - -try: - from collections import OrderedDict -except ImportError: - from third_party.ordereddict import OrderedDict - -from bases.FrameworkServices.UrlService import UrlService - -ORDER = [ - 'requests_total', - 'requests_current', - 'connections_statistics', - 'connections_workers', - 'ssl_handshakes', - 'ssl_session_reuses', - 'ssl_memory_usage', - 'processes' -] - -CHARTS = { - 'requests_total': { - 'options': [None, 'Requests Total', 'requests/s', 'requests', 'nginx_plus.requests_total', 'line'], - 'lines': [ - ['requests_total', 'total', 'incremental'] - ] - }, - 'requests_current': { - 'options': [None, 'Requests Current', 'requests', 'requests', 'nginx_plus.requests_current', 'line'], - 'lines': [ - ['requests_current', 'current'] - ] - }, - 'connections_statistics': { - 'options': [None, 'Connections Statistics', 'connections/s', - 'connections', 'nginx_plus.connections_statistics', 'stacked'], - 'lines': [ - ['connections_accepted', 'accepted', 'incremental'], - ['connections_dropped', 'dropped', 'incremental'] - ] - }, - 'connections_workers': { - 'options': [None, 'Workers Statistics', 'workers', - 'connections', 'nginx_plus.connections_workers', 'stacked'], - 'lines': [ - ['connections_idle', 'idle'], - ['connections_active', 'active'] - ] - }, - 'ssl_handshakes': { - 'options': [None, 'SSL Handshakes', 'handshakes/s', 'ssl', 'nginx_plus.ssl_handshakes', 'stacked'], - 'lines': [ - ['ssl_handshakes', 'successful', 'incremental'], - ['ssl_handshakes_failed', 'failed', 'incremental'] - ] - }, - 'ssl_session_reuses': { - 'options': [None, 'Session Reuses', 'sessions/s', 'ssl', 'nginx_plus.ssl_session_reuses', 'line'], - 'lines': [ - ['ssl_session_reuses', 'reused', 'incremental'] - ] - }, - 'ssl_memory_usage': { - 'options': [None, 'Memory Usage', 'percentage', 'ssl', 'nginx_plus.ssl_memory_usage', 'area'], - 'lines': [ - ['ssl_memory_usage', 'usage', 'absolute', 1, 100] - ] - }, - 'processes': { - 'options': [None, 'Processes', 'processes', 'processes', 'nginx_plus.processes', 'line'], - 'lines': [ - ['processes_respawned', 'respawned'] - ] - } -} - - -def cache_charts(cache): - family = 'cache {0}'.format(cache.real_name) - charts = OrderedDict() - - charts['{0}_traffic'.format(cache.name)] = { - 'options': [None, 'Traffic', 'KiB', family, 'nginx_plus.cache_traffic', 'stacked'], - 'lines': [ - ['_'.join([cache.name, 'hit_bytes']), 'served', 'absolute', 1, 1024], - ['_'.join([cache.name, 'miss_bytes_written']), 'written', 'absolute', 1, 1024], - ['_'.join([cache.name, 'miss_bytes']), 'bypass', 'absolute', 1, 1024] - ] - } - charts['{0}_memory_usage'.format(cache.name)] = { - 'options': [None, 'Memory Usage', 'percentage', family, 'nginx_plus.cache_memory_usage', 'area'], - 'lines': [ - ['_'.join([cache.name, 'memory_usage']), 'usage', 'absolute', 1, 100], - ] - } - return charts - - -def web_zone_charts(wz): - charts = OrderedDict() - family = 'web zone {name}'.format(name=wz.real_name) - - # Processing - charts['zone_{name}_processing'.format(name=wz.name)] = { - 'options': [None, 'Zone "{name}" Processing'.format(name=wz.name), 'requests', family, - 'nginx_plus.web_zone_processing', 'line'], - 'lines': [ - ['_'.join([wz.name, 'processing']), 'processing'] - ] - } - # Requests - charts['zone_{name}_requests'.format(name=wz.name)] = { - 'options': [None, 'Zone "{name}" Requests'.format(name=wz.name), 'requests/s', family, - 'nginx_plus.web_zone_requests', 'line'], - 'lines': [ - ['_'.join([wz.name, 'requests']), 'requests', 'incremental'] - ] - } - # Response Codes - charts['zone_{name}_responses'.format(name=wz.name)] = { - 'options': [None, 'Zone "{name}" Responses'.format(name=wz.name), 'requests/s', family, - 'nginx_plus.web_zone_responses', 'stacked'], - 'lines': [ - ['_'.join([wz.name, 'responses_2xx']), '2xx', 'incremental'], - ['_'.join([wz.name, 'responses_5xx']), '5xx', 'incremental'], - ['_'.join([wz.name, 'responses_3xx']), '3xx', 'incremental'], - ['_'.join([wz.name, 'responses_4xx']), '4xx', 'incremental'], - ['_'.join([wz.name, 'responses_1xx']), '1xx', 'incremental'] - ] - } - # Traffic - charts['zone_{name}_net'.format(name=wz.name)] = { - 'options': [None, 'Zone "{name}" Traffic'.format(name=wz.name), 'kilobits/s', family, - 'nginx_plus.zone_net', 'area'], - 'lines': [ - ['_'.join([wz.name, 'received']), 'received', 'incremental', 1, 1000], - ['_'.join([wz.name, 'sent']), 'sent', 'incremental', -1, 1000] - ] - } - return charts - - -def web_upstream_charts(wu): - def dimensions(value, a='absolute', m=1, d=1): - dims = list() - for p in wu: - dims.append(['_'.join([wu.name, p.server, value]), p.real_server, a, m, d]) - return dims - - charts = OrderedDict() - family = 'web upstream {name}'.format(name=wu.real_name) - - # Requests - charts['web_upstream_{name}_requests'.format(name=wu.name)] = { - 'options': [None, 'Peers Requests', 'requests/s', family, 'nginx_plus.web_upstream_requests', 'line'], - 'lines': dimensions('requests', 'incremental') - } - # Responses Codes - charts['web_upstream_{name}_all_responses'.format(name=wu.name)] = { - 'options': [None, 'All Peers Responses', 'responses/s', family, - 'nginx_plus.web_upstream_all_responses', 'stacked'], - 'lines': [ - ['_'.join([wu.name, 'responses_2xx']), '2xx', 'incremental'], - ['_'.join([wu.name, 'responses_5xx']), '5xx', 'incremental'], - ['_'.join([wu.name, 'responses_3xx']), '3xx', 'incremental'], - ['_'.join([wu.name, 'responses_4xx']), '4xx', 'incremental'], - ['_'.join([wu.name, 'responses_1xx']), '1xx', 'incremental'], - ] - } - for peer in wu: - charts['web_upstream_{0}_{1}_responses'.format(wu.name, peer.server)] = { - 'options': [None, 'Peer "{0}" Responses'.format(peer.real_server), 'responses/s', family, - 'nginx_plus.web_upstream_peer_responses', 'stacked'], - 'lines': [ - ['_'.join([wu.name, peer.server, 'responses_2xx']), '2xx', 'incremental'], - ['_'.join([wu.name, peer.server, 'responses_5xx']), '5xx', 'incremental'], - ['_'.join([wu.name, peer.server, 'responses_3xx']), '3xx', 'incremental'], - ['_'.join([wu.name, peer.server, 'responses_4xx']), '4xx', 'incremental'], - ['_'.join([wu.name, peer.server, 'responses_1xx']), '1xx', 'incremental'] - ] - } - # Connections - charts['web_upstream_{name}_connections'.format(name=wu.name)] = { - 'options': [None, 'Peers Connections', 'active', family, 'nginx_plus.web_upstream_connections', 'line'], - 'lines': dimensions('active') - } - charts['web_upstream_{name}_connections_usage'.format(name=wu.name)] = { - 'options': [None, 'Peers Connections Usage', 'percentage', family, - 'nginx_plus.web_upstream_connections_usage', 'line'], - 'lines': dimensions('connections_usage', d=100) - } - # Traffic - charts['web_upstream_{0}_all_net'.format(wu.name)] = { - 'options': [None, 'All Peers Traffic', 'kilobits/s', family, 'nginx_plus.web_upstream_all_net', 'area'], - 'lines': [ - ['{0}_received'.format(wu.name), 'received', 'incremental', 1, 1000], - ['{0}_sent'.format(wu.name), 'sent', 'incremental', -1, 1000] - ] - } - for peer in wu: - charts['web_upstream_{0}_{1}_net'.format(wu.name, peer.server)] = { - 'options': [None, 'Peer "{0}" Traffic'.format(peer.real_server), 'kilobits/s', family, - 'nginx_plus.web_upstream_peer_traffic', 'area'], - 'lines': [ - ['{0}_{1}_received'.format(wu.name, peer.server), 'received', 'incremental', 1, 1000], - ['{0}_{1}_sent'.format(wu.name, peer.server), 'sent', 'incremental', -1, 1000] - ] - } - # Response Time - for peer in wu: - charts['web_upstream_{0}_{1}_timings'.format(wu.name, peer.server)] = { - 'options': [None, 'Peer "{0}" Timings'.format(peer.real_server), 'milliseconds', family, - 'nginx_plus.web_upstream_peer_timings', 'line'], - 'lines': [ - ['_'.join([wu.name, peer.server, 'header_time']), 'header'], - ['_'.join([wu.name, peer.server, 'response_time']), 'response'] - ] - } - # Memory Usage - charts['web_upstream_{name}_memory_usage'.format(name=wu.name)] = { - 'options': [None, 'Memory Usage', 'percentage', family, 'nginx_plus.web_upstream_memory_usage', 'area'], - 'lines': [ - ['_'.join([wu.name, 'memory_usage']), 'usage', 'absolute', 1, 100] - ] - } - # State - charts['web_upstream_{name}_status'.format(name=wu.name)] = { - 'options': [None, 'Peers Status', 'state', family, 'nginx_plus.web_upstream_status', 'line'], - 'lines': dimensions('state') - } - # Downtime - charts['web_upstream_{name}_downtime'.format(name=wu.name)] = { - 'options': [None, 'Peers Downtime', 'seconds', family, 'nginx_plus.web_upstream_peer_downtime', 'line'], - 'lines': dimensions('downtime', d=1000) - } - - return charts - - -METRICS = { - 'SERVER': [ - 'processes.respawned', - 'connections.accepted', - 'connections.dropped', - 'connections.active', - 'connections.idle', - 'ssl.handshakes', - 'ssl.handshakes_failed', - 'ssl.session_reuses', - 'requests.total', - 'requests.current', - 'slabs.SSL.pages.free', - 'slabs.SSL.pages.used' - ], - 'WEB_ZONE': [ - 'processing', - 'requests', - 'responses.1xx', - 'responses.2xx', - 'responses.3xx', - 'responses.4xx', - 'responses.5xx', - 'discarded', - 'received', - 'sent' - ], - 'WEB_UPSTREAM_PEER': [ - 'id', - 'server', - 'name', - 'state', - 'active', - 'max_conns', - 'requests', - 'header_time', # alive only - 'response_time', # alive only - 'responses.1xx', - 'responses.2xx', - 'responses.3xx', - 'responses.4xx', - 'responses.5xx', - 'sent', - 'received', - 'downtime' - ], - 'WEB_UPSTREAM_SUMMARY': [ - 'responses.1xx', - 'responses.2xx', - 'responses.3xx', - 'responses.4xx', - 'responses.5xx', - 'sent', - 'received' - ], - 'CACHE': [ - 'hit.bytes', # served - 'miss.bytes_written', # written - 'miss.bytes' # bypass - - ] -} - -BAD_SYMBOLS = re.compile(r'[:/.-]+') - - -class Cache: - key = 'caches' - charts = cache_charts - - def __init__(self, **kw): - self.real_name = kw['name'] - self.name = BAD_SYMBOLS.sub('_', self.real_name) - - def memory_usage(self, data): - used = data['slabs'][self.real_name]['pages']['used'] - free = data['slabs'][self.real_name]['pages']['free'] - return used / float(free + used) * 1e4 - - def get_data(self, raw_data): - zone_data = raw_data['caches'][self.real_name] - data = parse_json(zone_data, METRICS['CACHE']) - data['memory_usage'] = self.memory_usage(raw_data) - return dict(('_'.join([self.name, k]), v) for k, v in data.items()) - - -class WebZone: - key = 'server_zones' - charts = web_zone_charts - - def __init__(self, **kw): - self.real_name = kw['name'] - self.name = BAD_SYMBOLS.sub('_', self.real_name) - - def get_data(self, raw_data): - zone_data = raw_data['server_zones'][self.real_name] - data = parse_json(zone_data, METRICS['WEB_ZONE']) - return dict(('_'.join([self.name, k]), v) for k, v in data.items()) - - -class WebUpstream: - key = 'upstreams' - charts = web_upstream_charts - - def __init__(self, **kw): - self.real_name = kw['name'] - self.name = BAD_SYMBOLS.sub('_', self.real_name) - self.peers = OrderedDict() - - peers = kw['response']['upstreams'][self.real_name]['peers'] - for peer in peers: - self.add_peer(peer['id'], peer['server']) - - def __iter__(self): - return iter(self.peers.values()) - - def add_peer(self, idx, server): - peer = WebUpstreamPeer(idx, server) - self.peers[peer.real_server] = peer - return peer - - def peers_stats(self, peers): - peers = {int(peer['id']): peer for peer in peers} - data = dict() - for peer in self.peers.values(): - if not peer.active: - continue - try: - data.update(peer.get_data(peers[peer.id])) - except KeyError: - peer.active = False - return data - - def memory_usage(self, data): - used = data['slabs'][self.real_name]['pages']['used'] - free = data['slabs'][self.real_name]['pages']['free'] - return used / float(free + used) * 1e4 - - def summary_stats(self, data): - rv = defaultdict(int) - for metric in METRICS['WEB_UPSTREAM_SUMMARY']: - for peer in self.peers.values(): - if peer.active: - metric = '_'.join(metric.split('.')) - rv[metric] += data['_'.join([peer.server, metric])] - return rv - - def get_data(self, raw_data): - data = dict() - peers = raw_data['upstreams'][self.real_name]['peers'] - data.update(self.peers_stats(peers)) - data.update(self.summary_stats(data)) - data['memory_usage'] = self.memory_usage(raw_data) - return dict(('_'.join([self.name, k]), v) for k, v in data.items()) - - -class WebUpstreamPeer: - def __init__(self, idx, server): - self.id = idx - self.real_server = server - self.server = BAD_SYMBOLS.sub('_', self.real_server) - self.active = True - - def get_data(self, raw): - data = dict(header_time=0, response_time=0, max_conns=0) - data.update(parse_json(raw, METRICS['WEB_UPSTREAM_PEER'])) - data['connections_usage'] = 0 if not data['max_conns'] else data['active'] / float(data['max_conns']) * 1e4 - data['state'] = int(data['state'] == 'up') - return dict(('_'.join([self.server, k]), v) for k, v in data.items()) - - -class Service(UrlService): - def __init__(self, configuration=None, name=None): - UrlService.__init__(self, configuration=configuration, name=name) - self.order = list(ORDER) - self.definitions = deepcopy(CHARTS) - self.objects = dict() - - def check(self): - if not self.url: - self.error('URL is not defined') - return None - - self._manager = self._build_manager() - if not self._manager: - return None - - raw_data = self._get_raw_data() - if not raw_data: - return None - - try: - response = loads(raw_data) - except ValueError: - return None - - for obj_cls in [WebZone, WebUpstream, Cache]: - for obj_name in response.get(obj_cls.key, list()): - obj = obj_cls(name=obj_name, response=response) - self.objects[obj.real_name] = obj - charts = obj_cls.charts(obj) - for chart in charts: - self.order.append(chart) - self.definitions[chart] = charts[chart] - - return bool(self.objects) - - def _get_data(self): - """ - Format data received from http request - :return: dict - """ - raw_data = self._get_raw_data() - if not raw_data: - return None - response = loads(raw_data) - - data = parse_json(response, METRICS['SERVER']) - data['ssl_memory_usage'] = data['slabs_SSL_pages_used'] / float(data['slabs_SSL_pages_free']) * 1e4 - - for obj in self.objects.values(): - if obj.real_name in response[obj.key]: - data.update(obj.get_data(response)) - - return data - - -def parse_json(raw_data, metrics): - data = dict() - for metric in metrics: - value = raw_data - metrics_list = metric.split('.') - try: - for m in metrics_list: - value = value[m] - except KeyError: - continue - data['_'.join(metrics_list)] = value - return data diff --git a/collectors/python.d.plugin/nginx_plus/nginx_plus.conf b/collectors/python.d.plugin/nginx_plus/nginx_plus.conf deleted file mode 100644 index 201eb0eb7..000000000 --- a/collectors/python.d.plugin/nginx_plus/nginx_plus.conf +++ /dev/null @@ -1,85 +0,0 @@ -# netdata python.d.plugin configuration for nginx_plus -# -# This file is in YaML format. Generally the format is: -# -# name: value -# -# There are 2 sections: -# - global variables -# - one or more JOBS -# -# JOBS allow you to collect values from multiple sources. -# Each source will have its own set of charts. -# -# JOB parameters have to be indented (using spaces only, example below). - -# ---------------------------------------------------------------------- -# Global Variables -# These variables set the defaults for all JOBs, however each JOB -# may define its own, overriding the defaults. - -# update_every sets the default data collection frequency. -# If unset, the python.d.plugin default is used. -# update_every: 1 - -# priority controls the order of charts at the netdata dashboard. -# Lower numbers move the charts towards the top of the page. -# If unset, the default for python.d.plugin is used. -# priority: 60000 - -# penalty indicates whether to apply penalty to update_every in case of failures. -# Penalty will increase every 5 failed updates in a row. Maximum penalty is 10 minutes. -# penalty: yes - -# autodetection_retry sets the job re-check interval in seconds. -# The job is not deleted if check fails. -# Attempts to start the job are made once every autodetection_retry. -# This feature is disabled by default. -# autodetection_retry: 0 - -# ---------------------------------------------------------------------- -# JOBS (data collection sources) -# -# The default JOBS share the same *name*. JOBS with the same name -# are mutually exclusive. Only one of them will be allowed running at -# any time. This allows autodetection to try several alternatives and -# pick the one that works. -# -# Any number of jobs is supported. -# -# All python.d.plugin JOBS (for all its modules) support a set of -# predefined parameters. These are: -# -# job_name: -# name: myname # the JOB's name as it will appear at the -# # dashboard (by default is the job_name) -# # JOBs sharing a name are mutually exclusive -# update_every: 1 # the JOB's data collection frequency -# priority: 60000 # the JOB's order on the dashboard -# penalty: yes # the JOB's penalty -# autodetection_retry: 0 # the JOB's re-check interval in seconds -# -# Additionally to the above, nginx_plus also supports the following: -# -# url: 'URL' # the URL to fetch nginx_plus's stats -# -# if the URL is password protected, the following are supported: -# -# user: 'username' -# pass: 'password' - -# ---------------------------------------------------------------------- -# AUTO-DETECTION JOBS -# only one of them will run (they have the same name) - -localhost: - name : 'local' - url : 'http://localhost/status' - -localipv4: - name : 'local' - url : 'http://127.0.0.1/status' - -localipv6: - name : 'local' - url : 'http://[::1]/status' diff --git a/collectors/python.d.plugin/nvidia_smi/README.md b/collectors/python.d.plugin/nvidia_smi/README.md index fb613064c..bb4169441 100644 --- a/collectors/python.d.plugin/nvidia_smi/README.md +++ b/collectors/python.d.plugin/nvidia_smi/README.md @@ -8,6 +8,8 @@ sidebar_label: "Nvidia GPUs" Monitors performance metrics (memory usage, fan speed, pcie bandwidth utilization, temperature, etc.) using `nvidia-smi` cli tool. +> **Warning**: this collector does not work when the Netdata Agent is [running in a container](https://learn.netdata.cloud/docs/agent/packaging/docker). + ## Requirements and Notes diff --git a/collectors/python.d.plugin/nvidia_smi/nvidia_smi.chart.py b/collectors/python.d.plugin/nvidia_smi/nvidia_smi.chart.py index 1913e94e4..23e90e658 100644 --- a/collectors/python.d.plugin/nvidia_smi/nvidia_smi.chart.py +++ b/collectors/python.d.plugin/nvidia_smi/nvidia_smi.chart.py @@ -4,11 +4,10 @@ # Author: Ilya Mashchenko (ilyam8) # User Memory Stat Author: Guido Scatena (scatenag) -import subprocess -import threading import os import pwd - +import subprocess +import threading import xml.etree.ElementTree as et from bases.FrameworkServices.SimpleService import SimpleService @@ -32,6 +31,7 @@ BAR_USAGE = 'bar1_mem_usage' TEMPERATURE = 'temperature' CLOCKS = 'clocks' POWER = 'power' +POWER_STATE = 'power_state' PROCESSES_MEM = 'processes_mem' USER_MEM = 'user_mem' USER_NUM = 'user_num' @@ -47,11 +47,15 @@ ORDER = [ TEMPERATURE, CLOCKS, POWER, + POWER_STATE, PROCESSES_MEM, USER_MEM, USER_NUM, ] +# https://docs.nvidia.com/gameworks/content/gameworkslibrary/coresdk/nvapi/group__gpupstate.html +POWER_STATES = ['P' + str(i) for i in range(0, 16)] + def gpu_charts(gpu): fam = gpu.full_name() @@ -125,6 +129,10 @@ def gpu_charts(gpu): ['power_draw', 'power', 'absolute', 1, 100], ] }, + POWER_STATE: { + 'options': [None, 'Power State', 'state', fam, 'nvidia_smi.power_state', 'line'], + 'lines': [['power_state_' + v.lower(), v, 'absolute'] for v in POWER_STATES] + }, PROCESSES_MEM: { 'options': [None, 'Memory Used by Each Process', 'MiB', fam, 'nvidia_smi.processes_mem', 'stacked'], 'lines': [] @@ -382,6 +390,10 @@ class GPU: def mem_clock(self): return self.root.find('clocks').find('mem_clock').text.split()[0] + @handle_attr_error + def power_state(self): + return str(self.root.find('power_readings').find('power_state').text.split()[0]) + @handle_value_error @handle_attr_error def power_draw(self): @@ -426,6 +438,13 @@ class GPU: 'mem_clock': self.mem_clock(), 'power_draw': self.power_draw(), } + + for v in POWER_STATES: + data['power_state_' + v.lower()] = 0 + p_state = self.power_state() + if p_state: + data['power_state_' + p_state.lower()] = 1 + processes = self.processes() or [] users = set() for p in processes: @@ -450,7 +469,7 @@ class Service(SimpleService): self.order = list() self.definitions = dict() self.loop_mode = configuration.get('loop_mode', True) - poll = int(configuration.get('poll_seconds', 1)) + poll = int(configuration.get('poll_seconds', self.get_update_every())) self.exclude_zero_memory_users = configuration.get('exclude_zero_memory_users', False) self.poller = NvidiaSMIPoller(poll) diff --git a/collectors/python.d.plugin/postgres/Makefile.inc b/collectors/python.d.plugin/pandas/Makefile.inc index 91a185cb9..9f4f9b34b 100644 --- a/collectors/python.d.plugin/postgres/Makefile.inc +++ b/collectors/python.d.plugin/pandas/Makefile.inc @@ -5,9 +5,9 @@ # IT IS REQUIRED TO REFERENCE ALL FILES RELATIVE TO THE PARENT # install these files -dist_python_DATA += postgres/postgres.chart.py -dist_pythonconfig_DATA += postgres/postgres.conf +dist_python_DATA += pandas/pandas.chart.py +dist_pythonconfig_DATA += pandas/pandas.conf # do not install these files, but include them in the distribution -dist_noinst_DATA += postgres/README.md postgres/Makefile.inc +dist_noinst_DATA += pandas/README.md pandas/Makefile.inc diff --git a/collectors/python.d.plugin/pandas/README.md b/collectors/python.d.plugin/pandas/README.md new file mode 100644 index 000000000..141549478 --- /dev/null +++ b/collectors/python.d.plugin/pandas/README.md @@ -0,0 +1,92 @@ +<!-- +title: "Pandas" +custom_edit_url: https://github.com/netdata/netdata/edit/master/collectors/python.d.plugin/pandas/README.md +--> + +# Pandas Netdata Collector + +<a href="https://pandas.pydata.org/" target="_blank"> + <img src="https://pandas.pydata.org/docs/_static/pandas.svg" alt="Pandas" width="100px" height="50px" /> + </a> + +A python collector using [pandas](https://pandas.pydata.org/) to pull data and do pandas based +preprocessing before feeding to Netdata. + +## Requirements + +This collector depends on some Python (Python 3 only) packages that can usually be installed via `pip` or `pip3`. + +```bash +sudo pip install pandas requests +``` + +## Configuration + +Below is an example configuration to query some json weather data from [Open-Meteo](https://open-meteo.com), +do some data wrangling on it and save in format as expected by Netdata. + +```yaml +# example pulling some hourly temperature data +temperature: + name: "temperature" + update_every: 3 + chart_configs: + - name: "temperature_by_city" + title: "Temperature By City" + family: "temperature.today" + context: "pandas.temperature" + type: "line" + units: "Celsius" + df_steps: > + pd.DataFrame.from_dict( + {city: requests.get( + f'https://api.open-meteo.com/v1/forecast?latitude={lat}&longitude={lng}&hourly=temperature_2m' + ).json()['hourly']['temperature_2m'] + for (city,lat,lng) + in [ + ('dublin', 53.3441, -6.2675), + ('athens', 37.9792, 23.7166), + ('london', 51.5002, -0.1262), + ('berlin', 52.5235, 13.4115), + ('paris', 48.8567, 2.3510), + ] + } + ); # use dictionary comprehension to make multiple requests; + df.describe(); # get aggregate stats for each city; + df.transpose()[['mean', 'max', 'min']].reset_index(); # just take mean, min, max; + df.rename(columns={'index':'city'}); # some column renaming; + df.pivot(columns='city').mean().to_frame().reset_index(); # force to be one row per city; + df.rename(columns={0:'degrees'}); # some column renaming; + pd.concat([df, df['city']+'_'+df['level_0']], axis=1); # add new column combining city and summary measurement label; + df.rename(columns={0:'measurement'}); # some column renaming; + df[['measurement', 'degrees']].set_index('measurement'); # just take two columns we want; + df.sort_index(); # sort by city name; + df.transpose(); # transpose so its just one wide row; +``` + +`chart_configs` is a list of dictionary objects where each one defines the sequence of `df_steps` to be run using [`pandas`](https://pandas.pydata.org/), +and the `name`, `title` etc to define the +[CHART variables](https://learn.netdata.cloud/docs/agent/collectors/python.d.plugin#global-variables-order-and-chart) +that will control how the results will look in netdata. + +The example configuration above would result in a `data` dictionary like the below being collected by Netdata +at each time step. They keys in this dictionary will be the +[dimension](https://learn.netdata.cloud/docs/agent/web#dimensions) names on the chart. + +```javascript +{'athens_max': 26.2, 'athens_mean': 19.45952380952381, 'athens_min': 12.2, 'berlin_max': 17.4, 'berlin_mean': 10.764285714285714, 'berlin_min': 5.7, 'dublin_max': 15.3, 'dublin_mean': 12.008928571428571, 'dublin_min': 6.6, 'london_max': 18.9, 'london_mean': 12.510714285714286, 'london_min': 5.2, 'paris_max': 19.4, 'paris_mean': 12.054166666666665, 'paris_min': 4.8} +``` + +Which, given the above configuration would end up as a chart like below in Netdata. + +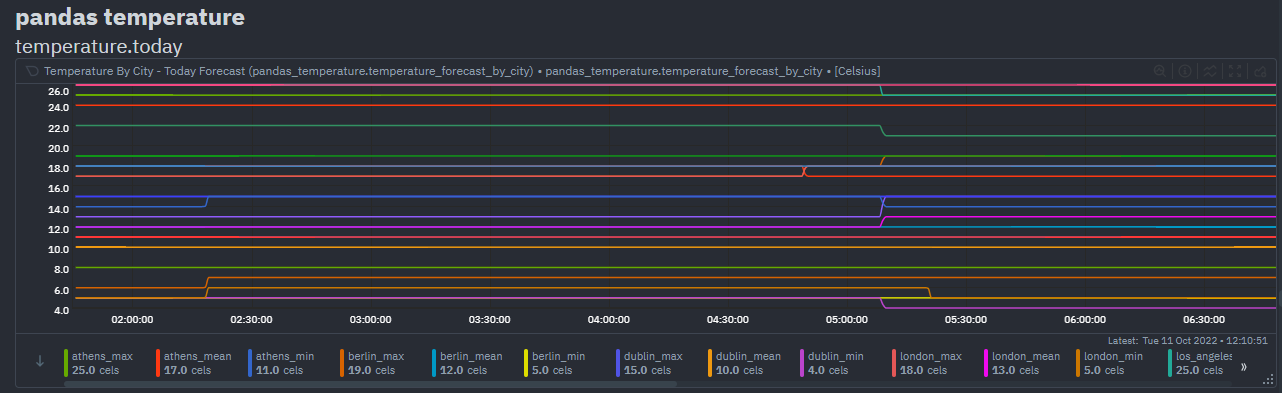 + +## Notes +- Each line in `df_steps` must return a pandas +[DataFrame](https://pandas.pydata.org/docs/reference/api/pandas.DataFrame.html) object (`df`) at each step. +- You can use +[this colab notebook](https://colab.research.google.com/drive/1VYrddSegZqGtkWGFuiUbMbUk5f3rW6Hi?usp=sharing) +to mock up and work on your `df_steps` iteratively before adding them to your config. +- This collector is expecting one row in the final pandas DataFrame. It is that first row that will be taken +as the most recent values for each dimension on each chart using (`df.to_dict(orient='records')[0]`). +See [pd.to_dict()](https://pandas.pydata.org/docs/reference/api/pandas.DataFrame.to_dict.html). diff --git a/collectors/python.d.plugin/pandas/pandas.chart.py b/collectors/python.d.plugin/pandas/pandas.chart.py new file mode 100644 index 000000000..8eb4452fb --- /dev/null +++ b/collectors/python.d.plugin/pandas/pandas.chart.py @@ -0,0 +1,89 @@ +# -*- coding: utf-8 -*- +# Description: pandas netdata python.d module +# Author: Andrew Maguire (andrewm4894) +# SPDX-License-Identifier: GPL-3.0-or-later + +import pandas as pd + +try: + import requests + HAS_REQUESTS = True +except ImportError: + HAS_REQUESTS = False + +from bases.FrameworkServices.SimpleService import SimpleService + +ORDER = [] + +CHARTS = {} + + +class Service(SimpleService): + def __init__(self, configuration=None, name=None): + SimpleService.__init__(self, configuration=configuration, name=name) + self.order = ORDER + self.definitions = CHARTS + self.chart_configs = self.configuration.get('chart_configs', None) + self.line_sep = self.configuration.get('line_sep', ';') + + def run_code(self, df_steps): + """eval() each line of code and ensure the result is a pandas dataframe""" + + # process each line of code + lines = df_steps.split(self.line_sep) + for line in lines: + line_clean = line.strip('\n').strip(' ') + if line_clean != '' and line_clean[0] != '#': + df = eval(line_clean) + assert isinstance(df, pd.DataFrame), 'The result of each evaluated line of `df_steps` must be of type `pd.DataFrame`' + + # take top row of final df as data to be collected by netdata + data = df.to_dict(orient='records')[0] + + return data + + def check(self): + """ensure charts and dims all configured and that we can get data""" + + if not HAS_REQUESTS: + self.warn('requests library could not be imported') + + if not self.chart_configs: + self.error('chart_configs must be defined') + + data = dict() + + # add each chart as defined by the config + for chart_config in self.chart_configs: + if chart_config['name'] not in self.charts: + chart_template = { + 'options': [ + chart_config['name'], + chart_config['title'], + chart_config['units'], + chart_config['family'], + chart_config['context'], + chart_config['type'] + ], + 'lines': [] + } + self.charts.add_chart([chart_config['name']] + chart_template['options']) + + data_tmp = self.run_code(chart_config['df_steps']) + data.update(data_tmp) + + for dim in data_tmp: + self.charts[chart_config['name']].add_dimension([dim, dim, 'absolute', 1, 1]) + + return True + + def get_data(self): + """get data for each chart config""" + + data = dict() + + for chart_config in self.chart_configs: + data_tmp = self.run_code(chart_config['df_steps']) + data.update(data_tmp) + + return data diff --git a/collectors/python.d.plugin/pandas/pandas.conf b/collectors/python.d.plugin/pandas/pandas.conf new file mode 100644 index 000000000..6684af9d5 --- /dev/null +++ b/collectors/python.d.plugin/pandas/pandas.conf @@ -0,0 +1,191 @@ +# netdata python.d.plugin configuration for pandas +# +# This file is in YaML format. Generally the format is: +# +# name: value +# +# There are 2 sections: +# - global variables +# - one or more JOBS +# +# JOBS allow you to collect values from multiple sources. +# Each source will have its own set of charts. +# +# JOB parameters have to be indented (using spaces only, example below). + +# ---------------------------------------------------------------------- +# Global Variables +# These variables set the defaults for all JOBs, however each JOB +# may define its own, overriding the defaults. + +# update_every sets the default data collection frequency. +# If unset, the python.d.plugin default is used. +update_every: 5 + +# priority controls the order of charts at the netdata dashboard. +# Lower numbers move the charts towards the top of the page. +# If unset, the default for python.d.plugin is used. +# priority: 60000 + +# penalty indicates whether to apply penalty to update_every in case of failures. +# Penalty will increase every 5 failed updates in a row. Maximum penalty is 10 minutes. +# penalty: yes + +# autodetection_retry sets the job re-check interval in seconds. +# The job is not deleted if check fails. +# Attempts to start the job are made once every autodetection_retry. +# This feature is disabled by default. +# autodetection_retry: 0 + +# ---------------------------------------------------------------------- +# JOBS (data collection sources) +# +# The default JOBS share the same *name*. JOBS with the same name +# are mutually exclusive. Only one of them will be allowed running at +# any time. This allows autodetection to try several alternatives and +# pick the one that works. +# +# Any number of jobs is supported. +# +# All python.d.plugin JOBS (for all its modules) support a set of +# predefined parameters. These are: +# +# job_name: +# name: myname # the JOB's name as it will appear on the dashboard +# # dashboard (by default is the job_name) +# # JOBs sharing a name are mutually exclusive +# update_every: 1 # the JOB's data collection frequency +# priority: 60000 # the JOB's order on the dashboard +# penalty: yes # the JOB's penalty +# autodetection_retry: 0 # the JOB's re-check interval in seconds +# +# Additionally to the above, example also supports the following: +# +# num_lines: 4 # the number of lines to create +# lower: 0 # the lower bound of numbers to randomly sample from +# upper: 100 # the upper bound of numbers to randomly sample from +# +# ---------------------------------------------------------------------- +# AUTO-DETECTION JOBS + +# Some example configurations, enable this collector, uncomment and example below and restart netdata to enable. + +# example pulling some hourly temperature data, a chart for today forecast (mean,min,max) and another chart for current. +# temperature: +# name: "temperature" +# update_every: 5 +# chart_configs: +# - name: "temperature_forecast_by_city" +# title: "Temperature By City - Today Forecast" +# family: "temperature.today" +# context: "pandas.temperature" +# type: "line" +# units: "Celsius" +# df_steps: > +# pd.DataFrame.from_dict( +# {city: requests.get(f'https://api.open-meteo.com/v1/forecast?latitude={lat}&longitude={lng}&hourly=temperature_2m').json()['hourly']['temperature_2m'] +# for (city,lat,lng) +# in [ +# ('dublin', 53.3441, -6.2675), +# ('athens', 37.9792, 23.7166), +# ('london', 51.5002, -0.1262), +# ('berlin', 52.5235, 13.4115), +# ('paris', 48.8567, 2.3510), +# ('madrid', 40.4167, -3.7033), +# ('new_york', 40.71, -74.01), +# ('los_angeles', 34.05, -118.24), +# ] +# } +# ); +# df.describe(); # get aggregate stats for each city; +# df.transpose()[['mean', 'max', 'min']].reset_index(); # just take mean, min, max; +# df.rename(columns={'index':'city'}); # some column renaming; +# df.pivot(columns='city').mean().to_frame().reset_index(); # force to be one row per city; +# df.rename(columns={0:'degrees'}); # some column renaming; +# pd.concat([df, df['city']+'_'+df['level_0']], axis=1); # add new column combining city and summary measurement label; +# df.rename(columns={0:'measurement'}); # some column renaming; +# df[['measurement', 'degrees']].set_index('measurement'); # just take two columns we want; +# df.sort_index(); # sort by city name; +# df.transpose(); # transpose so its just one wide row; +# - name: "temperature_current_by_city" +# title: "Temperature By City - Current" +# family: "temperature.current" +# context: "pandas.temperature" +# type: "line" +# units: "Celsius" +# df_steps: > +# pd.DataFrame.from_dict( +# {city: requests.get(f'https://api.open-meteo.com/v1/forecast?latitude={lat}&longitude={lng}¤t_weather=true').json()['current_weather'] +# for (city,lat,lng) +# in [ +# ('dublin', 53.3441, -6.2675), +# ('athens', 37.9792, 23.7166), +# ('london', 51.5002, -0.1262), +# ('berlin', 52.5235, 13.4115), +# ('paris', 48.8567, 2.3510), +# ('madrid', 40.4167, -3.7033), +# ('new_york', 40.71, -74.01), +# ('los_angeles', 34.05, -118.24), +# ] +# } +# ); +# df.transpose(); +# df[['temperature']]; +# df.transpose(); + +# example showing a read_csv from a url and some light pandas data wrangling. +# pull data in csv format from london demo server and then ratio of user cpus over system cpu averaged over last 60 seconds. +# example_csv: +# name: "example_csv" +# update_every: 2 +# chart_configs: +# - name: "london_system_cpu" +# title: "London System CPU - Ratios" +# family: "london_system_cpu" +# context: "pandas" +# type: "line" +# units: "n" +# df_steps: > +# pd.read_csv('https://london.my-netdata.io/api/v1/data?chart=system.cpu&format=csv&after=-60', storage_options={'User-Agent': 'netdata'}); +# df.drop('time', axis=1); +# df.mean().to_frame().transpose(); +# df.apply(lambda row: (row.user / row.system), axis = 1).to_frame(); +# df.rename(columns={0:'average_user_system_ratio'}); +# df*100; + +# example showing a read_json from a url and some light pandas data wrangling. +# pull data in json format (using requests.get() if json data is too complex for pd.read_json() ) from london demo server and work out 'total_bandwidth'. +# example_json: +# name: "example_json" +# update_every: 2 +# chart_configs: +# - name: "london_system_net" +# title: "London System Net - Total Bandwidth" +# family: "london_system_net" +# context: "pandas" +# type: "area" +# units: "kilobits/s" +# df_steps: > +# pd.DataFrame(requests.get('https://london.my-netdata.io/api/v1/data?chart=system.net&format=json&after=-1').json()['data'], columns=requests.get('https://london.my-netdata.io/api/v1/data?chart=system.net&format=json&after=-1').json()['labels']); +# df.drop('time', axis=1); +# abs(df); +# df.sum(axis=1).to_frame(); +# df.rename(columns={0:'total_bandwidth'}); + +# example showing a read_xml from a url and some light pandas data wrangling. +# pull weather forecast data in xml format, use xpath to pull out temperature forecast. +# example_xml: +# name: "example_xml" +# update_every: 2 +# line_sep: "|" +# chart_configs: +# - name: "temperature_forcast" +# title: "Temperature Forecast" +# family: "temp" +# context: "pandas.temp" +# type: "line" +# units: "celsius" +# df_steps: > +# pd.read_xml('http://metwdb-openaccess.ichec.ie/metno-wdb2ts/locationforecast?lat=54.7210798611;long=-8.7237392806', xpath='./product/time[1]/location/temperature', parser='etree')| +# df.rename(columns={'value': 'dublin'})| +# df[['dublin']]|
\ No newline at end of file diff --git a/collectors/python.d.plugin/postfix/README.md b/collectors/python.d.plugin/postfix/README.md index ac16962a5..1a546c614 100644 --- a/collectors/python.d.plugin/postfix/README.md +++ b/collectors/python.d.plugin/postfix/README.md @@ -6,22 +6,31 @@ sidebar_label: "Postfix" # Postfix monitoring with Netdata -Monitors MTA email queue statistics using postqueue tool. +Monitors MTA email queue statistics using [postqueue](http://www.postfix.org/postqueue.1.html) tool. -Execute `postqueue -p` to grab postfix queue. +The collector executes `postqueue -p` to get Postfix queue statistics. -It produces only two charts: +## Requirements -1. **Postfix Queue Emails** +Postfix has internal access controls that limit activities on the mail queue. By default, all users are allowed to view +the queue. If your system is configured with stricter access controls, you need to grant the `netdata` user access to +view the mail queue. In order to do it, add `netdata` to `authorized_mailq_users` in the `/etc/postfix/main.cf` file. - - emails +See the `authorized_mailq_users` setting in +the [Postfix documentation](https://www.postfix.org/postconf.5.html) for more details. -2. **Postfix Queue Emails Size** in KB +## Charts - - size +It produces only two charts: -Configuration is not needed. +1. **Postfix Queue Emails** ---- + - emails +2. **Postfix Queue Emails Size** in KB + - size + +## Configuration + +Configuration is not needed. diff --git a/collectors/python.d.plugin/postgres/README.md b/collectors/python.d.plugin/postgres/README.md deleted file mode 100644 index 7acb9a7a9..000000000 --- a/collectors/python.d.plugin/postgres/README.md +++ /dev/null @@ -1,145 +0,0 @@ -<!-- -title: "PostgreSQL monitoring with Netdata" -custom_edit_url: https://github.com/netdata/netdata/edit/master/collectors/python.d.plugin/postgres/README.md -sidebar_label: "PostgreSQL" ---> - -# PostgreSQL monitoring with Netdata - -> **Warning**: This module is deprecated and will be deleted in v1.37.0. -> Use [go.d/postgres](https://learn.netdata.cloud/docs/agent/collectors/go.d.plugin/modules/postgres). - -Collects database health and performance metrics. - -## Requirements - -- `python-psycopg2` package. You have to install it manually and make sure that it is available to the `netdata` user, either using `pip`, the package manager of your Linux distribution, or any other method you prefer. - -- PostgreSQL v9.4+ - -Following charts are drawn: - -1. **Database size** MB - - - size - -2. **Current Backend Processes** processes - - - active - -3. **Current Backend Process Usage** percentage - - - used - - available - -4. **Write-Ahead Logging Statistics** files/s - - - total - - ready - - done - -5. **Checkpoints** writes/s - - - scheduled - - requested - -6. **Current connections to db** count - - - connections - -7. **Tuples returned from db** tuples/s - - - sequential - - bitmap - -8. **Tuple reads from db** reads/s - - - disk - - cache - -9. **Transactions on db** transactions/s - - - committed - - rolled back - -10. **Tuples written to db** writes/s - - - inserted - - updated - - deleted - - conflicts - -11. **Locks on db** count per type - - - locks - -12. **Standby delta** KB - - - sent delta - - write delta - - flush delta - - replay delta - -13. **Standby lag** seconds - - - write lag - - flush lag - - replay lag - -14. **Average number of blocking transactions in db** processes - - - blocking - -## Configuration - -Edit the `python.d/postgres.conf` configuration file using `edit-config` from the Netdata [config -directory](/docs/configure/nodes.md), which is typically at `/etc/netdata`. - -```bash -cd /etc/netdata # Replace this path with your Netdata config directory, if different -sudo ./edit-config python.d/postgres.conf -``` - -When no configuration file is found, the module tries to connect to TCP/IP socket: `localhost:5432` with the -following collection jobs. - -```yaml -socket: - name : 'socket' - user : 'postgres' - database : 'postgres' - -tcp: - name : 'tcp' - user : 'postgres' - database : 'postgres' - host : 'localhost' - port : 5432 -``` - -**Note**: Every job collection must have a unique identifier. In cases that you monitor multiple DBs, every -job must have it's own name. Use a mnemonic of your preference (e.g us_east_db, us_east_tcp) - -## Troubleshooting - -To troubleshoot issues with the `postgres` collector, run the `python.d.plugin` with the debug option enabled. The output -should give you clues as to why the collector isn't working. - -First, navigate to your plugins directory, usually at `/usr/libexec/netdata/plugins.d/`. If that's not the case on your -system, open `netdata.conf` and look for the setting `plugins directory`. Once you're in the plugin's directory, switch -to the `netdata` user. - -```bash -cd /usr/libexec/netdata/plugins.d/ -sudo su -s /bin/bash netdata -``` - -You can now run the `python.d.plugin` to debug the collector: - -```bash -./python.d.plugin postgres debug trace -``` - ---- - - diff --git a/collectors/python.d.plugin/postgres/postgres.chart.py b/collectors/python.d.plugin/postgres/postgres.chart.py deleted file mode 100644 index bd8f71a66..000000000 --- a/collectors/python.d.plugin/postgres/postgres.chart.py +++ /dev/null @@ -1,1436 +0,0 @@ -# -*- coding: utf-8 -*- -# Description: example netdata python.d module -# Authors: facetoe, dangtranhoang -# SPDX-License-Identifier: GPL-3.0-or-later - -from copy import deepcopy - -try: - import psycopg2 - from psycopg2 import extensions - from psycopg2.extras import DictCursor - from psycopg2 import OperationalError - - PSYCOPG2 = True -except ImportError: - PSYCOPG2 = False - -from bases.FrameworkServices.SimpleService import SimpleService - -DEFAULT_PORT = 5432 -DEFAULT_USER = 'postgres' -DEFAULT_CONNECT_TIMEOUT = 2 # seconds -DEFAULT_STATEMENT_TIMEOUT = 5000 # ms - -CONN_PARAM_DSN = 'dsn' -CONN_PARAM_HOST = 'host' -CONN_PARAM_PORT = 'port' -CONN_PARAM_DATABASE = 'database' -CONN_PARAM_USER = 'user' -CONN_PARAM_PASSWORD = 'password' -CONN_PARAM_CONN_TIMEOUT = 'connect_timeout' -CONN_PARAM_STATEMENT_TIMEOUT = 'statement_timeout' -CONN_PARAM_SSL_MODE = 'sslmode' -CONN_PARAM_SSL_ROOT_CERT = 'sslrootcert' -CONN_PARAM_SSL_CRL = 'sslcrl' -CONN_PARAM_SSL_CERT = 'sslcert' -CONN_PARAM_SSL_KEY = 'sslkey' - -QUERY_NAME_WAL = 'WAL' -QUERY_NAME_ARCHIVE = 'ARCHIVE' -QUERY_NAME_BACKENDS = 'BACKENDS' -QUERY_NAME_BACKEND_USAGE = 'BACKEND_USAGE' -QUERY_NAME_TABLE_STATS = 'TABLE_STATS' -QUERY_NAME_INDEX_STATS = 'INDEX_STATS' -QUERY_NAME_DATABASE = 'DATABASE' -QUERY_NAME_BGWRITER = 'BGWRITER' -QUERY_NAME_LOCKS = 'LOCKS' -QUERY_NAME_BLOCKERS = 'BLOCKERS' -QUERY_NAME_DATABASES = 'DATABASES' -QUERY_NAME_STANDBY = 'STANDBY' -QUERY_NAME_REPLICATION_SLOT = 'REPLICATION_SLOT' -QUERY_NAME_STANDBY_DELTA = 'STANDBY_DELTA' -QUERY_NAME_STANDBY_LAG = 'STANDBY_LAG' -QUERY_NAME_REPSLOT_FILES = 'REPSLOT_FILES' -QUERY_NAME_IF_SUPERUSER = 'IF_SUPERUSER' -QUERY_NAME_SERVER_VERSION = 'SERVER_VERSION' -QUERY_NAME_AUTOVACUUM = 'AUTOVACUUM' -QUERY_NAME_FORCED_AUTOVACUUM = 'FORCED_AUTOVACUUM' -QUERY_NAME_TX_WRAPAROUND = 'TX_WRAPAROUND' -QUERY_NAME_DIFF_LSN = 'DIFF_LSN' -QUERY_NAME_WAL_WRITES = 'WAL_WRITES' - -METRICS = { - QUERY_NAME_DATABASE: [ - 'connections', - 'xact_commit', - 'xact_rollback', - 'blks_read', - 'blks_hit', - 'tup_returned', - 'tup_fetched', - 'tup_inserted', - 'tup_updated', - 'tup_deleted', - 'conflicts', - 'temp_files', - 'temp_bytes', - 'size' - ], - QUERY_NAME_BACKENDS: [ - 'backends_active', - 'backends_idle' - ], - QUERY_NAME_BACKEND_USAGE: [ - 'available', - 'used' - ], - QUERY_NAME_INDEX_STATS: [ - 'index_count', - 'index_size' - ], - QUERY_NAME_TABLE_STATS: [ - 'table_size', - 'table_count' - ], - QUERY_NAME_WAL: [ - 'written_wal', - 'recycled_wal', - 'total_wal' - ], - QUERY_NAME_WAL_WRITES: [ - 'wal_writes' - ], - QUERY_NAME_ARCHIVE: [ - 'ready_count', - 'done_count', - 'file_count' - ], - QUERY_NAME_BGWRITER: [ - 'checkpoint_scheduled', - 'checkpoint_requested', - 'buffers_checkpoint', - 'buffers_clean', - 'maxwritten_clean', - 'buffers_backend', - 'buffers_alloc', - 'buffers_backend_fsync' - ], - QUERY_NAME_LOCKS: [ - 'ExclusiveLock', - 'RowShareLock', - 'SIReadLock', - 'ShareUpdateExclusiveLock', - 'AccessExclusiveLock', - 'AccessShareLock', - 'ShareRowExclusiveLock', - 'ShareLock', - 'RowExclusiveLock' - ], - QUERY_NAME_BLOCKERS: [ - 'blocking_pids_avg' - ], - QUERY_NAME_AUTOVACUUM: [ - 'analyze', - 'vacuum_analyze', - 'vacuum', - 'vacuum_freeze', - 'brin_summarize' - ], - QUERY_NAME_FORCED_AUTOVACUUM: [ - 'percent_towards_forced_vacuum' - ], - QUERY_NAME_TX_WRAPAROUND: [ - 'oldest_current_xid', - 'percent_towards_wraparound' - ], - QUERY_NAME_STANDBY_DELTA: [ - 'sent_delta', - 'write_delta', - 'flush_delta', - 'replay_delta' - ], - QUERY_NAME_STANDBY_LAG: [ - 'write_lag', - 'flush_lag', - 'replay_lag' - ], - QUERY_NAME_REPSLOT_FILES: [ - 'replslot_wal_keep', - 'replslot_files' - ] -} - -NO_VERSION = 0 -DEFAULT = 'DEFAULT' -V72 = 'V72' -V82 = 'V82' -V91 = 'V91' -V92 = 'V92' -V96 = 'V96' -V10 = 'V10' -V11 = 'V11' - -QUERY_WAL = { - DEFAULT: """ -SELECT - count(*) as total_wal, - count(*) FILTER (WHERE type = 'recycled') AS recycled_wal, - count(*) FILTER (WHERE type = 'written') AS written_wal -FROM - (SELECT - wal.name, - pg_walfile_name( - CASE pg_is_in_recovery() - WHEN true THEN NULL - ELSE pg_current_wal_lsn() - END ), - CASE - WHEN wal.name > pg_walfile_name( - CASE pg_is_in_recovery() - WHEN true THEN NULL - ELSE pg_current_wal_lsn() - END ) THEN 'recycled' - ELSE 'written' - END AS type - FROM pg_catalog.pg_ls_dir('pg_wal') AS wal(name) - WHERE name ~ '^[0-9A-F]{24}$' - ORDER BY - (pg_stat_file('pg_wal/'||name, true)).modification, - wal.name DESC) sub; -""", - V96: """ -SELECT - count(*) as total_wal, - count(*) FILTER (WHERE type = 'recycled') AS recycled_wal, - count(*) FILTER (WHERE type = 'written') AS written_wal -FROM - (SELECT - wal.name, - pg_xlogfile_name( - CASE pg_is_in_recovery() - WHEN true THEN NULL - ELSE pg_current_xlog_location() - END ), - CASE - WHEN wal.name > pg_xlogfile_name( - CASE pg_is_in_recovery() - WHEN true THEN NULL - ELSE pg_current_xlog_location() - END ) THEN 'recycled' - ELSE 'written' - END AS type - FROM pg_catalog.pg_ls_dir('pg_xlog') AS wal(name) - WHERE name ~ '^[0-9A-F]{24}$' - ORDER BY - (pg_stat_file('pg_xlog/'||name, true)).modification, - wal.name DESC) sub; -""", -} - -QUERY_ARCHIVE = { - DEFAULT: """ -SELECT - CAST(COUNT(*) AS INT) AS file_count, - CAST(COALESCE(SUM(CAST(archive_file ~ $r$\.ready$$r$ as INT)),0) AS INT) AS ready_count, - CAST(COALESCE(SUM(CAST(archive_file ~ $r$\.done$$r$ AS INT)),0) AS INT) AS done_count -FROM - pg_catalog.pg_ls_dir('pg_wal/archive_status') AS archive_files (archive_file); -""", - V96: """ -SELECT - CAST(COUNT(*) AS INT) AS file_count, - CAST(COALESCE(SUM(CAST(archive_file ~ $r$\.ready$$r$ as INT)),0) AS INT) AS ready_count, - CAST(COALESCE(SUM(CAST(archive_file ~ $r$\.done$$r$ AS INT)),0) AS INT) AS done_count -FROM - pg_catalog.pg_ls_dir('pg_xlog/archive_status') AS archive_files (archive_file); - -""", -} - -QUERY_BACKEND = { - DEFAULT: """ -SELECT - count(*) - (SELECT count(*) - FROM pg_stat_activity - WHERE state = 'idle') - AS backends_active, - (SELECT count(*) - FROM pg_stat_activity - WHERE state = 'idle') - AS backends_idle -FROM pg_stat_activity; -""", -} - -QUERY_BACKEND_USAGE = { - DEFAULT: """ -SELECT - COUNT(1) as used, - current_setting('max_connections')::int - current_setting('superuser_reserved_connections')::int - - COUNT(1) AS available -FROM pg_catalog.pg_stat_activity -WHERE backend_type IN ('client backend', 'background worker'); -""", - V10: """ -SELECT - SUM(s.conn) as used, - current_setting('max_connections')::int - current_setting('superuser_reserved_connections')::int - - SUM(s.conn) AS available -FROM ( - SELECT 's' as type, COUNT(1) as conn - FROM pg_catalog.pg_stat_activity - WHERE backend_type IN ('client backend', 'background worker') - UNION ALL - SELECT 'r', COUNT(1) - FROM pg_catalog.pg_stat_replication -) as s; -""", - V92: """ -SELECT - SUM(s.conn) as used, - current_setting('max_connections')::int - current_setting('superuser_reserved_connections')::int - - SUM(s.conn) AS available -FROM ( - SELECT 's' as type, COUNT(1) as conn - FROM pg_catalog.pg_stat_activity - WHERE query NOT LIKE 'autovacuum: %%' - UNION ALL - SELECT 'r', COUNT(1) - FROM pg_catalog.pg_stat_replication -) as s; -""", - V91: """ -SELECT - SUM(s.conn) as used, - current_setting('max_connections')::int - current_setting('superuser_reserved_connections')::int - - SUM(s.conn) AS available -FROM ( - SELECT 's' as type, COUNT(1) as conn - FROM pg_catalog.pg_stat_activity - WHERE current_query NOT LIKE 'autovacuum: %%' - UNION ALL - SELECT 'r', COUNT(1) - FROM pg_catalog.pg_stat_replication -) as s; -""", - V82: """ -SELECT - COUNT(1) as used, - current_setting('max_connections')::int - current_setting('superuser_reserved_connections')::int - - COUNT(1) AS available -FROM pg_catalog.pg_stat_activity -WHERE current_query NOT LIKE 'autovacuum: %%'; -""", - V72: """ -SELECT - COUNT(1) as used, - current_setting('max_connections')::int - current_setting('superuser_reserved_connections')::int - - COUNT(1) AS available -FROM pg_catalog.pg_stat_activity s -JOIN pg_catalog.pg_database d ON d.oid = s.datid -WHERE d.datallowconn; -""", -} - -QUERY_TABLE_STATS = { - DEFAULT: """ -SELECT - sum(relpages) * current_setting('block_size')::numeric AS table_size, - count(1) AS table_count -FROM pg_class -WHERE relkind IN ('r', 't', 'm'); -""", -} - -QUERY_INDEX_STATS = { - DEFAULT: """ -SELECT - sum(relpages) * current_setting('block_size')::numeric AS index_size, - count(1) AS index_count -FROM pg_class -WHERE relkind = 'i'; -""", -} - -QUERY_DATABASE = { - DEFAULT: """ -SELECT - datname AS database_name, - numbackends AS connections, - xact_commit AS xact_commit, - xact_rollback AS xact_rollback, - blks_read AS blks_read, - blks_hit AS blks_hit, - tup_returned AS tup_returned, - tup_fetched AS tup_fetched, - tup_inserted AS tup_inserted, - tup_updated AS tup_updated, - tup_deleted AS tup_deleted, - conflicts AS conflicts, - pg_database_size(datname) AS size, - temp_files AS temp_files, - temp_bytes AS temp_bytes -FROM pg_stat_database -WHERE datname IN %(databases)s ; -""", -} - -QUERY_BGWRITER = { - DEFAULT: """ -SELECT - checkpoints_timed AS checkpoint_scheduled, - checkpoints_req AS checkpoint_requested, - buffers_checkpoint * current_setting('block_size')::numeric buffers_checkpoint, - buffers_clean * current_setting('block_size')::numeric buffers_clean, - maxwritten_clean, - buffers_backend * current_setting('block_size')::numeric buffers_backend, - buffers_alloc * current_setting('block_size')::numeric buffers_alloc, - buffers_backend_fsync -FROM pg_stat_bgwriter; -""", -} - -QUERY_LOCKS = { - DEFAULT: """ -SELECT - pg_database.datname as database_name, - mode, - count(mode) AS locks_count -FROM pg_locks -INNER JOIN pg_database - ON pg_database.oid = pg_locks.database -GROUP BY datname, mode -ORDER BY datname, mode; -""", -} - -QUERY_BLOCKERS = { - DEFAULT: """ -WITH B AS ( -SELECT DISTINCT - pg_database.datname as database_name, - pg_locks.pid, - cardinality(pg_blocking_pids(pg_locks.pid)) AS blocking_pids -FROM pg_locks -INNER JOIN pg_database ON pg_database.oid = pg_locks.database -WHERE NOT pg_locks.granted) -SELECT database_name, AVG(blocking_pids) AS blocking_pids_avg -FROM B -GROUP BY database_name -""", - V96: """ -WITH B AS ( -SELECT DISTINCT - pg_database.datname as database_name, - blocked_locks.pid AS blocked_pid, - COUNT(blocking_locks.pid) AS blocking_pids -FROM pg_catalog.pg_locks blocked_locks -INNER JOIN pg_database ON pg_database.oid = blocked_locks.database -JOIN pg_catalog.pg_locks blocking_locks - ON blocking_locks.locktype = blocked_locks.locktype - AND blocking_locks.database IS NOT DISTINCT FROM blocked_locks.database - AND blocking_locks.relation IS NOT DISTINCT FROM blocked_locks.relation - AND blocking_locks.page IS NOT DISTINCT FROM blocked_locks.page - AND blocking_locks.tuple IS NOT DISTINCT FROM blocked_locks.tuple - AND blocking_locks.virtualxid IS NOT DISTINCT FROM blocked_locks.virtualxid - AND blocking_locks.transactionid IS NOT DISTINCT FROM blocked_locks.transactionid - AND blocking_locks.classid IS NOT DISTINCT FROM blocked_locks.classid - AND blocking_locks.objid IS NOT DISTINCT FROM blocked_locks.objid - AND blocking_locks.objsubid IS NOT DISTINCT FROM blocked_locks.objsubid - AND blocking_locks.pid != blocked_locks.pid -WHERE NOT blocked_locks.GRANTED -GROUP BY database_name, blocked_pid) -SELECT database_name, AVG(blocking_pids) AS blocking_pids_avg -FROM B -GROUP BY database_name -""" -} - -QUERY_DATABASES = { - DEFAULT: """ -SELECT - datname -FROM pg_stat_database -WHERE - has_database_privilege( - (SELECT current_user), datname, 'connect') - AND NOT datname ~* '^template\d' -ORDER BY datname; -""", -} - -QUERY_STANDBY = { - DEFAULT: """ -SELECT - COALESCE(prs.slot_name, psr.application_name) application_name -FROM pg_stat_replication psr -LEFT OUTER JOIN pg_replication_slots prs on psr.pid = prs.active_pid -WHERE application_name IS NOT NULL; -""", -} - -QUERY_REPLICATION_SLOT = { - DEFAULT: """ -SELECT slot_name -FROM pg_replication_slots; -""" -} - -QUERY_STANDBY_DELTA = { - DEFAULT: """ -SELECT - COALESCE(prs.slot_name, psr.application_name) application_name, - pg_wal_lsn_diff( - CASE pg_is_in_recovery() - WHEN true THEN pg_last_wal_receive_lsn() - ELSE pg_current_wal_lsn() - END, - sent_lsn) AS sent_delta, - pg_wal_lsn_diff( - CASE pg_is_in_recovery() - WHEN true THEN pg_last_wal_receive_lsn() - ELSE pg_current_wal_lsn() - END, - write_lsn) AS write_delta, - pg_wal_lsn_diff( - CASE pg_is_in_recovery() - WHEN true THEN pg_last_wal_receive_lsn() - ELSE pg_current_wal_lsn() - END, - flush_lsn) AS flush_delta, - pg_wal_lsn_diff( - CASE pg_is_in_recovery() - WHEN true THEN pg_last_wal_receive_lsn() - ELSE pg_current_wal_lsn() - END, - replay_lsn) AS replay_delta -FROM pg_stat_replication psr -LEFT OUTER JOIN pg_replication_slots prs on psr.pid = prs.active_pid -WHERE application_name IS NOT NULL; -""", - V96: """ -SELECT - COALESCE(prs.slot_name, psr.application_name) application_name, - pg_xlog_location_diff( - CASE pg_is_in_recovery() - WHEN true THEN pg_last_xlog_receive_location() - ELSE pg_current_xlog_location() - END, - sent_location) AS sent_delta, - pg_xlog_location_diff( - CASE pg_is_in_recovery() - WHEN true THEN pg_last_xlog_receive_location() - ELSE pg_current_xlog_location() - END, - write_location) AS write_delta, - pg_xlog_location_diff( - CASE pg_is_in_recovery() - WHEN true THEN pg_last_xlog_receive_location() - ELSE pg_current_xlog_location() - END, - flush_location) AS flush_delta, - pg_xlog_location_diff( - CASE pg_is_in_recovery() - WHEN true THEN pg_last_xlog_receive_location() - ELSE pg_current_xlog_location() - END, - replay_location) AS replay_delta -FROM pg_stat_replication psr -LEFT OUTER JOIN pg_replication_slots prs on psr.pid = prs.active_pid -WHERE application_name IS NOT NULL; -""", -} - -QUERY_STANDBY_LAG = { - DEFAULT: """ -SELECT - COALESCE(prs.slot_name, psr.application_name) application_name, - COALESCE(EXTRACT(EPOCH FROM write_lag)::bigint, 0) AS write_lag, - COALESCE(EXTRACT(EPOCH FROM flush_lag)::bigint, 0) AS flush_lag, - COALESCE(EXTRACT(EPOCH FROM replay_lag)::bigint, 0) AS replay_lag -FROM pg_stat_replication psr -LEFT OUTER JOIN pg_replication_slots prs on psr.pid = prs.active_pid -WHERE application_name IS NOT NULL; -""" -} - -QUERY_REPSLOT_FILES = { - DEFAULT: """ -WITH wal_size AS ( - SELECT - setting::int AS val - FROM pg_settings - WHERE name = 'wal_segment_size' - ) -SELECT - slot_name, - slot_type, - replslot_wal_keep, - count(slot_file) AS replslot_files -FROM - (SELECT - slot.slot_name, - CASE - WHEN slot_file <> 'state' THEN 1 - END AS slot_file , - slot_type, - COALESCE ( - floor( - CASE WHEN pg_is_in_recovery() - THEN ( - pg_wal_lsn_diff(pg_last_wal_receive_lsn(), slot.restart_lsn) - -- this is needed to account for whole WAL retention and - -- not only size retention - + (pg_wal_lsn_diff(restart_lsn, '0/0') %% s.val) - ) / s.val - ELSE ( - pg_wal_lsn_diff(pg_current_wal_lsn(), slot.restart_lsn) - -- this is needed to account for whole WAL retention and - -- not only size retention - + (pg_walfile_name_offset(restart_lsn)).file_offset - ) / s.val - END - ),0) AS replslot_wal_keep - FROM pg_replication_slots slot - LEFT JOIN ( - SELECT - slot2.slot_name, - pg_ls_dir('pg_replslot/' || slot2.slot_name) AS slot_file - FROM pg_replication_slots slot2 - ) files (slot_name, slot_file) - ON slot.slot_name = files.slot_name - CROSS JOIN wal_size s - ) AS d -GROUP BY - slot_name, - slot_type, - replslot_wal_keep; -""", - V10: """ -WITH wal_size AS ( - SELECT - current_setting('wal_block_size')::INT * setting::INT AS val - FROM pg_settings - WHERE name = 'wal_segment_size' - ) -SELECT - slot_name, - slot_type, - replslot_wal_keep, - count(slot_file) AS replslot_files -FROM - (SELECT - slot.slot_name, - CASE - WHEN slot_file <> 'state' THEN 1 - END AS slot_file , - slot_type, - COALESCE ( - floor( - CASE WHEN pg_is_in_recovery() - THEN ( - pg_wal_lsn_diff(pg_last_wal_receive_lsn(), slot.restart_lsn) - -- this is needed to account for whole WAL retention and - -- not only size retention - + (pg_wal_lsn_diff(restart_lsn, '0/0') %% s.val) - ) / s.val - ELSE ( - pg_wal_lsn_diff(pg_current_wal_lsn(), slot.restart_lsn) - -- this is needed to account for whole WAL retention and - -- not only size retention - + (pg_walfile_name_offset(restart_lsn)).file_offset - ) / s.val - END - ),0) AS replslot_wal_keep - FROM pg_replication_slots slot - LEFT JOIN ( - SELECT - slot2.slot_name, - pg_ls_dir('pg_replslot/' || slot2.slot_name) AS slot_file - FROM pg_replication_slots slot2 - ) files (slot_name, slot_file) - ON slot.slot_name = files.slot_name - CROSS JOIN wal_size s - ) AS d -GROUP BY - slot_name, - slot_type, - replslot_wal_keep; -""", -} - -QUERY_SUPERUSER = { - DEFAULT: """ -SELECT current_setting('is_superuser') = 'on' AS is_superuser; -""", -} - -QUERY_SHOW_VERSION = { - DEFAULT: """ -SHOW server_version_num; -""", -} - -QUERY_AUTOVACUUM = { - DEFAULT: """ -SELECT - count(*) FILTER (WHERE query LIKE 'autovacuum: ANALYZE%%') AS analyze, - count(*) FILTER (WHERE query LIKE 'autovacuum: VACUUM ANALYZE%%') AS vacuum_analyze, - count(*) FILTER (WHERE query LIKE 'autovacuum: VACUUM%%' - AND query NOT LIKE 'autovacuum: VACUUM ANALYZE%%' - AND query NOT LIKE '%%to prevent wraparound%%') AS vacuum, - count(*) FILTER (WHERE query LIKE '%%to prevent wraparound%%') AS vacuum_freeze, - count(*) FILTER (WHERE query LIKE 'autovacuum: BRIN summarize%%') AS brin_summarize -FROM pg_stat_activity -WHERE query NOT LIKE '%%pg_stat_activity%%'; -""", -} - -QUERY_FORCED_AUTOVACUUM = { - DEFAULT: """ -WITH max_age AS ( - SELECT setting AS autovacuum_freeze_max_age - FROM pg_catalog.pg_settings - WHERE name = 'autovacuum_freeze_max_age' ) -, per_database_stats AS ( - SELECT datname - , m.autovacuum_freeze_max_age::int - , age(d.datfrozenxid) AS oldest_current_xid - FROM pg_catalog.pg_database d - JOIN max_age m ON (true) - WHERE d.datallowconn ) -SELECT max(ROUND(100*(oldest_current_xid/autovacuum_freeze_max_age::float))) AS percent_towards_forced_autovacuum -FROM per_database_stats; -""", -} - -QUERY_TX_WRAPAROUND = { - DEFAULT: """ -WITH max_age AS ( - SELECT 2000000000 as max_old_xid - FROM pg_catalog.pg_settings - WHERE name = 'autovacuum_freeze_max_age' ) -, per_database_stats AS ( - SELECT datname - , m.max_old_xid::int - , age(d.datfrozenxid) AS oldest_current_xid - FROM pg_catalog.pg_database d - JOIN max_age m ON (true) - WHERE d.datallowconn ) -SELECT max(oldest_current_xid) AS oldest_current_xid - , max(ROUND(100*(oldest_current_xid/max_old_xid::float))) AS percent_towards_wraparound -FROM per_database_stats; -""", -} - -QUERY_DIFF_LSN = { - DEFAULT: """ -SELECT - pg_wal_lsn_diff( - CASE pg_is_in_recovery() - WHEN true THEN pg_last_wal_receive_lsn() - ELSE pg_current_wal_lsn() - END, - '0/0') as wal_writes ; -""", - V96: """ -SELECT - pg_xlog_location_diff( - CASE pg_is_in_recovery() - WHEN true THEN pg_last_xlog_receive_location() - ELSE pg_current_xlog_location() - END, - '0/0') as wal_writes ; -""", -} - -def query_factory(name, version=NO_VERSION): - if name == QUERY_NAME_BACKENDS: - return QUERY_BACKEND[DEFAULT] - elif name == QUERY_NAME_BACKEND_USAGE: - if version < 80200: - return QUERY_BACKEND_USAGE[V72] - if version < 90100: - return QUERY_BACKEND_USAGE[V82] - if version < 90200: - return QUERY_BACKEND_USAGE[V91] - if version < 100000: - return QUERY_BACKEND_USAGE[V92] - elif version < 120000: - return QUERY_BACKEND_USAGE[V10] - return QUERY_BACKEND_USAGE[DEFAULT] - elif name == QUERY_NAME_TABLE_STATS: - return QUERY_TABLE_STATS[DEFAULT] - elif name == QUERY_NAME_INDEX_STATS: - return QUERY_INDEX_STATS[DEFAULT] - elif name == QUERY_NAME_DATABASE: - return QUERY_DATABASE[DEFAULT] - elif name == QUERY_NAME_BGWRITER: - return QUERY_BGWRITER[DEFAULT] - elif name == QUERY_NAME_LOCKS: - return QUERY_LOCKS[DEFAULT] - elif name == QUERY_NAME_BLOCKERS: - if version < 90600: - return QUERY_BLOCKERS[V96] - return QUERY_BLOCKERS[DEFAULT] - elif name == QUERY_NAME_DATABASES: - return QUERY_DATABASES[DEFAULT] - elif name == QUERY_NAME_STANDBY: - return QUERY_STANDBY[DEFAULT] - elif name == QUERY_NAME_REPLICATION_SLOT: - return QUERY_REPLICATION_SLOT[DEFAULT] - elif name == QUERY_NAME_IF_SUPERUSER: - return QUERY_SUPERUSER[DEFAULT] - elif name == QUERY_NAME_SERVER_VERSION: - return QUERY_SHOW_VERSION[DEFAULT] - elif name == QUERY_NAME_AUTOVACUUM: - return QUERY_AUTOVACUUM[DEFAULT] - elif name == QUERY_NAME_FORCED_AUTOVACUUM: - return QUERY_FORCED_AUTOVACUUM[DEFAULT] - elif name == QUERY_NAME_TX_WRAPAROUND: - return QUERY_TX_WRAPAROUND[DEFAULT] - elif name == QUERY_NAME_WAL: - if version < 100000: - return QUERY_WAL[V96] - return QUERY_WAL[DEFAULT] - elif name == QUERY_NAME_ARCHIVE: - if version < 100000: - return QUERY_ARCHIVE[V96] - return QUERY_ARCHIVE[DEFAULT] - elif name == QUERY_NAME_STANDBY_DELTA: - if version < 100000: - return QUERY_STANDBY_DELTA[V96] - return QUERY_STANDBY_DELTA[DEFAULT] - elif name == QUERY_NAME_STANDBY_LAG: - return QUERY_STANDBY_LAG[DEFAULT] - elif name == QUERY_NAME_REPSLOT_FILES: - if version < 110000: - return QUERY_REPSLOT_FILES[V10] - return QUERY_REPSLOT_FILES[DEFAULT] - elif name == QUERY_NAME_DIFF_LSN: - if version < 100000: - return QUERY_DIFF_LSN[V96] - return QUERY_DIFF_LSN[DEFAULT] - - raise ValueError('unknown query') - - -ORDER = [ - 'db_stat_temp_files', - 'db_stat_temp_bytes', - 'db_stat_blks', - 'db_stat_tuple_returned', - 'db_stat_tuple_write', - 'db_stat_transactions', - 'db_stat_connections', - 'db_stat_blocking_pids_avg', - 'database_size', - 'backend_process', - 'backend_usage', - 'index_count', - 'index_size', - 'table_count', - 'table_size', - 'wal', - 'wal_writes', - 'archive_wal', - 'checkpointer', - 'stat_bgwriter_alloc', - 'stat_bgwriter_checkpoint', - 'stat_bgwriter_backend', - 'stat_bgwriter_backend_fsync', - 'stat_bgwriter_bgwriter', - 'stat_bgwriter_maxwritten', - 'replication_slot', - 'standby_delta', - 'standby_lag', - 'autovacuum', - 'forced_autovacuum', - 'tx_wraparound_oldest_current_xid', - 'tx_wraparound_percent_towards_wraparound' -] - -CHARTS = { - 'db_stat_transactions': { - 'options': [None, 'Transactions on db', 'transactions/s', 'db statistics', 'postgres.db_stat_transactions', - 'line'], - 'lines': [ - ['xact_commit', 'committed', 'incremental'], - ['xact_rollback', 'rolled back', 'incremental'] - ] - }, - 'db_stat_connections': { - 'options': [None, 'Current connections to db', 'count', 'db statistics', 'postgres.db_stat_connections', - 'line'], - 'lines': [ - ['connections', 'connections', 'absolute'] - ] - }, - 'db_stat_blks': { - 'options': [None, 'Disk blocks reads from db', 'reads/s', 'db statistics', 'postgres.db_stat_blks', 'line'], - 'lines': [ - ['blks_read', 'disk', 'incremental'], - ['blks_hit', 'cache', 'incremental'] - ] - }, - 'db_stat_tuple_returned': { - 'options': [None, 'Tuples returned from db', 'tuples/s', 'db statistics', 'postgres.db_stat_tuple_returned', - 'line'], - 'lines': [ - ['tup_returned', 'sequential', 'incremental'], - ['tup_fetched', 'bitmap', 'incremental'] - ] - }, - 'db_stat_tuple_write': { - 'options': [None, 'Tuples written to db', 'writes/s', 'db statistics', 'postgres.db_stat_tuple_write', 'line'], - 'lines': [ - ['tup_inserted', 'inserted', 'incremental'], - ['tup_updated', 'updated', 'incremental'], - ['tup_deleted', 'deleted', 'incremental'], - ['conflicts', 'conflicts', 'incremental'] - ] - }, - 'db_stat_temp_bytes': { - 'options': [None, 'Temp files written to disk', 'KiB/s', 'db statistics', 'postgres.db_stat_temp_bytes', - 'line'], - 'lines': [ - ['temp_bytes', 'size', 'incremental', 1, 1024] - ] - }, - 'db_stat_temp_files': { - 'options': [None, 'Temp files written to disk', 'files', 'db statistics', 'postgres.db_stat_temp_files', - 'line'], - 'lines': [ - ['temp_files', 'files', 'incremental'] - ] - }, - 'db_stat_blocking_pids_avg': { - 'options': [None, 'Average number of blocking transactions in db', 'processes', 'db statistics', - 'postgres.db_stat_blocking_pids_avg', 'line'], - 'lines': [ - ['blocking_pids_avg', 'blocking', 'absolute'] - ] - }, - 'database_size': { - 'options': [None, 'Database size', 'MiB', 'database size', 'postgres.db_size', 'stacked'], - 'lines': [ - ] - }, - 'backend_process': { - 'options': [None, 'Current Backend Processes', 'processes', 'backend processes', 'postgres.backend_process', - 'line'], - 'lines': [ - ['backends_active', 'active', 'absolute'], - ['backends_idle', 'idle', 'absolute'] - ] - }, - 'backend_usage': { - 'options': [None, '% of Connections in use', 'percentage', 'backend processes', 'postgres.backend_usage', 'stacked'], - 'lines': [ - ['available', 'available', 'percentage-of-absolute-row'], - ['used', 'used', 'percentage-of-absolute-row'] - ] - }, - 'index_count': { - 'options': [None, 'Total indexes', 'index', 'indexes', 'postgres.index_count', 'line'], - 'lines': [ - ['index_count', 'total', 'absolute'] - ] - }, - 'index_size': { - 'options': [None, 'Indexes size', 'MiB', 'indexes', 'postgres.index_size', 'line'], - 'lines': [ - ['index_size', 'size', 'absolute', 1, 1024 * 1024] - ] - }, - 'table_count': { - 'options': [None, 'Total Tables', 'tables', 'tables', 'postgres.table_count', 'line'], - 'lines': [ - ['table_count', 'total', 'absolute'] - ] - }, - 'table_size': { - 'options': [None, 'Tables size', 'MiB', 'tables', 'postgres.table_size', 'line'], - 'lines': [ - ['table_size', 'size', 'absolute', 1, 1024 * 1024] - ] - }, - 'wal': { - 'options': [None, 'Write-Ahead Logs', 'files', 'wal', 'postgres.wal', 'line'], - 'lines': [ - ['written_wal', 'written', 'absolute'], - ['recycled_wal', 'recycled', 'absolute'], - ['total_wal', 'total', 'absolute'] - ] - }, - 'wal_writes': { - 'options': [None, 'Write-Ahead Logs', 'KiB/s', 'wal_writes', 'postgres.wal_writes', 'line'], - 'lines': [ - ['wal_writes', 'writes', 'incremental', 1, 1024] - ] - }, - 'archive_wal': { - 'options': [None, 'Archive Write-Ahead Logs', 'files/s', 'archive wal', 'postgres.archive_wal', 'line'], - 'lines': [ - ['file_count', 'total', 'incremental'], - ['ready_count', 'ready', 'incremental'], - ['done_count', 'done', 'incremental'] - ] - }, - 'checkpointer': { - 'options': [None, 'Checkpoints', 'writes', 'checkpointer', 'postgres.checkpointer', 'line'], - 'lines': [ - ['checkpoint_scheduled', 'scheduled', 'incremental'], - ['checkpoint_requested', 'requested', 'incremental'] - ] - }, - 'stat_bgwriter_alloc': { - 'options': [None, 'Buffers allocated', 'KiB/s', 'bgwriter', 'postgres.stat_bgwriter_alloc', 'line'], - 'lines': [ - ['buffers_alloc', 'alloc', 'incremental', 1, 1024] - ] - }, - 'stat_bgwriter_checkpoint': { - 'options': [None, 'Buffers written during checkpoints', 'KiB/s', 'bgwriter', - 'postgres.stat_bgwriter_checkpoint', 'line'], - 'lines': [ - ['buffers_checkpoint', 'checkpoint', 'incremental', 1, 1024] - ] - }, - 'stat_bgwriter_backend': { - 'options': [None, 'Buffers written directly by a backend', 'KiB/s', 'bgwriter', - 'postgres.stat_bgwriter_backend', 'line'], - 'lines': [ - ['buffers_backend', 'backend', 'incremental', 1, 1024] - ] - }, - 'stat_bgwriter_backend_fsync': { - 'options': [None, 'Fsync by backend', 'times', 'bgwriter', 'postgres.stat_bgwriter_backend_fsync', 'line'], - 'lines': [ - ['buffers_backend_fsync', 'backend fsync', 'incremental'] - ] - }, - 'stat_bgwriter_bgwriter': { - 'options': [None, 'Buffers written by the background writer', 'KiB/s', 'bgwriter', - 'postgres.bgwriter_bgwriter', 'line'], - 'lines': [ - ['buffers_clean', 'clean', 'incremental', 1, 1024] - ] - }, - 'stat_bgwriter_maxwritten': { - 'options': [None, 'Too many buffers written', 'times', 'bgwriter', 'postgres.stat_bgwriter_maxwritten', - 'line'], - 'lines': [ - ['maxwritten_clean', 'maxwritten', 'incremental'] - ] - }, - 'autovacuum': { - 'options': [None, 'Autovacuum workers', 'workers', 'autovacuum', 'postgres.autovacuum', 'line'], - 'lines': [ - ['analyze', 'analyze', 'absolute'], - ['vacuum', 'vacuum', 'absolute'], - ['vacuum_analyze', 'vacuum analyze', 'absolute'], - ['vacuum_freeze', 'vacuum freeze', 'absolute'], - ['brin_summarize', 'brin summarize', 'absolute'] - ] - }, - 'forced_autovacuum': { - 'options': [None, 'Percent towards forced autovacuum', 'percent', 'autovacuum', 'postgres.forced_autovacuum', 'line'], - 'lines': [ - ['percent_towards_forced_autovacuum', 'percent', 'absolute'] - ] - }, - 'tx_wraparound_oldest_current_xid': { - 'options': [None, 'Oldest current XID', 'xid', 'tx_wraparound', 'postgres.tx_wraparound_oldest_current_xid', 'line'], - 'lines': [ - ['oldest_current_xid', 'xid', 'absolute'] - ] - }, - 'tx_wraparound_percent_towards_wraparound': { - 'options': [None, 'Percent towards wraparound', 'percent', 'tx_wraparound', 'postgres.percent_towards_wraparound', 'line'], - 'lines': [ - ['percent_towards_wraparound', 'percent', 'absolute'] - ] - }, - 'standby_delta': { - 'options': [None, 'Standby delta', 'KiB', 'replication delta', 'postgres.standby_delta', 'line'], - 'lines': [ - ['sent_delta', 'sent delta', 'absolute', 1, 1024], - ['write_delta', 'write delta', 'absolute', 1, 1024], - ['flush_delta', 'flush delta', 'absolute', 1, 1024], - ['replay_delta', 'replay delta', 'absolute', 1, 1024] - ] - }, - 'standby_lag': { - 'options': [None, 'Standby lag', 'seconds', 'replication lag', 'postgres.standby_lag', 'line'], - 'lines': [ - ['write_lag', 'write lag', 'absolute'], - ['flush_lag', 'flush lag', 'absolute'], - ['replay_lag', 'replay lag', 'absolute'] - ] - }, - 'replication_slot': { - 'options': [None, 'Replication slot files', 'files', 'replication slot', 'postgres.replication_slot', 'line'], - 'lines': [ - ['replslot_wal_keep', 'wal keeped', 'absolute'], - ['replslot_files', 'pg_replslot files', 'absolute'] - ] - } -} - - -class Service(SimpleService): - def __init__(self, configuration=None, name=None): - SimpleService.__init__(self, configuration=configuration, name=name) - self.order = list(ORDER) - self.definitions = deepcopy(CHARTS) - self.do_table_stats = configuration.pop('table_stats', False) - self.do_index_stats = configuration.pop('index_stats', False) - self.databases_to_poll = configuration.pop('database_poll', None) - self.configuration = configuration - self.conn = None - self.conn_params = dict() - self.server_version = None - self.is_superuser = False - self.alive = False - self.databases = list() - self.secondaries = list() - self.replication_slots = list() - self.queries = dict() - self.data = dict() - - def reconnect(self): - return self.connect() - - def build_conn_params(self): - conf = self.configuration - - # connection URIs: https://www.postgresql.org/docs/current/libpq-connect.html#LIBPQ-CONNSTRING - if conf.get(CONN_PARAM_DSN): - return {'dsn': conf[CONN_PARAM_DSN]} - - params = { - CONN_PARAM_HOST: conf.get(CONN_PARAM_HOST), - CONN_PARAM_PORT: conf.get(CONN_PARAM_PORT, DEFAULT_PORT), - CONN_PARAM_DATABASE: conf.get(CONN_PARAM_DATABASE), - CONN_PARAM_USER: conf.get(CONN_PARAM_USER, DEFAULT_USER), - CONN_PARAM_PASSWORD: conf.get(CONN_PARAM_PASSWORD), - CONN_PARAM_CONN_TIMEOUT: conf.get(CONN_PARAM_CONN_TIMEOUT, DEFAULT_CONNECT_TIMEOUT), - 'options': '-c statement_timeout={0}'.format( - conf.get(CONN_PARAM_STATEMENT_TIMEOUT, DEFAULT_STATEMENT_TIMEOUT)), - } - - # https://www.postgresql.org/docs/current/libpq-ssl.html - ssl_params = dict( - (k, v) for k, v in { - CONN_PARAM_SSL_MODE: conf.get(CONN_PARAM_SSL_MODE), - CONN_PARAM_SSL_ROOT_CERT: conf.get(CONN_PARAM_SSL_ROOT_CERT), - CONN_PARAM_SSL_CRL: conf.get(CONN_PARAM_SSL_CRL), - CONN_PARAM_SSL_CERT: conf.get(CONN_PARAM_SSL_CERT), - CONN_PARAM_SSL_KEY: conf.get(CONN_PARAM_SSL_KEY), - }.items() if v) - - if CONN_PARAM_SSL_MODE not in ssl_params and len(ssl_params) > 0: - raise ValueError("mandatory 'sslmode' param is missing, please set") - - params.update(ssl_params) - - return params - - def connect(self): - if self.conn: - self.conn.close() - self.conn = None - - try: - self.conn = psycopg2.connect(**self.conn_params) - self.conn.set_isolation_level(extensions.ISOLATION_LEVEL_AUTOCOMMIT) - self.conn.set_session(readonly=True) - except OperationalError as error: - self.error(error) - self.alive = False - else: - self.alive = True - - return self.alive - - def check(self): - if not PSYCOPG2: - self.error("'python-psycopg2' package is needed to use postgres module") - return False - - try: - self.conn_params = self.build_conn_params() - except ValueError as error: - self.error('error on creating connection params : {0}', error) - return False - - if not self.connect(): - self.error('failed to connect to {0}'.format(hide_password(self.conn_params))) - return False - - try: - self.check_queries() - except Exception as error: - self.error(error) - return False - - self.populate_queries() - self.create_dynamic_charts() - - return True - - def get_data(self): - if not self.alive and not self.reconnect(): - return None - - self.data = dict() - try: - cursor = self.conn.cursor(cursor_factory=DictCursor) - - self.data.update(zero_lock_types(self.databases)) - - for query, metrics in self.queries.items(): - self.query_stats(cursor, query, metrics) - - except OperationalError: - self.alive = False - return None - - cursor.close() - - return self.data - - def query_stats(self, cursor, query, metrics): - cursor.execute(query, dict(databases=tuple(self.databases))) - - for row in cursor: - for metric in metrics: - # databases - if 'database_name' in row: - dimension_id = '_'.join([row['database_name'], metric]) - # secondaries - elif 'application_name' in row: - dimension_id = '_'.join([row['application_name'], metric]) - # replication slots - elif 'slot_name' in row: - dimension_id = '_'.join([row['slot_name'], metric]) - # other - else: - dimension_id = metric - - if metric in row: - if row[metric] is not None: - self.data[dimension_id] = int(row[metric]) - elif 'locks_count' in row: - if metric == row['mode']: - self.data[dimension_id] = row['locks_count'] - - def check_queries(self): - cursor = self.conn.cursor() - - self.server_version = detect_server_version(cursor, query_factory(QUERY_NAME_SERVER_VERSION)) - self.debug('server version: {0}'.format(self.server_version)) - - self.is_superuser = check_if_superuser(cursor, query_factory(QUERY_NAME_IF_SUPERUSER)) - self.debug('superuser: {0}'.format(self.is_superuser)) - - self.databases = discover(cursor, query_factory(QUERY_NAME_DATABASES)) - self.debug('discovered databases {0}'.format(self.databases)) - if self.databases_to_poll: - to_poll = self.databases_to_poll.split() - self.databases = [db for db in self.databases if db in to_poll] or self.databases - - self.secondaries = discover(cursor, query_factory(QUERY_NAME_STANDBY)) - self.debug('discovered secondaries: {0}'.format(self.secondaries)) - - if self.server_version >= 94000: - self.replication_slots = discover(cursor, query_factory(QUERY_NAME_REPLICATION_SLOT)) - self.debug('discovered replication slots: {0}'.format(self.replication_slots)) - - cursor.close() - - def populate_queries(self): - self.queries[query_factory(QUERY_NAME_DATABASE)] = METRICS[QUERY_NAME_DATABASE] - self.queries[query_factory(QUERY_NAME_BACKENDS)] = METRICS[QUERY_NAME_BACKENDS] - self.queries[query_factory(QUERY_NAME_BACKEND_USAGE, self.server_version)] = METRICS[QUERY_NAME_BACKEND_USAGE] - self.queries[query_factory(QUERY_NAME_LOCKS)] = METRICS[QUERY_NAME_LOCKS] - self.queries[query_factory(QUERY_NAME_BGWRITER)] = METRICS[QUERY_NAME_BGWRITER] - self.queries[query_factory(QUERY_NAME_DIFF_LSN, self.server_version)] = METRICS[QUERY_NAME_WAL_WRITES] - self.queries[query_factory(QUERY_NAME_STANDBY_DELTA, self.server_version)] = METRICS[QUERY_NAME_STANDBY_DELTA] - self.queries[query_factory(QUERY_NAME_BLOCKERS, self.server_version)] = METRICS[QUERY_NAME_BLOCKERS] - - if self.do_index_stats: - self.queries[query_factory(QUERY_NAME_INDEX_STATS)] = METRICS[QUERY_NAME_INDEX_STATS] - if self.do_table_stats: - self.queries[query_factory(QUERY_NAME_TABLE_STATS)] = METRICS[QUERY_NAME_TABLE_STATS] - - if self.is_superuser: - self.queries[query_factory(QUERY_NAME_ARCHIVE, self.server_version)] = METRICS[QUERY_NAME_ARCHIVE] - - if self.server_version >= 90400: - self.queries[query_factory(QUERY_NAME_WAL, self.server_version)] = METRICS[QUERY_NAME_WAL] - - if self.server_version >= 100000: - v = METRICS[QUERY_NAME_REPSLOT_FILES] - self.queries[query_factory(QUERY_NAME_REPSLOT_FILES, self.server_version)] = v - - if self.server_version >= 90400: - self.queries[query_factory(QUERY_NAME_AUTOVACUUM)] = METRICS[QUERY_NAME_AUTOVACUUM] - - self.queries[query_factory(QUERY_NAME_FORCED_AUTOVACUUM)] = METRICS[QUERY_NAME_FORCED_AUTOVACUUM] - self.queries[query_factory(QUERY_NAME_TX_WRAPAROUND)] = METRICS[QUERY_NAME_TX_WRAPAROUND] - - if self.server_version >= 100000: - self.queries[query_factory(QUERY_NAME_STANDBY_LAG)] = METRICS[QUERY_NAME_STANDBY_LAG] - - def create_dynamic_charts(self): - for database_name in self.databases[::-1]: - dim = [ - database_name + '_size', - database_name, - 'absolute', - 1, - 1024 * 1024, - ] - self.definitions['database_size']['lines'].append(dim) - for chart_name in [name for name in self.order if name.startswith('db_stat')]: - add_database_stat_chart( - order=self.order, - definitions=self.definitions, - name=chart_name, - database_name=database_name, - ) - add_database_lock_chart( - order=self.order, - definitions=self.definitions, - database_name=database_name, - ) - - for application_name in self.secondaries[::-1]: - add_replication_standby_chart( - order=self.order, - definitions=self.definitions, - name='standby_delta', - application_name=application_name, - chart_family='replication delta', - ) - add_replication_standby_chart( - order=self.order, - definitions=self.definitions, - name='standby_lag', - application_name=application_name, - chart_family='replication lag', - ) - - for slot_name in self.replication_slots[::-1]: - add_replication_slot_chart( - order=self.order, - definitions=self.definitions, - name='replication_slot', - slot_name=slot_name, - ) - - -def discover(cursor, query): - cursor.execute(query) - result = list() - for v in [value[0] for value in cursor]: - if v not in result: - result.append(v) - return result - - -def check_if_superuser(cursor, query): - cursor.execute(query) - return cursor.fetchone()[0] - - -def detect_server_version(cursor, query): - cursor.execute(query) - return int(cursor.fetchone()[0]) - - -def zero_lock_types(databases): - result = dict() - for database in databases: - for lock_type in METRICS['LOCKS']: - key = '_'.join([database, lock_type]) - result[key] = 0 - - return result - - -def hide_password(config): - return dict((k, v if k != 'password' or not v else '*****') for k, v in config.items()) - - -def add_database_lock_chart(order, definitions, database_name): - def create_lines(database): - result = list() - for lock_type in METRICS['LOCKS']: - dimension_id = '_'.join([database, lock_type]) - result.append([dimension_id, lock_type, 'absolute']) - return result - - chart_name = database_name + '_locks' - order.insert(-1, chart_name) - definitions[chart_name] = { - 'options': - [None, 'Locks on db: ' + database_name, 'locks', 'db ' + database_name, 'postgres.db_locks', 'line'], - 'lines': create_lines(database_name) - } - - -def add_database_stat_chart(order, definitions, name, database_name): - def create_lines(database, lines): - result = list() - for line in lines: - new_line = ['_'.join([database, line[0]])] + line[1:] - result.append(new_line) - return result - - chart_template = CHARTS[name] - chart_name = '_'.join([database_name, name]) - order.insert(0, chart_name) - name, title, units, _, context, chart_type = chart_template['options'] - definitions[chart_name] = { - 'options': [name, title + ': ' + database_name, units, 'db ' + database_name, context, chart_type], - 'lines': create_lines(database_name, chart_template['lines'])} - - -def add_replication_standby_chart(order, definitions, name, application_name, chart_family): - def create_lines(standby, lines): - result = list() - for line in lines: - new_line = ['_'.join([standby, line[0]])] + line[1:] - result.append(new_line) - return result - - chart_template = CHARTS[name] - chart_name = '_'.join([application_name, name]) - position = order.index('database_size') - order.insert(position, chart_name) - name, title, units, _, context, chart_type = chart_template['options'] - definitions[chart_name] = { - 'options': [name, title + ': ' + application_name, units, chart_family, context, chart_type], - 'lines': create_lines(application_name, chart_template['lines'])} - - -def add_replication_slot_chart(order, definitions, name, slot_name): - def create_lines(slot, lines): - result = list() - for line in lines: - new_line = ['_'.join([slot, line[0]])] + line[1:] - result.append(new_line) - return result - - chart_template = CHARTS[name] - chart_name = '_'.join([slot_name, name]) - position = order.index('database_size') - order.insert(position, chart_name) - name, title, units, _, context, chart_type = chart_template['options'] - definitions[chart_name] = { - 'options': [name, title + ': ' + slot_name, units, 'replication slot files', context, chart_type], - 'lines': create_lines(slot_name, chart_template['lines'])} diff --git a/collectors/python.d.plugin/postgres/postgres.conf b/collectors/python.d.plugin/postgres/postgres.conf deleted file mode 100644 index 7e354d99b..000000000 --- a/collectors/python.d.plugin/postgres/postgres.conf +++ /dev/null @@ -1,134 +0,0 @@ -# netdata python.d.plugin configuration for postgresql -# -# This file is in YaML format. Generally the format is: -# -# name: value -# -# There are 2 sections: -# - global variables -# - one or more JOBS -# -# JOBS allow you to collect values from multiple sources. -# Each source will have its own set of charts. -# -# JOB parameters have to be indented (using spaces only, example below). - -# ---------------------------------------------------------------------- -# Global Variables -# These variables set the defaults for all JOBs, however each JOB -# may define its own, overriding the defaults. - -# update_every sets the default data collection frequency. -# If unset, the python.d.plugin default is used. -# update_every: 1 - -# priority controls the order of charts at the netdata dashboard. -# Lower numbers move the charts towards the top of the page. -# If unset, the default for python.d.plugin is used. -# priority: 60000 - -# penalty indicates whether to apply penalty to update_every in case of failures. -# Penalty will increase every 5 failed updates in a row. Maximum penalty is 10 minutes. -# penalty: yes - -# autodetection_retry sets the job re-check interval in seconds. -# The job is not deleted if check fails. -# Attempts to start the job are made once every autodetection_retry. -# This feature is disabled by default. -# autodetection_retry: 0 - -# ---------------------------------------------------------------------- -# JOBS (data collection sources) -# -# The default JOBS share the same *name*. JOBS with the same name -# are mutually exclusive. Only one of them will be allowed running at -# any time. This allows autodetection to try several alternatives and -# pick the one that works. -# -# Any number of jobs is supported. -# -# All python.d.plugin JOBS (for all its modules) support a set of -# predefined parameters. These are: -# -# job_name: -# name: myname # the JOB's name as it will appear at the -# # dashboard (by default is the job_name) -# # JOBs sharing a name are mutually exclusive -# update_every: 1 # the JOB's data collection frequency -# priority: 60000 # the JOB's order on the dashboard -# penalty: yes # the JOB's penalty -# autodetection_retry: 0 # the JOB's re-check interval in seconds -# -# A single connection is required in order to pull statistics. -# -# Connections can be configured with the following options: -# -# dsn : 'connection URI' # see https://www.postgresql.org/docs/current/libpq-connect.html#LIBPQ-CONNSTRING -# -# OR -# -# database : 'example_db_name' -# user : 'example_user' -# password : 'example_pass' -# host : 'localhost' -# port : 5432 -# connect_timeout : 2 # in seconds, default is 2 -# statement_timeout : 2000 # in ms, default is 2000 -# sslmode : mode # one of [disable, allow, prefer, require, verify-ca, verify-full] -# sslrootcert : path/to/rootcert # the location of the root certificate file -# sslcrl : path/to/crl # the location of the CRL file -# sslcert : path/to/cert # the location of the client certificate file -# sslkey : path/to/key # the location of the client key file -# -# SSL connection parameters description: https://www.postgresql.org/docs/current/libpq-ssl.html -# -# Additionally, the following options allow selective disabling of charts -# -# table_stats : false -# index_stats : false -# database_poll : 'dbase_name1 dbase_name2' # poll only specified databases (all other will be excluded from charts) -# -# Postgres permissions are configured at its pg_hba.conf file. You can -# "trust" local clients to allow netdata to connect, or you can create -# a postgres user for netdata and add its password below to allow -# netdata connect. -# -# Please note that when running Postgres from inside the container, -# the client (Netdata) is not considered local, unless it runs from inside -# the same container. -# -# Superuser access is needed for these charts: -# Write-Ahead Logs -# Archive Write-Ahead Logs -# -# Autovacuum charts is allowed since Postgres 9.4 -# ---------------------------------------------------------------------- - -socket: - name : 'local' - user : 'postgres' - database : 'postgres' - -tcp: - name : 'local' - database : 'postgres' - user : 'postgres' - password : 'postgres' - host : 'localhost' - port : 5432 - -tcpipv4: - name : 'local' - database : 'postgres' - user : 'postgres' - password : 'postgres' - host : '127.0.0.1' - port : 5432 - -tcpipv6: - name : 'local' - database : 'postgres' - user : 'postgres' - password : 'postgres' - host : '::1' - port : 5432 diff --git a/collectors/python.d.plugin/python.d.conf b/collectors/python.d.plugin/python.d.conf index 72e20fcd3..7b43ee205 100644 --- a/collectors/python.d.plugin/python.d.conf +++ b/collectors/python.d.plugin/python.d.conf @@ -56,14 +56,13 @@ logind: no # memcached: yes # mongodb: yes # monit: yes -# nginx_plus: yes # nvidia_smi: yes # nsd: yes # ntpd: yes # openldap: yes # oracledb: yes +# pandas: yes # postfix: yes -# postgres: yes # proxysql: yes # puppet: yes # rabbitmq: yes diff --git a/collectors/python.d.plugin/python.d.plugin.in b/collectors/python.d.plugin/python.d.plugin.in index c04cb3ff0..681ceb403 100644 --- a/collectors/python.d.plugin/python.d.plugin.in +++ b/collectors/python.d.plugin/python.d.plugin.in @@ -131,7 +131,7 @@ def dirs(): DIRS = dirs() -IS_ATTY = sys.stdout.isatty() +IS_ATTY = sys.stdout.isatty() or sys.stderr.isatty() MODULE_SUFFIX = '.chart.py' @@ -496,7 +496,16 @@ class FileLockRegistry: self.path = path self.locks = dict() + @staticmethod + def rename(name): + # go version name is 'docker' + if name.startswith("dockerd"): + name = "docker" + name[7:] + return name + + def register(self, name): + name = self.rename(name) if name in self.locks: return file = os.path.join(self.path, '{0}.collector.lock'.format(name)) @@ -505,6 +514,7 @@ class FileLockRegistry: self.locks[name] = lock def unregister(self, name): + name = self.rename(name) if name not in self.locks: return lock = self.locks[name] @@ -893,6 +903,11 @@ def main(): registry, ) + # cheap attempt to reduce chance of python.d job running before go.d + # TODO: better implementation needed + if not IS_ATTY: + time.sleep(1.5) + try: if not p.setup(): return diff --git a/collectors/python.d.plugin/python_modules/bases/FrameworkServices/SimpleService.py b/collectors/python.d.plugin/python_modules/bases/FrameworkServices/SimpleService.py index ed1b2e669..a7acc23b6 100644 --- a/collectors/python.d.plugin/python_modules/bases/FrameworkServices/SimpleService.py +++ b/collectors/python.d.plugin/python_modules/bases/FrameworkServices/SimpleService.py @@ -4,14 +4,13 @@ # Author: Ilya Mashchenko (ilyam8) # SPDX-License-Identifier: GPL-3.0-or-later - -from time import sleep, time - -from third_party.monotonic import monotonic +import os from bases.charts import Charts, ChartError, create_runtime_chart from bases.collection import safe_print from bases.loggers import PythonDLimitedLogger +from third_party.monotonic import monotonic +from time import sleep, time RUNTIME_CHART_UPDATE = 'BEGIN netdata.runtime_{job_name} {since_last}\n' \ 'SET run_time = {elapsed}\n' \ @@ -20,6 +19,8 @@ RUNTIME_CHART_UPDATE = 'BEGIN netdata.runtime_{job_name} {since_last}\n' \ PENALTY_EVERY = 5 MAX_PENALTY = 10 * 60 # 10 minutes +ND_INTERNAL_MONITORING_DISABLED = os.getenv("NETDATA_INTERNALS_MONITORING") == "NO" + class RuntimeCounters: def __init__(self, configuration): @@ -79,11 +80,13 @@ class SimpleService(PythonDLimitedLogger, object): self.module_name = clean_module_name(self.__module__) self.job_name = configuration.pop('job_name') + self.actual_job_name = self.job_name or self.module_name self.override_name = configuration.pop('override_name') self.fake_name = None self._runtime_counters = RuntimeCounters(configuration=configuration) self.charts = Charts(job_name=self.actual_name, + actual_job_name=self.actual_job_name, priority=configuration.pop('priority'), cleanup=configuration.pop('chart_cleanup'), get_update_every=self.get_update_every, @@ -208,9 +211,10 @@ class SimpleService(PythonDLimitedLogger, object): job.elapsed = int((monotonic() - job.start_mono) * 1e3) job.prev_update = job.start_real job.retries, job.penalty = 0, 0 - safe_print(RUNTIME_CHART_UPDATE.format(job_name=self.name, - since_last=since, - elapsed=job.elapsed)) + if not ND_INTERNAL_MONITORING_DISABLED: + safe_print(RUNTIME_CHART_UPDATE.format(job_name=self.name, + since_last=since, + elapsed=job.elapsed)) self.debug('update => [{status}] (elapsed time: {elapsed}, failed retries in a row: {retries})'.format( status='OK' if updated else 'FAILED', elapsed=job.elapsed if updated else '-', diff --git a/collectors/python.d.plugin/python_modules/bases/charts.py b/collectors/python.d.plugin/python_modules/bases/charts.py index 54986a937..203ad1672 100644 --- a/collectors/python.d.plugin/python_modules/bases/charts.py +++ b/collectors/python.d.plugin/python_modules/bases/charts.py @@ -3,6 +3,8 @@ # Author: Ilya Mashchenko (ilyam8) # SPDX-License-Identifier: GPL-3.0-or-later +import os + from bases.collection import safe_print CHART_PARAMS = ['type', 'id', 'name', 'title', 'units', 'family', 'context', 'chart_type', 'hidden'] @@ -18,15 +20,24 @@ CHART_CREATE = "CHART {type}.{id} '{name}' '{title}' '{units}' '{family}' '{cont CHART_OBSOLETE = "CHART {type}.{id} '{name}' '{title}' '{units}' '{family}' '{context}' " \ "{chart_type} {priority} {update_every} '{hidden} obsolete'\n" +CLABEL_COLLECT_JOB = "CLABEL '_collect_job' '{actual_job_name}' '0'\n" +CLABEL_COMMIT = "CLABEL_COMMIT\n" + DIMENSION_CREATE = "DIMENSION '{id}' '{name}' {algorithm} {multiplier} {divisor} '{hidden} {obsolete}'\n" DIMENSION_SET = "SET '{id}' = {value}\n" CHART_VARIABLE_SET = "VARIABLE CHART '{id}' = {value}\n" +# 1 is label source auto +# https://github.com/netdata/netdata/blob/cc2586de697702f86a3c34e60e23652dd4ddcb42/database/rrd.h#L205 RUNTIME_CHART_CREATE = "CHART netdata.runtime_{job_name} '' 'Execution time' 'ms' 'python.d' " \ "netdata.pythond_runtime line 145000 {update_every} '' 'python.d.plugin' '{module_name}'\n" \ + "CLABEL '_collect_job' '{actual_job_name}' '1'\n" \ + "CLABEL_COMMIT\n" \ "DIMENSION run_time 'run time' absolute 1 1\n" +ND_INTERNAL_MONITORING_DISABLED = os.getenv("NETDATA_INTERNALS_MONITORING") == "NO" + def create_runtime_chart(func): """ @@ -42,12 +53,14 @@ def create_runtime_chart(func): def wrapper(*args, **kwargs): self = args[0] - chart = RUNTIME_CHART_CREATE.format( - job_name=self.name, - update_every=self._runtime_counters.update_every, - module_name=self.module_name, - ) - safe_print(chart) + if not ND_INTERNAL_MONITORING_DISABLED: + chart = RUNTIME_CHART_CREATE.format( + job_name=self.name, + actual_job_name=self.actual_job_name, + update_every=self._runtime_counters.update_every, + module_name=self.module_name, + ) + safe_print(chart) ok = func(*args, **kwargs) return ok @@ -77,13 +90,14 @@ class Charts: Chart is a instance of Chart class. Charts adding must be done using Charts.add_chart() method only""" - def __init__(self, job_name, priority, cleanup, get_update_every, module_name): + def __init__(self, job_name, actual_job_name, priority, cleanup, get_update_every, module_name): """ :param job_name: <bound method> :param priority: <int> :param get_update_every: <bound method> """ self.job_name = job_name + self.actual_job_name = actual_job_name self.priority = priority self.cleanup = cleanup self.get_update_every = get_update_every @@ -131,6 +145,7 @@ class Charts: new_chart.params['update_every'] = self.get_update_every() new_chart.params['priority'] = self.priority new_chart.params['module_name'] = self.module_name + new_chart.params['actual_job_name'] = self.actual_job_name self.priority += 1 self.charts[new_chart.id] = new_chart @@ -230,13 +245,14 @@ class Chart: :return: """ chart = CHART_CREATE.format(**self.params) + labels = CLABEL_COLLECT_JOB.format(**self.params) + CLABEL_COMMIT dimensions = ''.join([dimension.create() for dimension in self.dimensions]) variables = ''.join([var.set(var.value) for var in self.variables if var]) self.flags.push = False self.flags.created = True - safe_print(chart + dimensions + variables) + safe_print(chart + labels + dimensions + variables) def can_be_updated(self, data): for dim in self.dimensions: diff --git a/collectors/python.d.plugin/rabbitmq/README.md b/collectors/python.d.plugin/rabbitmq/README.md index 607e32c7f..927adcc68 100644 --- a/collectors/python.d.plugin/rabbitmq/README.md +++ b/collectors/python.d.plugin/rabbitmq/README.md @@ -113,4 +113,26 @@ socket: --- +### Per-Queue Chart configuration +RabbitMQ users with the "monitoring" tag cannot see all queue data. You'll need a user with read permissions. +To create a dedicated user for netdata: + +```bash +rabbitmqctl add_user netdata ChangeThisSuperSecretPassword +rabbitmqctl set_permissions netdata "^$" "^$" ".*" +``` + +See [set_permissions](https://www.rabbitmq.com/rabbitmqctl.8.html#set_permissions) for details. + +Once the user is set up, add `collect_queues_metrics: yes` to your `rabbitmq.conf`: + +```yaml +local: + name : 'local' + host : '127.0.0.1' + port : 15672 + user : 'netdata' + pass : 'ChangeThisSuperSecretPassword' + collect_queues_metrics : 'yes' +``` diff --git a/collectors/python.d.plugin/sensors/README.md b/collectors/python.d.plugin/sensors/README.md index 149589317..e791195d4 100644 --- a/collectors/python.d.plugin/sensors/README.md +++ b/collectors/python.d.plugin/sensors/README.md @@ -26,6 +26,8 @@ There have been reports from users that on certain servers, ACPI ring buffer err We are tracking such cases in issue [#827](https://github.com/netdata/netdata/issues/827). Please join this discussion for help. +When `lm-sensors` doesn't work on your device (e.g. for RPi temperatures), use [the legacy bash collector](https://learn.netdata.cloud/docs/agent/collectors/charts.d.plugin/sensors) + --- diff --git a/collectors/python.d.plugin/sensors/sensors.chart.py b/collectors/python.d.plugin/sensors/sensors.chart.py index f089e147a..701bf6414 100644 --- a/collectors/python.d.plugin/sensors/sensors.chart.py +++ b/collectors/python.d.plugin/sensors/sensors.chart.py @@ -3,6 +3,8 @@ # Author: Pawel Krupa (paulfantom) # SPDX-License-Identifier: GPL-3.0-or-later +from collections import defaultdict + from bases.FrameworkServices.SimpleService import SimpleService from third_party import lm_sensors as sensors @@ -77,11 +79,11 @@ TYPE_MAP = { 4: 'energy', 5: 'current', 6: 'humidity', - 7: 'max_main', - 16: 'vid', - 17: 'intrusion', - 18: 'max_other', - 24: 'beep_enable' + # 7: 'max_main', + # 16: 'vid', + # 17: 'intrusion', + # 18: 'max_other', + # 24: 'beep_enable' } @@ -91,64 +93,73 @@ class Service(SimpleService): self.order = list() self.definitions = dict() self.chips = configuration.get('chips') + self.priority = 60000 def get_data(self): - data = dict() + seen, data = dict(), dict() try: for chip in sensors.ChipIterator(): - prefix = sensors.chip_snprintf_name(chip) - for feature in sensors.FeatureIterator(chip): - sfi = sensors.SubFeatureIterator(chip, feature) - val = None - for sf in sfi: - try: - val = sensors.get_value(chip, sf.number) - break - except sensors.SensorsError: - continue - if val is None: + chip_name = sensors.chip_snprintf_name(chip) + seen[chip_name] = defaultdict(list) + + for feat in sensors.FeatureIterator(chip): + if feat.type not in TYPE_MAP: + continue + + feat_type = TYPE_MAP[feat.type] + feat_name = str(feat.name.decode()) + feat_label = sensors.get_label(chip, feat) + feat_limits = LIMITS.get(feat_type) + sub_feat = next(sensors.SubFeatureIterator(chip, feat)) # current value + + if not sub_feat: + continue + + try: + v = sensors.get_value(chip, sub_feat.number) + except sensors.SensorsError: + continue + + if v is None: + continue + + seen[chip_name][feat_type].append((feat_name, feat_label)) + + if feat_limits and (v < feat_limits[0] or v > feat_limits[1]): continue - type_name = TYPE_MAP[feature.type] - if type_name in LIMITS: - limit = LIMITS[type_name] - if val < limit[0] or val > limit[1]: - continue - data[prefix + '_' + str(feature.name.decode())] = int(val * 1000) + + data[chip_name + '_' + feat_name] = int(v * 1000) + except sensors.SensorsError as error: self.error(error) return None + self.update_sensors_charts(seen) + return data or None - def create_definitions(self): - for sensor in ORDER: - for chip in sensors.ChipIterator(): - chip_name = sensors.chip_snprintf_name(chip) - if self.chips and not any([chip_name.startswith(ex) for ex in self.chips]): + def update_sensors_charts(self, seen): + for chip_name, feat in seen.items(): + if self.chips and not any([chip_name.startswith(ex) for ex in self.chips]): + continue + + for feat_type, sub_feat in feat.items(): + if feat_type not in ORDER or feat_type not in CHARTS: + continue + + chart_id = '{}_{}'.format(chip_name, feat_type) + if chart_id in self.charts: continue - for feature in sensors.FeatureIterator(chip): - sfi = sensors.SubFeatureIterator(chip, feature) - vals = list() - for sf in sfi: - try: - vals.append(sensors.get_value(chip, sf.number)) - except sensors.SensorsError as error: - self.error('{0}: {1}'.format(sf.name, error)) - continue - if not vals or (vals[0] == 0 and feature.type != 1): - continue - if TYPE_MAP[feature.type] == sensor: - # create chart - name = chip_name + '_' + TYPE_MAP[feature.type] - if name not in self.order: - self.order.append(name) - chart_def = list(CHARTS[sensor]['options']) - self.definitions[name] = {'options': chart_def} - self.definitions[name]['lines'] = [] - line = list(CHARTS[sensor]['lines'][0]) - line[0] = chip_name + '_' + str(feature.name.decode()) - line[1] = sensors.get_label(chip, feature) - self.definitions[name]['lines'].append(line) + + params = [chart_id] + list(CHARTS[feat_type]['options']) + new_chart = self.charts.add_chart(params) + new_chart.params['priority'] = self.get_chart_priority(feat_type) + + for name, label in sub_feat: + lines = list(CHARTS[feat_type]['lines'][0]) + lines[0] = chip_name + '_' + name + lines[1] = label + new_chart.add_dimension(lines) def check(self): try: @@ -157,6 +168,12 @@ class Service(SimpleService): self.error(error) return False - self.create_definitions() + self.priority = self.charts.priority + + return bool(self.get_data() and self.charts) - return bool(self.get_data()) + def get_chart_priority(self, feat_type): + for i, v in enumerate(ORDER): + if v == feat_type: + return self.priority + i + return self.priority diff --git a/collectors/python.d.plugin/tor/README.md b/collectors/python.d.plugin/tor/README.md index 3e7b8997a..b57d77c08 100644 --- a/collectors/python.d.plugin/tor/README.md +++ b/collectors/python.d.plugin/tor/README.md @@ -41,10 +41,12 @@ priority : 60000 local_tcp: name: 'local' control_port: 9051 + password: <password> # if required local_socket: name: 'local' control_port: '/var/run/tor/control' + password: <password> # if required ``` ### prerequisite diff --git a/collectors/python.d.plugin/tor/tor.conf b/collectors/python.d.plugin/tor/tor.conf index 91b517a62..bf09b21fe 100644 --- a/collectors/python.d.plugin/tor/tor.conf +++ b/collectors/python.d.plugin/tor/tor.conf @@ -71,7 +71,9 @@ # local_tcp: # name: 'local' # control_port: 9051 +# password: <password> # # local_socket: # name: 'local' # control_port: '/var/run/tor/control' +# password: <password> |