
diff options
Diffstat (limited to 'collectors/python.d.plugin')
102 files changed, 9034 insertions, 4307 deletions
diff --git a/collectors/python.d.plugin/adaptec_raid/README.md b/collectors/python.d.plugin/adaptec_raid/README.md index 41d5b62e0..97a103eb9 100644..120000 --- a/collectors/python.d.plugin/adaptec_raid/README.md +++ b/collectors/python.d.plugin/adaptec_raid/README.md @@ -1,103 +1 @@ -<!-- -title: "Adaptec RAID controller monitoring with Netdata" -custom_edit_url: "https://github.com/netdata/netdata/edit/master/collectors/python.d.plugin/adaptec_raid/README.md" -sidebar_label: "Adaptec RAID" -learn_status: "Published" -learn_topic_type: "References" -learn_rel_path: "Integrations/Monitor/Hardware" ---> - -# Adaptec RAID controller collector - -Collects logical and physical devices metrics using `arcconf` command-line utility. - -Executed commands: - -- `sudo -n arcconf GETCONFIG 1 LD` -- `sudo -n arcconf GETCONFIG 1 PD` - -## Requirements - -The module uses `arcconf`, which can only be executed by `root`. It uses -`sudo` and assumes that it is configured such that the `netdata` user can execute `arcconf` as root without a password. - -- Add to your `/etc/sudoers` file: - -`which arcconf` shows the full path to the binary. - -```bash -netdata ALL=(root) NOPASSWD: /path/to/arcconf -``` - -- Reset Netdata's systemd - unit [CapabilityBoundingSet](https://www.freedesktop.org/software/systemd/man/systemd.exec.html#Capabilities) (Linux - distributions with systemd) - -The default CapabilityBoundingSet doesn't allow using `sudo`, and is quite strict in general. Resetting is not optimal, but a next-best solution given the inability to execute `arcconf` using `sudo`. - - -As the `root` user, do the following: - -```cmd -mkdir /etc/systemd/system/netdata.service.d -echo -e '[Service]\nCapabilityBoundingSet=~' | tee /etc/systemd/system/netdata.service.d/unset-capability-bounding-set.conf -systemctl daemon-reload -systemctl restart netdata.service -``` - -## Charts - -- Logical Device Status -- Physical Device State -- Physical Device S.M.A.R.T warnings -- Physical Device Temperature - -## Enable the collector - -The `adaptec_raid` collector is disabled by default. To enable it, use `edit-config` from the -Netdata [config directory](https://github.com/netdata/netdata/blob/master/docs/configure/nodes.md), which is typically at `/etc/netdata`, to edit the `python.d.conf` -file. - -```bash -cd /etc/netdata # Replace this path with your Netdata config directory, if different -sudo ./edit-config python.d.conf -``` - -Change the value of the `adaptec_raid` setting to `yes`. Save the file and restart the Netdata Agent with `sudo -systemctl restart netdata`, or the [appropriate method](https://github.com/netdata/netdata/blob/master/docs/configure/start-stop-restart.md) for your system. - -## Configuration - -Edit the `python.d/adaptec_raid.conf` configuration file using `edit-config` from the -Netdata [config directory](https://github.com/netdata/netdata/blob/master/docs/configure/nodes.md), which is typically at `/etc/netdata`. - -```bash -cd /etc/netdata # Replace this path with your Netdata config directory, if different -sudo ./edit-config python.d/adaptec_raid.conf -``` - -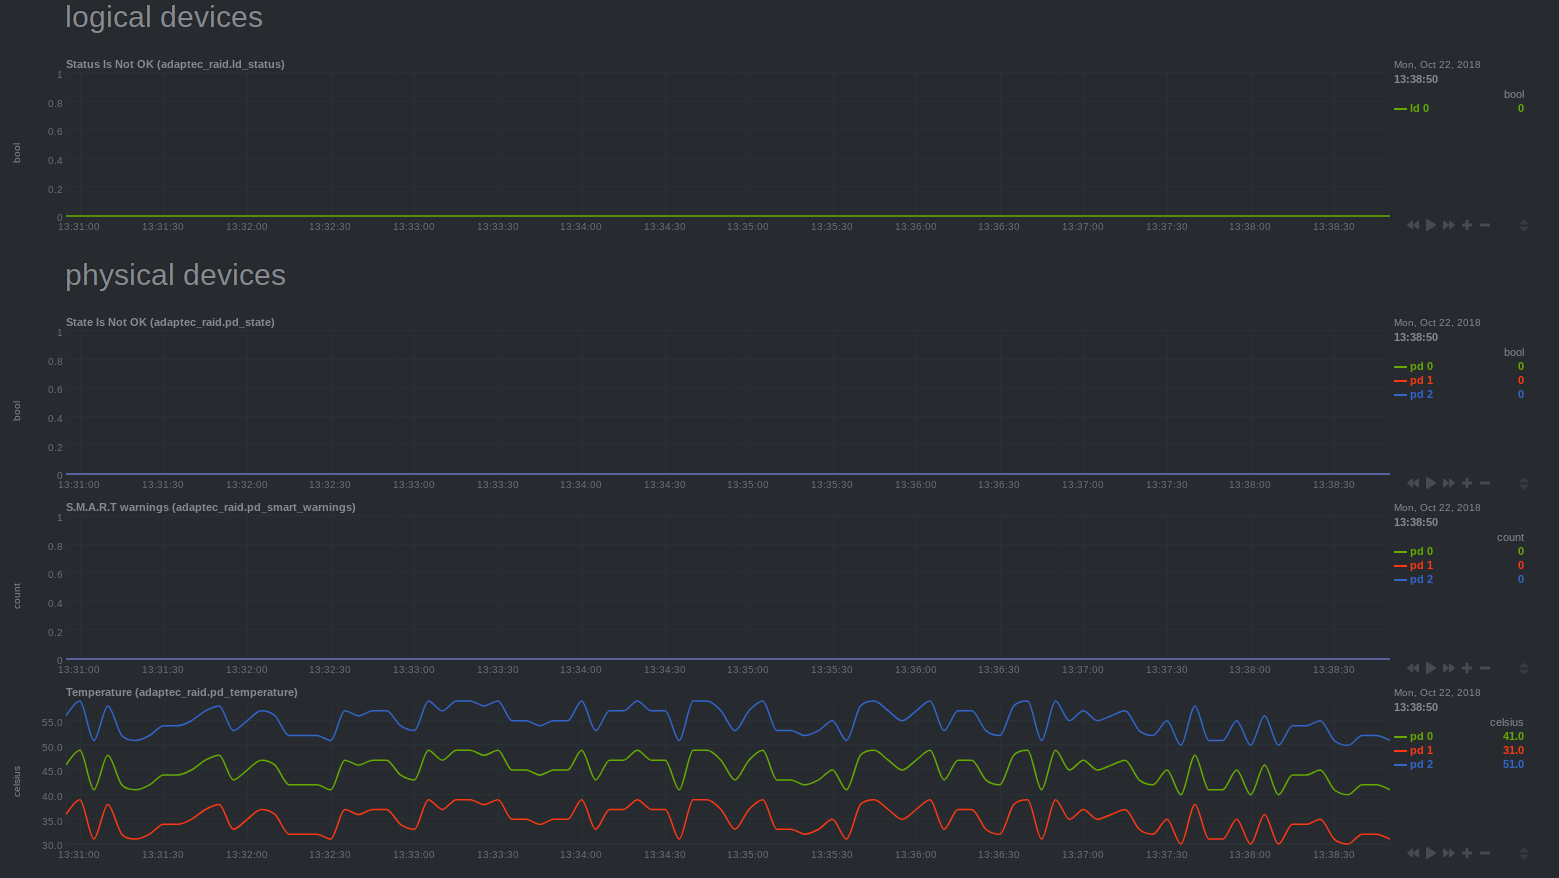 - - - - -### Troubleshooting - -To troubleshoot issues with the `adaptec_raid` module, run the `python.d.plugin` with the debug option enabled. The -output will give you the output of the data collection job or error messages on why the collector isn't working. - -First, navigate to your plugins directory, usually they are located under `/usr/libexec/netdata/plugins.d/`. If that's -not the case on your system, open `netdata.conf` and look for the setting `plugins directory`. Once you're in the -plugin's directory, switch to the `netdata` user. - -```bash -cd /usr/libexec/netdata/plugins.d/ -sudo su -s /bin/bash netdata -``` - -Now you can manually run the `adaptec_raid` module in debug mode: - -```bash -./python.d.plugin adaptec_raid debug trace -``` - +integrations/adaptecraid.md
\ No newline at end of file diff --git a/collectors/python.d.plugin/adaptec_raid/integrations/adaptecraid.md b/collectors/python.d.plugin/adaptec_raid/integrations/adaptecraid.md new file mode 100644 index 000000000..59e359d0d --- /dev/null +++ b/collectors/python.d.plugin/adaptec_raid/integrations/adaptecraid.md @@ -0,0 +1,203 @@ +<!--startmeta +custom_edit_url: "https://github.com/netdata/netdata/edit/master/collectors/python.d.plugin/adaptec_raid/README.md" +meta_yaml: "https://github.com/netdata/netdata/edit/master/collectors/python.d.plugin/adaptec_raid/metadata.yaml" +sidebar_label: "AdaptecRAID" +learn_status: "Published" +learn_rel_path: "Data Collection/Storage, Mount Points and Filesystems" +message: "DO NOT EDIT THIS FILE DIRECTLY, IT IS GENERATED BY THE COLLECTOR'S metadata.yaml FILE" +endmeta--> + +# AdaptecRAID + + +<img src="https://netdata.cloud/img/adaptec.svg" width="150"/> + + +Plugin: python.d.plugin +Module: adaptec_raid + +<img src="https://img.shields.io/badge/maintained%20by-Netdata-%2300ab44" /> + +## Overview + +This collector monitors Adaptec RAID hardware storage controller metrics about both physical and logical drives. + + +It uses the arcconf command line utility (from adaptec) to monitor your raid controller. + +Executed commands: + - `sudo -n arcconf GETCONFIG 1 LD` + - `sudo -n arcconf GETCONFIG 1 PD` + + +This collector is supported on all platforms. + +This collector only supports collecting metrics from a single instance of this integration. + +The module uses arcconf, which can only be executed by root. It uses sudo and assumes that it is configured such that the netdata user can execute arcconf as root without a password. + +### Default Behavior + +#### Auto-Detection + +After all the permissions are satisfied, netdata should be to execute commands via the arcconf command line utility + +#### Limits + +The default configuration for this integration does not impose any limits on data collection. + +#### Performance Impact + +The default configuration for this integration is not expected to impose a significant performance impact on the system. + + +## Metrics + +Metrics grouped by *scope*. + +The scope defines the instance that the metric belongs to. An instance is uniquely identified by a set of labels. + + + +### Per AdaptecRAID instance + +These metrics refer to the entire monitored application. + +This scope has no labels. + +Metrics: + +| Metric | Dimensions | Unit | +|:------|:----------|:----| +| adaptec_raid.ld_status | a dimension per logical device | bool | +| adaptec_raid.pd_state | a dimension per physical device | bool | +| adaptec_raid.smart_warnings | a dimension per physical device | count | +| adaptec_raid.temperature | a dimension per physical device | celsius | + + + +## Alerts + + +The following alerts are available: + +| Alert name | On metric | Description | +|:------------|:----------|:------------| +| [ adaptec_raid_ld_status ](https://github.com/netdata/netdata/blob/master/health/health.d/adaptec_raid.conf) | adaptec_raid.ld_status | logical device status is failed or degraded | +| [ adaptec_raid_pd_state ](https://github.com/netdata/netdata/blob/master/health/health.d/adaptec_raid.conf) | adaptec_raid.pd_state | physical device state is not online | + + +## Setup + +### Prerequisites + +#### Grant permissions for netdata, to run arcconf as sudoer + +The module uses arcconf, which can only be executed by root. It uses sudo and assumes that it is configured such that the netdata user can execute arcconf as root without a password. + +Add to your /etc/sudoers file: +which arcconf shows the full path to the binary. + +```bash +netdata ALL=(root) NOPASSWD: /path/to/arcconf +``` + + +#### Reset Netdata's systemd unit CapabilityBoundingSet (Linux distributions with systemd) + +The default CapabilityBoundingSet doesn't allow using sudo, and is quite strict in general. Resetting is not optimal, but a next-best solution given the inability to execute arcconf using sudo. + +As root user, do the following: + +```bash +mkdir /etc/systemd/system/netdata.service.d +echo -e '[Service]\nCapabilityBoundingSet=~' | tee /etc/systemd/system/netdata.service.d/unset-capability-bounding-set.conf +systemctl daemon-reload +systemctl restart netdata.service +``` + + + +### Configuration + +#### File + +The configuration file name for this integration is `python.d/adaptec_raid.conf`. + + +You can edit the configuration file using the `edit-config` script from the +Netdata [config directory](https://github.com/netdata/netdata/blob/master/docs/configure/nodes.md#the-netdata-config-directory). + +```bash +cd /etc/netdata 2>/dev/null || cd /opt/netdata/etc/netdata +sudo ./edit-config python.d/adaptec_raid.conf +``` +#### Options + +There are 2 sections: + +* Global variables +* One or more JOBS that can define multiple different instances to monitor. + +The following options can be defined globally: priority, penalty, autodetection_retry, update_every, but can also be defined per JOB to override the global values. + +Additionally, the following collapsed table contains all the options that can be configured inside a JOB definition. + +Every configuration JOB starts with a `job_name` value which will appear in the dashboard, unless a `name` parameter is specified. + + +<details><summary>Config options</summary> + +| Name | Description | Default | Required | +|:----|:-----------|:-------|:--------:| +| update_every | Sets the default data collection frequency. | 5 | False | +| priority | Controls the order of charts at the netdata dashboard. | 60000 | False | +| autodetection_retry | Sets the job re-check interval in seconds. | 0 | False | +| penalty | Indicates whether to apply penalty to update_every in case of failures. | yes | False | + +</details> + +#### Examples + +##### Basic + +A basic example configuration per job + +```yaml +job_name: + name: my_job_name + update_every: 1 # the JOB's data collection frequency + priority: 60000 # the JOB's order on the dashboard + penalty: yes # the JOB's penalty + autodetection_retry: 0 # the JOB's re-check interval in seconds + +``` + + +## Troubleshooting + +### Debug Mode + +To troubleshoot issues with the `adaptec_raid` collector, run the `python.d.plugin` with the debug option enabled. The output +should give you clues as to why the collector isn't working. + +- Navigate to the `plugins.d` directory, usually at `/usr/libexec/netdata/plugins.d/`. If that's not the case on + your system, open `netdata.conf` and look for the `plugins` setting under `[directories]`. + + ```bash + cd /usr/libexec/netdata/plugins.d/ + ``` + +- Switch to the `netdata` user. + + ```bash + sudo -u netdata -s + ``` + +- Run the `python.d.plugin` to debug the collector: + + ```bash + ./python.d.plugin adaptec_raid debug trace + ``` + + diff --git a/collectors/python.d.plugin/adaptec_raid/metadata.yaml b/collectors/python.d.plugin/adaptec_raid/metadata.yaml index 7ee4ce7c2..c69baff4a 100644 --- a/collectors/python.d.plugin/adaptec_raid/metadata.yaml +++ b/collectors/python.d.plugin/adaptec_raid/metadata.yaml @@ -27,8 +27,8 @@ modules: It uses the arcconf command line utility (from adaptec) to monitor your raid controller. Executed commands: - - sudo -n arcconf GETCONFIG 1 LD - - sudo -n arcconf GETCONFIG 1 PD + - `sudo -n arcconf GETCONFIG 1 LD` + - `sudo -n arcconf GETCONFIG 1 PD` supported_platforms: include: [] exclude: [] diff --git a/collectors/python.d.plugin/alarms/README.md b/collectors/python.d.plugin/alarms/README.md index 0f956b291..85759ae6c 100644..120000 --- a/collectors/python.d.plugin/alarms/README.md +++ b/collectors/python.d.plugin/alarms/README.md @@ -1,89 +1 @@ -<!-- -title: "Alarms" -custom_edit_url: "https://github.com/netdata/netdata/edit/master/collectors/python.d.plugin/alarms/README.md" -sidebar_label: "Alarms" -learn_status: "Published" -learn_rel_path: "Integrations/Monitor/Netdata" ---> - -# Alarms - -This collector creates an 'Alarms' menu with one line plot showing alarm states over time. Alarm states are mapped to integer values according to the below default mapping. Any alarm status types not in this mapping will be ignored (Note: This mapping can be changed by editing the `status_map` in the `alarms.conf` file). If you would like to learn more about the different alarm statuses check out the docs [here](https://github.com/netdata/netdata/blob/master/health/REFERENCE.md#alarm-statuses). - -``` -{ - 'CLEAR': 0, - 'WARNING': 1, - 'CRITICAL': 2 -} -``` - -## Charts - -Below is an example of the chart produced when running `stress-ng --all 2` for a few minutes. You can see the various warning and critical alarms raised. - - - -## Configuration - -Enable the collector and [restart Netdata](https://github.com/netdata/netdata/blob/master/docs/configure/start-stop-restart.md). - -```bash -cd /etc/netdata/ -sudo ./edit-config python.d.conf -# Set `alarms: no` to `alarms: yes` -sudo systemctl restart netdata -``` - -If needed, edit the `python.d/alarms.conf` configuration file using `edit-config` from the your agent's [config -directory](https://github.com/netdata/netdata/blob/master/docs/configure/nodes.md), which is usually at `/etc/netdata`. - -```bash -cd /etc/netdata # Replace this path with your Netdata config directory, if different -sudo ./edit-config python.d/alarms.conf -``` - -The `alarms` specific part of the `alarms.conf` file should look like this: - -```yaml -# what url to pull data from -local: - url: 'http://127.0.0.1:19999/api/v1/alarms?all' - # define how to map alarm status to numbers for the chart - status_map: - CLEAR: 0 - WARNING: 1 - CRITICAL: 2 - # set to true to include a chart with calculated alarm values over time - collect_alarm_values: false - # define the type of chart for plotting status over time e.g. 'line' or 'stacked' - alarm_status_chart_type: 'line' - # a "," separated list of words you want to filter alarm names for. For example 'cpu,load' would filter for only - # alarms with "cpu" or "load" in alarm name. Default includes all. - alarm_contains_words: '' - # a "," separated list of words you want to exclude based on alarm name. For example 'cpu,load' would exclude - # all alarms with "cpu" or "load" in alarm name. Default excludes None. - alarm_excludes_words: '' -``` - -It will default to pulling all alarms at each time step from the Netdata rest api at `http://127.0.0.1:19999/api/v1/alarms?all` -### Troubleshooting - -To troubleshoot issues with the `alarms` module, run the `python.d.plugin` with the debug option enabled. The -output will give you the output of the data collection job or error messages on why the collector isn't working. - -First, navigate to your plugins directory, usually they are located under `/usr/libexec/netdata/plugins.d/`. If that's -not the case on your system, open `netdata.conf` and look for the setting `plugins directory`. Once you're in the -plugin's directory, switch to the `netdata` user. - -```bash -cd /usr/libexec/netdata/plugins.d/ -sudo su -s /bin/bash netdata -``` - -Now you can manually run the `alarms` module in debug mode: - -```bash -./python.d.plugin alarms debug trace -``` - +integrations/netdata_agent_alarms.md
\ No newline at end of file diff --git a/collectors/python.d.plugin/alarms/integrations/netdata_agent_alarms.md b/collectors/python.d.plugin/alarms/integrations/netdata_agent_alarms.md new file mode 100644 index 000000000..95e4a4a3b --- /dev/null +++ b/collectors/python.d.plugin/alarms/integrations/netdata_agent_alarms.md @@ -0,0 +1,200 @@ +<!--startmeta +custom_edit_url: "https://github.com/netdata/netdata/edit/master/collectors/python.d.plugin/alarms/README.md" +meta_yaml: "https://github.com/netdata/netdata/edit/master/collectors/python.d.plugin/alarms/metadata.yaml" +sidebar_label: "Netdata Agent alarms" +learn_status: "Published" +learn_rel_path: "Data Collection/Other" +message: "DO NOT EDIT THIS FILE DIRECTLY, IT IS GENERATED BY THE COLLECTOR'S metadata.yaml FILE" +endmeta--> + +# Netdata Agent alarms + +Plugin: python.d.plugin +Module: alarms + +<img src="https://img.shields.io/badge/maintained%20by-Netdata-%2300ab44" /> + +## Overview + +This collector creates an 'Alarms' menu with one line plot of `alarms.status`. + + +Alarm status is read from the Netdata agent rest api [`/api/v1/alarms?all`](https://learn.netdata.cloud/api#/alerts/alerts1). + + +This collector is supported on all platforms. + +This collector supports collecting metrics from multiple instances of this integration, including remote instances. + + +### Default Behavior + +#### Auto-Detection + +It discovers instances of Netdata running on localhost, and gathers metrics from `http://127.0.0.1:19999/api/v1/alarms?all`. `CLEAR` status is mapped to `0`, `WARNING` to `1` and `CRITICAL` to `2`. Also, by default all alarms produced will be monitored. + + +#### Limits + +The default configuration for this integration does not impose any limits on data collection. + +#### Performance Impact + +The default configuration for this integration is not expected to impose a significant performance impact on the system. + + +## Metrics + +Metrics grouped by *scope*. + +The scope defines the instance that the metric belongs to. An instance is uniquely identified by a set of labels. + + + +### Per Netdata Agent alarms instance + +These metrics refer to the entire monitored application. + + +This scope has no labels. + +Metrics: + +| Metric | Dimensions | Unit | +|:------|:----------|:----| +| alarms.status | a dimension per alarm representing the latest status of the alarm. | status | +| alarms.values | a dimension per alarm representing the latest collected value of the alarm. | value | + + + +## Alerts + +There are no alerts configured by default for this integration. + + +## Setup + +### Prerequisites + +No action required. + +### Configuration + +#### File + +The configuration file name for this integration is `python.d/alarms.conf`. + + +You can edit the configuration file using the `edit-config` script from the +Netdata [config directory](https://github.com/netdata/netdata/blob/master/docs/configure/nodes.md#the-netdata-config-directory). + +```bash +cd /etc/netdata 2>/dev/null || cd /opt/netdata/etc/netdata +sudo ./edit-config python.d/alarms.conf +``` +#### Options + +There are 2 sections: + +* Global variables +* One or more JOBS that can define multiple different instances to monitor. + +The following options can be defined globally: priority, penalty, autodetection_retry, update_every, but can also be defined per JOB to override the global values. + +Additionally, the following collapsed table contains all the options that can be configured inside a JOB definition. + +Every configuration JOB starts with a `job_name` value which will appear in the dashboard, unless a `name` parameter is specified. + + +<details><summary>Config options</summary> + +| Name | Description | Default | Required | +|:----|:-----------|:-------|:--------:| +| url | Netdata agent alarms endpoint to collect from. Can be local or remote so long as reachable by agent. | http://127.0.0.1:19999/api/v1/alarms?all | True | +| status_map | Mapping of alarm status to integer number that will be the metric value collected. | {"CLEAR": 0, "WARNING": 1, "CRITICAL": 2} | True | +| collect_alarm_values | set to true to include a chart with calculated alarm values over time. | False | True | +| alarm_status_chart_type | define the type of chart for plotting status over time e.g. 'line' or 'stacked'. | line | True | +| alarm_contains_words | A "," separated list of words you want to filter alarm names for. For example 'cpu,load' would filter for only alarms with "cpu" or "load" in alarm name. Default includes all. | | True | +| alarm_excludes_words | A "," separated list of words you want to exclude based on alarm name. For example 'cpu,load' would exclude all alarms with "cpu" or "load" in alarm name. Default excludes None. | | True | +| update_every | Sets the default data collection frequency. | 10 | False | +| priority | Controls the order of charts at the netdata dashboard. | 60000 | False | +| autodetection_retry | Sets the job re-check interval in seconds. | 0 | False | +| penalty | Indicates whether to apply penalty to update_every in case of failures. | yes | False | +| name | Job name. This value will overwrite the `job_name` value. JOBS with the same name are mutually exclusive. Only one of them will be allowed running at any time. This allows autodetection to try several alternatives and pick the one that works. | | False | + +</details> + +#### Examples + +##### Basic + +A basic example configuration. + +```yaml +jobs: + url: 'http://127.0.0.1:19999/api/v1/alarms?all' + +``` +##### Advanced + +An advanced example configuration with multiple jobs collecting different subsets of alarms for plotting on different charts. +"ML" job will collect status and values for all alarms with "ml_" in the name. Default job will collect status for all other alarms. + + +<details><summary>Config</summary> + +```yaml +ML: + update_every: 5 + url: 'http://127.0.0.1:19999/api/v1/alarms?all' + status_map: + CLEAR: 0 + WARNING: 1 + CRITICAL: 2 + collect_alarm_values: true + alarm_status_chart_type: 'stacked' + alarm_contains_words: 'ml_' + +Default: + update_every: 5 + url: 'http://127.0.0.1:19999/api/v1/alarms?all' + status_map: + CLEAR: 0 + WARNING: 1 + CRITICAL: 2 + collect_alarm_values: false + alarm_status_chart_type: 'stacked' + alarm_excludes_words: 'ml_' + +``` +</details> + + + +## Troubleshooting + +### Debug Mode + +To troubleshoot issues with the `alarms` collector, run the `python.d.plugin` with the debug option enabled. The output +should give you clues as to why the collector isn't working. + +- Navigate to the `plugins.d` directory, usually at `/usr/libexec/netdata/plugins.d/`. If that's not the case on + your system, open `netdata.conf` and look for the `plugins` setting under `[directories]`. + + ```bash + cd /usr/libexec/netdata/plugins.d/ + ``` + +- Switch to the `netdata` user. + + ```bash + sudo -u netdata -s + ``` + +- Run the `python.d.plugin` to debug the collector: + + ```bash + ./python.d.plugin alarms debug trace + ``` + + diff --git a/collectors/python.d.plugin/am2320/README.md b/collectors/python.d.plugin/am2320/README.md index b8a6acb0b..0bc5ea90e 100644..120000 --- a/collectors/python.d.plugin/am2320/README.md +++ b/collectors/python.d.plugin/am2320/README.md @@ -1,76 +1 @@ -<!-- -title: "AM2320 sensor monitoring with netdata" -custom_edit_url: "https://github.com/netdata/netdata/edit/master/collectors/python.d.plugin/am2320/README.md" -sidebar_label: "AM2320" -learn_status: "Published" -learn_topic_type: "References" -learn_rel_path: "Integrations/Monitor/Remotes/Devices" ---> - -# AM2320 sensor monitoring with netdata - -Displays a graph of the temperature and humidity from a AM2320 sensor. - -## Requirements - - Adafruit Circuit Python AM2320 library - - Adafruit AM2320 I2C sensor - - Python 3 (Adafruit libraries are not Python 2.x compatible) - - -It produces the following charts: -1. **Temperature** -2. **Humidity** - -## Configuration - -Edit the `python.d/am2320.conf` configuration file using `edit-config` from the Netdata [config -directory](https://github.com/netdata/netdata/blob/master/docs/configure/nodes.md), which is typically at `/etc/netdata`. - -```bash -cd /etc/netdata # Replace this path with your Netdata config directory, if different -sudo ./edit-config python.d/am2320.conf -``` - -Raspberry Pi Instructions: - -Hardware install: -Connect the am2320 to the Raspberry Pi I2C pins - -Raspberry Pi 3B/4 Pins: - -- Board 3.3V (pin 1) to sensor VIN (pin 1) -- Board SDA (pin 3) to sensor SDA (pin 2) -- Board GND (pin 6) to sensor GND (pin 3) -- Board SCL (pin 5) to sensor SCL (pin 4) - -You may also need to add two I2C pullup resistors if your board does not already have them. The Raspberry Pi does have internal pullup resistors but it doesn't hurt to add them anyway. You can use 2.2K - 10K but we will just use 10K. The resistors go from VDD to SCL and SDA each. - -Software install: -- `sudo pip3 install adafruit-circuitpython-am2320` -- edit `/etc/netdata/netdata.conf` -- find `[plugin:python.d]` -- add `command options = -ppython3` -- save the file. -- restart the netdata service. -- check the dashboard. - -### Troubleshooting - -To troubleshoot issues with the `am2320` module, run the `python.d.plugin` with the debug option enabled. The -output will give you the output of the data collection job or error messages on why the collector isn't working. - -First, navigate to your plugins directory, usually they are located under `/usr/libexec/netdata/plugins.d/`. If that's -not the case on your system, open `netdata.conf` and look for the setting `plugins directory`. Once you're in the -plugin's directory, switch to the `netdata` user. - -```bash -cd /usr/libexec/netdata/plugins.d/ -sudo su -s /bin/bash netdata -``` - -Now you can manually run the `am2320` module in debug mode: - -```bash -./python.d.plugin am2320 debug trace -``` - +integrations/am2320.md
\ No newline at end of file diff --git a/collectors/python.d.plugin/am2320/integrations/am2320.md b/collectors/python.d.plugin/am2320/integrations/am2320.md new file mode 100644 index 000000000..9b41a8fd6 --- /dev/null +++ b/collectors/python.d.plugin/am2320/integrations/am2320.md @@ -0,0 +1,180 @@ +<!--startmeta +custom_edit_url: "https://github.com/netdata/netdata/edit/master/collectors/python.d.plugin/am2320/README.md" +meta_yaml: "https://github.com/netdata/netdata/edit/master/collectors/python.d.plugin/am2320/metadata.yaml" +sidebar_label: "AM2320" +learn_status: "Published" +learn_rel_path: "Data Collection/Hardware Devices and Sensors" +message: "DO NOT EDIT THIS FILE DIRECTLY, IT IS GENERATED BY THE COLLECTOR'S metadata.yaml FILE" +endmeta--> + +# AM2320 + + +<img src="https://netdata.cloud/img/microchip.svg" width="150"/> + + +Plugin: python.d.plugin +Module: am2320 + +<img src="https://img.shields.io/badge/maintained%20by-Netdata-%2300ab44" /> + +## Overview + +This collector monitors AM2320 sensor metrics about temperature and humidity. + +It retrieves temperature and humidity values by contacting an AM2320 sensor over i2c. + +This collector is supported on all platforms. + +This collector only supports collecting metrics from a single instance of this integration. + + +### Default Behavior + +#### Auto-Detection + +Assuming prerequisites are met, the collector will try to connect to the sensor via i2c + +#### Limits + +The default configuration for this integration does not impose any limits on data collection. + +#### Performance Impact + +The default configuration for this integration is not expected to impose a significant performance impact on the system. + + +## Metrics + +Metrics grouped by *scope*. + +The scope defines the instance that the metric belongs to. An instance is uniquely identified by a set of labels. + + + +### Per AM2320 instance + +These metrics refer to the entire monitored application. + +This scope has no labels. + +Metrics: + +| Metric | Dimensions | Unit | +|:------|:----------|:----| +| am2320.temperature | temperature | celsius | +| am2320.humidity | humidity | percentage | + + + +## Alerts + +There are no alerts configured by default for this integration. + + +## Setup + +### Prerequisites + +#### Sensor connection to a Raspberry Pi + +Connect the am2320 to the Raspberry Pi I2C pins + +Raspberry Pi 3B/4 Pins: + +- Board 3.3V (pin 1) to sensor VIN (pin 1) +- Board SDA (pin 3) to sensor SDA (pin 2) +- Board GND (pin 6) to sensor GND (pin 3) +- Board SCL (pin 5) to sensor SCL (pin 4) + +You may also need to add two I2C pullup resistors if your board does not already have them. The Raspberry Pi does have internal pullup resistors but it doesn't hurt to add them anyway. You can use 2.2K - 10K but we will just use 10K. The resistors go from VDD to SCL and SDA each. + + +#### Software requirements + +Install the Adafruit Circuit Python AM2320 library: + +`sudo pip3 install adafruit-circuitpython-am2320` + + + +### Configuration + +#### File + +The configuration file name for this integration is `python.d/am2320.conf`. + + +You can edit the configuration file using the `edit-config` script from the +Netdata [config directory](https://github.com/netdata/netdata/blob/master/docs/configure/nodes.md#the-netdata-config-directory). + +```bash +cd /etc/netdata 2>/dev/null || cd /opt/netdata/etc/netdata +sudo ./edit-config python.d/am2320.conf +``` +#### Options + +There are 2 sections: + +* Global variables +* One or more JOBS that can define multiple different instances to monitor. + +The following options can be defined globally: priority, penalty, autodetection_retry, update_every, but can also be defined per JOB to override the global values. + +Additionally, the following collapsed table contains all the options that can be configured inside a JOB definition. + +Every configuration JOB starts with a `job_name` value which will appear in the dashboard, unless a `name` parameter is specified. + + +<details><summary>Config options</summary> + +| Name | Description | Default | Required | +|:----|:-----------|:-------|:--------:| +| update_every | Sets the default data collection frequency. | 5 | False | +| priority | Controls the order of charts at the netdata dashboard. | 60000 | False | +| autodetection_retry | Sets the job re-check interval in seconds. | 0 | False | +| penalty | Indicates whether to apply penalty to update_every in case of failures. | yes | False | +| name | Job name. This value will overwrite the `job_name` value. JOBS with the same name are mutually exclusive. Only one of them will be allowed running at any time. This allows autodetection to try several alternatives and pick the one that works. | | False | + +</details> + +#### Examples + +##### Local sensor + +A basic JOB configuration + +```yaml +local_sensor: + name: 'Local AM2320' + +``` + + +## Troubleshooting + +### Debug Mode + +To troubleshoot issues with the `am2320` collector, run the `python.d.plugin` with the debug option enabled. The output +should give you clues as to why the collector isn't working. + +- Navigate to the `plugins.d` directory, usually at `/usr/libexec/netdata/plugins.d/`. If that's not the case on + your system, open `netdata.conf` and look for the `plugins` setting under `[directories]`. + + ```bash + cd /usr/libexec/netdata/plugins.d/ + ``` + +- Switch to the `netdata` user. + + ```bash + sudo -u netdata -s + ``` + +- Run the `python.d.plugin` to debug the collector: + + ```bash + ./python.d.plugin am2320 debug trace + ``` + + diff --git a/collectors/python.d.plugin/beanstalk/README.md b/collectors/python.d.plugin/beanstalk/README.md index c86ca354a..4efe13889 100644..120000 --- a/collectors/python.d.plugin/beanstalk/README.md +++ b/collectors/python.d.plugin/beanstalk/README.md @@ -1,156 +1 @@ -<!-- -title: "Beanstalk monitoring with Netdata" -custom_edit_url: "https://github.com/netdata/netdata/edit/master/collectors/python.d.plugin/beanstalk/README.md" -sidebar_label: "Beanstalk" -learn_status: "Published" -learn_topic_type: "References" -learn_rel_path: "Integrations/Monitor/Message brokers" ---> - -# Beanstalk collector - -Provides server and tube-level statistics. - -## Requirements - -- `python-beanstalkc` - -**Server statistics:** - -1. **Cpu usage** in cpu time - - - user - - system - -2. **Jobs rate** in jobs/s - - - total - - timeouts - -3. **Connections rate** in connections/s - - - connections - -4. **Commands rate** in commands/s - - - put - - peek - - peek-ready - - peek-delayed - - peek-buried - - reserve - - use - - watch - - ignore - - delete - - release - - bury - - kick - - stats - - stats-job - - stats-tube - - list-tubes - - list-tube-used - - list-tubes-watched - - pause-tube - -5. **Current tubes** in tubes - - - tubes - -6. **Current jobs** in jobs - - - urgent - - ready - - reserved - - delayed - - buried - -7. **Current connections** in connections - - - written - - producers - - workers - - waiting - -8. **Binlog** in records/s - - - written - - migrated - -9. **Uptime** in seconds - - - uptime - -**Per tube statistics:** - -1. **Jobs rate** in jobs/s - - - jobs - -2. **Jobs** in jobs - - - using - - ready - - reserved - - delayed - - buried - -3. **Connections** in connections - - - using - - waiting - - watching - -4. **Commands** in commands/s - - - deletes - - pauses - -5. **Pause** in seconds - - - since - - left - -## Configuration - -Edit the `python.d/beanstalk.conf` configuration file using `edit-config` from the Netdata [config -directory](https://github.com/netdata/netdata/blob/master/docs/configure/nodes.md), which is typically at `/etc/netdata`. - -```bash -cd /etc/netdata # Replace this path with your Netdata config directory, if different -sudo ./edit-config python.d/beanstalk.conf -``` - -Sample: - -```yaml -host : '127.0.0.1' -port : 11300 -``` - -If no configuration is given, module will attempt to connect to beanstalkd on `127.0.0.1:11300` address - - - - -### Troubleshooting - -To troubleshoot issues with the `beanstalk` module, run the `python.d.plugin` with the debug option enabled. The -output will give you the output of the data collection job or error messages on why the collector isn't working. - -First, navigate to your plugins directory, usually they are located under `/usr/libexec/netdata/plugins.d/`. If that's -not the case on your system, open `netdata.conf` and look for the setting `plugins directory`. Once you're in the -plugin's directory, switch to the `netdata` user. - -```bash -cd /usr/libexec/netdata/plugins.d/ -sudo su -s /bin/bash netdata -``` - -Now you can manually run the `beanstalk` module in debug mode: - -```bash -./python.d.plugin beanstalk debug trace -``` - +integrations/beanstalk.md
\ No newline at end of file diff --git a/collectors/python.d.plugin/beanstalk/integrations/beanstalk.md b/collectors/python.d.plugin/beanstalk/integrations/beanstalk.md new file mode 100644 index 000000000..cf2f0dac1 --- /dev/null +++ b/collectors/python.d.plugin/beanstalk/integrations/beanstalk.md @@ -0,0 +1,218 @@ +<!--startmeta +custom_edit_url: "https://github.com/netdata/netdata/edit/master/collectors/python.d.plugin/beanstalk/README.md" +meta_yaml: "https://github.com/netdata/netdata/edit/master/collectors/python.d.plugin/beanstalk/metadata.yaml" +sidebar_label: "Beanstalk" +learn_status: "Published" +learn_rel_path: "Data Collection/Message Brokers" +message: "DO NOT EDIT THIS FILE DIRECTLY, IT IS GENERATED BY THE COLLECTOR'S metadata.yaml FILE" +endmeta--> + +# Beanstalk + + +<img src="https://netdata.cloud/img/beanstalk.svg" width="150"/> + + +Plugin: python.d.plugin +Module: beanstalk + +<img src="https://img.shields.io/badge/maintained%20by-Netdata-%2300ab44" /> + +## Overview + +Monitor Beanstalk metrics to enhance job queueing and processing efficiency. Track job rates, processing times, and queue lengths for better task management. + +The collector uses the `beanstalkc` python module to connect to a `beanstalkd` service and gather metrics. + +This collector is supported on all platforms. + +This collector supports collecting metrics from multiple instances of this integration, including remote instances. + + +### Default Behavior + +#### Auto-Detection + +If no configuration is given, module will attempt to connect to beanstalkd on 127.0.0.1:11300 address. + +#### Limits + +The default configuration for this integration does not impose any limits on data collection. + +#### Performance Impact + +The default configuration for this integration is not expected to impose a significant performance impact on the system. + + +## Metrics + +Metrics grouped by *scope*. + +The scope defines the instance that the metric belongs to. An instance is uniquely identified by a set of labels. + + + +### Per Beanstalk instance + +These metrics refer to the entire monitored application. + +This scope has no labels. + +Metrics: + +| Metric | Dimensions | Unit | +|:------|:----------|:----| +| beanstalk.cpu_usage | user, system | cpu time | +| beanstalk.jobs_rate | total, timeouts | jobs/s | +| beanstalk.connections_rate | connections | connections/s | +| beanstalk.commands_rate | put, peek, peek-ready, peek-delayed, peek-buried, reserve, use, watch, ignore, delete, bury, kick, stats, stats-job, stats-tube, list-tubes, list-tube-used, list-tubes-watched, pause-tube | commands/s | +| beanstalk.connections_rate | tubes | tubes | +| beanstalk.current_jobs | urgent, ready, reserved, delayed, buried | jobs | +| beanstalk.current_connections | written, producers, workers, waiting | connections | +| beanstalk.binlog | written, migrated | records/s | +| beanstalk.uptime | uptime | seconds | + +### Per tube + +Metrics related to Beanstalk tubes. Each tube produces its own set of the following metrics. + +This scope has no labels. + +Metrics: + +| Metric | Dimensions | Unit | +|:------|:----------|:----| +| beanstalk.jobs_rate | jobs | jobs/s | +| beanstalk.jobs | urgent, ready, reserved, delayed, buried | jobs | +| beanstalk.connections | using, waiting, watching | connections | +| beanstalk.commands | deletes, pauses | commands/s | +| beanstalk.pause | since, left | seconds | + + + +## Alerts + + +The following alerts are available: + +| Alert name | On metric | Description | +|:------------|:----------|:------------| +| [ beanstalk_server_buried_jobs ](https://github.com/netdata/netdata/blob/master/health/health.d/beanstalkd.conf) | beanstalk.current_jobs | number of buried jobs across all tubes. You need to manually kick them so they can be processed. Presence of buried jobs in a tube does not affect new jobs. | + + +## Setup + +### Prerequisites + +#### beanstalkc python module + +The collector requires the `beanstalkc` python module to be installed. + + +### Configuration + +#### File + +The configuration file name for this integration is `python.d/beanstalk.conf`. + + +You can edit the configuration file using the `edit-config` script from the +Netdata [config directory](https://github.com/netdata/netdata/blob/master/docs/configure/nodes.md#the-netdata-config-directory). + +```bash +cd /etc/netdata 2>/dev/null || cd /opt/netdata/etc/netdata +sudo ./edit-config python.d/beanstalk.conf +``` +#### Options + +There are 2 sections: + +* Global variables +* One or more JOBS that can define multiple different instances to monitor. + +The following options can be defined globally: priority, penalty, autodetection_retry, update_every, but can also be defined per JOB to override the global values. + +Additionally, the following collapsed table contains all the options that can be configured inside a JOB definition. + +Every configuration JOB starts with a `job_name` value which will appear in the dashboard, unless a `name` parameter is specified. + + +<details><summary>Config options</summary> + +| Name | Description | Default | Required | +|:----|:-----------|:-------|:--------:| +| update_every | Sets the default data collection frequency. | 5 | False | +| priority | Controls the order of charts at the netdata dashboard. | 60000 | False | +| autodetection_retry | Sets the job re-check interval in seconds. | 0 | False | +| penalty | Indicates whether to apply penalty to update_every in case of failures. | yes | False | +| name | Job name. This value will overwrite the `job_name` value. JOBS with the same name are mutually exclusive. Only one of them will be allowed running at any time. This allows autodetection to try several alternatives and pick the one that works. | | False | +| host | IP or URL to a beanstalk service. | 127.0.0.1 | False | +| port | Port to the IP or URL to a beanstalk service. | 11300 | False | + +</details> + +#### Examples + +##### Remote beanstalk server + +A basic remote beanstalk server + +```yaml +remote: + name: 'beanstalk' + host: '1.2.3.4' + port: 11300 + +``` +##### Multi-instance + +> **Note**: When you define multiple jobs, their names must be unique. + +Collecting metrics from local and remote instances. + + +<details><summary>Config</summary> + +```yaml +localhost: + name: 'local_beanstalk' + host: '127.0.0.1' + port: 11300 + +remote_job: + name: 'remote_beanstalk' + host: '192.0.2.1' + port: 113000 + +``` +</details> + + + +## Troubleshooting + +### Debug Mode + +To troubleshoot issues with the `beanstalk` collector, run the `python.d.plugin` with the debug option enabled. The output +should give you clues as to why the collector isn't working. + +- Navigate to the `plugins.d` directory, usually at `/usr/libexec/netdata/plugins.d/`. If that's not the case on + your system, open `netdata.conf` and look for the `plugins` setting under `[directories]`. + + ```bash + cd /usr/libexec/netdata/plugins.d/ + ``` + +- Switch to the `netdata` user. + + ```bash + sudo -u netdata -s + ``` + +- Run the `python.d.plugin` to debug the collector: + + ```bash + ./python.d.plugin beanstalk debug trace + ``` + + diff --git a/collectors/python.d.plugin/beanstalk/metadata.yaml b/collectors/python.d.plugin/beanstalk/metadata.yaml index b6ff2f116..7dff9cb3a 100644 --- a/collectors/python.d.plugin/beanstalk/metadata.yaml +++ b/collectors/python.d.plugin/beanstalk/metadata.yaml @@ -8,7 +8,7 @@ modules: link: "https://beanstalkd.github.io/" categories: - data-collection.message-brokers - - data-collection.task-queues + #- data-collection.task-queues icon_filename: "beanstalk.svg" related_resources: integrations: diff --git a/collectors/python.d.plugin/bind_rndc/README.md b/collectors/python.d.plugin/bind_rndc/README.md index aa173f385..03a182ae8 100644..120000 --- a/collectors/python.d.plugin/bind_rndc/README.md +++ b/collectors/python.d.plugin/bind_rndc/README.md @@ -1,102 +1 @@ -<!-- -title: "ISC Bind monitoring with Netdata" -custom_edit_url: "https://github.com/netdata/netdata/edit/master/collectors/python.d.plugin/bind_rndc/README.md" -sidebar_label: "ISC Bind" -learn_status: "Published" -learn_topic_type: "References" -learn_rel_path: "Integrations/Monitor/Webapps" ---> - -# ISC Bind collector - -Collects Name server summary performance statistics using `rndc` tool. - -## Requirements - -- Version of bind must be 9.6 + -- Netdata must have permissions to run `rndc stats` - -It produces: - -1. **Name server statistics** - - - requests - - responses - - success - - auth_answer - - nonauth_answer - - nxrrset - - failure - - nxdomain - - recursion - - duplicate - - rejections - -2. **Incoming queries** - - - RESERVED0 - - A - - NS - - CNAME - - SOA - - PTR - - MX - - TXT - - X25 - - AAAA - - SRV - - NAPTR - - A6 - - DS - - RSIG - - DNSKEY - - SPF - - ANY - - DLV - -3. **Outgoing queries** - -- Same as Incoming queries - -## Configuration - -Edit the `python.d/bind_rndc.conf` configuration file using `edit-config` from the Netdata [config -directory](https://github.com/netdata/netdata/blob/master/docs/configure/nodes.md), which is typically at `/etc/netdata`. - -```bash -cd /etc/netdata # Replace this path with your Netdata config directory, if different -sudo ./edit-config python.d/bind_rndc.conf -``` - -Sample: - -```yaml -local: - named_stats_path : '/var/log/bind/named.stats' -``` - -If no configuration is given, module will attempt to read named.stats file at `/var/log/bind/named.stats` - - - - -### Troubleshooting - -To troubleshoot issues with the `bind_rndc` module, run the `python.d.plugin` with the debug option enabled. The -output will give you the output of the data collection job or error messages on why the collector isn't working. - -First, navigate to your plugins directory, usually they are located under `/usr/libexec/netdata/plugins.d/`. If that's -not the case on your system, open `netdata.conf` and look for the setting `plugins directory`. Once you're in the -plugin's directory, switch to the `netdata` user. - -```bash -cd /usr/libexec/netdata/plugins.d/ -sudo su -s /bin/bash netdata -``` - -Now you can manually run the `bind_rndc` module in debug mode: - -```bash -./python.d.plugin bind_rndc debug trace -``` - +integrations/isc_bind_rndc.md
\ No newline at end of file diff --git a/collectors/python.d.plugin/bind_rndc/integrations/isc_bind_rndc.md b/collectors/python.d.plugin/bind_rndc/integrations/isc_bind_rndc.md new file mode 100644 index 000000000..cc847272d --- /dev/null +++ b/collectors/python.d.plugin/bind_rndc/integrations/isc_bind_rndc.md @@ -0,0 +1,214 @@ +<!--startmeta +custom_edit_url: "https://github.com/netdata/netdata/edit/master/collectors/python.d.plugin/bind_rndc/README.md" +meta_yaml: "https://github.com/netdata/netdata/edit/master/collectors/python.d.plugin/bind_rndc/metadata.yaml" +sidebar_label: "ISC Bind (RNDC)" +learn_status: "Published" +learn_rel_path: "Data Collection/DNS and DHCP Servers" +message: "DO NOT EDIT THIS FILE DIRECTLY, IT IS GENERATED BY THE COLLECTOR'S metadata.yaml FILE" +endmeta--> + +# ISC Bind (RNDC) + + +<img src="https://netdata.cloud/img/isc.png" width="150"/> + + +Plugin: python.d.plugin +Module: bind_rndc + +<img src="https://img.shields.io/badge/maintained%20by-Netdata-%2300ab44" /> + +## Overview + +Monitor ISCBind (RNDC) performance for optimal DNS server operations. Monitor query rates, response times, and error rates to ensure reliable DNS service delivery. + +This collector uses the `rndc` tool to dump (named.stats) statistics then read them to gather Bind Name Server summary performance metrics. + +This collector is supported on all platforms. + +This collector only supports collecting metrics from a single instance of this integration. + + +### Default Behavior + +#### Auto-Detection + +If no configuration is given, the collector will attempt to read named.stats file at `/var/log/bind/named.stats` + +#### Limits + +The default configuration for this integration does not impose any limits on data collection. + +#### Performance Impact + +The default configuration for this integration is not expected to impose a significant performance impact on the system. + + +## Metrics + +Metrics grouped by *scope*. + +The scope defines the instance that the metric belongs to. An instance is uniquely identified by a set of labels. + + + +### Per ISC Bind (RNDC) instance + +These metrics refer to the entire monitored application. + +This scope has no labels. + +Metrics: + +| Metric | Dimensions | Unit | +|:------|:----------|:----| +| bind_rndc.name_server_statistics | requests, rejected_queries, success, failure, responses, duplicate, recursion, nxrrset, nxdomain, non_auth_answer, auth_answer, dropped_queries | stats | +| bind_rndc.incoming_queries | a dimension per incoming query type | queries | +| bind_rndc.outgoing_queries | a dimension per outgoing query type | queries | +| bind_rndc.stats_size | stats_size | MiB | + + + +## Alerts + + +The following alerts are available: + +| Alert name | On metric | Description | +|:------------|:----------|:------------| +| [ bind_rndc_stats_file_size ](https://github.com/netdata/netdata/blob/master/health/health.d/bind_rndc.conf) | bind_rndc.stats_size | BIND statistics-file size | + + +## Setup + +### Prerequisites + +#### Minimum bind version and permissions + +Version of bind must be >=9.6 and the Netdata user must have permissions to run `rndc stats` + +#### Setup log rotate for bind stats + +BIND appends logs at EVERY RUN. It is NOT RECOMMENDED to set `update_every` below 30 sec. +It is STRONGLY RECOMMENDED to create a `bind-rndc.conf` file for logrotate. + +To set up BIND to dump stats do the following: + +1. Add to 'named.conf.options' options {}: +`statistics-file "/var/log/bind/named.stats";` + +2. Create bind/ directory in /var/log: +`cd /var/log/ && mkdir bind` + +3. Change owner of directory to 'bind' user: +`chown bind bind/` + +4. RELOAD (NOT restart) BIND: +`systemctl reload bind9.service` + +5. Run as a root 'rndc stats' to dump (BIND will create named.stats in new directory) + +To allow Netdata to run 'rndc stats' change '/etc/bind/rndc.key' group to netdata: +`chown :netdata rndc.key` + +Last, BUT NOT least, is to create bind-rndc.conf in logrotate.d/: +``` +/var/log/bind/named.stats { + + daily + rotate 4 + compress + delaycompress + create 0644 bind bind + missingok + postrotate + rndc reload > /dev/null + endscript +} +``` +To test your logrotate conf file run as root: +`logrotate /etc/logrotate.d/bind-rndc -d (debug dry-run mode)` + + + +### Configuration + +#### File + +The configuration file name for this integration is `python.d/bind_rndc.conf`. + + +You can edit the configuration file using the `edit-config` script from the +Netdata [config directory](https://github.com/netdata/netdata/blob/master/docs/configure/nodes.md#the-netdata-config-directory). + +```bash +cd /etc/netdata 2>/dev/null || cd /opt/netdata/etc/netdata +sudo ./edit-config python.d/bind_rndc.conf +``` +#### Options + +There are 2 sections: + +* Global variables +* One or more JOBS that can define multiple different instances to monitor. + +The following options can be defined globally: priority, penalty, autodetection_retry, update_every, but can also be defined per JOB to override the global values. + +Additionally, the following collapsed table contains all the options that can be configured inside a JOB definition. + +Every configuration JOB starts with a `job_name` value which will appear in the dashboard, unless a `name` parameter is specified. + + +<details><summary>Config options</summary> + +| Name | Description | Default | Required | +|:----|:-----------|:-------|:--------:| +| update_every | Sets the default data collection frequency. | 5 | False | +| priority | Controls the order of charts at the netdata dashboard. | 60000 | False | +| autodetection_retry | Sets the job re-check interval in seconds. | 0 | False | +| penalty | Indicates whether to apply penalty to update_every in case of failures. | yes | False | +| name | Job name. This value will overwrite the `job_name` value. JOBS with the same name are mutually exclusive. Only one of them will be allowed running at any time. This allows autodetection to try several alternatives and pick the one that works. | | False | +| named_stats_path | Path to the named stats, after being dumped by `nrdc` | /var/log/bind/named.stats | False | + +</details> + +#### Examples + +##### Local bind stats + +Define a local path to bind stats file + +```yaml +local: + named_stats_path: '/var/log/bind/named.stats' + +``` + + +## Troubleshooting + +### Debug Mode + +To troubleshoot issues with the `bind_rndc` collector, run the `python.d.plugin` with the debug option enabled. The output +should give you clues as to why the collector isn't working. + +- Navigate to the `plugins.d` directory, usually at `/usr/libexec/netdata/plugins.d/`. If that's not the case on + your system, open `netdata.conf` and look for the `plugins` setting under `[directories]`. + + ```bash + cd /usr/libexec/netdata/plugins.d/ + ``` + +- Switch to the `netdata` user. + + ```bash + sudo -u netdata -s + ``` + +- Run the `python.d.plugin` to debug the collector: + + ```bash + ./python.d.plugin bind_rndc debug trace + ``` + + diff --git a/collectors/python.d.plugin/bind_rndc/metadata.yaml b/collectors/python.d.plugin/bind_rndc/metadata.yaml index 1e9fb24fe..e3568e448 100644 --- a/collectors/python.d.plugin/bind_rndc/metadata.yaml +++ b/collectors/python.d.plugin/bind_rndc/metadata.yaml @@ -4,7 +4,7 @@ modules: plugin_name: python.d.plugin module_name: bind_rndc monitored_instance: - name: ISCBind (RNDC) + name: ISC Bind (RNDC) link: "https://www.isc.org/bind/" categories: - data-collection.dns-and-dhcp-servers diff --git a/collectors/python.d.plugin/boinc/README.md b/collectors/python.d.plugin/boinc/README.md index ea4397754..22c10ca17 100644..120000 --- a/collectors/python.d.plugin/boinc/README.md +++ b/collectors/python.d.plugin/boinc/README.md @@ -1,64 +1 @@ -<!-- -title: "BOINC monitoring with Netdata" -custom_edit_url: "https://github.com/netdata/netdata/edit/master/collectors/python.d.plugin/boinc/README.md" -sidebar_label: "BOINC" -learn_status: "Published" -learn_topic_type: "References" -learn_rel_path: "Integrations/Monitor/Distributed computing" ---> - -# BOINC collector - -Monitors task counts for the Berkeley Open Infrastructure Networking Computing (BOINC) distributed computing client using the same RPC interface that the BOINC monitoring GUI does. - -It provides charts tracking the total number of tasks and active tasks, as well as ones tracking each of the possible states for tasks. - -## Configuration - -Edit the `python.d/boinc.conf` configuration file using `edit-config` from the Netdata [config -directory](https://github.com/netdata/netdata/blob/master/docs/configure/nodes.md), which is typically at `/etc/netdata`. - -```bash -cd /etc/netdata # Replace this path with your Netdata config directory, if different -sudo ./edit-config python.d/boinc.conf -``` - -BOINC requires use of a password to access it's RPC interface. You can -find this password in the `gui_rpc_auth.cfg` file in your BOINC directory. - -By default, the module will try to auto-detect the password by looking -in `/var/lib/boinc` for this file (this is the location most Linux -distributions use for a system-wide BOINC installation), so things may -just work without needing configuration for the local system. - -You can monitor remote systems as well: - -```yaml -remote: - hostname: some-host - password: some-password -``` - - - - -### Troubleshooting - -To troubleshoot issues with the `boinc` module, run the `python.d.plugin` with the debug option enabled. The -output will give you the output of the data collection job or error messages on why the collector isn't working. - -First, navigate to your plugins directory, usually they are located under `/usr/libexec/netdata/plugins.d/`. If that's -not the case on your system, open `netdata.conf` and look for the setting `plugins directory`. Once you're in the -plugin's directory, switch to the `netdata` user. - -```bash -cd /usr/libexec/netdata/plugins.d/ -sudo su -s /bin/bash netdata -``` - -Now you can manually run the `boinc` module in debug mode: - -```bash -./python.d.plugin boinc debug trace -``` - +integrations/boinc.md
\ No newline at end of file diff --git a/collectors/python.d.plugin/boinc/integrations/boinc.md b/collectors/python.d.plugin/boinc/integrations/boinc.md new file mode 100644 index 000000000..961f79537 --- /dev/null +++ b/collectors/python.d.plugin/boinc/integrations/boinc.md @@ -0,0 +1,203 @@ +<!--startmeta +custom_edit_url: "https://github.com/netdata/netdata/edit/master/collectors/python.d.plugin/boinc/README.md" +meta_yaml: "https://github.com/netdata/netdata/edit/master/collectors/python.d.plugin/boinc/metadata.yaml" +sidebar_label: "BOINC" +learn_status: "Published" +learn_rel_path: "Data Collection/Distributed Computing Systems" +message: "DO NOT EDIT THIS FILE DIRECTLY, IT IS GENERATED BY THE COLLECTOR'S metadata.yaml FILE" +endmeta--> + +# BOINC + + +<img src="https://netdata.cloud/img/bolt.svg" width="150"/> + + +Plugin: python.d.plugin +Module: boinc + +<img src="https://img.shields.io/badge/maintained%20by-Netdata-%2300ab44" /> + +## Overview + +This collector monitors task counts for the Berkeley Open Infrastructure Networking Computing (BOINC) distributed computing client. + +It uses the same RPC interface that the BOINC monitoring GUI does. + +This collector is supported on all platforms. + +This collector supports collecting metrics from multiple instances of this integration, including remote instances. + + +### Default Behavior + +#### Auto-Detection + +By default, the module will try to auto-detect the password to the RPC interface by looking in `/var/lib/boinc` for this file (this is the location most Linux distributions use for a system-wide BOINC installation), so things may just work without needing configuration for a local system. + +#### Limits + +The default configuration for this integration does not impose any limits on data collection. + +#### Performance Impact + +The default configuration for this integration is not expected to impose a significant performance impact on the system. + + +## Metrics + +Metrics grouped by *scope*. + +The scope defines the instance that the metric belongs to. An instance is uniquely identified by a set of labels. + + + +### Per BOINC instance + +These metrics refer to the entire monitored application. + +This scope has no labels. + +Metrics: + +| Metric | Dimensions | Unit | +|:------|:----------|:----| +| boinc.tasks | Total, Active | tasks | +| boinc.states | New, Downloading, Ready to Run, Compute Errors, Uploading, Uploaded, Aborted, Failed Uploads | tasks | +| boinc.sched | Uninitialized, Preempted, Scheduled | tasks | +| boinc.process | Uninitialized, Executing, Suspended, Aborted, Quit, Copy Pending | tasks | + + + +## Alerts + + +The following alerts are available: + +| Alert name | On metric | Description | +|:------------|:----------|:------------| +| [ boinc_total_tasks ](https://github.com/netdata/netdata/blob/master/health/health.d/boinc.conf) | boinc.tasks | average number of total tasks over the last 10 minutes | +| [ boinc_active_tasks ](https://github.com/netdata/netdata/blob/master/health/health.d/boinc.conf) | boinc.tasks | average number of active tasks over the last 10 minutes | +| [ boinc_compute_errors ](https://github.com/netdata/netdata/blob/master/health/health.d/boinc.conf) | boinc.states | average number of compute errors over the last 10 minutes | +| [ boinc_upload_errors ](https://github.com/netdata/netdata/blob/master/health/health.d/boinc.conf) | boinc.states | average number of failed uploads over the last 10 minutes | + + +## Setup + +### Prerequisites + +#### Boinc RPC interface + +BOINC requires use of a password to access it's RPC interface. You can find this password in the `gui_rpc_auth.cfg` file in your BOINC directory. + + +### Configuration + +#### File + +The configuration file name for this integration is `python.d/boinc.conf`. + + +You can edit the configuration file using the `edit-config` script from the +Netdata [config directory](https://github.com/netdata/netdata/blob/master/docs/configure/nodes.md#the-netdata-config-directory). + +```bash +cd /etc/netdata 2>/dev/null || cd /opt/netdata/etc/netdata +sudo ./edit-config python.d/boinc.conf +``` +#### Options + +There are 2 sections: + +* Global variables +* One or more JOBS that can define multiple different instances to monitor. + +The following options can be defined globally: priority, penalty, autodetection_retry, update_every, but can also be defined per JOB to override the global values. + +Additionally, the following collapsed table contains all the options that can be configured inside a JOB definition. + +Every configuration JOB starts with a `job_name` value which will appear in the dashboard, unless a `name` parameter is specified. + + +<details><summary>Config options</summary> + +| Name | Description | Default | Required | +|:----|:-----------|:-------|:--------:| +| update_every | Sets the default data collection frequency. | 5 | False | +| priority | Controls the order of charts at the netdata dashboard. | 60000 | False | +| autodetection_retry | Sets the job re-check interval in seconds. | 0 | False | +| penalty | Indicates whether to apply penalty to update_every in case of failures. | yes | False | +| name | Job name. This value will overwrite the `job_name` value. JOBS with the same name are mutually exclusive. Only one of them will be allowed running at any time. This allows autodetection to try several alternatives and pick the one that works. | | False | +| hostname | Define a hostname where boinc is running. | localhost | False | +| port | The port of boinc RPC interface. | | False | +| password | Provide a password to connect to a boinc RPC interface. | | False | + +</details> + +#### Examples + +##### Configuration of a remote boinc instance + +A basic JOB configuration for a remote boinc instance + +```yaml +remote: + hostname: '1.2.3.4' + port: 1234 + password: 'some-password' + +``` +##### Multi-instance + +> **Note**: When you define multiple jobs, their names must be unique. + +Collecting metrics from local and remote instances. + + +<details><summary>Config</summary> + +```yaml +localhost: + name: 'local' + host: '127.0.0.1' + port: 1234 + password: 'some-password' + +remote_job: + name: 'remote' + host: '192.0.2.1' + port: 1234 + password: some-other-password + +``` +</details> + + + +## Troubleshooting + +### Debug Mode + +To troubleshoot issues with the `boinc` collector, run the `python.d.plugin` with the debug option enabled. The output +should give you clues as to why the collector isn't working. + +- Navigate to the `plugins.d` directory, usually at `/usr/libexec/netdata/plugins.d/`. If that's not the case on + your system, open `netdata.conf` and look for the `plugins` setting under `[directories]`. + + ```bash + cd /usr/libexec/netdata/plugins.d/ + ``` + +- Switch to the `netdata` user. + + ```bash + sudo -u netdata -s + ``` + +- Run the `python.d.plugin` to debug the collector: + + ```bash + ./python.d.plugin boinc debug trace + ``` + + diff --git a/collectors/python.d.plugin/ceph/README.md b/collectors/python.d.plugin/ceph/README.md index 555491ad7..654248b70 100644..120000 --- a/collectors/python.d.plugin/ceph/README.md +++ b/collectors/python.d.plugin/ceph/README.md @@ -1,71 +1 @@ -<!-- -title: "CEPH monitoring with Netdata" -custom_edit_url: "https://github.com/netdata/netdata/edit/master/collectors/python.d.plugin/ceph/README.md" -sidebar_label: "CEPH" -learn_status: "Published" -learn_topic_type: "References" -learn_rel_path: "Integrations/Monitor/Storage" ---> - -# CEPH collector - -Monitors the ceph cluster usage and consumption data of a server, and produces: - -- Cluster statistics (usage, available, latency, objects, read/write rate) -- OSD usage -- OSD latency -- Pool usage -- Pool read/write operations -- Pool read/write rate -- number of objects per pool - -## Requirements - -- `rados` python module -- Granting read permissions to ceph group from keyring file - -```shell -# chmod 640 /etc/ceph/ceph.client.admin.keyring -``` - -## Configuration - -Edit the `python.d/ceph.conf` configuration file using `edit-config` from the Netdata [config -directory](https://github.com/netdata/netdata/blob/master/docs/configure/nodes.md), which is typically at `/etc/netdata`. - -```bash -cd /etc/netdata # Replace this path with your Netdata config directory, if different -sudo ./edit-config python.d/ceph.conf -``` - -Sample: - -```yaml -local: - config_file: '/etc/ceph/ceph.conf' - keyring_file: '/etc/ceph/ceph.client.admin.keyring' -``` - - - - -### Troubleshooting - -To troubleshoot issues with the `ceph` module, run the `python.d.plugin` with the debug option enabled. The -output will give you the output of the data collection job or error messages on why the collector isn't working. - -First, navigate to your plugins directory, usually they are located under `/usr/libexec/netdata/plugins.d/`. If that's -not the case on your system, open `netdata.conf` and look for the setting `plugins directory`. Once you're in the -plugin's directory, switch to the `netdata` user. - -```bash -cd /usr/libexec/netdata/plugins.d/ -sudo su -s /bin/bash netdata -``` - -Now you can manually run the `ceph` module in debug mode: - -```bash -./python.d.plugin ceph debug trace -``` - +integrations/ceph.md
\ No newline at end of file diff --git a/collectors/python.d.plugin/ceph/integrations/ceph.md b/collectors/python.d.plugin/ceph/integrations/ceph.md new file mode 100644 index 000000000..051121148 --- /dev/null +++ b/collectors/python.d.plugin/ceph/integrations/ceph.md @@ -0,0 +1,193 @@ +<!--startmeta +custom_edit_url: "https://github.com/netdata/netdata/edit/master/collectors/python.d.plugin/ceph/README.md" +meta_yaml: "https://github.com/netdata/netdata/edit/master/collectors/python.d.plugin/ceph/metadata.yaml" +sidebar_label: "Ceph" +learn_status: "Published" +learn_rel_path: "Data Collection/Storage, Mount Points and Filesystems" +message: "DO NOT EDIT THIS FILE DIRECTLY, IT IS GENERATED BY THE COLLECTOR'S metadata.yaml FILE" +endmeta--> + +# Ceph + + +<img src="https://netdata.cloud/img/ceph.svg" width="150"/> + + +Plugin: python.d.plugin +Module: ceph + +<img src="https://img.shields.io/badge/maintained%20by-Netdata-%2300ab44" /> + +## Overview + +This collector monitors Ceph metrics about Cluster statistics, OSD usage, latency and Pool statistics. + +Uses the `rados` python module to connect to a Ceph cluster. + +This collector is supported on all platforms. + +This collector supports collecting metrics from multiple instances of this integration, including remote instances. + + +### Default Behavior + +#### Auto-Detection + +This integration doesn't support auto-detection. + +#### Limits + +The default configuration for this integration does not impose any limits on data collection. + +#### Performance Impact + +The default configuration for this integration is not expected to impose a significant performance impact on the system. + + +## Metrics + +Metrics grouped by *scope*. + +The scope defines the instance that the metric belongs to. An instance is uniquely identified by a set of labels. + + + +### Per Ceph instance + +These metrics refer to the entire monitored application. + +This scope has no labels. + +Metrics: + +| Metric | Dimensions | Unit | +|:------|:----------|:----| +| ceph.general_usage | avail, used | KiB | +| ceph.general_objects | cluster | objects | +| ceph.general_bytes | read, write | KiB/s | +| ceph.general_operations | read, write | operations | +| ceph.general_latency | apply, commit | milliseconds | +| ceph.pool_usage | a dimension per Ceph Pool | KiB | +| ceph.pool_objects | a dimension per Ceph Pool | objects | +| ceph.pool_read_bytes | a dimension per Ceph Pool | KiB/s | +| ceph.pool_write_bytes | a dimension per Ceph Pool | KiB/s | +| ceph.pool_read_operations | a dimension per Ceph Pool | operations | +| ceph.pool_write_operations | a dimension per Ceph Pool | operations | +| ceph.osd_usage | a dimension per Ceph OSD | KiB | +| ceph.osd_size | a dimension per Ceph OSD | KiB | +| ceph.apply_latency | a dimension per Ceph OSD | milliseconds | +| ceph.commit_latency | a dimension per Ceph OSD | milliseconds | + + + +## Alerts + + +The following alerts are available: + +| Alert name | On metric | Description | +|:------------|:----------|:------------| +| [ ceph_cluster_space_usage ](https://github.com/netdata/netdata/blob/master/health/health.d/ceph.conf) | ceph.general_usage | cluster disk space utilization | + + +## Setup + +### Prerequisites + +#### `rados` python module + +Make sure the `rados` python module is installed + +#### Granting read permissions to ceph group from keyring file + +Execute: `chmod 640 /etc/ceph/ceph.client.admin.keyring` + +#### Create a specific rados_id + +You can optionally create a rados_id to use instead of admin + + +### Configuration + +#### File + +The configuration file name for this integration is `python.d/ceph.conf`. + + +You can edit the configuration file using the `edit-config` script from the +Netdata [config directory](https://github.com/netdata/netdata/blob/master/docs/configure/nodes.md#the-netdata-config-directory). + +```bash +cd /etc/netdata 2>/dev/null || cd /opt/netdata/etc/netdata +sudo ./edit-config python.d/ceph.conf +``` +#### Options + +There are 2 sections: + +* Global variables +* One or more JOBS that can define multiple different instances to monitor. + +The following options can be defined globally: priority, penalty, autodetection_retry, update_every, but can also be defined per JOB to override the global values. + +Additionally, the following collapsed table contains all the options that can be configured inside a JOB definition. + +Every configuration JOB starts with a `job_name` value which will appear in the dashboard, unless a `name` parameter is specified. + + +<details><summary>Config options</summary> + +| Name | Description | Default | Required | +|:----|:-----------|:-------|:--------:| +| update_every | Sets the default data collection frequency. | 5 | False | +| priority | Controls the order of charts at the netdata dashboard. | 60000 | False | +| autodetection_retry | Sets the job re-check interval in seconds. | 0 | False | +| penalty | Indicates whether to apply penalty to update_every in case of failures. | yes | False | +| name | Job name. This value will overwrite the `job_name` value. JOBS with the same name are mutually exclusive. Only one of them will be allowed running at any time. This allows autodetection to try several alternatives and pick the one that works. | | False | +| config_file | Ceph config file | | True | +| keyring_file | Ceph keyring file. netdata user must be added into ceph group and keyring file must be read group permission. | | True | +| rados_id | A rados user id to use for connecting to the Ceph cluster. | admin | False | + +</details> + +#### Examples + +##### Basic local Ceph cluster + +A basic configuration to connect to a local Ceph cluster. + +```yaml +local: + config_file: '/etc/ceph/ceph.conf' + keyring_file: '/etc/ceph/ceph.client.admin.keyring' + +``` + + +## Troubleshooting + +### Debug Mode + +To troubleshoot issues with the `ceph` collector, run the `python.d.plugin` with the debug option enabled. The output +should give you clues as to why the collector isn't working. + +- Navigate to the `plugins.d` directory, usually at `/usr/libexec/netdata/plugins.d/`. If that's not the case on + your system, open `netdata.conf` and look for the `plugins` setting under `[directories]`. + + ```bash + cd /usr/libexec/netdata/plugins.d/ + ``` + +- Switch to the `netdata` user. + + ```bash + sudo -u netdata -s + ``` + +- Run the `python.d.plugin` to debug the collector: + + ```bash + ./python.d.plugin ceph debug trace + ``` + + diff --git a/collectors/python.d.plugin/changefinder/README.md b/collectors/python.d.plugin/changefinder/README.md index 0e9bab887..0ca704eb1 100644..120000 --- a/collectors/python.d.plugin/changefinder/README.md +++ b/collectors/python.d.plugin/changefinder/README.md @@ -1,241 +1 @@ -<!-- -title: "Online change point detection with Netdata" -description: "Use ML-driven change point detection to narrow your focus and shorten root cause analysis." -custom_edit_url: "https://github.com/netdata/netdata/edit/master/collectors/python.d.plugin/changefinder/README.md" -sidebar_label: "changefinder" -learn_status: "Published" -learn_topic_type: "References" -learn_rel_path: "Integrations/Monitor/QoS" ---> - -# Online change point detection with Netdata - -This collector uses the Python [changefinder](https://github.com/shunsukeaihara/changefinder) library to -perform [online](https://en.wikipedia.org/wiki/Online_machine_learning) [changepoint detection](https://en.wikipedia.org/wiki/Change_detection) -on your Netdata charts and/or dimensions. - -Instead of this collector just _collecting_ data, it also does some computation on the data it collects to return a -changepoint score for each chart or dimension you configure it to work on. This is -an [online](https://en.wikipedia.org/wiki/Online_machine_learning) machine learning algorithm so there is no batch step -to train the model, instead it evolves over time as more data arrives. That makes this particular algorithm quite cheap -to compute at each step of data collection (see the notes section below for more details) and it should scale fairly -well to work on lots of charts or hosts (if running on a parent node for example). - -> As this is a somewhat unique collector and involves often subjective concepts like changepoints and anomalies, we would love to hear any feedback on it from the community. Please let us know on the [community forum](https://community.netdata.cloud/t/changefinder-collector-feedback/972) or drop us a note at [analytics-ml-team@netdata.cloud](mailto:analytics-ml-team@netdata.cloud) for any and all feedback, both positive and negative. This sort of feedback is priceless to help us make complex features more useful. - -## Charts - -Two charts are available: - -### ChangeFinder Scores (`changefinder.scores`) - -This chart shows the percentile of the score that is output from the ChangeFinder library (it is turned off by default -but available with `show_scores: true`). - -A high observed score is more likely to be a valid changepoint worth exploring, even more so when multiple charts or -dimensions have high changepoint scores at the same time or very close together. - -### ChangeFinder Flags (`changefinder.flags`) - -This chart shows `1` or `0` if the latest score has a percentile value that exceeds the `cf_threshold` threshold. By -default, any scores that are in the 99th or above percentile will raise a flag on this chart. - -The raw changefinder score itself can be a little noisy and so limiting ourselves to just periods where it surpasses -the 99th percentile can help manage the "[signal to noise ratio](https://en.wikipedia.org/wiki/Signal-to-noise_ratio)" -better. - -The `cf_threshold` parameter might be one you want to play around with to tune things specifically for the workloads on -your node and the specific charts you want to monitor. For example, maybe the 95th percentile might work better for you -than the 99th percentile. - -Below is an example of the chart produced by this collector. The first 3/4 of the period looks normal in that we see a -few individual changes being picked up somewhat randomly over time. But then at around 14:59 towards the end of the -chart we see two periods with 'spikes' of multiple changes for a small period of time. This is the sort of pattern that -might be a sign something on the system that has changed sufficiently enough to merit some investigation. - - - -## Requirements - -- This collector will only work with Python 3 and requires the packages below be installed. - -```bash -# become netdata user -sudo su -s /bin/bash netdata -# install required packages for the netdata user -pip3 install --user numpy==1.19.5 changefinder==0.03 scipy==1.5.4 -``` - -**Note**: if you need to tell Netdata to use Python 3 then you can pass the below command in the python plugin section -of your `netdata.conf` file. - -```yaml -[ plugin:python.d ] - # update every = 1 - command options = -ppython3 -``` - -## Configuration - -Install the Python requirements above, enable the collector and restart Netdata. - -```bash -cd /etc/netdata/ -sudo ./edit-config python.d.conf -# Set `changefinder: no` to `changefinder: yes` -sudo systemctl restart netdata -``` - -The configuration for the changefinder collector defines how it will behave on your system and might take some -experimentation with over time to set it optimally for your node. Out of the box, the config comes with -some [sane defaults](https://www.netdata.cloud/blog/redefining-monitoring-netdata/) to get you started that try to -balance the flexibility and power of the ML models with the goal of being as cheap as possible in term of cost on the -node resources. - -_**Note**: If you are unsure about any of the below configuration options then it's best to just ignore all this and -leave the `changefinder.conf` file alone to begin with. Then you can return to it later if you would like to tune things -a bit more once the collector is running for a while and you have a feeling for its performance on your node._ - -Edit the `python.d/changefinder.conf` configuration file using `edit-config` from the your -agent's [config directory](https://github.com/netdata/netdata/blob/master/docs/configure/nodes.md), which is usually at `/etc/netdata`. - -```bash -cd /etc/netdata # Replace this path with your Netdata config directory, if different -sudo ./edit-config python.d/changefinder.conf -``` - -The default configuration should look something like this. Here you can see each parameter (with sane defaults) and some -information about each one and what it does. - -```yaml -# - -# JOBS (data collection sources) - -# Pull data from local Netdata node. -local: - - # A friendly name for this job. - name: 'local' - - # What host to pull data from. - host: '127.0.0.1:19999' - - # What charts to pull data for - A regex like 'system\..*|' or 'system\..*|apps.cpu|apps.mem' etc. - charts_regex: 'system\..*' - - # Charts to exclude, useful if you would like to exclude some specific charts. - # Note: should be a ',' separated string like 'chart.name,chart.name'. - charts_to_exclude: '' - - # Get ChangeFinder scores 'per_dim' or 'per_chart'. - mode: 'per_chart' - - # Default parameters that can be passed to the changefinder library. - cf_r: 0.5 - cf_order: 1 - cf_smooth: 15 - - # The percentile above which scores will be flagged. - cf_threshold: 99 - - # The number of recent scores to use when calculating the percentile of the changefinder score. - n_score_samples: 14400 - - # Set to true if you also want to chart the percentile scores in addition to the flags. - # Mainly useful for debugging or if you want to dive deeper on how the scores are evolving over time. - show_scores: false -``` - -## Troubleshooting - -To see any relevant log messages you can use a command like below. - -```bash -grep 'changefinder' /var/log/netdata/error.log -``` - -If you would like to log in as `netdata` user and run the collector in debug mode to see more detail. - -```bash -# become netdata user -sudo su -s /bin/bash netdata -# run collector in debug using `nolock` option if netdata is already running the collector itself. -/usr/libexec/netdata/plugins.d/python.d.plugin changefinder debug trace nolock -``` - -## Notes - -- It may take an hour or two (depending on your choice of `n_score_samples`) for the collector to 'settle' into it's - typical behaviour in terms of the trained models and scores you will see in the normal running of your node. Mainly - this is because it can take a while to build up a proper distribution of previous scores in over to convert the raw - score returned by the ChangeFinder algorithm into a percentile based on the most recent `n_score_samples` that have - already been produced. So when you first turn the collector on, it will have a lot of flags in the beginning and then - should 'settle down' once it has built up enough history. This is a typical characteristic of online machine learning - approaches which need some initial window of time before they can be useful. -- As this collector does most of the work in Python itself, you may want to try it out first on a test or development - system to get a sense of its performance characteristics on a node similar to where you would like to use it. -- On a development n1-standard-2 (2 vCPUs, 7.5 GB memory) vm running Ubuntu 18.04 LTS and not doing any work some of the - typical performance characteristics we saw from running this collector (with defaults) were: - - A runtime (`netdata.runtime_changefinder`) of ~30ms. - - Typically ~1% additional cpu usage. - - About ~85mb of ram (`apps.mem`) being continually used by the `python.d.plugin` under default configuration. - -## Useful links and further reading - -- [PyPi changefinder](https://pypi.org/project/changefinder/) reference page. -- [GitHub repo](https://github.com/shunsukeaihara/changefinder) for the changefinder library. -- Relevant academic papers: - - Yamanishi K, Takeuchi J. A unifying framework for detecting outliers and change points from nonstationary time - series data. 8th ACM SIGKDD international conference on Knowledge discovery and data mining - KDD02. 2002: - 676. ([pdf](https://citeseerx.ist.psu.edu/viewdoc/download?doi=10.1.1.12.3469&rep=rep1&type=pdf)) - - Kawahara Y, Sugiyama M. Sequential Change-Point Detection Based on Direct Density-Ratio Estimation. SIAM - International Conference on Data Mining. 2009: - 389–400. ([pdf](https://onlinelibrary.wiley.com/doi/epdf/10.1002/sam.10124)) - - Liu S, Yamada M, Collier N, Sugiyama M. Change-point detection in time-series data by relative density-ratio - estimation. Neural Networks. Jul.2013 43:72–83. [PubMed: 23500502] ([pdf](https://arxiv.org/pdf/1203.0453.pdf)) - - T. Iwata, K. Nakamura, Y. Tokusashi, and H. Matsutani, “Accelerating Online Change-Point Detection Algorithm using - 10 GbE FPGA NIC,” Proc. International European Conference on Parallel and Distributed Computing (Euro-Par’18) - Workshops, vol.11339, pp.506–517, Aug. - 2018 ([pdf](https://www.arc.ics.keio.ac.jp/~matutani/papers/iwata_heteropar2018.pdf)) -- The [ruptures](https://github.com/deepcharles/ruptures) python package is also a good place to learn more about - changepoint detection (mostly offline as opposed to online but deals with similar concepts). -- A nice [blog post](https://techrando.com/2019/08/14/a-brief-introduction-to-change-point-detection-using-python/) - showing some of the other options and libraries for changepoint detection in Python. -- [Bayesian changepoint detection](https://github.com/hildensia/bayesian_changepoint_detection) library - we may explore - implementing a collector for this or integrating this approach into this collector at a future date if there is - interest and it proves computationaly feasible. -- You might also find the - Netdata [anomalies collector](https://github.com/netdata/netdata/tree/master/collectors/python.d.plugin/anomalies) - interesting. -- [Anomaly Detection](https://en.wikipedia.org/wiki/Anomaly_detection) wikipedia page. -- [Anomaly Detection YouTube playlist](https://www.youtube.com/playlist?list=PL6Zhl9mK2r0KxA6rB87oi4kWzoqGd5vp0) - maintained by [andrewm4894](https://github.com/andrewm4894/) from Netdata. -- [awesome-TS-anomaly-detection](https://github.com/rob-med/awesome-TS-anomaly-detection) Github list of useful tools, - libraries and resources. -- [Mendeley public group](https://www.mendeley.com/community/interesting-anomaly-detection-papers/) with some - interesting anomaly detection papers we have been reading. -- Good [blog post](https://www.anodot.com/blog/what-is-anomaly-detection/) from Anodot on time series anomaly detection. - Anodot also have some great whitepapers in this space too that some may find useful. -- Novelty and outlier detection in - the [scikit-learn documentation](https://scikit-learn.org/stable/modules/outlier_detection.html). - -### Troubleshooting - -To troubleshoot issues with the `changefinder` module, run the `python.d.plugin` with the debug option enabled. The -output will give you the output of the data collection job or error messages on why the collector isn't working. - -First, navigate to your plugins directory, usually they are located under `/usr/libexec/netdata/plugins.d/`. If that's -not the case on your system, open `netdata.conf` and look for the setting `plugins directory`. Once you're in the -plugin's directory, switch to the `netdata` user. - -```bash -cd /usr/libexec/netdata/plugins.d/ -sudo su -s /bin/bash netdata -``` - -Now you can manually run the `changefinder` module in debug mode: - -```bash -./python.d.plugin changefinder debug trace -``` - +integrations/python.d_changefinder.md
\ No newline at end of file diff --git a/collectors/python.d.plugin/changefinder/integrations/python.d_changefinder.md b/collectors/python.d.plugin/changefinder/integrations/python.d_changefinder.md new file mode 100644 index 000000000..2265d9620 --- /dev/null +++ b/collectors/python.d.plugin/changefinder/integrations/python.d_changefinder.md @@ -0,0 +1,216 @@ +<!--startmeta +custom_edit_url: "https://github.com/netdata/netdata/edit/master/collectors/python.d.plugin/changefinder/README.md" +meta_yaml: "https://github.com/netdata/netdata/edit/master/collectors/python.d.plugin/changefinder/metadata.yaml" +sidebar_label: "python.d changefinder" +learn_status: "Published" +learn_rel_path: "Data Collection/Other" +message: "DO NOT EDIT THIS FILE DIRECTLY, IT IS GENERATED BY THE COLLECTOR'S metadata.yaml FILE" +endmeta--> + +# python.d changefinder + +Plugin: python.d.plugin +Module: changefinder + +<img src="https://img.shields.io/badge/maintained%20by-Netdata-%2300ab44" /> + +## Overview + +This collector uses the Python [changefinder](https://github.com/shunsukeaihara/changefinder) library to +perform [online](https://en.wikipedia.org/wiki/Online_machine_learning) [changepoint detection](https://en.wikipedia.org/wiki/Change_detection) +on your Netdata charts and/or dimensions. + + +Instead of this collector just _collecting_ data, it also does some computation on the data it collects to return a changepoint score for each chart or dimension you configure it to work on. This is an [online](https://en.wikipedia.org/wiki/Online_machine_learning) machine learning algorithm so there is no batch step to train the model, instead it evolves over time as more data arrives. That makes this particular algorithm quite cheap to compute at each step of data collection (see the notes section below for more details) and it should scale fairly well to work on lots of charts or hosts (if running on a parent node for example). +### Notes - It may take an hour or two (depending on your choice of `n_score_samples`) for the collector to 'settle' into it's + typical behaviour in terms of the trained models and scores you will see in the normal running of your node. Mainly + this is because it can take a while to build up a proper distribution of previous scores in over to convert the raw + score returned by the ChangeFinder algorithm into a percentile based on the most recent `n_score_samples` that have + already been produced. So when you first turn the collector on, it will have a lot of flags in the beginning and then + should 'settle down' once it has built up enough history. This is a typical characteristic of online machine learning + approaches which need some initial window of time before they can be useful. +- As this collector does most of the work in Python itself, you may want to try it out first on a test or development + system to get a sense of its performance characteristics on a node similar to where you would like to use it. +- On a development n1-standard-2 (2 vCPUs, 7.5 GB memory) vm running Ubuntu 18.04 LTS and not doing any work some of the + typical performance characteristics we saw from running this collector (with defaults) were: + - A runtime (`netdata.runtime_changefinder`) of ~30ms. + - Typically ~1% additional cpu usage. + - About ~85mb of ram (`apps.mem`) being continually used by the `python.d.plugin` under default configuration. + + +This collector is supported on all platforms. + +This collector supports collecting metrics from multiple instances of this integration, including remote instances. + + +### Default Behavior + +#### Auto-Detection + +By default this collector will work over all `system.*` charts. + +#### Limits + +The default configuration for this integration does not impose any limits on data collection. + +#### Performance Impact + +The default configuration for this integration is not expected to impose a significant performance impact on the system. + + +## Metrics + +Metrics grouped by *scope*. + +The scope defines the instance that the metric belongs to. An instance is uniquely identified by a set of labels. + + + +### Per python.d changefinder instance + + + +This scope has no labels. + +Metrics: + +| Metric | Dimensions | Unit | +|:------|:----------|:----| +| changefinder.scores | a dimension per chart | score | +| changefinder.flags | a dimension per chart | flag | + + + +## Alerts + +There are no alerts configured by default for this integration. + + +## Setup + +### Prerequisites + +#### Python Requirements + +This collector will only work with Python 3 and requires the packages below be installed. + +```bash +# become netdata user +sudo su -s /bin/bash netdata +# install required packages for the netdata user +pip3 install --user numpy==1.19.5 changefinder==0.03 scipy==1.5.4 +``` + +**Note**: if you need to tell Netdata to use Python 3 then you can pass the below command in the python plugin section +of your `netdata.conf` file. + +```yaml +[ plugin:python.d ] + # update every = 1 + command options = -ppython3 +``` + + + +### Configuration + +#### File + +The configuration file name for this integration is `python.d/changefinder.conf`. + + +You can edit the configuration file using the `edit-config` script from the +Netdata [config directory](https://github.com/netdata/netdata/blob/master/docs/configure/nodes.md#the-netdata-config-directory). + +```bash +cd /etc/netdata 2>/dev/null || cd /opt/netdata/etc/netdata +sudo ./edit-config python.d/changefinder.conf +``` +#### Options + +There are 2 sections: + +* Global variables +* One or more JOBS that can define multiple different instances to monitor. + +The following options can be defined globally: priority, penalty, autodetection_retry, update_every, but can also be defined per JOB to override the global values. + +Additionally, the following collapsed table contains all the options that can be configured inside a JOB definition. + +Every configuration JOB starts with a `job_name` value which will appear in the dashboard, unless a `name` parameter is specified. + + +<details><summary>Config options</summary> + +| Name | Description | Default | Required | +|:----|:-----------|:-------|:--------:| +| charts_regex | what charts to pull data for - A regex like `system\..*/` or `system\..*/apps.cpu/apps.mem` etc. | system\..* | True | +| charts_to_exclude | charts to exclude, useful if you would like to exclude some specific charts. note: should be a ',' separated string like 'chart.name,chart.name'. | | False | +| mode | get ChangeFinder scores 'per_dim' or 'per_chart'. | per_chart | True | +| cf_r | default parameters that can be passed to the changefinder library. | 0.5 | False | +| cf_order | default parameters that can be passed to the changefinder library. | 1 | False | +| cf_smooth | default parameters that can be passed to the changefinder library. | 15 | False | +| cf_threshold | the percentile above which scores will be flagged. | 99 | False | +| n_score_samples | the number of recent scores to use when calculating the percentile of the changefinder score. | 14400 | False | +| show_scores | set to true if you also want to chart the percentile scores in addition to the flags. (mainly useful for debugging or if you want to dive deeper on how the scores are evolving over time) | False | False | + +</details> + +#### Examples + +##### Default + +Default configuration. + +```yaml +local: + name: 'local' + host: '127.0.0.1:19999' + charts_regex: 'system\..*' + charts_to_exclude: '' + mode: 'per_chart' + cf_r: 0.5 + cf_order: 1 + cf_smooth: 15 + cf_threshold: 99 + n_score_samples: 14400 + show_scores: false + +``` + + +## Troubleshooting + +### Debug Mode + +To troubleshoot issues with the `changefinder` collector, run the `python.d.plugin` with the debug option enabled. The output +should give you clues as to why the collector isn't working. + +- Navigate to the `plugins.d` directory, usually at `/usr/libexec/netdata/plugins.d/`. If that's not the case on + your system, open `netdata.conf` and look for the `plugins` setting under `[directories]`. + + ```bash + cd /usr/libexec/netdata/plugins.d/ + ``` + +- Switch to the `netdata` user. + + ```bash + sudo -u netdata -s + ``` + +- Run the `python.d.plugin` to debug the collector: + + ```bash + ./python.d.plugin changefinder debug trace + ``` + +### Debug Mode + + + +### Log Messages + + + + diff --git a/collectors/python.d.plugin/changefinder/metadata.yaml b/collectors/python.d.plugin/changefinder/metadata.yaml index 6dcd903e7..170d9146a 100644 --- a/collectors/python.d.plugin/changefinder/metadata.yaml +++ b/collectors/python.d.plugin/changefinder/metadata.yaml @@ -5,55 +5,187 @@ modules: module_name: changefinder monitored_instance: name: python.d changefinder - link: '' + link: "" categories: - data-collection.other - icon_filename: '' + icon_filename: "" related_resources: integrations: list: [] info_provided_to_referring_integrations: - description: '' - keywords: [] + description: "" + keywords: + - change detection + - anomaly detection + - machine learning + - ml most_popular: false overview: data_collection: - metrics_description: '' - method_description: '' + metrics_description: | + This collector uses the Python [changefinder](https://github.com/shunsukeaihara/changefinder) library to + perform [online](https://en.wikipedia.org/wiki/Online_machine_learning) [changepoint detection](https://en.wikipedia.org/wiki/Change_detection) + on your Netdata charts and/or dimensions. + method_description: > + Instead of this collector just _collecting_ data, it also does some computation on the data it collects to return a + changepoint score for each chart or dimension you configure it to work on. This is + an [online](https://en.wikipedia.org/wiki/Online_machine_learning) machine learning algorithm so there is no batch step + to train the model, instead it evolves over time as more data arrives. That makes this particular algorithm quite cheap + to compute at each step of data collection (see the notes section below for more details) and it should scale fairly + well to work on lots of charts or hosts (if running on a parent node for example). + + ### Notes + - It may take an hour or two (depending on your choice of `n_score_samples`) for the collector to 'settle' into it's + typical behaviour in terms of the trained models and scores you will see in the normal running of your node. Mainly + this is because it can take a while to build up a proper distribution of previous scores in over to convert the raw + score returned by the ChangeFinder algorithm into a percentile based on the most recent `n_score_samples` that have + already been produced. So when you first turn the collector on, it will have a lot of flags in the beginning and then + should 'settle down' once it has built up enough history. This is a typical characteristic of online machine learning + approaches which need some initial window of time before they can be useful. + - As this collector does most of the work in Python itself, you may want to try it out first on a test or development + system to get a sense of its performance characteristics on a node similar to where you would like to use it. + - On a development n1-standard-2 (2 vCPUs, 7.5 GB memory) vm running Ubuntu 18.04 LTS and not doing any work some of the + typical performance characteristics we saw from running this collector (with defaults) were: + - A runtime (`netdata.runtime_changefinder`) of ~30ms. + - Typically ~1% additional cpu usage. + - About ~85mb of ram (`apps.mem`) being continually used by the `python.d.plugin` under default configuration. supported_platforms: include: [] exclude: [] multi_instance: true additional_permissions: - description: '' + description: "" default_behavior: auto_detection: - description: '' + description: "By default this collector will work over all `system.*` charts." limits: - description: '' + description: "" performance_impact: - description: '' + description: "" setup: prerequisites: - list: [] + list: + - title: Python Requirements + description: | + This collector will only work with Python 3 and requires the packages below be installed. + + ```bash + # become netdata user + sudo su -s /bin/bash netdata + # install required packages for the netdata user + pip3 install --user numpy==1.19.5 changefinder==0.03 scipy==1.5.4 + ``` + + **Note**: if you need to tell Netdata to use Python 3 then you can pass the below command in the python plugin section + of your `netdata.conf` file. + + ```yaml + [ plugin:python.d ] + # update every = 1 + command options = -ppython3 + ``` configuration: file: - name: '' - description: '' + name: python.d/changefinder.conf + description: "" options: - description: '' + description: | + There are 2 sections: + + * Global variables + * One or more JOBS that can define multiple different instances to monitor. + + The following options can be defined globally: priority, penalty, autodetection_retry, update_every, but can also be defined per JOB to override the global values. + + Additionally, the following collapsed table contains all the options that can be configured inside a JOB definition. + + Every configuration JOB starts with a `job_name` value which will appear in the dashboard, unless a `name` parameter is specified. folding: - title: '' + title: "Config options" enabled: true - list: [] + list: + - name: charts_regex + description: what charts to pull data for - A regex like `system\..*|` or `system\..*|apps.cpu|apps.mem` etc. + default_value: "system\\..*" + required: true + - name: charts_to_exclude + description: | + charts to exclude, useful if you would like to exclude some specific charts. + note: should be a ',' separated string like 'chart.name,chart.name'. + default_value: "" + required: false + - name: mode + description: get ChangeFinder scores 'per_dim' or 'per_chart'. + default_value: "per_chart" + required: true + - name: cf_r + description: default parameters that can be passed to the changefinder library. + default_value: 0.5 + required: false + - name: cf_order + description: default parameters that can be passed to the changefinder library. + default_value: 1 + required: false + - name: cf_smooth + description: default parameters that can be passed to the changefinder library. + default_value: 15 + required: false + - name: cf_threshold + description: the percentile above which scores will be flagged. + default_value: 99 + required: false + - name: n_score_samples + description: the number of recent scores to use when calculating the percentile of the changefinder score. + default_value: 14400 + required: false + - name: show_scores + description: | + set to true if you also want to chart the percentile scores in addition to the flags. (mainly useful for debugging or if you want to dive deeper on how the scores are evolving over time) + default_value: false + required: false examples: folding: enabled: true - title: '' - list: [] + title: "Config" + list: + - name: Default + description: Default configuration. + folding: + enabled: false + config: | + local: + name: 'local' + host: '127.0.0.1:19999' + charts_regex: 'system\..*' + charts_to_exclude: '' + mode: 'per_chart' + cf_r: 0.5 + cf_order: 1 + cf_smooth: 15 + cf_threshold: 99 + n_score_samples: 14400 + show_scores: false troubleshooting: problems: - list: [] + list: + - name: "Debug Mode" + description: | + If you would like to log in as `netdata` user and run the collector in debug mode to see more detail. + + ```bash + # become netdata user + sudo su -s /bin/bash netdata + # run collector in debug using `nolock` option if netdata is already running the collector itself. + /usr/libexec/netdata/plugins.d/python.d.plugin changefinder debug trace nolock + ``` + - name: "Log Messages" + description: | + To see any relevant log messages you can use a command like below. + + ```bash + grep 'changefinder' /var/log/netdata/error.log + grep 'changefinder' /var/log/netdata/collector.log + ``` alerts: [] metrics: folding: diff --git a/collectors/python.d.plugin/dovecot/README.md b/collectors/python.d.plugin/dovecot/README.md index 2397b7478..c4749cedc 100644..120000 --- a/collectors/python.d.plugin/dovecot/README.md +++ b/collectors/python.d.plugin/dovecot/README.md @@ -1,128 +1 @@ -<!-- -title: "Dovecot monitoring with Netdata" -custom_edit_url: "https://github.com/netdata/netdata/edit/master/collectors/python.d.plugin/dovecot/README.md" -sidebar_label: "Dovecot" -learn_status: "Published" -learn_topic_type: "References" -learn_rel_path: "Integrations/Monitor/Webapps" ---> - -# Dovecot collector - -Provides statistics information from Dovecot server. - -Statistics are taken from dovecot socket by executing `EXPORT global` command. -More information about dovecot stats can be found on [project wiki page.](http://wiki2.dovecot.org/Statistics) - -Module isn't compatible with new statistic api (v2.3), but you are still able to use the module with Dovecot v2.3 -by following [upgrading steps.](https://wiki2.dovecot.org/Upgrading/2.3). - -**Requirement:** -Dovecot UNIX socket with R/W permissions for user `netdata` or Dovecot with configured TCP/IP socket. - -Module gives information with following charts: - -1. **sessions** - - - active sessions - -2. **logins** - - - logins - -3. **commands** - number of IMAP commands - - - commands - -4. **Faults** - - - minor - - major - -5. **Context Switches** - - - voluntary - - involuntary - -6. **disk** in bytes/s - - - read - - write - -7. **bytes** in bytes/s - - - read - - write - -8. **number of syscalls** in syscalls/s - - - read - - write - -9. **lookups** - number of lookups per second - - - path - - attr - -10. **hits** - number of cache hits - - - hits - -11. **attempts** - authorization attempts - - - success - - failure - -12. **cache** - cached authorization hits - - - hit - - miss - -## Configuration - -Edit the `python.d/dovecot.conf` configuration file using `edit-config` from the Netdata [config -directory](https://github.com/netdata/netdata/blob/master/docs/configure/nodes.md), which is typically at `/etc/netdata`. - -```bash -cd /etc/netdata # Replace this path with your Netdata config directory, if different -sudo ./edit-config python.d/dovecot.conf -``` - -Sample: - -```yaml -localtcpip: - name : 'local' - host : '127.0.0.1' - port : 24242 - -localsocket: - name : 'local' - socket : '/var/run/dovecot/stats' -``` - -If no configuration is given, module will attempt to connect to dovecot using unix socket localized in `/var/run/dovecot/stats` - - - - -### Troubleshooting - -To troubleshoot issues with the `dovecot` module, run the `python.d.plugin` with the debug option enabled. The -output will give you the output of the data collection job or error messages on why the collector isn't working. - -First, navigate to your plugins directory, usually they are located under `/usr/libexec/netdata/plugins.d/`. If that's -not the case on your system, open `netdata.conf` and look for the setting `plugins directory`. Once you're in the -plugin's directory, switch to the `netdata` user. - -```bash -cd /usr/libexec/netdata/plugins.d/ -sudo su -s /bin/bash netdata -``` - -Now you can manually run the `dovecot` module in debug mode: - -```bash -./python.d.plugin dovecot debug trace -``` - +integrations/dovecot.md
\ No newline at end of file diff --git a/collectors/python.d.plugin/dovecot/integrations/dovecot.md b/collectors/python.d.plugin/dovecot/integrations/dovecot.md new file mode 100644 index 000000000..4057a5b6c --- /dev/null +++ b/collectors/python.d.plugin/dovecot/integrations/dovecot.md @@ -0,0 +1,196 @@ +<!--startmeta +custom_edit_url: "https://github.com/netdata/netdata/edit/master/collectors/python.d.plugin/dovecot/README.md" +meta_yaml: "https://github.com/netdata/netdata/edit/master/collectors/python.d.plugin/dovecot/metadata.yaml" +sidebar_label: "Dovecot" +learn_status: "Published" +learn_rel_path: "Data Collection/Mail Servers" +message: "DO NOT EDIT THIS FILE DIRECTLY, IT IS GENERATED BY THE COLLECTOR'S metadata.yaml FILE" +endmeta--> + +# Dovecot + + +<img src="https://netdata.cloud/img/dovecot.svg" width="150"/> + + +Plugin: python.d.plugin +Module: dovecot + +<img src="https://img.shields.io/badge/maintained%20by-Netdata-%2300ab44" /> + +## Overview + +This collector monitors Dovecot metrics about sessions, logins, commands, page faults and more. + +It uses the dovecot socket and executes the `EXPORT global` command to get the statistics. + +This collector is supported on all platforms. + +This collector supports collecting metrics from multiple instances of this integration, including remote instances. + + +### Default Behavior + +#### Auto-Detection + +If no configuration is given, the collector will attempt to connect to dovecot using unix socket localized in `/var/run/dovecot/stats` + +#### Limits + +The default configuration for this integration does not impose any limits on data collection. + +#### Performance Impact + +The default configuration for this integration is not expected to impose a significant performance impact on the system. + + +## Metrics + +Metrics grouped by *scope*. + +The scope defines the instance that the metric belongs to. An instance is uniquely identified by a set of labels. + + + +### Per Dovecot instance + +These metrics refer to the entire monitored application. + +This scope has no labels. + +Metrics: + +| Metric | Dimensions | Unit | +|:------|:----------|:----| +| dovecot.sessions | active sessions | number | +| dovecot.logins | logins | number | +| dovecot.commands | commands | commands | +| dovecot.faults | minor, major | faults | +| dovecot.context_switches | voluntary, involuntary | switches | +| dovecot.io | read, write | KiB/s | +| dovecot.net | read, write | kilobits/s | +| dovecot.syscalls | read, write | syscalls/s | +| dovecot.lookup | path, attr | number/s | +| dovecot.cache | hits | hits/s | +| dovecot.auth | ok, failed | attempts | +| dovecot.auth_cache | hit, miss | number | + + + +## Alerts + +There are no alerts configured by default for this integration. + + +## Setup + +### Prerequisites + +#### Dovecot configuration + +The Dovecot UNIX socket should have R/W permissions for user netdata, or Dovecot should be configured with a TCP/IP socket. + + +### Configuration + +#### File + +The configuration file name for this integration is `python.d/dovecot.conf`. + + +You can edit the configuration file using the `edit-config` script from the +Netdata [config directory](https://github.com/netdata/netdata/blob/master/docs/configure/nodes.md#the-netdata-config-directory). + +```bash +cd /etc/netdata 2>/dev/null || cd /opt/netdata/etc/netdata +sudo ./edit-config python.d/dovecot.conf +``` +#### Options + +There are 2 sections: + +* Global variables +* One or more JOBS that can define multiple different instances to monitor. + +The following options can be defined globally: priority, penalty, autodetection_retry, update_every, but can also be defined per JOB to override the global values. + +Additionally, the following collapsed table contains all the options that can be configured inside a JOB definition. + +Every configuration JOB starts with a `job_name` value which will appear in the dashboard, unless a `name` parameter is specified. + + +<details><summary>Config options</summary> + +| Name | Description | Default | Required | +|:----|:-----------|:-------|:--------:| +| update_every | Sets the default data collection frequency. | 5 | False | +| priority | Controls the order of charts at the netdata dashboard. | 60000 | False | +| autodetection_retry | Sets the job re-check interval in seconds. | 0 | False | +| penalty | Indicates whether to apply penalty to update_every in case of failures. | yes | False | +| name | Job name. This value will overwrite the `job_name` value. JOBS with the same name are mutually exclusive. Only one of them will be allowed running at any time. This allows autodetection to try several alternatives and pick the one that works. | | False | +| socket | Use this socket to communicate with Devcot | /var/run/dovecot/stats | False | +| host | Instead of using a socket, you can point the collector to an ip for devcot statistics. | | False | +| port | Used in combination with host, configures the port devcot listens to. | | False | + +</details> + +#### Examples + +##### Local TCP + +A basic TCP configuration. + +<details><summary>Config</summary> + +```yaml +localtcpip: + name: 'local' + host: '127.0.0.1' + port: 24242 + +``` +</details> + +##### Local socket + +A basic local socket configuration + +<details><summary>Config</summary> + +```yaml +localsocket: + name: 'local' + socket: '/var/run/dovecot/stats' + +``` +</details> + + + +## Troubleshooting + +### Debug Mode + +To troubleshoot issues with the `dovecot` collector, run the `python.d.plugin` with the debug option enabled. The output +should give you clues as to why the collector isn't working. + +- Navigate to the `plugins.d` directory, usually at `/usr/libexec/netdata/plugins.d/`. If that's not the case on + your system, open `netdata.conf` and look for the `plugins` setting under `[directories]`. + + ```bash + cd /usr/libexec/netdata/plugins.d/ + ``` + +- Switch to the `netdata` user. + + ```bash + sudo -u netdata -s + ``` + +- Run the `python.d.plugin` to debug the collector: + + ```bash + ./python.d.plugin dovecot debug trace + ``` + + diff --git a/collectors/python.d.plugin/example/README.md b/collectors/python.d.plugin/example/README.md index 63ec7a298..55877a99a 100644..120000 --- a/collectors/python.d.plugin/example/README.md +++ b/collectors/python.d.plugin/example/README.md @@ -1,38 +1 @@ -<!-- -title: "Example module in Python" -custom_edit_url: "https://github.com/netdata/netdata/edit/master/collectors/python.d.plugin/example/README.md" -sidebar_label: "Example module in Python" -learn_status: "Published" -learn_topic_type: "References" -learn_rel_path: "Integrations/Monitor/Mock Collectors" ---> - -# Example module in Python - -You can add custom data collectors using Python. - -Netdata provides an [example python data collection module](https://github.com/netdata/netdata/tree/master/collectors/python.d.plugin/example). - -If you want to write your own collector, read our [writing a new Python module](https://github.com/netdata/netdata/blob/master/collectors/python.d.plugin/README.md#how-to-write-a-new-module) tutorial. - - -### Troubleshooting - -To troubleshoot issues with the `example` module, run the `python.d.plugin` with the debug option enabled. The -output will give you the output of the data collection job or error messages on why the collector isn't working. - -First, navigate to your plugins directory, usually they are located under `/usr/libexec/netdata/plugins.d/`. If that's -not the case on your system, open `netdata.conf` and look for the setting `plugins directory`. Once you're in the -plugin's directory, switch to the `netdata` user. - -```bash -cd /usr/libexec/netdata/plugins.d/ -sudo su -s /bin/bash netdata -``` - -Now you can manually run the `example` module in debug mode: - -```bash -./python.d.plugin example debug trace -``` - +integrations/example_collector.md
\ No newline at end of file diff --git a/collectors/python.d.plugin/example/integrations/example_collector.md b/collectors/python.d.plugin/example/integrations/example_collector.md new file mode 100644 index 000000000..44b405a7d --- /dev/null +++ b/collectors/python.d.plugin/example/integrations/example_collector.md @@ -0,0 +1,170 @@ +<!--startmeta +custom_edit_url: "https://github.com/netdata/netdata/edit/master/collectors/python.d.plugin/example/README.md" +meta_yaml: "https://github.com/netdata/netdata/edit/master/collectors/python.d.plugin/example/metadata.yaml" +sidebar_label: "Example collector" +learn_status: "Published" +learn_rel_path: "Data Collection/Other" +message: "DO NOT EDIT THIS FILE DIRECTLY, IT IS GENERATED BY THE COLLECTOR'S metadata.yaml FILE" +endmeta--> + +# Example collector + +Plugin: python.d.plugin +Module: example + +<img src="https://img.shields.io/badge/maintained%20by-Netdata-%2300ab44" /> + +## Overview + +Example collector that generates some random numbers as metrics. + +If you want to write your own collector, read our [writing a new Python module](https://github.com/netdata/netdata/blob/master/collectors/python.d.plugin/README.md#how-to-write-a-new-module) tutorial. + + +The `get_data()` function uses `random.randint()` to generate a random number which will be collected as a metric. + + +This collector is supported on all platforms. + +This collector supports collecting metrics from multiple instances of this integration, including remote instances. + + +### Default Behavior + +#### Auto-Detection + +This integration doesn't support auto-detection. + +#### Limits + +The default configuration for this integration does not impose any limits on data collection. + +#### Performance Impact + +The default configuration for this integration is not expected to impose a significant performance impact on the system. + + +## Metrics + +Metrics grouped by *scope*. + +The scope defines the instance that the metric belongs to. An instance is uniquely identified by a set of labels. + + + +### Per Example collector instance + +These metrics refer to the entire monitored application. + + +This scope has no labels. + +Metrics: + +| Metric | Dimensions | Unit | +|:------|:----------|:----| +| example.random | random | number | + + + +## Alerts + +There are no alerts configured by default for this integration. + + +## Setup + +### Prerequisites + +No action required. + +### Configuration + +#### File + +The configuration file name for this integration is `python.d/example.conf`. + + +You can edit the configuration file using the `edit-config` script from the +Netdata [config directory](https://github.com/netdata/netdata/blob/master/docs/configure/nodes.md#the-netdata-config-directory). + +```bash +cd /etc/netdata 2>/dev/null || cd /opt/netdata/etc/netdata +sudo ./edit-config python.d/example.conf +``` +#### Options + +There are 2 sections: + +* Global variables +* One or more JOBS that can define multiple different instances to monitor. + +The following options can be defined globally: priority, penalty, autodetection_retry, update_every, but can also be defined per JOB to override the global values. + +Additionally, the following collapsed table contains all the options that can be configured inside a JOB definition. + +Every configuration JOB starts with a `job_name` value which will appear in the dashboard, unless a `name` parameter is specified. + + +<details><summary>Config options</summary> + +| Name | Description | Default | Required | +|:----|:-----------|:-------|:--------:| +| num_lines | The number of lines to create. | 4 | False | +| lower | The lower bound of numbers to randomly sample from. | 0 | False | +| upper | The upper bound of numbers to randomly sample from. | 100 | False | +| update_every | Sets the default data collection frequency. | 1 | False | +| priority | Controls the order of charts at the netdata dashboard. | 60000 | False | +| autodetection_retry | Sets the job re-check interval in seconds. | 0 | False | +| penalty | Indicates whether to apply penalty to update_every in case of failures. | yes | False | +| name | Job name. This value will overwrite the `job_name` value. JOBS with the same name are mutually exclusive. Only one of them will be allowed running at any time. This allows autodetection to try several alternatives and pick the one that works. | | False | + +</details> + +#### Examples + +##### Basic + +A basic example configuration. + +```yaml +four_lines: + name: "Four Lines" + update_every: 1 + priority: 60000 + penalty: yes + autodetection_retry: 0 + num_lines: 4 + lower: 0 + upper: 100 + +``` + + +## Troubleshooting + +### Debug Mode + +To troubleshoot issues with the `example` collector, run the `python.d.plugin` with the debug option enabled. The output +should give you clues as to why the collector isn't working. + +- Navigate to the `plugins.d` directory, usually at `/usr/libexec/netdata/plugins.d/`. If that's not the case on + your system, open `netdata.conf` and look for the `plugins` setting under `[directories]`. + + ```bash + cd /usr/libexec/netdata/plugins.d/ + ``` + +- Switch to the `netdata` user. + + ```bash + sudo -u netdata -s + ``` + +- Run the `python.d.plugin` to debug the collector: + + ```bash + ./python.d.plugin example debug trace + ``` + + diff --git a/collectors/python.d.plugin/exim/README.md b/collectors/python.d.plugin/exim/README.md index bc00ab7c6..f1f2ef9f9 100644..120000 --- a/collectors/python.d.plugin/exim/README.md +++ b/collectors/python.d.plugin/exim/README.md @@ -1,64 +1 @@ -<!-- -title: "Exim monitoring with Netdata" -custom_edit_url: "https://github.com/netdata/netdata/edit/master/collectors/python.d.plugin/exim/README.md" -sidebar_label: "Exim" -learn_status: "Published" -learn_topic_type: "References" -learn_rel_path: "Integrations/Monitor/Webapps" ---> - -# Exim collector - -Simple module executing `exim -bpc` to grab exim queue. -This command can take a lot of time to finish its execution thus it is not recommended to run it every second. - -## Requirements - -The module uses the `exim` binary, which can only be executed as root by default. We need to allow other users to `exim` binary. We solve that adding `queue_list_requires_admin` statement in exim configuration and set to `false`, because it is `true` by default. On many Linux distributions, the default location of `exim` configuration is in `/etc/exim.conf`. - -1. Edit the `exim` configuration with your preferred editor and add: -`queue_list_requires_admin = false` -2. Restart `exim` and Netdata - -*WHM (CPanel) server* - -On a WHM server, you can reconfigure `exim` over the WHM interface with the following steps. - -1. Login to WHM -2. Navigate to Service Configuration --> Exim Configuration Manager --> tab Advanced Editor -3. Scroll down to the button **Add additional configuration setting** and click on it. -4. In the new dropdown which will appear above we need to find and choose: -`queue_list_requires_admin` and set to `false` -5. Scroll to the end and click the **Save** button. - -It produces only one chart: - -1. **Exim Queue Emails** - - - emails - -Configuration is not needed. - - - - -### Troubleshooting - -To troubleshoot issues with the `exim` module, run the `python.d.plugin` with the debug option enabled. The -output will give you the output of the data collection job or error messages on why the collector isn't working. - -First, navigate to your plugins directory, usually they are located under `/usr/libexec/netdata/plugins.d/`. If that's -not the case on your system, open `netdata.conf` and look for the setting `plugins directory`. Once you're in the -plugin's directory, switch to the `netdata` user. - -```bash -cd /usr/libexec/netdata/plugins.d/ -sudo su -s /bin/bash netdata -``` - -Now you can manually run the `exim` module in debug mode: - -```bash -./python.d.plugin exim debug trace -``` - +integrations/exim.md
\ No newline at end of file diff --git a/collectors/python.d.plugin/exim/integrations/exim.md b/collectors/python.d.plugin/exim/integrations/exim.md new file mode 100644 index 000000000..328d17870 --- /dev/null +++ b/collectors/python.d.plugin/exim/integrations/exim.md @@ -0,0 +1,180 @@ +<!--startmeta +custom_edit_url: "https://github.com/netdata/netdata/edit/master/collectors/python.d.plugin/exim/README.md" +meta_yaml: "https://github.com/netdata/netdata/edit/master/collectors/python.d.plugin/exim/metadata.yaml" +sidebar_label: "Exim" +learn_status: "Published" +learn_rel_path: "Data Collection/Mail Servers" +message: "DO NOT EDIT THIS FILE DIRECTLY, IT IS GENERATED BY THE COLLECTOR'S metadata.yaml FILE" +endmeta--> + +# Exim + + +<img src="https://netdata.cloud/img/exim.jpg" width="150"/> + + +Plugin: python.d.plugin +Module: exim + +<img src="https://img.shields.io/badge/maintained%20by-Netdata-%2300ab44" /> + +## Overview + +This collector monitors Exim mail queue. + +It uses the `exim` command line binary to get the statistics. + +This collector is supported on all platforms. + +This collector only supports collecting metrics from a single instance of this integration. + + +### Default Behavior + +#### Auto-Detection + +Assuming setup prerequisites are met, the collector will try to gather statistics using the method described above, even without any configuration. + +#### Limits + +The default configuration for this integration does not impose any limits on data collection. + +#### Performance Impact + +The default configuration for this integration is not expected to impose a significant performance impact on the system. + + +## Metrics + +Metrics grouped by *scope*. + +The scope defines the instance that the metric belongs to. An instance is uniquely identified by a set of labels. + + + +### Per Exim instance + +These metrics refer to the entire monitored application. + +This scope has no labels. + +Metrics: + +| Metric | Dimensions | Unit | +|:------|:----------|:----| +| exim.qemails | emails | emails | + + + +## Alerts + +There are no alerts configured by default for this integration. + + +## Setup + +### Prerequisites + +#### Exim configuration - local installation + +The module uses the `exim` binary, which can only be executed as root by default. We need to allow other users to `exim` binary. We solve that adding `queue_list_requires_admin` statement in exim configuration and set to `false`, because it is `true` by default. On many Linux distributions, the default location of `exim` configuration is in `/etc/exim.conf`. + +1. Edit the `exim` configuration with your preferred editor and add: +`queue_list_requires_admin = false` +2. Restart `exim` and Netdata + + +#### Exim configuration - WHM (CPanel) server + +On a WHM server, you can reconfigure `exim` over the WHM interface with the following steps. + +1. Login to WHM +2. Navigate to Service Configuration --> Exim Configuration Manager --> tab Advanced Editor +3. Scroll down to the button **Add additional configuration setting** and click on it. +4. In the new dropdown which will appear above we need to find and choose: +`queue_list_requires_admin` and set to `false` +5. Scroll to the end and click the **Save** button. + + + +### Configuration + +#### File + +The configuration file name for this integration is `python.d/exim.conf`. + + +You can edit the configuration file using the `edit-config` script from the +Netdata [config directory](https://github.com/netdata/netdata/blob/master/docs/configure/nodes.md#the-netdata-config-directory). + +```bash +cd /etc/netdata 2>/dev/null || cd /opt/netdata/etc/netdata +sudo ./edit-config python.d/exim.conf +``` +#### Options + +There are 2 sections: + +* Global variables +* One or more JOBS that can define multiple different instances to monitor. + +The following options can be defined globally: priority, penalty, autodetection_retry, update_every, but can also be defined per JOB to override the global values. + +Additionally, the following collapsed table contains all the options that can be configured inside a JOB definition. + +Every configuration JOB starts with a `job_name` value which will appear in the dashboard, unless a `name` parameter is specified. + + +<details><summary>Config options</summary> + +| Name | Description | Default | Required | +|:----|:-----------|:-------|:--------:| +| update_every | Sets the default data collection frequency. | 5 | False | +| priority | Controls the order of charts at the netdata dashboard. | 60000 | False | +| autodetection_retry | Sets the job re-check interval in seconds. | 0 | False | +| penalty | Indicates whether to apply penalty to update_every in case of failures. | yes | False | +| name | Job name. This value will overwrite the `job_name` value. JOBS with the same name are mutually exclusive. Only one of them will be allowed running at any time. This allows autodetection to try several alternatives and pick the one that works. | | False | +| command | Path and command to the `exim` binary | exim -bpc | False | + +</details> + +#### Examples + +##### Local exim install + +A basic local exim install + +```yaml +local: + command: 'exim -bpc' + +``` + + +## Troubleshooting + +### Debug Mode + +To troubleshoot issues with the `exim` collector, run the `python.d.plugin` with the debug option enabled. The output +should give you clues as to why the collector isn't working. + +- Navigate to the `plugins.d` directory, usually at `/usr/libexec/netdata/plugins.d/`. If that's not the case on + your system, open `netdata.conf` and look for the `plugins` setting under `[directories]`. + + ```bash + cd /usr/libexec/netdata/plugins.d/ + ``` + +- Switch to the `netdata` user. + + ```bash + sudo -u netdata -s + ``` + +- Run the `python.d.plugin` to debug the collector: + + ```bash + ./python.d.plugin exim debug trace + ``` + + diff --git a/collectors/python.d.plugin/fail2ban/README.md b/collectors/python.d.plugin/fail2ban/README.md index 41276d5f7..642a8bcf5 100644..120000 --- a/collectors/python.d.plugin/fail2ban/README.md +++ b/collectors/python.d.plugin/fail2ban/README.md @@ -1,105 +1 @@ -<!-- -title: "Fail2ban monitoring with Netdata" -custom_edit_url: "https://github.com/netdata/netdata/edit/master/collectors/python.d.plugin/fail2ban/README.md" -sidebar_label: "Fail2ban" -learn_status: "Published" -learn_topic_type: "References" -learn_rel_path: "Integrations/Monitor/Apps" ---> - -# Fail2ban collector - -Monitors the fail2ban log file to show all bans for all active jails. - -## Requirements - -The `fail2ban.log` file must be readable by the user `netdata`: - -- change the file ownership and access permissions. -- update `/etc/logrotate.d/fail2ban` to persists the changes after rotating the log file. - -<details> - <summary>Click to expand the instruction.</summary> - -To change the file ownership and access permissions, execute the following: - -```shell -sudo chown root:netdata /var/log/fail2ban.log -sudo chmod 640 /var/log/fail2ban.log -``` - -To persist the changes after rotating the log file, add `create 640 root netdata` to the `/etc/logrotate.d/fail2ban`: - -```shell -/var/log/fail2ban.log { - - weekly - rotate 4 - compress - - delaycompress - missingok - postrotate - fail2ban-client flushlogs 1>/dev/null - endscript - - # If fail2ban runs as non-root it still needs to have write access - # to logfiles. - # create 640 fail2ban adm - create 640 root netdata -} -``` - -</details> - -## Charts - -- Failed attempts in attempts/s -- Bans in bans/s -- Banned IP addresses (since the last restart of netdata) in ips - -## Configuration - -Edit the `python.d/fail2ban.conf` configuration file using `edit-config` from the -Netdata [config directory](https://github.com/netdata/netdata/blob/master/docs/configure/nodes.md), which is typically at `/etc/netdata`. - -```bash -cd /etc/netdata # Replace this path with your Netdata config directory, if different -sudo ./edit-config python.d/fail2ban.conf -``` - -Sample: - -```yaml -local: - log_path: '/var/log/fail2ban.log' - conf_path: '/etc/fail2ban/jail.local' - exclude: 'dropbear apache' -``` - -If no configuration is given, module will attempt to read log file at `/var/log/fail2ban.log` and conf file -at `/etc/fail2ban/jail.local`. If conf file is not found default jail is `ssh`. - - - - -### Troubleshooting - -To troubleshoot issues with the `fail2ban` module, run the `python.d.plugin` with the debug option enabled. The -output will give you the output of the data collection job or error messages on why the collector isn't working. - -First, navigate to your plugins directory, usually they are located under `/usr/libexec/netdata/plugins.d/`. If that's -not the case on your system, open `netdata.conf` and look for the setting `plugins directory`. Once you're in the -plugin's directory, switch to the `netdata` user. - -```bash -cd /usr/libexec/netdata/plugins.d/ -sudo su -s /bin/bash netdata -``` - -Now you can manually run the `fail2ban` module in debug mode: - -```bash -./python.d.plugin fail2ban debug trace -``` - +integrations/fail2ban.md
\ No newline at end of file diff --git a/collectors/python.d.plugin/fail2ban/integrations/fail2ban.md b/collectors/python.d.plugin/fail2ban/integrations/fail2ban.md new file mode 100644 index 000000000..64bfe21ba --- /dev/null +++ b/collectors/python.d.plugin/fail2ban/integrations/fail2ban.md @@ -0,0 +1,208 @@ +<!--startmeta +custom_edit_url: "https://github.com/netdata/netdata/edit/master/collectors/python.d.plugin/fail2ban/README.md" +meta_yaml: "https://github.com/netdata/netdata/edit/master/collectors/python.d.plugin/fail2ban/metadata.yaml" +sidebar_label: "Fail2ban" +learn_status: "Published" +learn_rel_path: "Data Collection/Authentication and Authorization" +message: "DO NOT EDIT THIS FILE DIRECTLY, IT IS GENERATED BY THE COLLECTOR'S metadata.yaml FILE" +endmeta--> + +# Fail2ban + + +<img src="https://netdata.cloud/img/fail2ban.png" width="150"/> + + +Plugin: python.d.plugin +Module: fail2ban + +<img src="https://img.shields.io/badge/maintained%20by-Netdata-%2300ab44" /> + +## Overview + +Monitor Fail2ban performance for prime intrusion prevention operations. Monitor ban counts, jail statuses, and failed login attempts to ensure robust network security. + + +It collects metrics through reading the default log and configuration files of fail2ban. + + +This collector is supported on all platforms. + +This collector supports collecting metrics from multiple instances of this integration, including remote instances. + +The `fail2ban.log` file must be readable by the user `netdata`. + - change the file ownership and access permissions. + - update `/etc/logrotate.d/fail2ban`` to persist the changes after rotating the log file. + +To change the file ownership and access permissions, execute the following: + +```shell +sudo chown root:netdata /var/log/fail2ban.log +sudo chmod 640 /var/log/fail2ban.log +``` + +To persist the changes after rotating the log file, add `create 640 root netdata` to the `/etc/logrotate.d/fail2ban`: + +```shell +/var/log/fail2ban.log { + + weekly + rotate 4 + compress + + delaycompress + missingok + postrotate + fail2ban-client flushlogs 1>/dev/null + endscript + + # If fail2ban runs as non-root it still needs to have write access + # to logfiles. + # create 640 fail2ban adm + create 640 root netdata +} +``` + + +### Default Behavior + +#### Auto-Detection + +By default the collector will attempt to read log file at /var/log/fail2ban.log and conf file at /etc/fail2ban/jail.local. +If conf file is not found default jail is ssh. + + +#### Limits + +The default configuration for this integration does not impose any limits on data collection. + +#### Performance Impact + +The default configuration for this integration is not expected to impose a significant performance impact on the system. + + +## Metrics + +Metrics grouped by *scope*. + +The scope defines the instance that the metric belongs to. An instance is uniquely identified by a set of labels. + + + +### Per Fail2ban instance + +These metrics refer to the entire monitored application. + + +This scope has no labels. + +Metrics: + +| Metric | Dimensions | Unit | +|:------|:----------|:----| +| fail2ban.failed_attempts | a dimension per jail | attempts/s | +| fail2ban.bans | a dimension per jail | bans/s | +| fail2ban.banned_ips | a dimension per jail | ips | + + + +## Alerts + +There are no alerts configured by default for this integration. + + +## Setup + +### Prerequisites + +No action required. + +### Configuration + +#### File + +The configuration file name for this integration is `python.d/fail2ban.conf`. + + +You can edit the configuration file using the `edit-config` script from the +Netdata [config directory](https://github.com/netdata/netdata/blob/master/docs/configure/nodes.md#the-netdata-config-directory). + +```bash +cd /etc/netdata 2>/dev/null || cd /opt/netdata/etc/netdata +sudo ./edit-config python.d/fail2ban.conf +``` +#### Options + +There are 2 sections: + +* Global variables +* One or more JOBS that can define multiple different instances to monitor. + +The following options can be defined globally: priority, penalty, autodetection_retry, update_every, but can also be defined per JOB to override the global values. + +Additionally, the following collapsed table contains all the options that can be configured inside a JOB definition. + +Every configuration JOB starts with a `job_name` value which will appear in the dashboard, unless a `name` parameter is specified. + + +<details><summary>Config options</summary> + +| Name | Description | Default | Required | +|:----|:-----------|:-------|:--------:| +| log_path | path to fail2ban.log. | /var/log/fail2ban.log | False | +| conf_path | path to jail.local/jail.conf. | /etc/fail2ban/jail.local | False | +| conf_dir | path to jail.d/. | /etc/fail2ban/jail.d/ | False | +| exclude | jails you want to exclude from autodetection. | | False | +| update_every | Sets the default data collection frequency. | 1 | False | +| priority | Controls the order of charts at the netdata dashboard. | 60000 | False | +| autodetection_retry | Sets the job re-check interval in seconds. | 0 | False | +| penalty | Indicates whether to apply penalty to update_every in case of failures. | yes | False | +| name | Job name. This value will overwrite the `job_name` value. JOBS with the same name are mutually exclusive. Only one of them will be allowed running at any time. This allows autodetection to try several alternatives and pick the one that works. | | False | + +</details> + +#### Examples + +##### Basic + +A basic example configuration. + +```yaml +local: + log_path: '/var/log/fail2ban.log' + conf_path: '/etc/fail2ban/jail.local' + +``` + + +## Troubleshooting + +### Debug Mode + +To troubleshoot issues with the `fail2ban` collector, run the `python.d.plugin` with the debug option enabled. The output +should give you clues as to why the collector isn't working. + +- Navigate to the `plugins.d` directory, usually at `/usr/libexec/netdata/plugins.d/`. If that's not the case on + your system, open `netdata.conf` and look for the `plugins` setting under `[directories]`. + + ```bash + cd /usr/libexec/netdata/plugins.d/ + ``` + +- Switch to the `netdata` user. + + ```bash + sudo -u netdata -s + ``` + +- Run the `python.d.plugin` to debug the collector: + + ```bash + ./python.d.plugin fail2ban debug trace + ``` + +### Debug Mode + + + + diff --git a/collectors/python.d.plugin/fail2ban/metadata.yaml b/collectors/python.d.plugin/fail2ban/metadata.yaml index 80aa68b62..61f762679 100644 --- a/collectors/python.d.plugin/fail2ban/metadata.yaml +++ b/collectors/python.d.plugin/fail2ban/metadata.yaml @@ -35,29 +35,29 @@ modules: The `fail2ban.log` file must be readable by the user `netdata`. - change the file ownership and access permissions. - update `/etc/logrotate.d/fail2ban`` to persist the changes after rotating the log file. - + To change the file ownership and access permissions, execute the following: - + ```shell sudo chown root:netdata /var/log/fail2ban.log sudo chmod 640 /var/log/fail2ban.log ``` - + To persist the changes after rotating the log file, add `create 640 root netdata` to the `/etc/logrotate.d/fail2ban`: - + ```shell /var/log/fail2ban.log { - + weekly rotate 4 compress - + delaycompress missingok postrotate fail2ban-client flushlogs 1>/dev/null endscript - + # If fail2ban runs as non-root it still needs to have write access # to logfiles. # create 640 fail2ban adm @@ -67,7 +67,8 @@ modules: default_behavior: auto_detection: description: | - By default the collector will attempt to read log file at /var/log/fail2ban.log and conf file at /etc/fail2ban/jail.local. If conf file is not found default jail is ssh. + By default the collector will attempt to read log file at /var/log/fail2ban.log and conf file at /etc/fail2ban/jail.local. + If conf file is not found default jail is ssh. limits: description: "" performance_impact: @@ -77,19 +78,19 @@ modules: list: [] configuration: file: - name: "" + name: python.d/fail2ban.conf description: "" options: description: | There are 2 sections: - + * Global variables * One or more JOBS that can define multiple different instances to monitor. - + The following options can be defined globally: priority, penalty, autodetection_retry, update_every, but can also be defined per JOB to override the global values. - + Additionally, the following collapsed table contains all the options that can be configured inside a JOB definition. - + Every configuration JOB starts with a `job_name` value which will appear in the dashboard, unless a `name` parameter is specified. folding: title: Config options @@ -146,7 +147,26 @@ modules: conf_path: '/etc/fail2ban/jail.local' troubleshooting: problems: - list: [] + list: + - name: Debug Mode + description: | + To troubleshoot issues with the `fail2ban` module, run the `python.d.plugin` with the debug option enabled. + The output will give you the output of the data collection job or error messages on why the collector isn't working. + + First, navigate to your plugins directory, usually they are located under `/usr/libexec/netdata/plugins.d/`. If that's + not the case on your system, open `netdata.conf` and look for the setting `plugins directory`. Once you're in the + plugin's directory, switch to the `netdata` user. + + ```bash + cd /usr/libexec/netdata/plugins.d/ + sudo su -s /bin/bash netdata + ``` + + Now you can manually run the `fail2ban` module in debug mode: + + ```bash + ./python.d.plugin fail2ban debug trace + ``` alerts: [] metrics: folding: diff --git a/collectors/python.d.plugin/gearman/README.md b/collectors/python.d.plugin/gearman/README.md index 329c34726..70189d698 100644..120000 --- a/collectors/python.d.plugin/gearman/README.md +++ b/collectors/python.d.plugin/gearman/README.md @@ -1,73 +1 @@ -<!-- -title: "Gearman monitoring with Netdata" -custom_edit_url: "https://github.com/netdata/netdata/edit/master/collectors/python.d.plugin/gearman/README.md" -sidebar_label: "Gearman" -learn_status: "Published" -learn_topic_type: "References" -learn_rel_path: "Integrations/Monitor/Distributed computing" ---> - -# Gearman collector - -Monitors Gearman worker statistics. A chart is shown for each job as well as one showing a summary of all workers. - -Note: Charts may show as a line graph rather than an area -graph if you load Netdata with no jobs running. To change -this go to "Settings" > "Which dimensions to show?" and -select "All". - -Plugin can obtain data from tcp socket **OR** unix socket. - -**Requirement:** -Socket MUST be readable by netdata user. - -It produces: - - * Workers queued - * Workers idle - * Workers running - -## Configuration - -Edit the `python.d/gearman.conf` configuration file using `edit-config` from the Netdata [config -directory](https://github.com/netdata/netdata/blob/master/docs/configure/nodes.md), which is typically at `/etc/netdata`. - -```bash -cd /etc/netdata # Replace this path with your Netdata config directory, if different -sudo ./edit-config python.d/gearman.conf -``` - -```yaml -localhost: - name : 'local' - host : 'localhost' - port : 4730 - - # TLS information can be provided as well - tls : no - cert : /path/to/cert - key : /path/to/key -``` - -When no configuration file is found, module tries to connect to TCP/IP socket: `localhost:4730`. - -### Troubleshooting - -To troubleshoot issues with the `gearman` module, run the `python.d.plugin` with the debug option enabled. The -output will give you the output of the data collection job or error messages on why the collector isn't working. - -First, navigate to your plugins directory, usually they are located under `/usr/libexec/netdata/plugins.d/`. If that's -not the case on your system, open `netdata.conf` and look for the setting `plugins directory`. Once you're in the -plugin's directory, switch to the `netdata` user. - -```bash -cd /usr/libexec/netdata/plugins.d/ -sudo su -s /bin/bash netdata -``` - -Now you can manually run the `gearman` module in debug mode: - -```bash -./python.d.plugin gearman debug trace -``` - +integrations/gearman.md
\ No newline at end of file diff --git a/collectors/python.d.plugin/gearman/integrations/gearman.md b/collectors/python.d.plugin/gearman/integrations/gearman.md new file mode 100644 index 000000000..f988e7448 --- /dev/null +++ b/collectors/python.d.plugin/gearman/integrations/gearman.md @@ -0,0 +1,209 @@ +<!--startmeta +custom_edit_url: "https://github.com/netdata/netdata/edit/master/collectors/python.d.plugin/gearman/README.md" +meta_yaml: "https://github.com/netdata/netdata/edit/master/collectors/python.d.plugin/gearman/metadata.yaml" +sidebar_label: "Gearman" +learn_status: "Published" +learn_rel_path: "Data Collection/Distributed Computing Systems" +message: "DO NOT EDIT THIS FILE DIRECTLY, IT IS GENERATED BY THE COLLECTOR'S metadata.yaml FILE" +endmeta--> + +# Gearman + + +<img src="https://netdata.cloud/img/gearman.png" width="150"/> + + +Plugin: python.d.plugin +Module: gearman + +<img src="https://img.shields.io/badge/maintained%20by-Netdata-%2300ab44" /> + +## Overview + +Monitor Gearman metrics for proficient system task distribution. Track job counts, worker statuses, and queue lengths for effective distributed task management. + +This collector connects to a Gearman instance via either TCP or unix socket. + +This collector is supported on all platforms. + +This collector supports collecting metrics from multiple instances of this integration, including remote instances. + + +### Default Behavior + +#### Auto-Detection + +When no configuration file is found, the collector tries to connect to TCP/IP socket: localhost:4730. + +#### Limits + +The default configuration for this integration does not impose any limits on data collection. + +#### Performance Impact + +The default configuration for this integration is not expected to impose a significant performance impact on the system. + + +## Metrics + +Metrics grouped by *scope*. + +The scope defines the instance that the metric belongs to. An instance is uniquely identified by a set of labels. + + + +### Per Gearman instance + +These metrics refer to the entire monitored application. + +This scope has no labels. + +Metrics: + +| Metric | Dimensions | Unit | +|:------|:----------|:----| +| gearman.total_jobs | Pending, Running | Jobs | + +### Per gearman job + +Metrics related to Gearman jobs. Each job produces its own set of the following metrics. + +This scope has no labels. + +Metrics: + +| Metric | Dimensions | Unit | +|:------|:----------|:----| +| gearman.single_job | Pending, Idle, Runnning | Jobs | + + + +## Alerts + + +The following alerts are available: + +| Alert name | On metric | Description | +|:------------|:----------|:------------| +| [ gearman_workers_queued ](https://github.com/netdata/netdata/blob/master/health/health.d/gearman.conf) | gearman.single_job | average number of queued jobs over the last 10 minutes | + + +## Setup + +### Prerequisites + +#### Socket permissions + +The gearman UNIX socket should have read permission for user netdata. + + +### Configuration + +#### File + +The configuration file name for this integration is `python.d/gearman.conf`. + + +You can edit the configuration file using the `edit-config` script from the +Netdata [config directory](https://github.com/netdata/netdata/blob/master/docs/configure/nodes.md#the-netdata-config-directory). + +```bash +cd /etc/netdata 2>/dev/null || cd /opt/netdata/etc/netdata +sudo ./edit-config python.d/gearman.conf +``` +#### Options + +There are 2 sections: + +* Global variables +* One or more JOBS that can define multiple different instances to monitor. + +The following options can be defined globally: priority, penalty, autodetection_retry, update_every, but can also be defined per JOB to override the global values. + +Additionally, the following collapsed table contains all the options that can be configured inside a JOB definition. + +Every configuration JOB starts with a `job_name` value which will appear in the dashboard, unless a `name` parameter is specified. + + +<details><summary>Config options</summary> + +| Name | Description | Default | Required | +|:----|:-----------|:-------|:--------:| +| update_every | Sets the default data collection frequency. | 5 | False | +| priority | Controls the order of charts at the netdata dashboard. | 60000 | False | +| autodetection_retry | Sets the job re-check interval in seconds. | 0 | False | +| penalty | Indicates whether to apply penalty to update_every in case of failures. | yes | False | +| name | Job name. This value will overwrite the `job_name` value. JOBS with the same name are mutually exclusive. Only one of them will be allowed running at any time. This allows autodetection to try several alternatives and pick the one that works. | | False | +| host | URL or IP where gearman is running. | localhost | False | +| port | Port of URL or IP where gearman is running. | 4730 | False | +| tls | Use tls to connect to gearman. | false | False | +| cert | Provide a certificate file if needed to connect to a TLS gearman instance. | | False | +| key | Provide a key file if needed to connect to a TLS gearman instance. | | False | + +</details> + +#### Examples + +##### Local gearman service + +A basic host and port gearman configuration for localhost. + +```yaml +localhost: + name: 'local' + host: 'localhost' + port: 4730 + +``` +##### Multi-instance + +> **Note**: When you define multiple jobs, their names must be unique. + +Collecting metrics from local and remote instances. + + +<details><summary>Config</summary> + +```yaml +localhost: + name: 'local' + host: 'localhost' + port: 4730 + +remote: + name: 'remote' + host: '192.0.2.1' + port: 4730 + +``` +</details> + + + +## Troubleshooting + +### Debug Mode + +To troubleshoot issues with the `gearman` collector, run the `python.d.plugin` with the debug option enabled. The output +should give you clues as to why the collector isn't working. + +- Navigate to the `plugins.d` directory, usually at `/usr/libexec/netdata/plugins.d/`. If that's not the case on + your system, open `netdata.conf` and look for the `plugins` setting under `[directories]`. + + ```bash + cd /usr/libexec/netdata/plugins.d/ + ``` + +- Switch to the `netdata` user. + + ```bash + sudo -u netdata -s + ``` + +- Run the `python.d.plugin` to debug the collector: + + ```bash + ./python.d.plugin gearman debug trace + ``` + + diff --git a/collectors/python.d.plugin/go_expvar/README.md b/collectors/python.d.plugin/go_expvar/README.md index f86fa6d04..f28a82f34 100644..120000 --- a/collectors/python.d.plugin/go_expvar/README.md +++ b/collectors/python.d.plugin/go_expvar/README.md @@ -1,342 +1 @@ -<!-- -title: "Go applications monitoring with Netdata" -custom_edit_url: "https://github.com/netdata/netdata/edit/master/collectors/python.d.plugin/go_expvar/README.md" -sidebar_label: "Go applications" -learn_status: "Published" -learn_topic_type: "References" -learn_rel_path: "Integrations/Monitor/Application Performance Monitoring" ---> - -# Go applications collector - -Monitors Go application that exposes its metrics with the use of `expvar` package from the Go standard library. The package produces charts for Go runtime memory statistics and optionally any number of custom charts. - -The `go_expvar` module produces the following charts: - -1. **Heap allocations** in kB - - - alloc: size of objects allocated on the heap - - inuse: size of allocated heap spans - -2. **Stack allocations** in kB - - - inuse: size of allocated stack spans - -3. **MSpan allocations** in kB - - - inuse: size of allocated mspan structures - -4. **MCache allocations** in kB - - - inuse: size of allocated mcache structures - -5. **Virtual memory** in kB - - - sys: size of reserved virtual address space - -6. **Live objects** - - - live: number of live objects in memory - -7. **GC pauses average** in ns - - - avg: average duration of all GC stop-the-world pauses - -## Monitoring Go applications - -Netdata can be used to monitor running Go applications that expose their metrics with -the use of the [expvar package](https://golang.org/pkg/expvar/) included in Go standard library. - -The `expvar` package exposes these metrics over HTTP and is very easy to use. -Consider this minimal sample below: - -```go -package main - -import ( - _ "expvar" - "net/http" -) - -func main() { - http.ListenAndServe("127.0.0.1:8080", nil) -} -``` - -When imported this way, the `expvar` package registers a HTTP handler at `/debug/vars` that -exposes Go runtime's memory statistics in JSON format. You can inspect the output by opening -the URL in your browser (or by using `wget` or `curl`). - -Sample output: - -```json -{ -"cmdline": ["./expvar-demo-binary"], -"memstats": {"Alloc":630856,"TotalAlloc":630856,"Sys":3346432,"Lookups":27, <omitted for brevity>} -} -``` - -You can of course expose and monitor your own variables as well. -Here is a sample Go application that exposes a few custom variables: - -```go -package main - -import ( - "expvar" - "net/http" - "runtime" - "time" -) - -func main() { - - tick := time.NewTicker(1 * time.Second) - num_go := expvar.NewInt("runtime.goroutines") - counters := expvar.NewMap("counters") - counters.Set("cnt1", new(expvar.Int)) - counters.Set("cnt2", new(expvar.Float)) - - go http.ListenAndServe(":8080", nil) - - for { - select { - case <- tick.C: - num_go.Set(int64(runtime.NumGoroutine())) - counters.Add("cnt1", 1) - counters.AddFloat("cnt2", 1.452) - } - } -} -``` - -Apart from the runtime memory stats, this application publishes two counters and the -number of currently running Goroutines and updates these stats every second. - -In the next section, we will cover how to monitor and chart these exposed stats with -the use of `netdata`s `go_expvar` module. - -### Using Netdata go_expvar module - -The `go_expvar` module is disabled by default. To enable it, edit `python.d.conf` (to edit it on your system run -`/etc/netdata/edit-config python.d.conf`), and change the `go_expvar` variable to `yes`: - -``` -# Enable / Disable python.d.plugin modules -#default_run: yes -# -# If "default_run" = "yes" the default for all modules is enabled (yes). -# Setting any of these to "no" will disable it. -# -# If "default_run" = "no" the default for all modules is disabled (no). -# Setting any of these to "yes" will enable it. -... -go_expvar: yes -... -``` - -Next, we need to edit the module configuration file (found at `/etc/netdata/python.d/go_expvar.conf` by default) (to -edit it on your system run `/etc/netdata/edit-config python.d/go_expvar.conf`). The module configuration consists of -jobs, where each job can be used to monitor a separate Go application. Let's see a sample job configuration: - -``` -# /etc/netdata/python.d/go_expvar.conf - -app1: - name : 'app1' - url : 'http://127.0.0.1:8080/debug/vars' - collect_memstats: true - extra_charts: {} -``` - -Let's go over each of the defined options: - -``` -name: 'app1' -``` - -This is the job name that will appear at the Netdata dashboard. -If not defined, the job_name (top level key) will be used. - -``` -url: 'http://127.0.0.1:8080/debug/vars' -``` - -This is the URL of the expvar endpoint. As the expvar handler can be installed -in a custom path, the whole URL has to be specified. This value is mandatory. - -``` -collect_memstats: true -``` - -Whether to enable collecting stats about Go runtime's memory. You can find more -information about the exposed values at the [runtime package docs](https://golang.org/pkg/runtime/#MemStats). - -``` -extra_charts: {} -``` - -Enables the user to specify custom expvars to monitor and chart. -Will be explained in more detail below. - -**Note: if `collect_memstats` is disabled and no `extra_charts` are defined, the plugin will -disable itself, as there will be no data to collect!** - -Apart from these options, each job supports options inherited from Netdata's `python.d.plugin` -and its base `UrlService` class. These are: - -``` -update_every: 1 # the job's data collection frequency -priority: 60000 # the job's order on the dashboard -user: admin # use when the expvar endpoint is protected by HTTP Basic Auth -password: sekret # use when the expvar endpoint is protected by HTTP Basic Auth -``` - -### Monitoring custom vars with go_expvar - -Now, memory stats might be useful, but what if you want Netdata to monitor some custom values -that your Go application exposes? The `go_expvar` module can do that as well with the use of -the `extra_charts` configuration variable. - -The `extra_charts` variable is a YaML list of Netdata chart definitions. -Each chart definition has the following keys: - -``` -id: Netdata chart ID -options: a key-value mapping of chart options -lines: a list of line definitions -``` - -**Note: please do not use dots in the chart or line ID field. -See [this issue](https://github.com/netdata/netdata/pull/1902#issuecomment-284494195) for explanation.** - -Please see these two links to the official Netdata documentation for more information about the values: - -- [External plugins - charts](https://github.com/netdata/netdata/blob/master/collectors/plugins.d/README.md#chart) -- [Chart variables](https://github.com/netdata/netdata/blob/master/collectors/python.d.plugin/README.md#global-variables-order-and-chart) - -**Line definitions** - -Each chart can define multiple lines (dimensions). -A line definition is a key-value mapping of line options. -Each line can have the following options: - -``` -# mandatory -expvar_key: the name of the expvar as present in the JSON output of /debug/vars endpoint -expvar_type: value type; supported are "float" or "int" -id: the id of this line/dimension in Netdata - -# optional - Netdata defaults are used if these options are not defined -name: '' -algorithm: absolute -multiplier: 1 -divisor: 100 if expvar_type == float, 1 if expvar_type == int -hidden: False -``` - -Please see the following link for more information about the options and their default values: -[External plugins - dimensions](https://github.com/netdata/netdata/blob/master/collectors/plugins.d/README.md#dimension) - -Apart from top-level expvars, this plugin can also parse expvars stored in a multi-level map; -All dicts in the resulting JSON document are then flattened to one level. -Expvar names are joined together with '.' when flattening. - -Example: - -``` -{ - "counters": {"cnt1": 1042, "cnt2": 1512.9839999999983}, - "runtime.goroutines": 5 -} -``` - -In the above case, the exported variables will be available under `runtime.goroutines`, -`counters.cnt1` and `counters.cnt2` expvar_keys. If the flattening results in a key collision, -the first defined key wins and all subsequent keys with the same name are ignored. - -## Enable the collector - -The `go_expvar` collector is disabled by default. To enable it, use `edit-config` from the Netdata [config -directory](https://github.com/netdata/netdata/blob/master/docs/configure/nodes.md), which is typically at `/etc/netdata`, to edit the `python.d.conf` file. - -```bash -cd /etc/netdata # Replace this path with your Netdata config directory, if different -sudo ./edit-config python.d.conf -``` - -Change the value of the `go_expvar` setting to `yes`. Save the file and restart the Netdata Agent with `sudo systemctl -restart netdata`, or the appropriate method for your system, to finish enabling the `go_expvar` collector. - -## Configuration - -Edit the `python.d/go_expvar.conf` configuration file using `edit-config` from the Netdata [config -directory](https://github.com/netdata/netdata/blob/master/docs/configure/nodes.md), which is typically at `/etc/netdata`. - -```bash -cd /etc/netdata # Replace this path with your Netdata config directory, if different -sudo ./edit-config python.d/go_expvar.conf -``` - -The configuration below matches the second Go application described above. -Netdata will monitor and chart memory stats for the application, as well as a custom chart of -running goroutines and two dummy counters. - -``` -app1: - name : 'app1' - url : 'http://127.0.0.1:8080/debug/vars' - collect_memstats: true - extra_charts: - - id: "runtime_goroutines" - options: - name: num_goroutines - title: "runtime: number of goroutines" - units: goroutines - family: runtime - context: expvar.runtime.goroutines - chart_type: line - lines: - - {expvar_key: 'runtime.goroutines', expvar_type: int, id: runtime_goroutines} - - id: "foo_counters" - options: - name: counters - title: "some random counters" - units: awesomeness - family: counters - context: expvar.foo.counters - chart_type: line - lines: - - {expvar_key: 'counters.cnt1', expvar_type: int, id: counters_cnt1} - - {expvar_key: 'counters.cnt2', expvar_type: float, id: counters_cnt2} -``` - -**Netdata charts example** - -The images below show how do the final charts in Netdata look. - - - - - - -### Troubleshooting - -To troubleshoot issues with the `go_expvar` module, run the `python.d.plugin` with the debug option enabled. The -output will give you the output of the data collection job or error messages on why the collector isn't working. - -First, navigate to your plugins directory, usually they are located under `/usr/libexec/netdata/plugins.d/`. If that's -not the case on your system, open `netdata.conf` and look for the setting `plugins directory`. Once you're in the -plugin's directory, switch to the `netdata` user. - -```bash -cd /usr/libexec/netdata/plugins.d/ -sudo su -s /bin/bash netdata -``` - -Now you can manually run the `go_expvar` module in debug mode: - -```bash -./python.d.plugin go_expvar debug trace -``` - +integrations/go_applications_expvar.md
\ No newline at end of file diff --git a/collectors/python.d.plugin/go_expvar/integrations/go_applications_expvar.md b/collectors/python.d.plugin/go_expvar/integrations/go_applications_expvar.md new file mode 100644 index 000000000..be4db4b70 --- /dev/null +++ b/collectors/python.d.plugin/go_expvar/integrations/go_applications_expvar.md @@ -0,0 +1,334 @@ +<!--startmeta +custom_edit_url: "https://github.com/netdata/netdata/edit/master/collectors/python.d.plugin/go_expvar/README.md" +meta_yaml: "https://github.com/netdata/netdata/edit/master/collectors/python.d.plugin/go_expvar/metadata.yaml" +sidebar_label: "Go applications (EXPVAR)" +learn_status: "Published" +learn_rel_path: "Data Collection/APM" +message: "DO NOT EDIT THIS FILE DIRECTLY, IT IS GENERATED BY THE COLLECTOR'S metadata.yaml FILE" +endmeta--> + +# Go applications (EXPVAR) + + +<img src="https://netdata.cloud/img/go.png" width="150"/> + + +Plugin: python.d.plugin +Module: go_expvar + +<img src="https://img.shields.io/badge/maintained%20by-Netdata-%2300ab44" /> + +## Overview + +This collector monitors Go applications that expose their metrics with the use of the `expvar` package from the Go standard library. It produces charts for Go runtime memory statistics and optionally any number of custom charts. + +It connects via http to gather the metrics exposed via the `expvar` package. + +This collector is supported on all platforms. + +This collector supports collecting metrics from multiple instances of this integration, including remote instances. + + +### Default Behavior + +#### Auto-Detection + +This integration doesn't support auto-detection. + +#### Limits + +The default configuration for this integration does not impose any limits on data collection. + +#### Performance Impact + +The default configuration for this integration is not expected to impose a significant performance impact on the system. + + +## Metrics + +Metrics grouped by *scope*. + +The scope defines the instance that the metric belongs to. An instance is uniquely identified by a set of labels. + + + +### Per Go applications (EXPVAR) instance + +These metrics refer to the entire monitored application. + +This scope has no labels. + +Metrics: + +| Metric | Dimensions | Unit | +|:------|:----------|:----| +| expvar.memstats.heap | alloc, inuse | KiB | +| expvar.memstats.stack | inuse | KiB | +| expvar.memstats.mspan | inuse | KiB | +| expvar.memstats.mcache | inuse | KiB | +| expvar.memstats.live_objects | live | objects | +| expvar.memstats.sys | sys | KiB | +| expvar.memstats.gc_pauses | avg | ns | + + + +## Alerts + +There are no alerts configured by default for this integration. + + +## Setup + +### Prerequisites + +#### Enable the go_expvar collector + +The `go_expvar` collector is disabled by default. To enable it, use `edit-config` from the Netdata [config directory](https://github.com/netdata/netdata/blob/master/docs/configure/nodes.md), which is typically at `/etc/netdata`, to edit the `python.d.conf` file. + +```bash +cd /etc/netdata # Replace this path with your Netdata config directory, if different +sudo ./edit-config python.d.conf +``` + +Change the value of the `go_expvar` setting to `yes`. Save the file and restart the Netdata Agent with `sudo systemctl restart netdata`, or the [appropriate method](https://github.com/netdata/netdata/blob/master/docs/configure/start-stop-restart.md) for your system. + + +#### Sample `expvar` usage in a Go application + +The `expvar` package exposes metrics over HTTP and is very easy to use. +Consider this minimal sample below: + +```go +package main + +import ( + _ "expvar" + "net/http" +) + +func main() { + http.ListenAndServe("127.0.0.1:8080", nil) +} +``` + +When imported this way, the `expvar` package registers a HTTP handler at `/debug/vars` that +exposes Go runtime's memory statistics in JSON format. You can inspect the output by opening +the URL in your browser (or by using `wget` or `curl`). + +Sample output: + +```json +{ +"cmdline": ["./expvar-demo-binary"], +"memstats": {"Alloc":630856,"TotalAlloc":630856,"Sys":3346432,"Lookups":27, <omitted for brevity>} +} +``` + +You can of course expose and monitor your own variables as well. +Here is a sample Go application that exposes a few custom variables: + +```go +package main + +import ( + "expvar" + "net/http" + "runtime" + "time" +) + +func main() { + + tick := time.NewTicker(1 * time.Second) + num_go := expvar.NewInt("runtime.goroutines") + counters := expvar.NewMap("counters") + counters.Set("cnt1", new(expvar.Int)) + counters.Set("cnt2", new(expvar.Float)) + + go http.ListenAndServe(":8080", nil) + + for { + select { + case <- tick.C: + num_go.Set(int64(runtime.NumGoroutine())) + counters.Add("cnt1", 1) + counters.AddFloat("cnt2", 1.452) + } + } +} +``` + +Apart from the runtime memory stats, this application publishes two counters and the +number of currently running Goroutines and updates these stats every second. + + + +### Configuration + +#### File + +The configuration file name for this integration is `python.d/go_expvar.conf`. + + +You can edit the configuration file using the `edit-config` script from the +Netdata [config directory](https://github.com/netdata/netdata/blob/master/docs/configure/nodes.md#the-netdata-config-directory). + +```bash +cd /etc/netdata 2>/dev/null || cd /opt/netdata/etc/netdata +sudo ./edit-config python.d/go_expvar.conf +``` +#### Options + +There are 2 sections: + +* Global variables +* One or more JOBS that can define multiple different instances to monitor. + +The following options can be defined globally: priority, penalty, autodetection_retry, update_every, but can also be defined per JOB to override the global values. + +Additionally, the following collapsed table contains all the options that can be configured inside a JOB definition. + +Every configuration JOB starts with a `job_name` value which will appear in the dashboard, unless a `name` parameter is specified. Each JOB can be used to monitor a different Go application. + + +<details><summary>Config options</summary> + +| Name | Description | Default | Required | +|:----|:-----------|:-------|:--------:| +| update_every | Sets the default data collection frequency. | 5 | False | +| priority | Controls the order of charts at the netdata dashboard. | 60000 | False | +| autodetection_retry | Sets the job re-check interval in seconds. | 0 | False | +| penalty | Indicates whether to apply penalty to update_every in case of failures. | yes | False | +| name | Job name. This value will overwrite the `job_name` value. JOBS with the same name are mutually exclusive. Only one of them will be allowed running at any time. This allows autodetection to try several alternatives and pick the one that works. | | False | +| url | the URL and port of the expvar endpoint. Please include the whole path of the endpoint, as the expvar handler can be installed in a non-standard location. | | True | +| user | If the URL is password protected, this is the username to use. | | False | +| pass | If the URL is password protected, this is the password to use. | | False | +| collect_memstats | Enables charts for Go runtime's memory statistics. | | False | +| extra_charts | Defines extra data/charts to monitor, please see the example below. | | False | + +</details> + +#### Examples + +##### Monitor a Go app1 application + +The example below sets a configuration for a Go application, called `app1`. Besides the `memstats`, the application also exposes two counters and the number of currently running Goroutines and updates these stats every second. + +The `go_expvar` collector can monitor these as well with the use of the `extra_charts` configuration variable. + +The `extra_charts` variable is a YaML list of Netdata chart definitions. +Each chart definition has the following keys: + +``` +id: Netdata chart ID +options: a key-value mapping of chart options +lines: a list of line definitions +``` + +**Note: please do not use dots in the chart or line ID field. +See [this issue](https://github.com/netdata/netdata/pull/1902#issuecomment-284494195) for explanation.** + +Please see these two links to the official Netdata documentation for more information about the values: + +- [External plugins - charts](https://github.com/netdata/netdata/blob/master/collectors/plugins.d/README.md#chart) +- [Chart variables](https://github.com/netdata/netdata/blob/master/collectors/python.d.plugin/README.md#global-variables-order-and-chart) + +**Line definitions** + +Each chart can define multiple lines (dimensions). +A line definition is a key-value mapping of line options. +Each line can have the following options: + +``` +# mandatory +expvar_key: the name of the expvar as present in the JSON output of /debug/vars endpoint +expvar_type: value type; supported are "float" or "int" +id: the id of this line/dimension in Netdata + +# optional - Netdata defaults are used if these options are not defined +name: '' +algorithm: absolute +multiplier: 1 +divisor: 100 if expvar_type == float, 1 if expvar_type == int +hidden: False +``` + +Please see the following link for more information about the options and their default values: +[External plugins - dimensions](https://github.com/netdata/netdata/blob/master/collectors/plugins.d/README.md#dimension) + +Apart from top-level expvars, this plugin can also parse expvars stored in a multi-level map; +All dicts in the resulting JSON document are then flattened to one level. +Expvar names are joined together with '.' when flattening. + +Example: + +``` +{ + "counters": {"cnt1": 1042, "cnt2": 1512.9839999999983}, + "runtime.goroutines": 5 +} +``` + +In the above case, the exported variables will be available under `runtime.goroutines`, +`counters.cnt1` and `counters.cnt2` expvar_keys. If the flattening results in a key collision, +the first defined key wins and all subsequent keys with the same name are ignored. + + +```yaml +app1: + name : 'app1' + url : 'http://127.0.0.1:8080/debug/vars' + collect_memstats: true + extra_charts: + - id: "runtime_goroutines" + options: + name: num_goroutines + title: "runtime: number of goroutines" + units: goroutines + family: runtime + context: expvar.runtime.goroutines + chart_type: line + lines: + - {expvar_key: 'runtime.goroutines', expvar_type: int, id: runtime_goroutines} + - id: "foo_counters" + options: + name: counters + title: "some random counters" + units: awesomeness + family: counters + context: expvar.foo.counters + chart_type: line + lines: + - {expvar_key: 'counters.cnt1', expvar_type: int, id: counters_cnt1} + - {expvar_key: 'counters.cnt2', expvar_type: float, id: counters_cnt2} + +``` + + +## Troubleshooting + +### Debug Mode + +To troubleshoot issues with the `go_expvar` collector, run the `python.d.plugin` with the debug option enabled. The output +should give you clues as to why the collector isn't working. + +- Navigate to the `plugins.d` directory, usually at `/usr/libexec/netdata/plugins.d/`. If that's not the case on + your system, open `netdata.conf` and look for the `plugins` setting under `[directories]`. + + ```bash + cd /usr/libexec/netdata/plugins.d/ + ``` + +- Switch to the `netdata` user. + + ```bash + sudo -u netdata -s + ``` + +- Run the `python.d.plugin` to debug the collector: + + ```bash + ./python.d.plugin go_expvar debug trace + ``` + + diff --git a/collectors/python.d.plugin/go_expvar/metadata.yaml b/collectors/python.d.plugin/go_expvar/metadata.yaml index 92669dd9c..9419b024a 100644 --- a/collectors/python.d.plugin/go_expvar/metadata.yaml +++ b/collectors/python.d.plugin/go_expvar/metadata.yaml @@ -4,7 +4,7 @@ modules: plugin_name: python.d.plugin module_name: go_expvar monitored_instance: - name: Go applications + name: Go applications (EXPVAR) link: "https://pkg.go.dev/expvar" categories: - data-collection.apm @@ -39,6 +39,16 @@ modules: setup: prerequisites: list: + - title: "Enable the go_expvar collector" + description: | + The `go_expvar` collector is disabled by default. To enable it, use `edit-config` from the Netdata [config directory](https://github.com/netdata/netdata/blob/master/docs/configure/nodes.md), which is typically at `/etc/netdata`, to edit the `python.d.conf` file. + + ```bash + cd /etc/netdata # Replace this path with your Netdata config directory, if different + sudo ./edit-config python.d.conf + ``` + + Change the value of the `go_expvar` setting to `yes`. Save the file and restart the Netdata Agent with `sudo systemctl restart netdata`, or the [appropriate method](https://github.com/netdata/netdata/blob/master/docs/configure/start-stop-restart.md) for your system. - title: "Sample `expvar` usage in a Go application" description: | The `expvar` package exposes metrics over HTTP and is very easy to use. diff --git a/collectors/python.d.plugin/hddtemp/README.md b/collectors/python.d.plugin/hddtemp/README.md index b42da7346..95c7593f8 100644..120000 --- a/collectors/python.d.plugin/hddtemp/README.md +++ b/collectors/python.d.plugin/hddtemp/README.md @@ -1,61 +1 @@ -<!-- -title: "Hard drive temperature monitoring with Netdata" -custom_edit_url: "https://github.com/netdata/netdata/edit/master/collectors/python.d.plugin/hddtemp/README.md" -sidebar_label: "Hard drive temperature" -learn_status: "Published" -learn_topic_type: "References" -learn_rel_path: "Integrations/Monitor/Hardware" ---> - -# Hard drive temperature collector - -Monitors disk temperatures from one or more `hddtemp` daemons. - -**Requirement:** -Running `hddtemp` in daemonized mode with access on tcp port - -It produces one chart **Temperature** with dynamic number of dimensions (one per disk) - -## Configuration - -Edit the `python.d/hddtemp.conf` configuration file using `edit-config` from the Netdata [config -directory](https://github.com/netdata/netdata/blob/master/docs/configure/nodes.md), which is typically at `/etc/netdata`. - -```bash -cd /etc/netdata # Replace this path with your Netdata config directory, if different -sudo ./edit-config python.d/hddtemp.conf -``` - -Sample: - -```yaml -update_every: 3 -host: "127.0.0.1" -port: 7634 -``` - -If no configuration is given, module will attempt to connect to hddtemp daemon on `127.0.0.1:7634` address - - - - -### Troubleshooting - -To troubleshoot issues with the `hddtemp` module, run the `python.d.plugin` with the debug option enabled. The -output will give you the output of the data collection job or error messages on why the collector isn't working. - -First, navigate to your plugins directory, usually they are located under `/usr/libexec/netdata/plugins.d/`. If that's -not the case on your system, open `netdata.conf` and look for the setting `plugins directory`. Once you're in the -plugin's directory, switch to the `netdata` user. - -```bash -cd /usr/libexec/netdata/plugins.d/ -sudo su -s /bin/bash netdata -``` - -Now you can manually run the `hddtemp` module in debug mode: - -```bash -./python.d.plugin hddtemp debug trace -``` - +integrations/hdd_temperature.md
\ No newline at end of file diff --git a/collectors/python.d.plugin/hddtemp/integrations/hdd_temperature.md b/collectors/python.d.plugin/hddtemp/integrations/hdd_temperature.md new file mode 100644 index 000000000..29512bba3 --- /dev/null +++ b/collectors/python.d.plugin/hddtemp/integrations/hdd_temperature.md @@ -0,0 +1,216 @@ +<!--startmeta +custom_edit_url: "https://github.com/netdata/netdata/edit/master/collectors/python.d.plugin/hddtemp/README.md" +meta_yaml: "https://github.com/netdata/netdata/edit/master/collectors/python.d.plugin/hddtemp/metadata.yaml" +sidebar_label: "HDD temperature" +learn_status: "Published" +learn_rel_path: "Data Collection/Hardware Devices and Sensors" +message: "DO NOT EDIT THIS FILE DIRECTLY, IT IS GENERATED BY THE COLLECTOR'S metadata.yaml FILE" +endmeta--> + +# HDD temperature + + +<img src="https://netdata.cloud/img/hard-drive.svg" width="150"/> + + +Plugin: python.d.plugin +Module: hddtemp + +<img src="https://img.shields.io/badge/maintained%20by-Netdata-%2300ab44" /> + +## Overview + +This collector monitors disk temperatures. + + +It uses the `hddtemp` daemon to gather the metrics. + + +This collector is only supported on the following platforms: + +- Linux + +This collector supports collecting metrics from multiple instances of this integration, including remote instances. + + +### Default Behavior + +#### Auto-Detection + +By default, this collector will attempt to connect to the `hddtemp` daemon on `127.0.0.1:7634` + +#### Limits + +The default configuration for this integration does not impose any limits on data collection. + +#### Performance Impact + +The default configuration for this integration is not expected to impose a significant performance impact on the system. + + +## Metrics + +Metrics grouped by *scope*. + +The scope defines the instance that the metric belongs to. An instance is uniquely identified by a set of labels. + + + +### Per HDD temperature instance + +These metrics refer to the entire monitored application. + +This scope has no labels. + +Metrics: + +| Metric | Dimensions | Unit | +|:------|:----------|:----| +| hddtemp.temperatures | a dimension per disk | Celsius | + + + +## Alerts + +There are no alerts configured by default for this integration. + + +## Setup + +### Prerequisites + +#### Run `hddtemp` in daemon mode + +You can execute `hddtemp` in TCP/IP daemon mode by using the `-d` argument. + +So running `hddtemp -d` would run the daemon, by default on port 7634. + + + +### Configuration + +#### File + +The configuration file name for this integration is `python.d/hddtemp.conf`. + + +You can edit the configuration file using the `edit-config` script from the +Netdata [config directory](https://github.com/netdata/netdata/blob/master/docs/configure/nodes.md#the-netdata-config-directory). + +```bash +cd /etc/netdata 2>/dev/null || cd /opt/netdata/etc/netdata +sudo ./edit-config python.d/hddtemp.conf +``` +#### Options + +There are 2 sections: + +* Global variables +* One or more JOBS that can define multiple different instances to monitor. + +The following options can be defined globally: priority, penalty, autodetection_retry, update_every, but can also be defined per JOB to override the global values. + +Additionally, the following collapsed table contains all the options that can be configured inside a JOB definition. + +Every configuration JOB starts with a `job_name` value which will appear in the dashboard, unless a `name` parameter is specified. + +By default this collector will try to autodetect disks (autodetection works only for disk which names start with "sd"). However this can be overridden by setting the option `disks` to an array of desired disks. + + +<details><summary>Config options</summary> + +| Name | Description | Default | Required | +|:----|:-----------|:-------|:--------:| +| update_every | Sets the default data collection frequency. | 1 | False | +| priority | Controls the order of charts at the netdata dashboard. | 60000 | False | +| autodetection_retry | Sets the job re-check interval in seconds. | 0 | False | +| penalty | Indicates whether to apply penalty to update_every in case of failures. | yes | False | +| name | Job name. This value will overwrite the `job_name` value. JOBS with the same name are mutually exclusive. Only one of them will be allowed running at any time. This allows autodetection to try several alternatives and pick the one that works. | local | False | +| devices | Array of desired disks to detect, in case their name doesn't start with `sd`. | | False | +| host | The IP or HOSTNAME to connect to. | localhost | True | +| port | The port to connect to. | 7634 | False | + +</details> + +#### Examples + +##### Basic + +A basic example configuration. + +```yaml +localhost: + name: 'local' + host: '127.0.0.1' + port: 7634 + +``` +##### Custom disk names + +An example defining the disk names to detect. + +<details><summary>Config</summary> + +```yaml +localhost: + name: 'local' + host: '127.0.0.1' + port: 7634 + devices: + - customdisk1 + - customdisk2 + +``` +</details> + +##### Multi-instance + +> **Note**: When you define multiple jobs, their names must be unique. + +Collecting metrics from local and remote instances. + + +<details><summary>Config</summary> + +```yaml +localhost: + name: 'local' + host: '127.0.0.1' + port: 7634 + +remote_job: + name : 'remote' + host : 'http://192.0.2.1:2812' + +``` +</details> + + + +## Troubleshooting + +### Debug Mode + +To troubleshoot issues with the `hddtemp` collector, run the `python.d.plugin` with the debug option enabled. The output +should give you clues as to why the collector isn't working. + +- Navigate to the `plugins.d` directory, usually at `/usr/libexec/netdata/plugins.d/`. If that's not the case on + your system, open `netdata.conf` and look for the `plugins` setting under `[directories]`. + + ```bash + cd /usr/libexec/netdata/plugins.d/ + ``` + +- Switch to the `netdata` user. + + ```bash + sudo -u netdata -s + ``` + +- Run the `python.d.plugin` to debug the collector: + + ```bash + ./python.d.plugin hddtemp debug trace + ``` + + diff --git a/collectors/python.d.plugin/hddtemp/metadata.yaml b/collectors/python.d.plugin/hddtemp/metadata.yaml index ee62dc96d..d8b56fc66 100644 --- a/collectors/python.d.plugin/hddtemp/metadata.yaml +++ b/collectors/python.d.plugin/hddtemp/metadata.yaml @@ -105,7 +105,7 @@ modules: examples: folding: enabled: true - title: "" + title: "Config" list: - name: Basic description: A basic example configuration. diff --git a/collectors/python.d.plugin/hpssa/README.md b/collectors/python.d.plugin/hpssa/README.md index 12b250475..82802d8b4 100644..120000 --- a/collectors/python.d.plugin/hpssa/README.md +++ b/collectors/python.d.plugin/hpssa/README.md @@ -1,106 +1 @@ -<!-- -title: "HP Smart Storage Arrays monitoring with Netdata" -custom_edit_url: "https://github.com/netdata/netdata/edit/master/collectors/python.d.plugin/hpssa/README.md" -sidebar_label: "HP Smart Storage Arrays" -learn_status: "Published" -learn_topic_type: "References" -learn_rel_path: "Integrations/Monitor/Storage" ---> - -# HP Smart Storage Arrays collector - -Monitors controller, cache module, logical and physical drive state and temperature using `ssacli` tool. - -Executed commands: - -- `sudo -n ssacli ctrl all show config detail` - -## Requirements: - -This module uses `ssacli`, which can only be executed by root. It uses -`sudo` and assumes that it is configured such that the `netdata` user can execute `ssacli` as root without a password. - -- Add to your `/etc/sudoers` file: - -`which ssacli` shows the full path to the binary. - -```bash -netdata ALL=(root) NOPASSWD: /path/to/ssacli -``` - -- Reset Netdata's systemd - unit [CapabilityBoundingSet](https://www.freedesktop.org/software/systemd/man/systemd.exec.html#Capabilities) (Linux - distributions with systemd) - -The default CapabilityBoundingSet doesn't allow using `sudo`, and is quite strict in general. Resetting is not optimal, but a next-best solution given the inability to execute `ssacli` using `sudo`. - -As the `root` user, do the following: - -```cmd -mkdir /etc/systemd/system/netdata.service.d -echo -e '[Service]\nCapabilityBoundingSet=~' | tee /etc/systemd/system/netdata.service.d/unset-capability-bounding-set.conf -systemctl daemon-reload -systemctl restart netdata.service -``` - -## Charts - -- Controller status -- Controller temperature -- Logical drive status -- Physical drive status -- Physical drive temperature - -## Enable the collector - -The `hpssa` collector is disabled by default. To enable it, use `edit-config` from the -Netdata [config directory](https://github.com/netdata/netdata/blob/master/docs/configure/nodes.md), which is typically at `/etc/netdata`, to edit the `python.d.conf` -file. - -```bash -cd /etc/netdata # Replace this path with your Netdata config directory, if different -sudo ./edit-config python.d.conf -``` - -Change the value of the `hpssa` setting to `yes`. Save the file and restart the Netdata Agent with `sudo systemctl -restart netdata`, or the [appropriate method](https://github.com/netdata/netdata/blob/master/docs/configure/start-stop-restart.md) for your system. - -## Configuration - -Edit the `python.d/hpssa.conf` configuration file using `edit-config` from the -Netdata [config directory](https://github.com/netdata/netdata/blob/master/docs/configure/nodes.md), which is typically at `/etc/netdata`. - -```bash -cd /etc/netdata # Replace this path with your Netdata config directory, if different -sudo ./edit-config python.d/hpssa.conf -``` - -If `ssacli` cannot be found in the `PATH`, configure it in `hpssa.conf`. - -```yaml -ssacli_path: /usr/sbin/ssacli -``` - -Save the file and restart the Netdata Agent with `sudo systemctl restart netdata`, or the [appropriate -method](https://github.com/netdata/netdata/blob/master/docs/configure/start-stop-restart.md) for your system. - -### Troubleshooting - -To troubleshoot issues with the `hpssa` module, run the `python.d.plugin` with the debug option enabled. The -output will give you the output of the data collection job or error messages on why the collector isn't working. - -First, navigate to your plugins directory, usually they are located under `/usr/libexec/netdata/plugins.d/`. If that's -not the case on your system, open `netdata.conf` and look for the setting `plugins directory`. Once you're in the -plugin's directory, switch to the `netdata` user. - -```bash -cd /usr/libexec/netdata/plugins.d/ -sudo su -s /bin/bash netdata -``` - -Now you can manually run the `hpssa` module in debug mode: - -```bash -./python.d.plugin hpssa debug trace -``` - +integrations/hp_smart_storage_arrays.md
\ No newline at end of file diff --git a/collectors/python.d.plugin/hpssa/integrations/hp_smart_storage_arrays.md b/collectors/python.d.plugin/hpssa/integrations/hp_smart_storage_arrays.md new file mode 100644 index 000000000..8ec7a5c5c --- /dev/null +++ b/collectors/python.d.plugin/hpssa/integrations/hp_smart_storage_arrays.md @@ -0,0 +1,204 @@ +<!--startmeta +custom_edit_url: "https://github.com/netdata/netdata/edit/master/collectors/python.d.plugin/hpssa/README.md" +meta_yaml: "https://github.com/netdata/netdata/edit/master/collectors/python.d.plugin/hpssa/metadata.yaml" +sidebar_label: "HP Smart Storage Arrays" +learn_status: "Published" +learn_rel_path: "Data Collection/Storage, Mount Points and Filesystems" +message: "DO NOT EDIT THIS FILE DIRECTLY, IT IS GENERATED BY THE COLLECTOR'S metadata.yaml FILE" +endmeta--> + +# HP Smart Storage Arrays + + +<img src="https://netdata.cloud/img/hp.svg" width="150"/> + + +Plugin: python.d.plugin +Module: hpssa + +<img src="https://img.shields.io/badge/maintained%20by-Netdata-%2300ab44" /> + +## Overview + +This collector monitors HP Smart Storage Arrays metrics about operational statuses and temperatures. + +It uses the command line tool `ssacli`. The exact command used is `sudo -n ssacli ctrl all show config detail` + +This collector is supported on all platforms. + +This collector only supports collecting metrics from a single instance of this integration. + + +### Default Behavior + +#### Auto-Detection + +If no configuration is provided, the collector will try to execute the `ssacli` binary. + +#### Limits + +The default configuration for this integration does not impose any limits on data collection. + +#### Performance Impact + +The default configuration for this integration is not expected to impose a significant performance impact on the system. + + +## Metrics + +Metrics grouped by *scope*. + +The scope defines the instance that the metric belongs to. An instance is uniquely identified by a set of labels. + + + +### Per HP Smart Storage Arrays instance + +These metrics refer to the entire monitored application. + +This scope has no labels. + +Metrics: + +| Metric | Dimensions | Unit | +|:------|:----------|:----| +| hpssa.ctrl_status | ctrl_{adapter slot}_status, cache_{adapter slot}_status, battery_{adapter slot}_status per adapter | Status | +| hpssa.ctrl_temperature | ctrl_{adapter slot}_temperature, cache_{adapter slot}_temperature per adapter | Celsius | +| hpssa.ld_status | a dimension per logical drive | Status | +| hpssa.pd_status | a dimension per physical drive | Status | +| hpssa.pd_temperature | a dimension per physical drive | Celsius | + + + +## Alerts + +There are no alerts configured by default for this integration. + + +## Setup + +### Prerequisites + +#### Enable the hpssa collector + +The `hpssa` collector is disabled by default. To enable it, use `edit-config` from the Netdata [config directory](https://github.com/netdata/netdata/blob/master/docs/configure/nodes.md), which is typically at `/etc/netdata`, to edit the `python.d.conf` file. + +```bash +cd /etc/netdata # Replace this path with your Netdata config directory, if different +sudo ./edit-config python.d.conf +``` + +Change the value of the `hpssa` setting to `yes`. Save the file and restart the Netdata Agent with `sudo systemctl restart netdata`, or the [appropriate method](https://github.com/netdata/netdata/blob/master/docs/configure/start-stop-restart.md) for your system. + + +#### Allow user netdata to execute `ssacli` as root. + +This module uses `ssacli`, which can only be executed by root. It uses `sudo` and assumes that it is configured such that the `netdata` user can execute `ssacli` as root without a password. + +- Add to your `/etc/sudoers` file: + +`which ssacli` shows the full path to the binary. + +```bash +netdata ALL=(root) NOPASSWD: /path/to/ssacli +``` + +- Reset Netdata's systemd + unit [CapabilityBoundingSet](https://www.freedesktop.org/software/systemd/man/systemd.exec.html#Capabilities) (Linux + distributions with systemd) + +The default CapabilityBoundingSet doesn't allow using `sudo`, and is quite strict in general. Resetting is not optimal, but a next-best solution given the inability to execute `ssacli` using `sudo`. + +As the `root` user, do the following: + +```cmd +mkdir /etc/systemd/system/netdata.service.d +echo -e '[Service]\nCapabilityBoundingSet=~' | tee /etc/systemd/system/netdata.service.d/unset-capability-bounding-set.conf +systemctl daemon-reload +systemctl restart netdata.service +``` + + + +### Configuration + +#### File + +The configuration file name for this integration is `python.d/hpssa.conf`. + + +You can edit the configuration file using the `edit-config` script from the +Netdata [config directory](https://github.com/netdata/netdata/blob/master/docs/configure/nodes.md#the-netdata-config-directory). + +```bash +cd /etc/netdata 2>/dev/null || cd /opt/netdata/etc/netdata +sudo ./edit-config python.d/hpssa.conf +``` +#### Options + +There are 2 sections: + +* Global variables +* One or more JOBS that can define multiple different instances to monitor. + +The following options can be defined globally: priority, penalty, autodetection_retry, update_every, but can also be defined per JOB to override the global values. + +Additionally, the following collapsed table contains all the options that can be configured inside a JOB definition. + +Every configuration JOB starts with a `job_name` value which will appear in the dashboard, unless a `name` parameter is specified. + + +<details><summary>Config options</summary> + +| Name | Description | Default | Required | +|:----|:-----------|:-------|:--------:| +| update_every | Sets the default data collection frequency. | 5 | False | +| priority | Controls the order of charts at the netdata dashboard. | 60000 | False | +| autodetection_retry | Sets the job re-check interval in seconds. | 0 | False | +| penalty | Indicates whether to apply penalty to update_every in case of failures. | yes | False | +| name | Job name. This value will overwrite the `job_name` value. JOBS with the same name are mutually exclusive. Only one of them will be allowed running at any time. This allows autodetection to try several alternatives and pick the one that works. | | False | +| ssacli_path | Path to the `ssacli` command line utility. Configure this if `ssacli` is not in the $PATH | | False | +| use_sudo | Whether or not to use `sudo` to execute `ssacli` | True | False | + +</details> + +#### Examples + +##### Local simple config + +A basic configuration, specyfing the path to `ssacli` + +```yaml +local: + ssacli_path: /usr/sbin/ssacli + +``` + + +## Troubleshooting + +### Debug Mode + +To troubleshoot issues with the `hpssa` collector, run the `python.d.plugin` with the debug option enabled. The output +should give you clues as to why the collector isn't working. + +- Navigate to the `plugins.d` directory, usually at `/usr/libexec/netdata/plugins.d/`. If that's not the case on + your system, open `netdata.conf` and look for the `plugins` setting under `[directories]`. + + ```bash + cd /usr/libexec/netdata/plugins.d/ + ``` + +- Switch to the `netdata` user. + + ```bash + sudo -u netdata -s + ``` + +- Run the `python.d.plugin` to debug the collector: + + ```bash + ./python.d.plugin hpssa debug trace + ``` + + diff --git a/collectors/python.d.plugin/hpssa/metadata.yaml b/collectors/python.d.plugin/hpssa/metadata.yaml index dc91f05e4..7871cc276 100644 --- a/collectors/python.d.plugin/hpssa/metadata.yaml +++ b/collectors/python.d.plugin/hpssa/metadata.yaml @@ -40,6 +40,16 @@ modules: setup: prerequisites: list: + - title: 'Enable the hpssa collector' + description: | + The `hpssa` collector is disabled by default. To enable it, use `edit-config` from the Netdata [config directory](https://github.com/netdata/netdata/blob/master/docs/configure/nodes.md), which is typically at `/etc/netdata`, to edit the `python.d.conf` file. + + ```bash + cd /etc/netdata # Replace this path with your Netdata config directory, if different + sudo ./edit-config python.d.conf + ``` + + Change the value of the `hpssa` setting to `yes`. Save the file and restart the Netdata Agent with `sudo systemctl restart netdata`, or the [appropriate method](https://github.com/netdata/netdata/blob/master/docs/configure/start-stop-restart.md) for your system. - title: 'Allow user netdata to execute `ssacli` as root.' description: | This module uses `ssacli`, which can only be executed by root. It uses `sudo` and assumes that it is configured such that the `netdata` user can execute `ssacli` as root without a password. diff --git a/collectors/python.d.plugin/icecast/README.md b/collectors/python.d.plugin/icecast/README.md index 25bbf738e..db3c1b572 100644..120000 --- a/collectors/python.d.plugin/icecast/README.md +++ b/collectors/python.d.plugin/icecast/README.md @@ -1,67 +1 @@ -<!-- -title: "Icecast monitoring with Netdata" -custom_edit_url: "https://github.com/netdata/netdata/edit/master/collectors/python.d.plugin/icecast/README.md" -sidebar_label: "Icecast" -learn_status: "Published" -learn_topic_type: "References" -learn_rel_path: "Integrations/Monitor/Networking" ---> - -# Icecast collector - -Monitors the number of listeners for active sources. - -## Requirements - -- icecast version >= 2.4.0 - -It produces the following charts: - -1. **Listeners** in listeners - -- source number - -## Configuration - -Edit the `python.d/icecast.conf` configuration file using `edit-config` from the Netdata [config -directory](https://github.com/netdata/netdata/blob/master/docs/configure/nodes.md), which is typically at `/etc/netdata`. - -```bash -cd /etc/netdata # Replace this path with your Netdata config directory, if different -sudo ./edit-config python.d/icecast.conf -``` - -Needs only `url` to server's `/status-json.xsl` - -Here is an example for remote server: - -```yaml -remote: - url : 'http://1.2.3.4:8443/status-json.xsl' -``` - -Without configuration, module attempts to connect to `http://localhost:8443/status-json.xsl` - - - - -### Troubleshooting - -To troubleshoot issues with the `icecast` module, run the `python.d.plugin` with the debug option enabled. The -output will give you the output of the data collection job or error messages on why the collector isn't working. - -First, navigate to your plugins directory, usually they are located under `/usr/libexec/netdata/plugins.d/`. If that's -not the case on your system, open `netdata.conf` and look for the setting `plugins directory`. Once you're in the -plugin's directory, switch to the `netdata` user. - -```bash -cd /usr/libexec/netdata/plugins.d/ -sudo su -s /bin/bash netdata -``` - -Now you can manually run the `icecast` module in debug mode: - -```bash -./python.d.plugin icecast debug trace -``` - +integrations/icecast.md
\ No newline at end of file diff --git a/collectors/python.d.plugin/icecast/integrations/icecast.md b/collectors/python.d.plugin/icecast/integrations/icecast.md new file mode 100644 index 000000000..06c317864 --- /dev/null +++ b/collectors/python.d.plugin/icecast/integrations/icecast.md @@ -0,0 +1,165 @@ +<!--startmeta +custom_edit_url: "https://github.com/netdata/netdata/edit/master/collectors/python.d.plugin/icecast/README.md" +meta_yaml: "https://github.com/netdata/netdata/edit/master/collectors/python.d.plugin/icecast/metadata.yaml" +sidebar_label: "Icecast" +learn_status: "Published" +learn_rel_path: "Data Collection/Media Services" +message: "DO NOT EDIT THIS FILE DIRECTLY, IT IS GENERATED BY THE COLLECTOR'S metadata.yaml FILE" +endmeta--> + +# Icecast + + +<img src="https://netdata.cloud/img/icecast.svg" width="150"/> + + +Plugin: python.d.plugin +Module: icecast + +<img src="https://img.shields.io/badge/maintained%20by-Netdata-%2300ab44" /> + +## Overview + +This collector monitors Icecast listener counts. + +It connects to an icecast URL and uses the `status-json.xsl` endpoint to retrieve statistics. + +This collector is supported on all platforms. + +This collector supports collecting metrics from multiple instances of this integration, including remote instances. + + +### Default Behavior + +#### Auto-Detection + +Without configuration, the collector attempts to connect to http://localhost:8443/status-json.xsl + +#### Limits + +The default configuration for this integration does not impose any limits on data collection. + +#### Performance Impact + +The default configuration for this integration is not expected to impose a significant performance impact on the system. + + +## Metrics + +Metrics grouped by *scope*. + +The scope defines the instance that the metric belongs to. An instance is uniquely identified by a set of labels. + + + +### Per Icecast instance + +These metrics refer to the entire monitored application. + +This scope has no labels. + +Metrics: + +| Metric | Dimensions | Unit | +|:------|:----------|:----| +| icecast.listeners | a dimension for each active source | listeners | + + + +## Alerts + +There are no alerts configured by default for this integration. + + +## Setup + +### Prerequisites + +#### Icecast minimum version + +Needs at least icecast version >= 2.4.0 + + +### Configuration + +#### File + +The configuration file name for this integration is `python.d/icecast.conf`. + + +You can edit the configuration file using the `edit-config` script from the +Netdata [config directory](https://github.com/netdata/netdata/blob/master/docs/configure/nodes.md#the-netdata-config-directory). + +```bash +cd /etc/netdata 2>/dev/null || cd /opt/netdata/etc/netdata +sudo ./edit-config python.d/icecast.conf +``` +#### Options + +There are 2 sections: + +* Global variables +* One or more JOBS that can define multiple different instances to monitor. + +The following options can be defined globally: priority, penalty, autodetection_retry, update_every, but can also be defined per JOB to override the global values. + +Additionally, the following collapsed table contains all the options that can be configured inside a JOB definition. + +Every configuration JOB starts with a `job_name` value which will appear in the dashboard, unless a `name` parameter is specified. + + +<details><summary>Config options</summary> + +| Name | Description | Default | Required | +|:----|:-----------|:-------|:--------:| +| update_every | Sets the default data collection frequency. | 5 | False | +| priority | Controls the order of charts at the netdata dashboard. | 60000 | False | +| autodetection_retry | Sets the job re-check interval in seconds. | 0 | False | +| penalty | Indicates whether to apply penalty to update_every in case of failures. | yes | False | +| name | Job name. This value will overwrite the `job_name` value. JOBS with the same name are mutually exclusive. Only one of them will be allowed running at any time. This allows autodetection to try several alternatives and pick the one that works. | | False | +| url | The URL (and port) to the icecast server. Needs to also include `/status-json.xsl` | http://localhost:8443/status-json.xsl | False | +| user | Username to use to connect to `url` if it's password protected. | | False | +| pass | Password to use to connect to `url` if it's password protected. | | False | + +</details> + +#### Examples + +##### Remote Icecast server + +Configure a remote icecast server + +```yaml +remote: + url: 'http://1.2.3.4:8443/status-json.xsl' + +``` + + +## Troubleshooting + +### Debug Mode + +To troubleshoot issues with the `icecast` collector, run the `python.d.plugin` with the debug option enabled. The output +should give you clues as to why the collector isn't working. + +- Navigate to the `plugins.d` directory, usually at `/usr/libexec/netdata/plugins.d/`. If that's not the case on + your system, open `netdata.conf` and look for the `plugins` setting under `[directories]`. + + ```bash + cd /usr/libexec/netdata/plugins.d/ + ``` + +- Switch to the `netdata` user. + + ```bash + sudo -u netdata -s + ``` + +- Run the `python.d.plugin` to debug the collector: + + ```bash + ./python.d.plugin icecast debug trace + ``` + + diff --git a/collectors/python.d.plugin/ipfs/README.md b/collectors/python.d.plugin/ipfs/README.md index c990ae34f..eee6a07b2 100644..120000 --- a/collectors/python.d.plugin/ipfs/README.md +++ b/collectors/python.d.plugin/ipfs/README.md @@ -1,74 +1 @@ -<!-- -title: "IPFS monitoring with Netdata" -custom_edit_url: "https://github.com/netdata/netdata/edit/master/collectors/python.d.plugin/ipfs/README.md" -sidebar_label: "IPFS" -learn_status: "Published" -learn_topic_type: "References" -learn_rel_path: "Integrations/Monitor/Storage" ---> - -# IPFS collector - -Collects [`IPFS`](https://ipfs.io) basic information like file system bandwidth, peers and repo metrics. - -## Charts - -It produces the following charts: - -- Bandwidth in `kilobits/s` -- Peers in `peers` -- Repo Size in `GiB` -- Repo Objects in `objects` - -## Configuration - -Edit the `python.d/ipfs.conf` configuration file using `edit-config` from the Netdata [config -directory](https://github.com/netdata/netdata/blob/master/docs/configure/nodes.md), which is typically at `/etc/netdata`. - -```bash -cd /etc/netdata # Replace this path with your Netdata config directory, if different -sudo ./edit-config python.d/ipfs.conf -``` - - - -Calls to the following endpoints are disabled due to `IPFS` bugs: - -- `/api/v0/stats/repo` (https://github.com/ipfs/go-ipfs/issues/3874) -- `/api/v0/pin/ls` (https://github.com/ipfs/go-ipfs/issues/7528) - -Can be enabled in the collector configuration file. - -The configuration needs only `url` to `IPFS` server, here is an example for 2 `IPFS` instances: - -```yaml -localhost: - url: 'http://localhost:5001' - -remote: - url: 'http://203.0.113.10::5001' -``` - - - - -### Troubleshooting - -To troubleshoot issues with the `ipfs` module, run the `python.d.plugin` with the debug option enabled. The -output will give you the output of the data collection job or error messages on why the collector isn't working. - -First, navigate to your plugins directory, usually they are located under `/usr/libexec/netdata/plugins.d/`. If that's -not the case on your system, open `netdata.conf` and look for the setting `plugins directory`. Once you're in the -plugin's directory, switch to the `netdata` user. - -```bash -cd /usr/libexec/netdata/plugins.d/ -sudo su -s /bin/bash netdata -``` - -Now you can manually run the `ipfs` module in debug mode: - -```bash -./python.d.plugin ipfs debug trace -``` - +integrations/ipfs.md
\ No newline at end of file diff --git a/collectors/python.d.plugin/ipfs/integrations/ipfs.md b/collectors/python.d.plugin/ipfs/integrations/ipfs.md new file mode 100644 index 000000000..c43c27b34 --- /dev/null +++ b/collectors/python.d.plugin/ipfs/integrations/ipfs.md @@ -0,0 +1,202 @@ +<!--startmeta +custom_edit_url: "https://github.com/netdata/netdata/edit/master/collectors/python.d.plugin/ipfs/README.md" +meta_yaml: "https://github.com/netdata/netdata/edit/master/collectors/python.d.plugin/ipfs/metadata.yaml" +sidebar_label: "IPFS" +learn_status: "Published" +learn_rel_path: "Data Collection/Storage, Mount Points and Filesystems" +message: "DO NOT EDIT THIS FILE DIRECTLY, IT IS GENERATED BY THE COLLECTOR'S metadata.yaml FILE" +endmeta--> + +# IPFS + + +<img src="https://netdata.cloud/img/ipfs.svg" width="150"/> + + +Plugin: python.d.plugin +Module: ipfs + +<img src="https://img.shields.io/badge/maintained%20by-Netdata-%2300ab44" /> + +## Overview + +This collector monitors IPFS server metrics about its quality and performance. + +It connects to an http endpoint of the IPFS server to collect the metrics + +This collector is supported on all platforms. + +This collector supports collecting metrics from multiple instances of this integration, including remote instances. + + +### Default Behavior + +#### Auto-Detection + +If the endpoint is accessible by the Agent, netdata will autodetect it + +#### Limits + +Calls to the following endpoints are disabled due to IPFS bugs: + +/api/v0/stats/repo (https://github.com/ipfs/go-ipfs/issues/3874) +/api/v0/pin/ls (https://github.com/ipfs/go-ipfs/issues/7528) + + +#### Performance Impact + +The default configuration for this integration is not expected to impose a significant performance impact on the system. + + +## Metrics + +Metrics grouped by *scope*. + +The scope defines the instance that the metric belongs to. An instance is uniquely identified by a set of labels. + + + +### Per IPFS instance + +These metrics refer to the entire monitored application. + +This scope has no labels. + +Metrics: + +| Metric | Dimensions | Unit | +|:------|:----------|:----| +| ipfs.bandwidth | in, out | kilobits/s | +| ipfs.peers | peers | peers | +| ipfs.repo_size | avail, size | GiB | +| ipfs.repo_objects | objects, pinned, recursive_pins | objects | + + + +## Alerts + + +The following alerts are available: + +| Alert name | On metric | Description | +|:------------|:----------|:------------| +| [ ipfs_datastore_usage ](https://github.com/netdata/netdata/blob/master/health/health.d/ipfs.conf) | ipfs.repo_size | IPFS datastore utilization | + + +## Setup + +### Prerequisites + +No action required. + +### Configuration + +#### File + +The configuration file name for this integration is `python.d/ipfs.conf`. + + +You can edit the configuration file using the `edit-config` script from the +Netdata [config directory](https://github.com/netdata/netdata/blob/master/docs/configure/nodes.md#the-netdata-config-directory). + +```bash +cd /etc/netdata 2>/dev/null || cd /opt/netdata/etc/netdata +sudo ./edit-config python.d/ipfs.conf +``` +#### Options + +There are 2 sections: + +* Global variables +* One or more JOBS that can define multiple different instances to monitor. + +The following options can be defined globally: priority, penalty, autodetection_retry, update_every, but can also be defined per JOB to override the global values. + +Additionally, the following collapsed table contains all the options that can be configured inside a JOB definition. + +Every configuration JOB starts with a `job_name` value which will appear in the dashboard, unless a `name` parameter is specified. + + +<details><summary></summary> + +| Name | Description | Default | Required | +|:----|:-----------|:-------|:--------:| +| update_every | Sets the default data collection frequency. | 5 | False | +| priority | Controls the order of charts at the netdata dashboard. | 60000 | False | +| autodetection_retry | Sets the job re-check interval in seconds. | 0 | False | +| penalty | Indicates whether to apply penalty to update_every in case of failures. | yes | False | +| name | The JOB's name as it will appear at the dashboard (by default is the job_name) | job_name | False | +| url | URL to the IPFS API | no | True | +| repoapi | Collect repo metrics. | no | False | +| pinapi | Set status of IPFS pinned object polling. | no | False | + +</details> + +#### Examples + +##### Basic (default out-of-the-box) + +A basic example configuration, one job will run at a time. Autodetect mechanism uses it by default. + +```yaml +localhost: + name: 'local' + url: 'http://localhost:5001' + repoapi: no + pinapi: no + +``` +##### Multi-instance + +> **Note**: When you define multiple jobs, their names must be unique. + +Collecting metrics from local and remote instances. + + +<details><summary>Config</summary> + +```yaml +localhost: + name: 'local' + url: 'http://localhost:5001' + repoapi: no + pinapi: no + +remote_host: + name: 'remote' + url: 'http://192.0.2.1:5001' + repoapi: no + pinapi: no + +``` +</details> + + + +## Troubleshooting + +### Debug Mode + +To troubleshoot issues with the `ipfs` collector, run the `python.d.plugin` with the debug option enabled. The output +should give you clues as to why the collector isn't working. + +- Navigate to the `plugins.d` directory, usually at `/usr/libexec/netdata/plugins.d/`. If that's not the case on + your system, open `netdata.conf` and look for the `plugins` setting under `[directories]`. + + ```bash + cd /usr/libexec/netdata/plugins.d/ + ``` + +- Switch to the `netdata` user. + + ```bash + sudo -u netdata -s + ``` + +- Run the `python.d.plugin` to debug the collector: + + ```bash + ./python.d.plugin ipfs debug trace + ``` + + diff --git a/collectors/python.d.plugin/litespeed/README.md b/collectors/python.d.plugin/litespeed/README.md index 1ad5ad42c..e7418b3dc 100644..120000 --- a/collectors/python.d.plugin/litespeed/README.md +++ b/collectors/python.d.plugin/litespeed/README.md @@ -1,95 +1 @@ -<!-- -title: "LiteSpeed monitoring with Netdata" -custom_edit_url: "https://github.com/netdata/netdata/edit/master/collectors/python.d.plugin/litespeed/README.md" -sidebar_label: "LiteSpeed" -learn_status: "Published" -learn_topic_type: "References" -learn_rel_path: "Integrations/Monitor/Application Performance Monitoring" ---> - -# LiteSpeed collector - -Collects web server performance metrics for network, connection, requests, and cache. - -It produces: - -1. **Network Throughput HTTP** in kilobits/s - - - in - - out - -2. **Network Throughput HTTPS** in kilobits/s - - - in - - out - -3. **Connections HTTP** in connections - - - free - - used - -4. **Connections HTTPS** in connections - - - free - - used - -5. **Requests** in requests/s - - - requests - -6. **Requests In Processing** in requests - - - processing - -7. **Public Cache Hits** in hits/s - - - hits - -8. **Private Cache Hits** in hits/s - - - hits - -9. **Static Hits** in hits/s - - - hits - -## Configuration - -Edit the `python.d/litespeed.conf` configuration file using `edit-config` from the Netdata [config -directory](https://github.com/netdata/netdata/blob/master/docs/configure/nodes.md), which is typically at `/etc/netdata`. - -```bash -cd /etc/netdata # Replace this path with your Netdata config directory, if different -sudo ./edit-config python.d/litespeed.conf -``` - -```yaml -local: - path : 'PATH' -``` - -If no configuration is given, module will use "/tmp/lshttpd/". - - - - -### Troubleshooting - -To troubleshoot issues with the `litespeed` module, run the `python.d.plugin` with the debug option enabled. The -output will give you the output of the data collection job or error messages on why the collector isn't working. - -First, navigate to your plugins directory, usually they are located under `/usr/libexec/netdata/plugins.d/`. If that's -not the case on your system, open `netdata.conf` and look for the setting `plugins directory`. Once you're in the -plugin's directory, switch to the `netdata` user. - -```bash -cd /usr/libexec/netdata/plugins.d/ -sudo su -s /bin/bash netdata -``` - -Now you can manually run the `litespeed` module in debug mode: - -```bash -./python.d.plugin litespeed debug trace -``` - +integrations/litespeed.md
\ No newline at end of file diff --git a/collectors/python.d.plugin/litespeed/integrations/litespeed.md b/collectors/python.d.plugin/litespeed/integrations/litespeed.md new file mode 100644 index 000000000..511c112e9 --- /dev/null +++ b/collectors/python.d.plugin/litespeed/integrations/litespeed.md @@ -0,0 +1,169 @@ +<!--startmeta +custom_edit_url: "https://github.com/netdata/netdata/edit/master/collectors/python.d.plugin/litespeed/README.md" +meta_yaml: "https://github.com/netdata/netdata/edit/master/collectors/python.d.plugin/litespeed/metadata.yaml" +sidebar_label: "Litespeed" +learn_status: "Published" +learn_rel_path: "Data Collection/Web Servers and Web Proxies" +message: "DO NOT EDIT THIS FILE DIRECTLY, IT IS GENERATED BY THE COLLECTOR'S metadata.yaml FILE" +endmeta--> + +# Litespeed + + +<img src="https://netdata.cloud/img/litespeed.svg" width="150"/> + + +Plugin: python.d.plugin +Module: litespeed + +<img src="https://img.shields.io/badge/maintained%20by-Netdata-%2300ab44" /> + +## Overview + +Examine Litespeed metrics for insights into web server operations. Analyze request rates, response times, and error rates for efficient web service delivery. + +The collector uses the statistics under /tmp/lshttpd to gather the metrics. + +This collector is supported on all platforms. + +This collector only supports collecting metrics from a single instance of this integration. + + +### Default Behavior + +#### Auto-Detection + +If no configuration is present, the collector will attempt to read files under /tmp/lshttpd/. + +#### Limits + +The default configuration for this integration does not impose any limits on data collection. + +#### Performance Impact + +The default configuration for this integration is not expected to impose a significant performance impact on the system. + + +## Metrics + +Metrics grouped by *scope*. + +The scope defines the instance that the metric belongs to. An instance is uniquely identified by a set of labels. + + + +### Per Litespeed instance + +These metrics refer to the entire monitored application. + +This scope has no labels. + +Metrics: + +| Metric | Dimensions | Unit | +|:------|:----------|:----| +| litespeed.net_throughput | in, out | kilobits/s | +| litespeed.net_throughput | in, out | kilobits/s | +| litespeed.connections | free, used | conns | +| litespeed.connections | free, used | conns | +| litespeed.requests | requests | requests/s | +| litespeed.requests_processing | processing | requests | +| litespeed.cache | hits | hits/s | +| litespeed.cache | hits | hits/s | +| litespeed.static | hits | hits/s | + + + +## Alerts + +There are no alerts configured by default for this integration. + + +## Setup + +### Prerequisites + +No action required. + +### Configuration + +#### File + +The configuration file name for this integration is `python.d/litespeed.conf`. + + +You can edit the configuration file using the `edit-config` script from the +Netdata [config directory](https://github.com/netdata/netdata/blob/master/docs/configure/nodes.md#the-netdata-config-directory). + +```bash +cd /etc/netdata 2>/dev/null || cd /opt/netdata/etc/netdata +sudo ./edit-config python.d/litespeed.conf +``` +#### Options + +There are 2 sections: + +* Global variables +* One or more JOBS that can define multiple different instances to monitor. + +The following options can be defined globally: priority, penalty, autodetection_retry, update_every, but can also be defined per JOB to override the global values. + +Additionally, the following collapsed table contains all the options that can be configured inside a JOB definition. + +Every configuration JOB starts with a `job_name` value which will appear in the dashboard, unless a `name` parameter is specified. + + +<details><summary>Config options</summary> + +| Name | Description | Default | Required | +|:----|:-----------|:-------|:--------:| +| update_every | Sets the default data collection frequency. | 5 | False | +| priority | Controls the order of charts at the netdata dashboard. | 60000 | False | +| autodetection_retry | Sets the job re-check interval in seconds. | 0 | False | +| penalty | Indicates whether to apply penalty to update_every in case of failures. | yes | False | +| name | Job name. This value will overwrite the `job_name` value. JOBS with the same name are mutually exclusive. Only one of them will be allowed running at any time. This allows autodetection to try several alternatives and pick the one that works. | | False | +| path | Use a different path than the default, where the lightspeed stats files reside. | /tmp/lshttpd/ | False | + +</details> + +#### Examples + +##### Set the path to statistics + +Change the path for the litespeed stats files + +```yaml +localhost: + name: 'local' + path: '/tmp/lshttpd' + +``` + + +## Troubleshooting + +### Debug Mode + +To troubleshoot issues with the `litespeed` collector, run the `python.d.plugin` with the debug option enabled. The output +should give you clues as to why the collector isn't working. + +- Navigate to the `plugins.d` directory, usually at `/usr/libexec/netdata/plugins.d/`. If that's not the case on + your system, open `netdata.conf` and look for the `plugins` setting under `[directories]`. + + ```bash + cd /usr/libexec/netdata/plugins.d/ + ``` + +- Switch to the `netdata` user. + + ```bash + sudo -u netdata -s + ``` + +- Run the `python.d.plugin` to debug the collector: + + ```bash + ./python.d.plugin litespeed debug trace + ``` + + diff --git a/collectors/python.d.plugin/megacli/README.md b/collectors/python.d.plugin/megacli/README.md index 1af4d0ea7..e5df4d41d 100644..120000 --- a/collectors/python.d.plugin/megacli/README.md +++ b/collectors/python.d.plugin/megacli/README.md @@ -1,109 +1 @@ -<!-- -title: "MegaRAID controller monitoring with Netdata" -custom_edit_url: "https://github.com/netdata/netdata/edit/master/collectors/python.d.plugin/megacli/README.md" -sidebar_label: "MegaRAID controllers" -learn_status: "Published" -learn_topic_type: "References" -learn_rel_path: "Integrations/Monitor/Devices" ---> - -# MegaRAID controller collector - -Collects adapter, physical drives and battery stats using `megacli` command-line tool. - -Executed commands: - -- `sudo -n megacli -LDPDInfo -aAll` -- `sudo -n megacli -AdpBbuCmd -a0` - -## Requirements - -The module uses `megacli`, which can only be executed by `root`. It uses -`sudo` and assumes that it is configured such that the `netdata` user can execute `megacli` as root without a password. - -- Add to your `/etc/sudoers` file: - -`which megacli` shows the full path to the binary. - -```bash -netdata ALL=(root) NOPASSWD: /path/to/megacli -``` - -- Reset Netdata's systemd - unit [CapabilityBoundingSet](https://www.freedesktop.org/software/systemd/man/systemd.exec.html#Capabilities) (Linux - distributions with systemd) - -The default CapabilityBoundingSet doesn't allow using `sudo`, and is quite strict in general. Resetting is not optimal, but a next-best solution given the inability to execute `megacli` using `sudo`. - - -As the `root` user, do the following: - -```cmd -mkdir /etc/systemd/system/netdata.service.d -echo -e '[Service]\nCapabilityBoundingSet=~' | tee /etc/systemd/system/netdata.service.d/unset-capability-bounding-set.conf -systemctl daemon-reload -systemctl restart netdata.service -``` - -## Charts - -- Adapter State -- Physical Drives Media Errors -- Physical Drives Predictive Failures -- Battery Relative State of Charge -- Battery Cycle Count - -## Enable the collector - -The `megacli` collector is disabled by default. To enable it, use `edit-config` from the -Netdata [config directory](https://github.com/netdata/netdata/blob/master/docs/configure/nodes.md), which is typically at `/etc/netdata`, to edit the `python.d.conf` -file. - -```bash -cd /etc/netdata # Replace this path with your Netdata config directory, if different -sudo ./edit-config python.d.conf -``` - -Change the value of the `megacli` setting to `yes`. Save the file and restart the Netdata Agent -with `sudo systemctl restart netdata`, or the appropriate method for your system. - -## Configuration - -Edit the `python.d/megacli.conf` configuration file using `edit-config` from the -Netdata [config directory](https://github.com/netdata/netdata/blob/master/docs/configure/nodes.md), which is typically at `/etc/netdata`. - -```bash -cd /etc/netdata # Replace this path with your Netdata config directory, if different -sudo ./edit-config python.d/megacli.conf -``` - -Battery stats disabled by default. To enable them, modify `megacli.conf`. - -```yaml -do_battery: yes -``` - -Save the file and restart the Netdata Agent with `sudo systemctl restart netdata`, or the [appropriate -method](https://github.com/netdata/netdata/blob/master/docs/configure/start-stop-restart.md) for your system. - - -### Troubleshooting - -To troubleshoot issues with the `megacli` module, run the `python.d.plugin` with the debug option enabled. The -output will give you the output of the data collection job or error messages on why the collector isn't working. - -First, navigate to your plugins directory, usually they are located under `/usr/libexec/netdata/plugins.d/`. If that's -not the case on your system, open `netdata.conf` and look for the setting `plugins directory`. Once you're in the -plugin's directory, switch to the `netdata` user. - -```bash -cd /usr/libexec/netdata/plugins.d/ -sudo su -s /bin/bash netdata -``` - -Now you can manually run the `megacli` module in debug mode: - -```bash -./python.d.plugin megacli debug trace -``` - +integrations/megacli.md
\ No newline at end of file diff --git a/collectors/python.d.plugin/megacli/integrations/megacli.md b/collectors/python.d.plugin/megacli/integrations/megacli.md new file mode 100644 index 000000000..bb3bdf6f2 --- /dev/null +++ b/collectors/python.d.plugin/megacli/integrations/megacli.md @@ -0,0 +1,219 @@ +<!--startmeta +custom_edit_url: "https://github.com/netdata/netdata/edit/master/collectors/python.d.plugin/megacli/README.md" +meta_yaml: "https://github.com/netdata/netdata/edit/master/collectors/python.d.plugin/megacli/metadata.yaml" +sidebar_label: "MegaCLI" +learn_status: "Published" +learn_rel_path: "Data Collection/Storage, Mount Points and Filesystems" +message: "DO NOT EDIT THIS FILE DIRECTLY, IT IS GENERATED BY THE COLLECTOR'S metadata.yaml FILE" +endmeta--> + +# MegaCLI + + +<img src="https://netdata.cloud/img/hard-drive.svg" width="150"/> + + +Plugin: python.d.plugin +Module: megacli + +<img src="https://img.shields.io/badge/maintained%20by-Netdata-%2300ab44" /> + +## Overview + +Examine MegaCLI metrics with Netdata for insights into RAID controller performance. Improve your RAID controller efficiency with real-time MegaCLI metrics. + +Collects adapter, physical drives and battery stats using megacli command-line tool + +Executed commands: + + - `sudo -n megacli -LDPDInfo -aAll` + - `sudo -n megacli -AdpBbuCmd -a0` + + +This collector is supported on all platforms. + +This collector only supports collecting metrics from a single instance of this integration. + +The module uses megacli, which can only be executed by root. It uses sudo and assumes that it is configured such that the netdata user can execute megacli as root without a password. + +### Default Behavior + +#### Auto-Detection + +After all the permissions are satisfied, netdata should be to execute commands via the megacli command line utility + +#### Limits + +The default configuration for this integration does not impose any limits on data collection. + +#### Performance Impact + +The default configuration for this integration is not expected to impose a significant performance impact on the system. + + +## Metrics + +Metrics grouped by *scope*. + +The scope defines the instance that the metric belongs to. An instance is uniquely identified by a set of labels. + + + +### Per MegaCLI instance + +These metrics refer to the entire monitored application. + +This scope has no labels. + +Metrics: + +| Metric | Dimensions | Unit | +|:------|:----------|:----| +| megacli.adapter_degraded | a dimension per adapter | is degraded | +| megacli.pd_media_error | a dimension per physical drive | errors/s | +| megacli.pd_predictive_failure | a dimension per physical drive | failures/s | + +### Per battery + +Metrics related to Battery Backup Units, each BBU provides its own set of the following metrics. + +This scope has no labels. + +Metrics: + +| Metric | Dimensions | Unit | +|:------|:----------|:----| +| megacli.bbu_relative_charge | adapter {battery id} | percentage | +| megacli.bbu_cycle_count | adapter {battery id} | cycle count | + + + +## Alerts + + +The following alerts are available: + +| Alert name | On metric | Description | +|:------------|:----------|:------------| +| [ megacli_adapter_state ](https://github.com/netdata/netdata/blob/master/health/health.d/megacli.conf) | megacli.adapter_degraded | adapter is in the degraded state (0: false, 1: true) | +| [ megacli_pd_media_errors ](https://github.com/netdata/netdata/blob/master/health/health.d/megacli.conf) | megacli.pd_media_error | number of physical drive media errors | +| [ megacli_pd_predictive_failures ](https://github.com/netdata/netdata/blob/master/health/health.d/megacli.conf) | megacli.pd_predictive_failure | number of physical drive predictive failures | +| [ megacli_bbu_relative_charge ](https://github.com/netdata/netdata/blob/master/health/health.d/megacli.conf) | megacli.bbu_relative_charge | average battery backup unit (BBU) relative state of charge over the last 10 seconds | +| [ megacli_bbu_cycle_count ](https://github.com/netdata/netdata/blob/master/health/health.d/megacli.conf) | megacli.bbu_cycle_count | average battery backup unit (BBU) charge cycles count over the last 10 seconds | + + +## Setup + +### Prerequisites + +#### Grant permissions for netdata, to run megacli as sudoer + +The module uses megacli, which can only be executed by root. It uses sudo and assumes that it is configured such that the netdata user can execute megacli as root without a password. + +Add to your /etc/sudoers file: +which megacli shows the full path to the binary. + +```bash +netdata ALL=(root) NOPASSWD: /path/to/megacli +``` + + +#### Reset Netdata's systemd unit CapabilityBoundingSet (Linux distributions with systemd) + +The default CapabilityBoundingSet doesn't allow using sudo, and is quite strict in general. Resetting is not optimal, but a next-best solution given the inability to execute arcconf using sudo. + +As root user, do the following: + +```bash +mkdir /etc/systemd/system/netdata.service.d +echo -e '[Service]\nCapabilityBoundingSet=~' | tee /etc/systemd/system/netdata.service.d/unset-capability-bounding-set.conf +systemctl daemon-reload +systemctl restart netdata.service +``` + + + +### Configuration + +#### File + +The configuration file name for this integration is `python.d/megacli.conf`. + + +You can edit the configuration file using the `edit-config` script from the +Netdata [config directory](https://github.com/netdata/netdata/blob/master/docs/configure/nodes.md#the-netdata-config-directory). + +```bash +cd /etc/netdata 2>/dev/null || cd /opt/netdata/etc/netdata +sudo ./edit-config python.d/megacli.conf +``` +#### Options + +There are 2 sections: + +* Global variables +* One or more JOBS that can define multiple different instances to monitor. + +The following options can be defined globally: priority, penalty, autodetection_retry, update_every, but can also be defined per JOB to override the global values. + +Additionally, the following collapsed table contains all the options that can be configured inside a JOB definition. + +Every configuration JOB starts with a `job_name` value which will appear in the dashboard, unless a `name` parameter is specified. + + +<details><summary>Config options</summary> + +| Name | Description | Default | Required | +|:----|:-----------|:-------|:--------:| +| update_every | Sets the default data collection frequency. | 5 | False | +| priority | Controls the order of charts at the netdata dashboard. | 60000 | False | +| autodetection_retry | Sets the job re-check interval in seconds. | 0 | False | +| penalty | Indicates whether to apply penalty to update_every in case of failures. | yes | False | +| do_battery | default is no. Battery stats (adds additional call to megacli `megacli -AdpBbuCmd -a0`). | no | False | + +</details> + +#### Examples + +##### Basic + +A basic example configuration per job + +```yaml +job_name: + name: myname + update_every: 1 + priority: 60000 + penalty: yes + autodetection_retry: 0 + +``` + + +## Troubleshooting + +### Debug Mode + +To troubleshoot issues with the `megacli` collector, run the `python.d.plugin` with the debug option enabled. The output +should give you clues as to why the collector isn't working. + +- Navigate to the `plugins.d` directory, usually at `/usr/libexec/netdata/plugins.d/`. If that's not the case on + your system, open `netdata.conf` and look for the `plugins` setting under `[directories]`. + + ```bash + cd /usr/libexec/netdata/plugins.d/ + ``` + +- Switch to the `netdata` user. + + ```bash + sudo -u netdata -s + ``` + +- Run the `python.d.plugin` to debug the collector: + + ```bash + ./python.d.plugin megacli debug trace + ``` + + diff --git a/collectors/python.d.plugin/megacli/metadata.yaml b/collectors/python.d.plugin/megacli/metadata.yaml index f75a8d2ab..4a2ba43ee 100644 --- a/collectors/python.d.plugin/megacli/metadata.yaml +++ b/collectors/python.d.plugin/megacli/metadata.yaml @@ -27,8 +27,8 @@ modules: Executed commands: - sudo -n megacli -LDPDInfo -aAll - sudo -n megacli -AdpBbuCmd -a0 + - `sudo -n megacli -LDPDInfo -aAll` + - `sudo -n megacli -AdpBbuCmd -a0` supported_platforms: include: [] exclude: [] diff --git a/collectors/python.d.plugin/memcached/README.md b/collectors/python.d.plugin/memcached/README.md index 612bd49d7..2cb76d33c 100644..120000 --- a/collectors/python.d.plugin/memcached/README.md +++ b/collectors/python.d.plugin/memcached/README.md @@ -1,122 +1 @@ -<!-- -title: "Memcached monitoring with Netdata" -custom_edit_url: "https://github.com/netdata/netdata/edit/master/collectors/python.d.plugin/memcached/README.md" -sidebar_label: "Memcached" -learn_status: "Published" -learn_topic_type: "References" -learn_rel_path: "Integrations/Monitor/Databases" ---> - -# Memcached collector - -Collects memory-caching system performance metrics. It reads server response to stats command ([stats interface](https://github.com/memcached/memcached/wiki/Commands#stats)). - - -1. **Network** in kilobytes/s - - - read - - written - -2. **Connections** per second - - - current - - rejected - - total - -3. **Items** in cluster - - - current - - total - -4. **Evicted and Reclaimed** items - - - evicted - - reclaimed - -5. **GET** requests/s - - - hits - - misses - -6. **GET rate** rate in requests/s - - - rate - -7. **SET rate** rate in requests/s - - - rate - -8. **DELETE** requests/s - - - hits - - misses - -9. **CAS** requests/s - - - hits - - misses - - bad value - -10. **Increment** requests/s - - - hits - - misses - -11. **Decrement** requests/s - - - hits - - misses - -12. **Touch** requests/s - - - hits - - misses - -13. **Touch rate** rate in requests/s - - - rate - -## Configuration - -Edit the `python.d/memcached.conf` configuration file using `edit-config` from the Netdata [config -directory](https://github.com/netdata/netdata/blob/master/docs/configure/nodes.md), which is typically at `/etc/netdata`. - -```bash -cd /etc/netdata # Replace this path with your Netdata config directory, if different -sudo ./edit-config python.d/memcached.conf -``` - -Sample: - -```yaml -localtcpip: - name : 'local' - host : '127.0.0.1' - port : 24242 -``` - -If no configuration is given, module will attempt to connect to memcached instance on `127.0.0.1:11211` address. - - - - -### Troubleshooting - -To troubleshoot issues with the `memcached` module, run the `python.d.plugin` with the debug option enabled. The -output will give you the output of the data collection job or error messages on why the collector isn't working. - -First, navigate to your plugins directory, usually they are located under `/usr/libexec/netdata/plugins.d/`. If that's -not the case on your system, open `netdata.conf` and look for the setting `plugins directory`. Once you're in the -plugin's directory, switch to the `netdata` user. - -```bash -cd /usr/libexec/netdata/plugins.d/ -sudo su -s /bin/bash netdata -``` - -Now you can manually run the `memcached` module in debug mode: - -```bash -./python.d.plugin memcached debug trace -``` - +integrations/memcached.md
\ No newline at end of file diff --git a/collectors/python.d.plugin/memcached/integrations/memcached.md b/collectors/python.d.plugin/memcached/integrations/memcached.md new file mode 100644 index 000000000..012758304 --- /dev/null +++ b/collectors/python.d.plugin/memcached/integrations/memcached.md @@ -0,0 +1,214 @@ +<!--startmeta +custom_edit_url: "https://github.com/netdata/netdata/edit/master/collectors/python.d.plugin/memcached/README.md" +meta_yaml: "https://github.com/netdata/netdata/edit/master/collectors/python.d.plugin/memcached/metadata.yaml" +sidebar_label: "Memcached" +learn_status: "Published" +learn_rel_path: "Data Collection/Databases" +message: "DO NOT EDIT THIS FILE DIRECTLY, IT IS GENERATED BY THE COLLECTOR'S metadata.yaml FILE" +endmeta--> + +# Memcached + + +<img src="https://netdata.cloud/img/memcached.svg" width="150"/> + + +Plugin: python.d.plugin +Module: memcached + +<img src="https://img.shields.io/badge/maintained%20by-Netdata-%2300ab44" /> + +## Overview + +Monitor Memcached metrics for proficient in-memory key-value store operations. Track cache hits, misses, and memory usage for efficient data caching. + +It reads server response to stats command ([stats interface](https://github.com/memcached/memcached/wiki/Commands#stats)). + +This collector is supported on all platforms. + +This collector supports collecting metrics from multiple instances of this integration, including remote instances. + + +### Default Behavior + +#### Auto-Detection + +If no configuration is given, collector will attempt to connect to memcached instance on `127.0.0.1:11211` address. + + +#### Limits + +The default configuration for this integration does not impose any limits on data collection. + +#### Performance Impact + +The default configuration for this integration is not expected to impose a significant performance impact on the system. + + +## Metrics + +Metrics grouped by *scope*. + +The scope defines the instance that the metric belongs to. An instance is uniquely identified by a set of labels. + + + +### Per Memcached instance + +These metrics refer to the entire monitored application. + +This scope has no labels. + +Metrics: + +| Metric | Dimensions | Unit | +|:------|:----------|:----| +| memcached.cache | available, used | MiB | +| memcached.net | in, out | kilobits/s | +| memcached.connections | current, rejected, total | connections/s | +| memcached.items | current, total | items | +| memcached.evicted_reclaimed | reclaimed, evicted | items | +| memcached.get | hints, misses | requests | +| memcached.get_rate | rate | requests/s | +| memcached.set_rate | rate | requests/s | +| memcached.delete | hits, misses | requests | +| memcached.cas | hits, misses, bad value | requests | +| memcached.increment | hits, misses | requests | +| memcached.decrement | hits, misses | requests | +| memcached.touch | hits, misses | requests | +| memcached.touch_rate | rate | requests/s | + + + +## Alerts + + +The following alerts are available: + +| Alert name | On metric | Description | +|:------------|:----------|:------------| +| [ memcached_cache_memory_usage ](https://github.com/netdata/netdata/blob/master/health/health.d/memcached.conf) | memcached.cache | cache memory utilization | +| [ memcached_cache_fill_rate ](https://github.com/netdata/netdata/blob/master/health/health.d/memcached.conf) | memcached.cache | average rate the cache fills up (positive), or frees up (negative) space over the last hour | +| [ memcached_out_of_cache_space_time ](https://github.com/netdata/netdata/blob/master/health/health.d/memcached.conf) | memcached.cache | estimated time the cache will run out of space if the system continues to add data at the same rate as the past hour | + + +## Setup + +### Prerequisites + +No action required. + +### Configuration + +#### File + +The configuration file name for this integration is `python.d/memcached.conf`. + + +You can edit the configuration file using the `edit-config` script from the +Netdata [config directory](https://github.com/netdata/netdata/blob/master/docs/configure/nodes.md#the-netdata-config-directory). + +```bash +cd /etc/netdata 2>/dev/null || cd /opt/netdata/etc/netdata +sudo ./edit-config python.d/memcached.conf +``` +#### Options + +There are 2 sections: + +* Global variables +* One or more JOBS that can define multiple different instances to monitor. + +The following options can be defined globally: priority, penalty, autodetection_retry, update_every, but can also be defined per JOB to override the global values. + +Additionally, the following collapsed table contains all the options that can be configured inside a JOB definition. + +Every configuration JOB starts with a `job_name` value which will appear in the dashboard, unless a `name` parameter is specified. + + +<details><summary>Config options</summary> + +| Name | Description | Default | Required | +|:----|:-----------|:-------|:--------:| +| host | the host to connect to. | 127.0.0.1 | False | +| port | the port to connect to. | 11211 | False | +| update_every | Sets the default data collection frequency. | 10 | False | +| priority | Controls the order of charts at the netdata dashboard. | 60000 | False | +| autodetection_retry | Sets the job re-check interval in seconds. | 0 | False | +| penalty | Indicates whether to apply penalty to update_every in case of failures. | yes | False | +| name | Job name. This value will overwrite the `job_name` value. JOBS with the same name are mutually exclusive. Only one of them will be allowed running at any time. This allows autodetection to try several alternatives and pick the one that works. | | False | + +</details> + +#### Examples + +##### localhost + +An example configuration for localhost. + +```yaml +localhost: + name: 'local' + host: 'localhost' + port: 11211 + +``` +##### localipv4 + +An example configuration for localipv4. + +<details><summary>Config</summary> + +```yaml +localhost: + name: 'local' + host: '127.0.0.1' + port: 11211 + +``` +</details> + +##### localipv6 + +An example configuration for localipv6. + +<details><summary>Config</summary> + +```yaml +localhost: + name: 'local' + host: '::1' + port: 11211 + +``` +</details> + + + +## Troubleshooting + +### Debug Mode + +To troubleshoot issues with the `memcached` collector, run the `python.d.plugin` with the debug option enabled. The output +should give you clues as to why the collector isn't working. + +- Navigate to the `plugins.d` directory, usually at `/usr/libexec/netdata/plugins.d/`. If that's not the case on + your system, open `netdata.conf` and look for the `plugins` setting under `[directories]`. + + ```bash + cd /usr/libexec/netdata/plugins.d/ + ``` + +- Switch to the `netdata` user. + + ```bash + sudo -u netdata -s + ``` + +- Run the `python.d.plugin` to debug the collector: + + ```bash + ./python.d.plugin memcached debug trace + ``` + + diff --git a/collectors/python.d.plugin/monit/README.md b/collectors/python.d.plugin/monit/README.md index f762de0d3..ac69496f4 100644..120000 --- a/collectors/python.d.plugin/monit/README.md +++ b/collectors/python.d.plugin/monit/README.md @@ -1,78 +1 @@ -<!-- -title: "Monit monitoring with Netdata" -custom_edit_url: "https://github.com/netdata/netdata/edit/master/collectors/python.d.plugin/monit/README.md" -sidebar_label: "Monit" -learn_status: "Published" -learn_topic_type: "References" -learn_rel_path: "Integrations/Monitor/Storage" ---> - -# Monit collector - -Monit monitoring module. Data is grabbed from stats XML interface (exists for a long time, but not mentioned in official -documentation). Mostly this plugin shows statuses of monit targets, i.e. -[statuses of specified checks](https://mmonit.com/monit/documentation/monit.html#Service-checks). - -1. **Filesystems** - - - Filesystems - - Directories - - Files - - Pipes - -2. **Applications** - - - Processes (+threads/childs) - - Programs - -3. **Network** - - - Hosts (+latency) - - Network interfaces - -## Configuration - -Edit the `python.d/monit.conf` configuration file using `edit-config` from the -Netdata [config directory](https://github.com/netdata/netdata/blob/master/docs/configure/nodes.md), which is typically -at `/etc/netdata`. - -```bash -cd /etc/netdata # Replace this path with your Netdata config directory, if different -sudo ./edit-config python.d/monit.conf -``` - -Sample: - -```yaml -local: - name: 'local' - url: 'http://localhost:2812' - user: : admin - pass: : monit -``` - -If no configuration is given, module will attempt to connect to monit as `http://localhost:2812`. - - - - -### Troubleshooting - -To troubleshoot issues with the `monit` module, run the `python.d.plugin` with the debug option enabled. The -output will give you the output of the data collection job or error messages on why the collector isn't working. - -First, navigate to your plugins directory, usually they are located under `/usr/libexec/netdata/plugins.d/`. If that's -not the case on your system, open `netdata.conf` and look for the setting `plugins directory`. Once you're in the -plugin's directory, switch to the `netdata` user. - -```bash -cd /usr/libexec/netdata/plugins.d/ -sudo su -s /bin/bash netdata -``` - -Now you can manually run the `monit` module in debug mode: - -```bash -./python.d.plugin monit debug trace -``` - +integrations/monit.md
\ No newline at end of file diff --git a/collectors/python.d.plugin/monit/integrations/monit.md b/collectors/python.d.plugin/monit/integrations/monit.md new file mode 100644 index 000000000..ecf522f84 --- /dev/null +++ b/collectors/python.d.plugin/monit/integrations/monit.md @@ -0,0 +1,213 @@ +<!--startmeta +custom_edit_url: "https://github.com/netdata/netdata/edit/master/collectors/python.d.plugin/monit/README.md" +meta_yaml: "https://github.com/netdata/netdata/edit/master/collectors/python.d.plugin/monit/metadata.yaml" +sidebar_label: "Monit" +learn_status: "Published" +learn_rel_path: "Data Collection/Synthetic Checks" +message: "DO NOT EDIT THIS FILE DIRECTLY, IT IS GENERATED BY THE COLLECTOR'S metadata.yaml FILE" +endmeta--> + +# Monit + + +<img src="https://netdata.cloud/img/monit.png" width="150"/> + + +Plugin: python.d.plugin +Module: monit + +<img src="https://img.shields.io/badge/maintained%20by-Netdata-%2300ab44" /> + +## Overview + +This collector monitors Monit targets such as filesystems, directories, files, FIFO pipes and more. + + +It gathers data from Monit's XML interface. + + +This collector is supported on all platforms. + +This collector supports collecting metrics from multiple instances of this integration, including remote instances. + + +### Default Behavior + +#### Auto-Detection + +By default, this collector will attempt to connect to Monit at `http://localhost:2812` + +#### Limits + +The default configuration for this integration does not impose any limits on data collection. + +#### Performance Impact + +The default configuration for this integration is not expected to impose a significant performance impact on the system. + + +## Metrics + +Metrics grouped by *scope*. + +The scope defines the instance that the metric belongs to. An instance is uniquely identified by a set of labels. + + + +### Per Monit instance + +These metrics refer to the entire monitored application. + +This scope has no labels. + +Metrics: + +| Metric | Dimensions | Unit | +|:------|:----------|:----| +| monit.filesystems | a dimension per target | filesystems | +| monit.directories | a dimension per target | directories | +| monit.files | a dimension per target | files | +| monit.fifos | a dimension per target | pipes | +| monit.programs | a dimension per target | programs | +| monit.services | a dimension per target | processes | +| monit.process_uptime | a dimension per target | seconds | +| monit.process_threads | a dimension per target | threads | +| monit.process_childrens | a dimension per target | children | +| monit.hosts | a dimension per target | hosts | +| monit.host_latency | a dimension per target | milliseconds | +| monit.networks | a dimension per target | interfaces | + + + +## Alerts + +There are no alerts configured by default for this integration. + + +## Setup + +### Prerequisites + +No action required. + +### Configuration + +#### File + +The configuration file name for this integration is `python.d/monit.conf`. + + +You can edit the configuration file using the `edit-config` script from the +Netdata [config directory](https://github.com/netdata/netdata/blob/master/docs/configure/nodes.md#the-netdata-config-directory). + +```bash +cd /etc/netdata 2>/dev/null || cd /opt/netdata/etc/netdata +sudo ./edit-config python.d/monit.conf +``` +#### Options + +There are 2 sections: + +* Global variables +* One or more JOBS that can define multiple different instances to monitor. + +The following options can be defined globally: priority, penalty, autodetection_retry, update_every, but can also be defined per JOB to override the global values. + +Additionally, the following collapsed table contains all the options that can be configured inside a JOB definition. + +Every configuration JOB starts with a `job_name` value which will appear in the dashboard, unless a `name` parameter is specified. + + +<details><summary>Config options</summary> + +| Name | Description | Default | Required | +|:----|:-----------|:-------|:--------:| +| update_every | Sets the default data collection frequency. | 1 | False | +| priority | Controls the order of charts at the netdata dashboard. | 60000 | False | +| autodetection_retry | Sets the job re-check interval in seconds. | 0 | False | +| penalty | Indicates whether to apply penalty to update_every in case of failures. | yes | False | +| name | Job name. This value will overwrite the `job_name` value. JOBS with the same name are mutually exclusive. Only one of them will be allowed running at any time. This allows autodetection to try several alternatives and pick the one that works. | local | False | +| url | The URL to fetch Monit's metrics. | http://localhost:2812 | True | +| user | Username in case the URL is password protected. | | False | +| pass | Password in case the URL is password protected. | | False | + +</details> + +#### Examples + +##### Basic + +A basic configuration example. + +```yaml +localhost: + name : 'local' + url : 'http://localhost:2812' + +``` +##### Basic Authentication + +Example using basic username and password in order to authenticate. + +<details><summary>Config</summary> + +```yaml +localhost: + name : 'local' + url : 'http://localhost:2812' + user: 'foo' + pass: 'bar' + +``` +</details> + +##### Multi-instance + +> **Note**: When you define multiple jobs, their names must be unique. + +Collecting metrics from local and remote instances. + + +<details><summary>Config</summary> + +```yaml +localhost: + name: 'local' + url: 'http://localhost:2812' + +remote_job: + name: 'remote' + url: 'http://192.0.2.1:2812' + +``` +</details> + + + +## Troubleshooting + +### Debug Mode + +To troubleshoot issues with the `monit` collector, run the `python.d.plugin` with the debug option enabled. The output +should give you clues as to why the collector isn't working. + +- Navigate to the `plugins.d` directory, usually at `/usr/libexec/netdata/plugins.d/`. If that's not the case on + your system, open `netdata.conf` and look for the `plugins` setting under `[directories]`. + + ```bash + cd /usr/libexec/netdata/plugins.d/ + ``` + +- Switch to the `netdata` user. + + ```bash + sudo -u netdata -s + ``` + +- Run the `python.d.plugin` to debug the collector: + + ```bash + ./python.d.plugin monit debug trace + ``` + + diff --git a/collectors/python.d.plugin/nsd/README.md b/collectors/python.d.plugin/nsd/README.md index ccc4e712b..59fcfe491 100644..120000 --- a/collectors/python.d.plugin/nsd/README.md +++ b/collectors/python.d.plugin/nsd/README.md @@ -1,91 +1 @@ -<!-- -title: "NSD monitoring with Netdata" -custom_edit_url: "https://github.com/netdata/netdata/edit/master/collectors/python.d.plugin/nsd/README.md" -sidebar_label: "NSD" -learn_status: "Published" -learn_topic_type: "References" -learn_rel_path: "Integrations/Monitor/Networking" ---> - -# NSD collector - -Uses the `nsd-control stats_noreset` command to provide `nsd` statistics. - -## Requirements - -- Version of `nsd` must be 4.0+ -- Netdata must have permissions to run `nsd-control stats_noreset` - -It produces: - -1. **Queries** - - - queries - -2. **Zones** - - - master - - slave - -3. **Protocol** - - - udp - - udp6 - - tcp - - tcp6 - -4. **Query Type** - - - A - - NS - - CNAME - - SOA - - PTR - - HINFO - - MX - - NAPTR - - TXT - - AAAA - - SRV - - ANY - -5. **Transfer** - - - NOTIFY - - AXFR - -6. **Return Code** - - - NOERROR - - FORMERR - - SERVFAIL - - NXDOMAIN - - NOTIMP - - REFUSED - - YXDOMAIN - -Configuration is not needed. - - - - -### Troubleshooting - -To troubleshoot issues with the `nsd` module, run the `python.d.plugin` with the debug option enabled. The -output will give you the output of the data collection job or error messages on why the collector isn't working. - -First, navigate to your plugins directory, usually they are located under `/usr/libexec/netdata/plugins.d/`. If that's -not the case on your system, open `netdata.conf` and look for the setting `plugins directory`. Once you're in the -plugin's directory, switch to the `netdata` user. - -```bash -cd /usr/libexec/netdata/plugins.d/ -sudo su -s /bin/bash netdata -``` - -Now you can manually run the `nsd` module in debug mode: - -```bash -./python.d.plugin nsd debug trace -``` - +integrations/name_server_daemon.md
\ No newline at end of file diff --git a/collectors/python.d.plugin/nsd/integrations/name_server_daemon.md b/collectors/python.d.plugin/nsd/integrations/name_server_daemon.md new file mode 100644 index 000000000..8ed86bdf9 --- /dev/null +++ b/collectors/python.d.plugin/nsd/integrations/name_server_daemon.md @@ -0,0 +1,198 @@ +<!--startmeta +custom_edit_url: "https://github.com/netdata/netdata/edit/master/collectors/python.d.plugin/nsd/README.md" +meta_yaml: "https://github.com/netdata/netdata/edit/master/collectors/python.d.plugin/nsd/metadata.yaml" +sidebar_label: "Name Server Daemon" +learn_status: "Published" +learn_rel_path: "Data Collection/DNS and DHCP Servers" +message: "DO NOT EDIT THIS FILE DIRECTLY, IT IS GENERATED BY THE COLLECTOR'S metadata.yaml FILE" +endmeta--> + +# Name Server Daemon + + +<img src="https://netdata.cloud/img/nsd.svg" width="150"/> + + +Plugin: python.d.plugin +Module: nsd + +<img src="https://img.shields.io/badge/maintained%20by-Netdata-%2300ab44" /> + +## Overview + +This collector monitors NSD statistics like queries, zones, protocols, query types and more. + + +It uses the `nsd-control stats_noreset` command to gather metrics. + + +This collector is supported on all platforms. + +This collector only supports collecting metrics from a single instance of this integration. + + +### Default Behavior + +#### Auto-Detection + +If permissions are satisfied, the collector will be able to run `nsd-control stats_noreset`, thus collecting metrics. + +#### Limits + +The default configuration for this integration does not impose any limits on data collection. + +#### Performance Impact + +The default configuration for this integration is not expected to impose a significant performance impact on the system. + + +## Metrics + +Metrics grouped by *scope*. + +The scope defines the instance that the metric belongs to. An instance is uniquely identified by a set of labels. + + + +### Per Name Server Daemon instance + +These metrics refer to the entire monitored application. + +This scope has no labels. + +Metrics: + +| Metric | Dimensions | Unit | +|:------|:----------|:----| +| nsd.queries | queries | queries/s | +| nsd.zones | master, slave | zones | +| nsd.protocols | udp, udp6, tcp, tcp6 | queries/s | +| nsd.type | A, NS, CNAME, SOA, PTR, HINFO, MX, NAPTR, TXT, AAAA, SRV, ANY | queries/s | +| nsd.transfer | NOTIFY, AXFR | queries/s | +| nsd.rcode | NOERROR, FORMERR, SERVFAIL, NXDOMAIN, NOTIMP, REFUSED, YXDOMAIN | queries/s | + + + +## Alerts + +There are no alerts configured by default for this integration. + + +## Setup + +### Prerequisites + +#### NSD version + +The version of `nsd` must be 4.0+. + + +#### Provide Netdata the permissions to run the command + +Netdata must have permissions to run the `nsd-control stats_noreset` command. + +You can: + +- Add "netdata" user to "nsd" group: + ``` + usermod -aG nsd netdata + ``` +- Add Netdata to sudoers + 1. Edit the sudoers file: + ``` + visudo -f /etc/sudoers.d/netdata + ``` + 2. Add the entry: + ``` + Defaults:netdata !requiretty + netdata ALL=(ALL) NOPASSWD: /usr/sbin/nsd-control stats_noreset + ``` + + > Note that you will need to set the `command` option to `sudo /usr/sbin/nsd-control stats_noreset` if you use this method. + + + +### Configuration + +#### File + +The configuration file name for this integration is `python.d/nsd.conf`. + + +You can edit the configuration file using the `edit-config` script from the +Netdata [config directory](https://github.com/netdata/netdata/blob/master/docs/configure/nodes.md#the-netdata-config-directory). + +```bash +cd /etc/netdata 2>/dev/null || cd /opt/netdata/etc/netdata +sudo ./edit-config python.d/nsd.conf +``` +#### Options + +This particular collector does not need further configuration to work if permissions are satisfied, but you can always customize it's data collection behavior. + +There are 2 sections: + +* Global variables +* One or more JOBS that can define multiple different instances to monitor. + +The following options can be defined globally: priority, penalty, autodetection_retry, update_every, but can also be defined per JOB to override the global values. + +Additionally, the following collapsed table contains all the options that can be configured inside a JOB definition. + +Every configuration JOB starts with a `job_name` value which will appear in the dashboard, unless a `name` parameter is specified. + + +<details><summary>Config options</summary> + +| Name | Description | Default | Required | +|:----|:-----------|:-------|:--------:| +| update_every | Sets the default data collection frequency. | 30 | False | +| priority | Controls the order of charts at the netdata dashboard. | 60000 | False | +| autodetection_retry | Sets the job re-check interval in seconds. | 0 | False | +| penalty | Indicates whether to apply penalty to update_every in case of failures. | yes | False | +| name | Job name. This value will overwrite the `job_name` value. JOBS with the same name are mutually exclusive. Only one of them will be allowed running at any time. This allows autodetection to try several alternatives and pick the one that works. | | False | +| command | The command to run | nsd-control stats_noreset | False | + +</details> + +#### Examples + +##### Basic + +A basic configuration example. + +```yaml +local: + name: 'nsd_local' + command: 'nsd-control stats_noreset' + +``` + + +## Troubleshooting + +### Debug Mode + +To troubleshoot issues with the `nsd` collector, run the `python.d.plugin` with the debug option enabled. The output +should give you clues as to why the collector isn't working. + +- Navigate to the `plugins.d` directory, usually at `/usr/libexec/netdata/plugins.d/`. If that's not the case on + your system, open `netdata.conf` and look for the `plugins` setting under `[directories]`. + + ```bash + cd /usr/libexec/netdata/plugins.d/ + ``` + +- Switch to the `netdata` user. + + ```bash + sudo -u netdata -s + ``` + +- Run the `python.d.plugin` to debug the collector: + + ```bash + ./python.d.plugin nsd debug trace + ``` + + diff --git a/collectors/python.d.plugin/nsd/metadata.yaml b/collectors/python.d.plugin/nsd/metadata.yaml index bd0a256f3..f5e2c46b0 100644 --- a/collectors/python.d.plugin/nsd/metadata.yaml +++ b/collectors/python.d.plugin/nsd/metadata.yaml @@ -40,6 +40,9 @@ modules: setup: prerequisites: list: + - title: NSD version + description: | + The version of `nsd` must be 4.0+. - title: Provide Netdata the permissions to run the command description: | Netdata must have permissions to run the `nsd-control stats_noreset` command. diff --git a/collectors/python.d.plugin/openldap/README.md b/collectors/python.d.plugin/openldap/README.md index eddf40b2c..45f36b9b9 100644..120000 --- a/collectors/python.d.plugin/openldap/README.md +++ b/collectors/python.d.plugin/openldap/README.md @@ -1,102 +1 @@ -<!-- -title: "OpenLDAP monitoring with Netdata" -custom_edit_url: "https://github.com/netdata/netdata/edit/master/collectors/python.d.plugin/openldap/README.md" -sidebar_label: "OpenLDAP" -learn_status: "Published" -learn_topic_type: "References" -learn_rel_path: "Integrations/Monitor/Networking" ---> - -# OpenLDAP collector - -Provides statistics information from openldap (slapd) server. -Statistics are taken from LDAP monitoring interface. Manual page, slapd-monitor(5) is available. - -**Requirement:** - -- Follow instructions from <https://www.openldap.org/doc/admin24/monitoringslapd.html> to activate monitoring interface. -- Install python ldap module `pip install ldap` or `yum install python-ldap` -- Modify openldap.conf with your credentials - -### Module gives information with following charts: - -1. **connections** - - - total connections number - -2. **Bytes** - - - sent - -3. **operations** - - - completed - - initiated - -4. **referrals** - - - sent - -5. **entries** - - - sent - -6. **ldap operations** - - - bind - - search - - unbind - - add - - delete - - modify - - compare - -7. **waiters** - - - read - - write - -## Configuration - -Edit the `python.d/openldap.conf` configuration file using `edit-config` from the Netdata [config -directory](https://github.com/netdata/netdata/blob/master/docs/configure/nodes.md), which is typically at `/etc/netdata`. - -```bash -cd /etc/netdata # Replace this path with your Netdata config directory, if different -sudo ./edit-config python.d/openldap.conf -``` - -Sample: - -```yaml -openldap: - name : 'local' - username : "cn=monitor,dc=superb,dc=eu" - password : "testpass" - server : 'localhost' - port : 389 -``` - - - - -### Troubleshooting - -To troubleshoot issues with the `openldap` module, run the `python.d.plugin` with the debug option enabled. The -output will give you the output of the data collection job or error messages on why the collector isn't working. - -First, navigate to your plugins directory, usually they are located under `/usr/libexec/netdata/plugins.d/`. If that's -not the case on your system, open `netdata.conf` and look for the setting `plugins directory`. Once you're in the -plugin's directory, switch to the `netdata` user. - -```bash -cd /usr/libexec/netdata/plugins.d/ -sudo su -s /bin/bash netdata -``` - -Now you can manually run the `openldap` module in debug mode: - -```bash -./python.d.plugin openldap debug trace -``` - +integrations/openldap.md
\ No newline at end of file diff --git a/collectors/python.d.plugin/openldap/integrations/openldap.md b/collectors/python.d.plugin/openldap/integrations/openldap.md new file mode 100644 index 000000000..375132edb --- /dev/null +++ b/collectors/python.d.plugin/openldap/integrations/openldap.md @@ -0,0 +1,214 @@ +<!--startmeta +custom_edit_url: "https://github.com/netdata/netdata/edit/master/collectors/python.d.plugin/openldap/README.md" +meta_yaml: "https://github.com/netdata/netdata/edit/master/collectors/python.d.plugin/openldap/metadata.yaml" +sidebar_label: "OpenLDAP" +learn_status: "Published" +learn_rel_path: "Data Collection/Authentication and Authorization" +message: "DO NOT EDIT THIS FILE DIRECTLY, IT IS GENERATED BY THE COLLECTOR'S metadata.yaml FILE" +endmeta--> + +# OpenLDAP + + +<img src="https://netdata.cloud/img/statsd.png" width="150"/> + + +Plugin: python.d.plugin +Module: openldap + +<img src="https://img.shields.io/badge/maintained%20by-Netdata-%2300ab44" /> + +## Overview + +This collector monitors OpenLDAP metrics about connections, operations, referrals and more. + +Statistics are taken from the monitoring interface of a openLDAP (slapd) server + + +This collector is supported on all platforms. + +This collector only supports collecting metrics from a single instance of this integration. + + +### Default Behavior + +#### Auto-Detection + +This collector doesn't work until all the prerequisites are checked. + + +#### Limits + +The default configuration for this integration does not impose any limits on data collection. + +#### Performance Impact + +The default configuration for this integration is not expected to impose a significant performance impact on the system. + + +## Metrics + +Metrics grouped by *scope*. + +The scope defines the instance that the metric belongs to. An instance is uniquely identified by a set of labels. + + + +### Per OpenLDAP instance + +These metrics refer to the entire monitored application. + +This scope has no labels. + +Metrics: + +| Metric | Dimensions | Unit | +|:------|:----------|:----| +| openldap.total_connections | connections | connections/s | +| openldap.traffic_stats | sent | KiB/s | +| openldap.operations_status | completed, initiated | ops/s | +| openldap.referrals | sent | referrals/s | +| openldap.entries | sent | entries/s | +| openldap.ldap_operations | bind, search, unbind, add, delete, modify, compare | ops/s | +| openldap.waiters | write, read | waiters/s | + + + +## Alerts + +There are no alerts configured by default for this integration. + + +## Setup + +### Prerequisites + +#### Configure the openLDAP server to expose metrics to monitor it. + +Follow instructions from https://www.openldap.org/doc/admin24/monitoringslapd.html to activate monitoring interface. + + +#### Install python-ldap module + +Install python ldap module + +1. From pip package manager + +```bash +pip install ldap +``` + +2. With apt package manager (in most deb based distros) + + +```bash +apt-get install python-ldap +``` + + +3. With yum package manager (in most rpm based distros) + + +```bash +yum install python-ldap +``` + + +#### Insert credentials for Netdata to access openLDAP server + +Use the `ldappasswd` utility to set a password for the username you will use. + + + +### Configuration + +#### File + +The configuration file name for this integration is `python.d/openldap.conf`. + + +You can edit the configuration file using the `edit-config` script from the +Netdata [config directory](https://github.com/netdata/netdata/blob/master/docs/configure/nodes.md#the-netdata-config-directory). + +```bash +cd /etc/netdata 2>/dev/null || cd /opt/netdata/etc/netdata +sudo ./edit-config python.d/openldap.conf +``` +#### Options + +There are 2 sections: + +* Global variables +* One or more JOBS that can define multiple different instances to monitor. + +The following options can be defined globally: priority, penalty, autodetection_retry, update_every, but can also be defined per JOB to override the global values. + +Additionally, the following collapsed table contains all the options that can be configured inside a JOB definition. + +Every configuration JOB starts with a `job_name` value which will appear in the dashboard, unless a `name` parameter is specified. + + +<details><summary>Config options</summary> + +| Name | Description | Default | Required | +|:----|:-----------|:-------|:--------:| +| update_every | Sets the default data collection frequency. | 5 | False | +| priority | Controls the order of charts at the netdata dashboard. | 60000 | False | +| autodetection_retry | Sets the job re-check interval in seconds. | 0 | False | +| penalty | Indicates whether to apply penalty to update_every in case of failures. | yes | False | +| name | Job name. This value will overwrite the `job_name` value. JOBS with the same name are mutually exclusive. Only one of them will be allowed running at any time. This allows autodetection to try several alternatives and pick the one that works. | | False | +| username | The bind user with right to access monitor statistics | | True | +| password | The password for the binded user | | True | +| server | The listening address of the LDAP server. In case of TLS, use the hostname which the certificate is published for. | | True | +| port | The listening port of the LDAP server. Change to 636 port in case of TLS connection. | 389 | True | +| use_tls | Make True if a TLS connection is used over ldaps:// | False | False | +| use_start_tls | Make True if a TLS connection is used over ldap:// | False | False | +| cert_check | False if you want to ignore certificate check | True | True | +| timeout | Seconds to timeout if no connection exist | | True | + +</details> + +#### Examples + +##### Basic + +A basic example configuration. + +```yaml +username: "cn=admin" +password: "pass" +server: "localhost" +port: "389" +check_cert: True +timeout: 1 + +``` + + +## Troubleshooting + +### Debug Mode + +To troubleshoot issues with the `openldap` collector, run the `python.d.plugin` with the debug option enabled. The output +should give you clues as to why the collector isn't working. + +- Navigate to the `plugins.d` directory, usually at `/usr/libexec/netdata/plugins.d/`. If that's not the case on + your system, open `netdata.conf` and look for the `plugins` setting under `[directories]`. + + ```bash + cd /usr/libexec/netdata/plugins.d/ + ``` + +- Switch to the `netdata` user. + + ```bash + sudo -u netdata -s + ``` + +- Run the `python.d.plugin` to debug the collector: + + ```bash + ./python.d.plugin openldap debug trace + ``` + + diff --git a/collectors/python.d.plugin/oracledb/README.md b/collectors/python.d.plugin/oracledb/README.md index 315816de0..a75e3611e 100644..120000 --- a/collectors/python.d.plugin/oracledb/README.md +++ b/collectors/python.d.plugin/oracledb/README.md @@ -1,115 +1 @@ -<!-- -title: "OracleDB monitoring with Netdata" -custom_edit_url: "https://github.com/netdata/netdata/edit/master/collectors/python.d.plugin/oracledb/README.md" -sidebar_label: "OracleDB" -learn_status: "Published" -learn_topic_type: "References" -learn_rel_path: "Integrations/Monitor/Databases" ---> - -# OracleDB collector - -Monitors the performance and health metrics of the Oracle database. - -## Requirements - -- `oracledb` package. - -It produces following charts: - -- session activity - - Session Count - - Session Limit Usage - - Logons -- disk activity - - Physical Disk Reads/Writes - - Sorts On Disk - - Full Table Scans -- database and buffer activity - - Database Wait Time Ratio - - Shared Pool Free Memory - - In-Memory Sorts Ratio - - SQL Service Response Time - - User Rollbacks - - Enqueue Timeouts -- cache - - Cache Hit Ratio - - Global Cache Blocks Events -- activities - - Activities -- wait time - - Wait Time -- tablespace - - Size - - Usage - - Usage In Percent -- allocated space - - Size - - Usage - - Usage In Percent - -## prerequisite - -To use the Oracle module do the following: - -1. Install `oracledb` package ([link](https://python-oracledb.readthedocs.io/en/latest/user_guide/installation.html)). - -2. Create a read-only `netdata` user with proper access to your Oracle Database Server. - -Connect to your Oracle database with an administrative user and execute: - -```SQL -CREATE USER netdata IDENTIFIED BY <PASSWORD>; - -GRANT CONNECT TO netdata; -GRANT SELECT_CATALOG_ROLE TO netdata; -``` - -## Configuration - -Edit the `python.d/oracledb.conf` configuration file using `edit-config` from the Netdata [config -directory](https://github.com/netdata/netdata/blob/master/docs/configure/nodes.md), which is typically at `/etc/netdata`. - -```bash -cd /etc/netdata # Replace this path with your Netdata config directory, if different -sudo ./edit-config python.d/oracledb.conf -``` - -```yaml -local: - user: 'netdata' - password: 'secret' - server: 'localhost:1521' - service: 'XE' - - -remote: - user: 'netdata' - password: 'secret' - server: '10.0.0.1:1521' - service: 'XE' -``` - -All parameters are required. Without them module will fail to start. - - -### Troubleshooting - -To troubleshoot issues with the `oracledb` module, run the `python.d.plugin` with the debug option enabled. The -output will give you the output of the data collection job or error messages on why the collector isn't working. - -First, navigate to your plugins directory, usually they are located under `/usr/libexec/netdata/plugins.d/`. If that's -not the case on your system, open `netdata.conf` and look for the setting `plugins directory`. Once you're in the -plugin's directory, switch to the `netdata` user. - -```bash -cd /usr/libexec/netdata/plugins.d/ -sudo su -s /bin/bash netdata -``` - -Now you can manually run the `oracledb` module in debug mode: - -```bash -./python.d.plugin oracledb debug trace -``` - +integrations/oracle_db.md
\ No newline at end of file diff --git a/collectors/python.d.plugin/oracledb/integrations/oracle_db.md b/collectors/python.d.plugin/oracledb/integrations/oracle_db.md new file mode 100644 index 000000000..cb6637e8a --- /dev/null +++ b/collectors/python.d.plugin/oracledb/integrations/oracle_db.md @@ -0,0 +1,225 @@ +<!--startmeta +custom_edit_url: "https://github.com/netdata/netdata/edit/master/collectors/python.d.plugin/oracledb/README.md" +meta_yaml: "https://github.com/netdata/netdata/edit/master/collectors/python.d.plugin/oracledb/metadata.yaml" +sidebar_label: "Oracle DB" +learn_status: "Published" +learn_rel_path: "Data Collection/Databases" +message: "DO NOT EDIT THIS FILE DIRECTLY, IT IS GENERATED BY THE COLLECTOR'S metadata.yaml FILE" +endmeta--> + +# Oracle DB + + +<img src="https://netdata.cloud/img/oracle.svg" width="150"/> + + +Plugin: python.d.plugin +Module: oracledb + +<img src="https://img.shields.io/badge/maintained%20by-Netdata-%2300ab44" /> + +## Overview + +This collector monitors OracleDB database metrics about sessions, tables, memory and more. + +It collects the metrics via the supported database client library + +This collector is supported on all platforms. + +This collector supports collecting metrics from multiple instances of this integration, including remote instances. + +In order for this collector to work, it needs a read-only user `netdata` in the RDBMS. + + +### Default Behavior + +#### Auto-Detection + +When the requirements are met, databases on the local host on port 1521 will be auto-detected + +#### Limits + +The default configuration for this integration does not impose any limits on data collection. + +#### Performance Impact + +The default configuration for this integration is not expected to impose a significant performance impact on the system. + + +## Metrics + +Metrics grouped by *scope*. + +The scope defines the instance that the metric belongs to. An instance is uniquely identified by a set of labels. + +These metrics refer to the entire monitored application. + +### Per Oracle DB instance + + + +This scope has no labels. + +Metrics: + +| Metric | Dimensions | Unit | +|:------|:----------|:----| +| oracledb.session_count | total, active | sessions | +| oracledb.session_limit_usage | usage | % | +| oracledb.logons | logons | events/s | +| oracledb.physical_disk_read_writes | reads, writes | events/s | +| oracledb.sorts_on_disks | sorts | events/s | +| oracledb.full_table_scans | full table scans | events/s | +| oracledb.database_wait_time_ratio | wait time ratio | % | +| oracledb.shared_pool_free_memory | free memory | % | +| oracledb.in_memory_sorts_ratio | in-memory sorts | % | +| oracledb.sql_service_response_time | time | seconds | +| oracledb.user_rollbacks | rollbacks | events/s | +| oracledb.enqueue_timeouts | enqueue timeouts | events/s | +| oracledb.cache_hit_ration | buffer, cursor, library, row | % | +| oracledb.global_cache_blocks | corrupted, lost | events/s | +| oracledb.activity | parse count, execute count, user commits, user rollbacks | events/s | +| oracledb.wait_time | application, configuration, administrative, concurrency, commit, network, user I/O, system I/O, scheduler, other | ms | +| oracledb.tablespace_size | a dimension per active tablespace | KiB | +| oracledb.tablespace_usage | a dimension per active tablespace | KiB | +| oracledb.tablespace_usage_in_percent | a dimension per active tablespace | % | +| oracledb.allocated_size | a dimension per active tablespace | B | +| oracledb.allocated_usage | a dimension per active tablespace | B | +| oracledb.allocated_usage_in_percent | a dimension per active tablespace | % | + + + +## Alerts + +There are no alerts configured by default for this integration. + + +## Setup + +### Prerequisites + +#### Install the python-oracledb package + +You can follow the official guide below to install the required package: + +Source: https://python-oracledb.readthedocs.io/en/latest/user_guide/installation.html + + +#### Create a read only user for netdata + +Follow the official instructions for your oracle RDBMS to create a read-only user for netdata. The operation may follow this approach + +Connect to your Oracle database with an administrative user and execute: + +```bash +CREATE USER netdata IDENTIFIED BY <PASSWORD>; + +GRANT CONNECT TO netdata; +GRANT SELECT_CATALOG_ROLE TO netdata; +``` + + +#### Edit the configuration + +Edit the configuration troubleshooting: + +1. Provide a valid user for the netdata collector to access the database +2. Specify the network target this database is listening. + + + +### Configuration + +#### File + +The configuration file name for this integration is `python.d/oracledb.conf`. + + +You can edit the configuration file using the `edit-config` script from the +Netdata [config directory](https://github.com/netdata/netdata/blob/master/docs/configure/nodes.md#the-netdata-config-directory). + +```bash +cd /etc/netdata 2>/dev/null || cd /opt/netdata/etc/netdata +sudo ./edit-config python.d/oracledb.conf +``` +#### Options + +There are 2 sections: + +* Global variables +* One or more JOBS that can define multiple different instances to monitor. + +The following options can be defined globally: priority, penalty, autodetection_retry, update_every, but can also be defined per JOB to override the global values. + +Additionally, the following collapsed table contains all the options that can be configured inside a JOB definition. + +Every configuration JOB starts with a `job_name` value which will appear in the dashboard, unless a `name` parameter is specified. + + +<details><summary>Config options</summary> + +| Name | Description | Default | Required | +|:----|:-----------|:-------|:--------:| +| update_every | Sets the default data collection frequency. | 5 | False | +| priority | Controls the order of charts at the netdata dashboard. | 60000 | False | +| autodetection_retry | Sets the job re-check interval in seconds. | 0 | False | +| penalty | Indicates whether to apply penalty to update_every in case of failures. | yes | False | +| user | The username for the user account. | no | True | +| password | The password for the user account. | no | True | +| server | The IP address or hostname (and port) of the Oracle Database Server. | no | True | +| service | The Oracle Database service name. To view the services available on your server run this query, `select SERVICE_NAME from gv$session where sid in (select sid from V$MYSTAT)`. | no | True | +| protocol | one of the strings "tcp" or "tcps" indicating whether to use unencrypted network traffic or encrypted network traffic | no | True | + +</details> + +#### Examples + +##### Basic + +A basic example configuration, two jobs described for two databases. + +```yaml +local: + user: 'netdata' + password: 'secret' + server: 'localhost:1521' + service: 'XE' + protocol: 'tcps' + +remote: + user: 'netdata' + password: 'secret' + server: '10.0.0.1:1521' + service: 'XE' + protocol: 'tcps' + +``` + + +## Troubleshooting + +### Debug Mode + +To troubleshoot issues with the `oracledb` collector, run the `python.d.plugin` with the debug option enabled. The output +should give you clues as to why the collector isn't working. + +- Navigate to the `plugins.d` directory, usually at `/usr/libexec/netdata/plugins.d/`. If that's not the case on + your system, open `netdata.conf` and look for the `plugins` setting under `[directories]`. + + ```bash + cd /usr/libexec/netdata/plugins.d/ + ``` + +- Switch to the `netdata` user. + + ```bash + sudo -u netdata -s + ``` + +- Run the `python.d.plugin` to debug the collector: + + ```bash + ./python.d.plugin oracledb debug trace + ``` + + diff --git a/collectors/python.d.plugin/pandas/README.md b/collectors/python.d.plugin/pandas/README.md index 19b11d5be..2fabe63c1 100644..120000 --- a/collectors/python.d.plugin/pandas/README.md +++ b/collectors/python.d.plugin/pandas/README.md @@ -1,96 +1 @@ -# Ingest structured data (Pandas) - -<a href="https://pandas.pydata.org/" target="_blank"> - <img src="https://pandas.pydata.org/docs/_static/pandas.svg" alt="Pandas" width="100px" height="50px" /> - </a> - -[Pandas](https://pandas.pydata.org/) is a de-facto standard in reading and processing most types of structured data in Python. -If you have metrics appearing in a CSV, JSON, XML, HTML, or [other supported format](https://pandas.pydata.org/docs/user_guide/io.html), -either locally or via some HTTP endpoint, you can easily ingest and present those metrics in Netdata, by leveraging the Pandas collector. - -The collector uses [pandas](https://pandas.pydata.org/) to pull data and do pandas-based -preprocessing, before feeding to Netdata. - -## Requirements - -This collector depends on some Python (Python 3 only) packages that can usually be installed via `pip` or `pip3`. - -```bash -sudo pip install pandas requests -``` - -Note: If you would like to use [`pandas.read_sql`](https://pandas.pydata.org/docs/reference/api/pandas.read_sql.html) to query a database, you will need to install the below packages as well. - -```bash -sudo pip install 'sqlalchemy<2.0' psycopg2-binary -``` - -## Configuration - -Below is an example configuration to query some json weather data from [Open-Meteo](https://open-meteo.com), -do some data wrangling on it and save in format as expected by Netdata. - -```yaml -# example pulling some hourly temperature data -temperature: - name: "temperature" - update_every: 3 - chart_configs: - - name: "temperature_by_city" - title: "Temperature By City" - family: "temperature.today" - context: "pandas.temperature" - type: "line" - units: "Celsius" - df_steps: > - pd.DataFrame.from_dict( - {city: requests.get( - f'https://api.open-meteo.com/v1/forecast?latitude={lat}&longitude={lng}&hourly=temperature_2m' - ).json()['hourly']['temperature_2m'] - for (city,lat,lng) - in [ - ('dublin', 53.3441, -6.2675), - ('athens', 37.9792, 23.7166), - ('london', 51.5002, -0.1262), - ('berlin', 52.5235, 13.4115), - ('paris', 48.8567, 2.3510), - ] - } - ); # use dictionary comprehension to make multiple requests; - df.describe(); # get aggregate stats for each city; - df.transpose()[['mean', 'max', 'min']].reset_index(); # just take mean, min, max; - df.rename(columns={'index':'city'}); # some column renaming; - df.pivot(columns='city').mean().to_frame().reset_index(); # force to be one row per city; - df.rename(columns={0:'degrees'}); # some column renaming; - pd.concat([df, df['city']+'_'+df['level_0']], axis=1); # add new column combining city and summary measurement label; - df.rename(columns={0:'measurement'}); # some column renaming; - df[['measurement', 'degrees']].set_index('measurement'); # just take two columns we want; - df.sort_index(); # sort by city name; - df.transpose(); # transpose so its just one wide row; -``` - -`chart_configs` is a list of dictionary objects where each one defines the sequence of `df_steps` to be run using [`pandas`](https://pandas.pydata.org/), -and the `name`, `title` etc to define the -[CHART variables](https://github.com/netdata/netdata/blob/master/docs/guides/python-collector.md#create-charts) -that will control how the results will look in netdata. - -The example configuration above would result in a `data` dictionary like the below being collected by Netdata -at each time step. They keys in this dictionary will be the "dimensions" of the chart. - -```javascript -{'athens_max': 26.2, 'athens_mean': 19.45952380952381, 'athens_min': 12.2, 'berlin_max': 17.4, 'berlin_mean': 10.764285714285714, 'berlin_min': 5.7, 'dublin_max': 15.3, 'dublin_mean': 12.008928571428571, 'dublin_min': 6.6, 'london_max': 18.9, 'london_mean': 12.510714285714286, 'london_min': 5.2, 'paris_max': 19.4, 'paris_mean': 12.054166666666665, 'paris_min': 4.8} -``` - -Which, given the above configuration would end up as a chart like below in Netdata. - -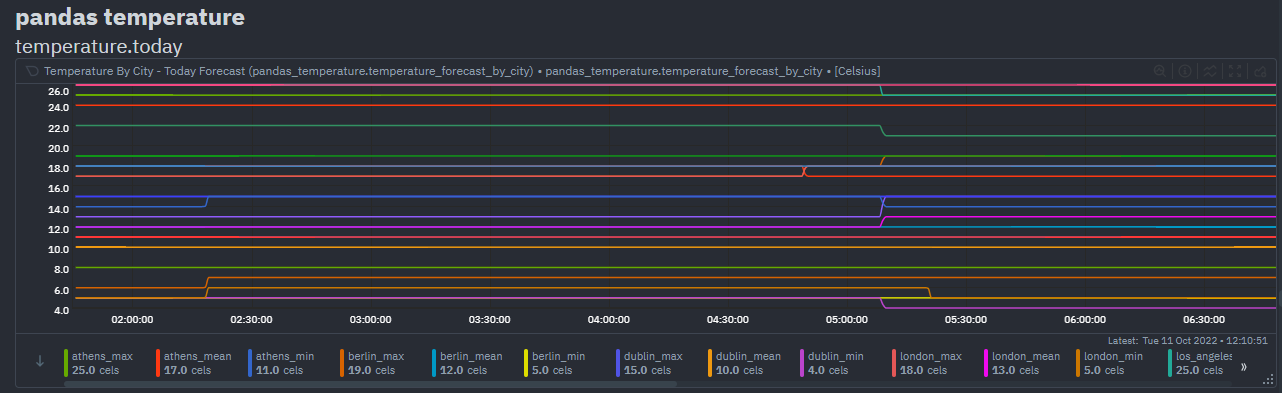 - -## Notes -- Each line in `df_steps` must return a pandas -[DataFrame](https://pandas.pydata.org/docs/reference/api/pandas.DataFrame.html) object (`df`) at each step. -- You can use -[this colab notebook](https://colab.research.google.com/drive/1VYrddSegZqGtkWGFuiUbMbUk5f3rW6Hi?usp=sharing) -to mock up and work on your `df_steps` iteratively before adding them to your config. -- This collector is expecting one row in the final pandas DataFrame. It is that first row that will be taken -as the most recent values for each dimension on each chart using (`df.to_dict(orient='records')[0]`). -See [pd.to_dict()](https://pandas.pydata.org/docs/reference/api/pandas.DataFrame.to_dict.html). +integrations/pandas.md
\ No newline at end of file diff --git a/collectors/python.d.plugin/pandas/integrations/pandas.md b/collectors/python.d.plugin/pandas/integrations/pandas.md new file mode 100644 index 000000000..d5da2f262 --- /dev/null +++ b/collectors/python.d.plugin/pandas/integrations/pandas.md @@ -0,0 +1,364 @@ +<!--startmeta +custom_edit_url: "https://github.com/netdata/netdata/edit/master/collectors/python.d.plugin/pandas/README.md" +meta_yaml: "https://github.com/netdata/netdata/edit/master/collectors/python.d.plugin/pandas/metadata.yaml" +sidebar_label: "Pandas" +learn_status: "Published" +learn_rel_path: "Data Collection/Generic Data Collection" +message: "DO NOT EDIT THIS FILE DIRECTLY, IT IS GENERATED BY THE COLLECTOR'S metadata.yaml FILE" +endmeta--> + +# Pandas + + +<img src="https://netdata.cloud/img/pandas.png" width="150"/> + + +Plugin: python.d.plugin +Module: pandas + +<img src="https://img.shields.io/badge/maintained%20by-Netdata-%2300ab44" /> + +## Overview + +[Pandas](https://pandas.pydata.org/) is a de-facto standard in reading and processing most types of structured data in Python. +If you have metrics appearing in a CSV, JSON, XML, HTML, or [other supported format](https://pandas.pydata.org/docs/user_guide/io.html), +either locally or via some HTTP endpoint, you can easily ingest and present those metrics in Netdata, by leveraging the Pandas collector. + +This collector can be used to collect pretty much anything that can be read by Pandas, and then processed by Pandas. + + +The collector uses [pandas](https://pandas.pydata.org/) to pull data and do pandas-based preprocessing, before feeding to Netdata. + + +This collector is supported on all platforms. + +This collector supports collecting metrics from multiple instances of this integration, including remote instances. + + +### Default Behavior + +#### Auto-Detection + +This integration doesn't support auto-detection. + +#### Limits + +The default configuration for this integration does not impose any limits on data collection. + +#### Performance Impact + +The default configuration for this integration is not expected to impose a significant performance impact on the system. + + +## Metrics + +Metrics grouped by *scope*. + +The scope defines the instance that the metric belongs to. An instance is uniquely identified by a set of labels. + +This collector is expecting one row in the final pandas DataFrame. It is that first row that will be taken +as the most recent values for each dimension on each chart using (`df.to_dict(orient='records')[0]`). +See [pd.to_dict()](https://pandas.pydata.org/docs/reference/api/pandas.DataFrame.to_dict.html)." + + +### Per Pandas instance + +These metrics refer to the entire monitored application. + + +This scope has no labels. + +Metrics: + +| Metric | Dimensions | Unit | +|:------|:----------|:----| + + + +## Alerts + +There are no alerts configured by default for this integration. + + +## Setup + +### Prerequisites + +#### Python Requirements + +This collector depends on some Python (Python 3 only) packages that can usually be installed via `pip` or `pip3`. + +```bash +sudo pip install pandas requests +``` + +Note: If you would like to use [`pandas.read_sql`](https://pandas.pydata.org/docs/reference/api/pandas.read_sql.html) to query a database, you will need to install the below packages as well. + +```bash +sudo pip install 'sqlalchemy<2.0' psycopg2-binary +``` + + + +### Configuration + +#### File + +The configuration file name for this integration is `python.d/pandas.conf`. + + +You can edit the configuration file using the `edit-config` script from the +Netdata [config directory](https://github.com/netdata/netdata/blob/master/docs/configure/nodes.md#the-netdata-config-directory). + +```bash +cd /etc/netdata 2>/dev/null || cd /opt/netdata/etc/netdata +sudo ./edit-config python.d/pandas.conf +``` +#### Options + +There are 2 sections: + +* Global variables +* One or more JOBS that can define multiple different instances to monitor. + +The following options can be defined globally: priority, penalty, autodetection_retry, update_every, but can also be defined per JOB to override the global values. + +Additionally, the following collapsed table contains all the options that can be configured inside a JOB definition. + +Every configuration JOB starts with a `job_name` value which will appear in the dashboard, unless a `name` parameter is specified. + + +<details><summary>Config options</summary> + +| Name | Description | Default | Required | +|:----|:-----------|:-------|:--------:| +| chart_configs | an array of chart configuration dictionaries | [] | True | +| chart_configs.name | name of the chart to be displayed in the dashboard. | None | True | +| chart_configs.title | title of the chart to be displayed in the dashboard. | None | True | +| chart_configs.family | [family](https://github.com/netdata/netdata/blob/master/docs/cloud/visualize/interact-new-charts.md#families) of the chart to be displayed in the dashboard. | None | True | +| chart_configs.context | [context](https://github.com/netdata/netdata/blob/master/docs/cloud/visualize/interact-new-charts.md#contexts) of the chart to be displayed in the dashboard. | None | True | +| chart_configs.type | the type of the chart to be displayed in the dashboard. | None | True | +| chart_configs.units | the units of the chart to be displayed in the dashboard. | None | True | +| chart_configs.df_steps | a series of pandas operations (one per line) that each returns a dataframe. | None | True | +| update_every | Sets the default data collection frequency. | 5 | False | +| priority | Controls the order of charts at the netdata dashboard. | 60000 | False | +| autodetection_retry | Sets the job re-check interval in seconds. | 0 | False | +| penalty | Indicates whether to apply penalty to update_every in case of failures. | yes | False | +| name | Job name. This value will overwrite the `job_name` value. JOBS with the same name are mutually exclusive. Only one of them will be allowed running at any time. This allows autodetection to try several alternatives and pick the one that works. | | False | + +</details> + +#### Examples + +##### Temperature API Example + +example pulling some hourly temperature data, a chart for today forecast (mean,min,max) and another chart for current. + +<details><summary>Config</summary> + +```yaml +temperature: + name: "temperature" + update_every: 5 + chart_configs: + - name: "temperature_forecast_by_city" + title: "Temperature By City - Today Forecast" + family: "temperature.today" + context: "pandas.temperature" + type: "line" + units: "Celsius" + df_steps: > + pd.DataFrame.from_dict( + {city: requests.get(f'https://api.open-meteo.com/v1/forecast?latitude={lat}&longitude={lng}&hourly=temperature_2m').json()['hourly']['temperature_2m'] + for (city,lat,lng) + in [ + ('dublin', 53.3441, -6.2675), + ('athens', 37.9792, 23.7166), + ('london', 51.5002, -0.1262), + ('berlin', 52.5235, 13.4115), + ('paris', 48.8567, 2.3510), + ('madrid', 40.4167, -3.7033), + ('new_york', 40.71, -74.01), + ('los_angeles', 34.05, -118.24), + ] + } + ); + df.describe(); # get aggregate stats for each city; + df.transpose()[['mean', 'max', 'min']].reset_index(); # just take mean, min, max; + df.rename(columns={'index':'city'}); # some column renaming; + df.pivot(columns='city').mean().to_frame().reset_index(); # force to be one row per city; + df.rename(columns={0:'degrees'}); # some column renaming; + pd.concat([df, df['city']+'_'+df['level_0']], axis=1); # add new column combining city and summary measurement label; + df.rename(columns={0:'measurement'}); # some column renaming; + df[['measurement', 'degrees']].set_index('measurement'); # just take two columns we want; + df.sort_index(); # sort by city name; + df.transpose(); # transpose so its just one wide row; + - name: "temperature_current_by_city" + title: "Temperature By City - Current" + family: "temperature.current" + context: "pandas.temperature" + type: "line" + units: "Celsius" + df_steps: > + pd.DataFrame.from_dict( + {city: requests.get(f'https://api.open-meteo.com/v1/forecast?latitude={lat}&longitude={lng}¤t_weather=true').json()['current_weather'] + for (city,lat,lng) + in [ + ('dublin', 53.3441, -6.2675), + ('athens', 37.9792, 23.7166), + ('london', 51.5002, -0.1262), + ('berlin', 52.5235, 13.4115), + ('paris', 48.8567, 2.3510), + ('madrid', 40.4167, -3.7033), + ('new_york', 40.71, -74.01), + ('los_angeles', 34.05, -118.24), + ] + } + ); + df.transpose(); + df[['temperature']]; + df.transpose(); + +``` +</details> + +##### API CSV Example + +example showing a read_csv from a url and some light pandas data wrangling. + +<details><summary>Config</summary> + +```yaml +example_csv: + name: "example_csv" + update_every: 2 + chart_configs: + - name: "london_system_cpu" + title: "London System CPU - Ratios" + family: "london_system_cpu" + context: "pandas" + type: "line" + units: "n" + df_steps: > + pd.read_csv('https://london.my-netdata.io/api/v1/data?chart=system.cpu&format=csv&after=-60', storage_options={'User-Agent': 'netdata'}); + df.drop('time', axis=1); + df.mean().to_frame().transpose(); + df.apply(lambda row: (row.user / row.system), axis = 1).to_frame(); + df.rename(columns={0:'average_user_system_ratio'}); + df*100; + +``` +</details> + +##### API JSON Example + +example showing a read_json from a url and some light pandas data wrangling. + +<details><summary>Config</summary> + +```yaml +example_json: + name: "example_json" + update_every: 2 + chart_configs: + - name: "london_system_net" + title: "London System Net - Total Bandwidth" + family: "london_system_net" + context: "pandas" + type: "area" + units: "kilobits/s" + df_steps: > + pd.DataFrame(requests.get('https://london.my-netdata.io/api/v1/data?chart=system.net&format=json&after=-1').json()['data'], columns=requests.get('https://london.my-netdata.io/api/v1/data?chart=system.net&format=json&after=-1').json()['labels']); + df.drop('time', axis=1); + abs(df); + df.sum(axis=1).to_frame(); + df.rename(columns={0:'total_bandwidth'}); + +``` +</details> + +##### XML Example + +example showing a read_xml from a url and some light pandas data wrangling. + +<details><summary>Config</summary> + +```yaml +example_xml: + name: "example_xml" + update_every: 2 + line_sep: "|" + chart_configs: + - name: "temperature_forcast" + title: "Temperature Forecast" + family: "temp" + context: "pandas.temp" + type: "line" + units: "celsius" + df_steps: > + pd.read_xml('http://metwdb-openaccess.ichec.ie/metno-wdb2ts/locationforecast?lat=54.7210798611;long=-8.7237392806', xpath='./product/time[1]/location/temperature', parser='etree')| + df.rename(columns={'value': 'dublin'})| + df[['dublin']]| + +``` +</details> + +##### SQL Example + +example showing a read_sql from a postgres database using sqlalchemy. + +<details><summary>Config</summary> + +```yaml +sql: + name: "sql" + update_every: 5 + chart_configs: + - name: "sql" + title: "SQL Example" + family: "sql.example" + context: "example" + type: "line" + units: "percent" + df_steps: > + pd.read_sql_query( + sql='\ + select \ + random()*100 as metric_1, \ + random()*100 as metric_2 \ + ', + con=create_engine('postgresql://localhost/postgres?user=netdata&password=netdata') + ); + +``` +</details> + + + +## Troubleshooting + +### Debug Mode + +To troubleshoot issues with the `pandas` collector, run the `python.d.plugin` with the debug option enabled. The output +should give you clues as to why the collector isn't working. + +- Navigate to the `plugins.d` directory, usually at `/usr/libexec/netdata/plugins.d/`. If that's not the case on + your system, open `netdata.conf` and look for the `plugins` setting under `[directories]`. + + ```bash + cd /usr/libexec/netdata/plugins.d/ + ``` + +- Switch to the `netdata` user. + + ```bash + sudo -u netdata -s + ``` + +- Run the `python.d.plugin` to debug the collector: + + ```bash + ./python.d.plugin pandas debug trace + ``` + + diff --git a/collectors/python.d.plugin/pandas/metadata.yaml b/collectors/python.d.plugin/pandas/metadata.yaml index 28a1d3b21..92ee1e986 100644 --- a/collectors/python.d.plugin/pandas/metadata.yaml +++ b/collectors/python.d.plugin/pandas/metadata.yaml @@ -5,7 +5,7 @@ modules: module_name: pandas monitored_instance: name: Pandas - link: https://learn.netdata.cloud/docs/data-collection/generic-data-collection/structured-data-pandas + link: https://pandas.pydata.org/ categories: - data-collection.generic-data-collection icon_filename: pandas.png @@ -26,8 +26,6 @@ modules: either locally or via some HTTP endpoint, you can easily ingest and present those metrics in Netdata, by leveraging the Pandas collector. This collector can be used to collect pretty much anything that can be read by Pandas, and then processed by Pandas. - - More detailed information can be found in the Netdata documentation [here](https://learn.netdata.cloud/docs/data-collection/generic-data-collection/structured-data-pandas). method_description: | The collector uses [pandas](https://pandas.pydata.org/) to pull data and do pandas-based preprocessing, before feeding to Netdata. supported_platforms: @@ -92,11 +90,11 @@ modules: default_value: None required: true - name: chart_configs.family - description: "[family](https://learn.netdata.cloud/docs/data-collection/chart-dimensions-contexts-and-families#family) of the chart to be displayed in the dashboard." + description: "[family](https://github.com/netdata/netdata/blob/master/docs/cloud/visualize/interact-new-charts.md#families) of the chart to be displayed in the dashboard." default_value: None required: true - name: chart_configs.context - description: "[context](https://learn.netdata.cloud/docs/data-collection/chart-dimensions-contexts-and-families#context) of the chart to be displayed in the dashboard." + description: "[context](https://github.com/netdata/netdata/blob/master/docs/cloud/visualize/interact-new-charts.md#contexts) of the chart to be displayed in the dashboard." default_value: None required: true - name: chart_configs.type diff --git a/collectors/python.d.plugin/postfix/README.md b/collectors/python.d.plugin/postfix/README.md index ba5565499..c62eb5c24 100644..120000 --- a/collectors/python.d.plugin/postfix/README.md +++ b/collectors/python.d.plugin/postfix/README.md @@ -1,59 +1 @@ -<!-- -title: "Postfix monitoring with Netdata" -custom_edit_url: "https://github.com/netdata/netdata/edit/master/collectors/python.d.plugin/postfix/README.md" -sidebar_label: "Postfix" -learn_status: "Published" -learn_topic_type: "References" -learn_rel_path: "Integrations/Monitor/Webapps" ---> - -# Postfix collector - -Monitors MTA email queue statistics using [postqueue](http://www.postfix.org/postqueue.1.html) tool. - -The collector executes `postqueue -p` to get Postfix queue statistics. - -## Requirements - -Postfix has internal access controls that limit activities on the mail queue. By default, all users are allowed to view -the queue. If your system is configured with stricter access controls, you need to grant the `netdata` user access to -view the mail queue. In order to do it, add `netdata` to `authorized_mailq_users` in the `/etc/postfix/main.cf` file. - -See the `authorized_mailq_users` setting in -the [Postfix documentation](https://www.postfix.org/postconf.5.html) for more details. - -## Charts - -It produces only two charts: - -1. **Postfix Queue Emails** - - - emails - -2. **Postfix Queue Emails Size** in KB - - - size - -## Configuration - -Configuration is not needed. -### Troubleshooting - -To troubleshoot issues with the `postfix` module, run the `python.d.plugin` with the debug option enabled. The -output will give you the output of the data collection job or error messages on why the collector isn't working. - -First, navigate to your plugins directory, usually they are located under `/usr/libexec/netdata/plugins.d/`. If that's -not the case on your system, open `netdata.conf` and look for the setting `plugins directory`. Once you're in the -plugin's directory, switch to the `netdata` user. - -```bash -cd /usr/libexec/netdata/plugins.d/ -sudo su -s /bin/bash netdata -``` - -Now you can manually run the `postfix` module in debug mode: - -```bash -./python.d.plugin postfix debug trace -``` - +integrations/postfix.md
\ No newline at end of file diff --git a/collectors/python.d.plugin/postfix/integrations/postfix.md b/collectors/python.d.plugin/postfix/integrations/postfix.md new file mode 100644 index 000000000..7113d7ddd --- /dev/null +++ b/collectors/python.d.plugin/postfix/integrations/postfix.md @@ -0,0 +1,150 @@ +<!--startmeta +custom_edit_url: "https://github.com/netdata/netdata/edit/master/collectors/python.d.plugin/postfix/README.md" +meta_yaml: "https://github.com/netdata/netdata/edit/master/collectors/python.d.plugin/postfix/metadata.yaml" +sidebar_label: "Postfix" +learn_status: "Published" +learn_rel_path: "Data Collection/Mail Servers" +message: "DO NOT EDIT THIS FILE DIRECTLY, IT IS GENERATED BY THE COLLECTOR'S metadata.yaml FILE" +endmeta--> + +# Postfix + + +<img src="https://netdata.cloud/img/postfix.svg" width="150"/> + + +Plugin: python.d.plugin +Module: postfix + +<img src="https://img.shields.io/badge/maintained%20by-Netdata-%2300ab44" /> + +## Overview + +Keep an eye on Postfix metrics for efficient mail server operations. +Improve your mail server performance with Netdata's real-time metrics and built-in alerts. + + +Monitors MTA email queue statistics using [postqueue](http://www.postfix.org/postqueue.1.html) tool. + + +This collector is supported on all platforms. + +This collector supports collecting metrics from multiple instances of this integration, including remote instances. + +Postfix has internal access controls that limit activities on the mail queue. By default, all users are allowed to view the queue. If your system is configured with stricter access controls, you need to grant the `netdata` user access to view the mail queue. In order to do it, add `netdata` to `authorized_mailq_users` in the `/etc/postfix/main.cf` file. +See the `authorized_mailq_users` setting in the [Postfix documentation](https://www.postfix.org/postconf.5.html) for more details. + + +### Default Behavior + +#### Auto-Detection + +The collector executes `postqueue -p` to get Postfix queue statistics. + +#### Limits + +The default configuration for this integration does not impose any limits on data collection. + +#### Performance Impact + +The default configuration for this integration is not expected to impose a significant performance impact on the system. + + +## Metrics + +Metrics grouped by *scope*. + +The scope defines the instance that the metric belongs to. An instance is uniquely identified by a set of labels. + + + +### Per Postfix instance + +These metrics refer to the entire monitored application. + + +This scope has no labels. + +Metrics: + +| Metric | Dimensions | Unit | +|:------|:----------|:----| +| postfix.qemails | emails | emails | +| postfix.qsize | size | KiB | + + + +## Alerts + +There are no alerts configured by default for this integration. + + +## Setup + +### Prerequisites + +No action required. + +### Configuration + +#### File + +There is no configuration file. +#### Options + +There are 2 sections: + +* Global variables +* One or more JOBS that can define multiple different instances to monitor. + +The following options can be defined globally: priority, penalty, autodetection_retry, update_every, but can also be defined per JOB to override the global values. + +Additionally, the following collapsed table contains all the options that can be configured inside a JOB definition. + +Every configuration JOB starts with a `job_name` value which will appear in the dashboard, unless a `name` parameter is specified. + + +<details><summary>Config options</summary> + +| Name | Description | Default | Required | +|:----|:-----------|:-------|:--------:| +| update_every | Sets the default data collection frequency. | 1 | False | +| priority | Controls the order of charts at the netdata dashboard. | 60000 | False | +| autodetection_retry | Sets the job re-check interval in seconds. | 0 | False | +| penalty | Indicates whether to apply penalty to update_every in case of failures. | yes | False | +| name | Job name. This value will overwrite the `job_name` value. JOBS with the same name are mutually exclusive. Only one of them will be allowed running at any time. This allows autodetection to try several alternatives and pick the one that works. | | False | + +</details> + +#### Examples +There are no configuration examples. + + + +## Troubleshooting + +### Debug Mode + +To troubleshoot issues with the `postfix` collector, run the `python.d.plugin` with the debug option enabled. The output +should give you clues as to why the collector isn't working. + +- Navigate to the `plugins.d` directory, usually at `/usr/libexec/netdata/plugins.d/`. If that's not the case on + your system, open `netdata.conf` and look for the `plugins` setting under `[directories]`. + + ```bash + cd /usr/libexec/netdata/plugins.d/ + ``` + +- Switch to the `netdata` user. + + ```bash + sudo -u netdata -s + ``` + +- Run the `python.d.plugin` to debug the collector: + + ```bash + ./python.d.plugin postfix debug trace + ``` + + diff --git a/collectors/python.d.plugin/puppet/README.md b/collectors/python.d.plugin/puppet/README.md index 3b0c55b97..b6c4c83f9 100644..120000 --- a/collectors/python.d.plugin/puppet/README.md +++ b/collectors/python.d.plugin/puppet/README.md @@ -1,90 +1 @@ -<!-- -title: "Puppet monitoring with Netdata" -custom_edit_url: "https://github.com/netdata/netdata/edit/master/collectors/python.d.plugin/puppet/README.md" -sidebar_label: "Puppet" -learn_status: "Published" -learn_topic_type: "References" -learn_rel_path: "Integrations/Monitor/Provisioning tools" ---> - -# Puppet collector - -Monitor status of Puppet Server and Puppet DB. - -Following charts are drawn: - -1. **JVM Heap** - - - committed (allocated from OS) - - used (actual use) - -2. **JVM Non-Heap** - - - committed (allocated from OS) - - used (actual use) - -3. **CPU Usage** - - - execution - - GC (taken by garbage collection) - -4. **File Descriptors** - - - max - - used - -## Configuration - -Edit the `python.d/puppet.conf` configuration file using `edit-config` from the Netdata [config -directory](https://github.com/netdata/netdata/blob/master/docs/configure/nodes.md), which is typically at `/etc/netdata`. - -```bash -cd /etc/netdata # Replace this path with your Netdata config directory, if different -sudo ./edit-config python.d/puppet.conf -``` - -```yaml -puppetdb: - url: 'https://fqdn.example.com:8081' - tls_cert_file: /path/to/client.crt - tls_key_file: /path/to/client.key - autodetection_retry: 1 - -puppetserver: - url: 'https://fqdn.example.com:8140' - autodetection_retry: 1 -``` - -When no configuration is given, module uses `https://fqdn.example.com:8140`. - -### notes - -- Exact Fully Qualified Domain Name of the node should be used. -- Usually Puppet Server/DB startup time is VERY long. So, there should - be quite reasonable retry count. -- Secure PuppetDB config may require client certificate. Not applies - to default PuppetDB configuration though. - - - - -### Troubleshooting - -To troubleshoot issues with the `puppet` module, run the `python.d.plugin` with the debug option enabled. The -output will give you the output of the data collection job or error messages on why the collector isn't working. - -First, navigate to your plugins directory, usually they are located under `/usr/libexec/netdata/plugins.d/`. If that's -not the case on your system, open `netdata.conf` and look for the setting `plugins directory`. Once you're in the -plugin's directory, switch to the `netdata` user. - -```bash -cd /usr/libexec/netdata/plugins.d/ -sudo su -s /bin/bash netdata -``` - -Now you can manually run the `puppet` module in debug mode: - -```bash -./python.d.plugin puppet debug trace -``` - +integrations/puppet.md
\ No newline at end of file diff --git a/collectors/python.d.plugin/puppet/integrations/puppet.md b/collectors/python.d.plugin/puppet/integrations/puppet.md new file mode 100644 index 000000000..be68749a3 --- /dev/null +++ b/collectors/python.d.plugin/puppet/integrations/puppet.md @@ -0,0 +1,214 @@ +<!--startmeta +custom_edit_url: "https://github.com/netdata/netdata/edit/master/collectors/python.d.plugin/puppet/README.md" +meta_yaml: "https://github.com/netdata/netdata/edit/master/collectors/python.d.plugin/puppet/metadata.yaml" +sidebar_label: "Puppet" +learn_status: "Published" +learn_rel_path: "Data Collection/CICD Platforms" +message: "DO NOT EDIT THIS FILE DIRECTLY, IT IS GENERATED BY THE COLLECTOR'S metadata.yaml FILE" +endmeta--> + +# Puppet + + +<img src="https://netdata.cloud/img/puppet.svg" width="150"/> + + +Plugin: python.d.plugin +Module: puppet + +<img src="https://img.shields.io/badge/maintained%20by-Netdata-%2300ab44" /> + +## Overview + +This collector monitors Puppet metrics about JVM Heap, Non-Heap, CPU usage and file descriptors.' + + +It uses Puppet's metrics API endpoint to gather the metrics. + + +This collector is supported on all platforms. + +This collector supports collecting metrics from multiple instances of this integration, including remote instances. + + +### Default Behavior + +#### Auto-Detection + +By default, this collector will use `https://fqdn.example.com:8140` as the URL to look for metrics. + +#### Limits + +The default configuration for this integration does not impose any limits on data collection. + +#### Performance Impact + +The default configuration for this integration is not expected to impose a significant performance impact on the system. + + +## Metrics + +Metrics grouped by *scope*. + +The scope defines the instance that the metric belongs to. An instance is uniquely identified by a set of labels. + + + +### Per Puppet instance + +These metrics refer to the entire monitored application. + +This scope has no labels. + +Metrics: + +| Metric | Dimensions | Unit | +|:------|:----------|:----| +| puppet.jvm | committed, used | MiB | +| puppet.jvm | committed, used | MiB | +| puppet.cpu | execution, GC | percentage | +| puppet.fdopen | used | descriptors | + + + +## Alerts + +There are no alerts configured by default for this integration. + + +## Setup + +### Prerequisites + +No action required. + +### Configuration + +#### File + +The configuration file name for this integration is `python.d/puppet.conf`. + + +You can edit the configuration file using the `edit-config` script from the +Netdata [config directory](https://github.com/netdata/netdata/blob/master/docs/configure/nodes.md#the-netdata-config-directory). + +```bash +cd /etc/netdata 2>/dev/null || cd /opt/netdata/etc/netdata +sudo ./edit-config python.d/puppet.conf +``` +#### Options + +This particular collector does not need further configuration to work if permissions are satisfied, but you can always customize it's data collection behavior. + +There are 2 sections: + +* Global variables +* One or more JOBS that can define multiple different instances to monitor. + +The following options can be defined globally: priority, penalty, autodetection_retry, update_every, but can also be defined per JOB to override the global values. + +Additionally, the following collapsed table contains all the options that can be configured inside a JOB definition. + +Every configuration JOB starts with a `job_name` value which will appear in the dashboard, unless a `name` parameter is specified. + +> Notes: +> - Exact Fully Qualified Domain Name of the node should be used. +> - Usually Puppet Server/DB startup time is VERY long. So, there should be quite reasonable retry count. +> - A secured PuppetDB config may require a client certificate. This does not apply to the default PuppetDB configuration though. + + +<details><summary>Config options</summary> + +| Name | Description | Default | Required | +|:----|:-----------|:-------|:--------:| +| url | HTTP or HTTPS URL, exact Fully Qualified Domain Name of the node should be used. | https://fqdn.example.com:8081 | True | +| tls_verify | Control HTTPS server certificate verification. | False | False | +| tls_ca_file | Optional CA (bundle) file to use | | False | +| tls_cert_file | Optional client certificate file | | False | +| tls_key_file | Optional client key file | | False | +| update_every | Sets the default data collection frequency. | 30 | False | +| priority | Controls the order of charts at the netdata dashboard. | 60000 | False | +| autodetection_retry | Sets the job re-check interval in seconds. | 0 | False | +| penalty | Indicates whether to apply penalty to update_every in case of failures. | yes | False | +| name | Job name. This value will overwrite the `job_name` value. JOBS with the same name are mutually exclusive. Only one of them will be allowed running at any time. This allows autodetection to try several alternatives and pick the one that works. | | False | + +</details> + +#### Examples + +##### Basic + +A basic example configuration + +```yaml +puppetserver: + url: 'https://fqdn.example.com:8140' + autodetection_retry: 1 + +``` +##### TLS Certificate + +An example using a TLS certificate + +<details><summary>Config</summary> + +```yaml +puppetdb: + url: 'https://fqdn.example.com:8081' + tls_cert_file: /path/to/client.crt + tls_key_file: /path/to/client.key + autodetection_retry: 1 + +``` +</details> + +##### Multi-instance + +> **Note**: When you define multiple jobs, their names must be unique. + +Collecting metrics from local and remote instances. + + +<details><summary>Config</summary> + +```yaml +puppetserver1: + url: 'https://fqdn.example.com:8140' + autodetection_retry: 1 + +puppetserver2: + url: 'https://fqdn.example2.com:8140' + autodetection_retry: 1 + +``` +</details> + + + +## Troubleshooting + +### Debug Mode + +To troubleshoot issues with the `puppet` collector, run the `python.d.plugin` with the debug option enabled. The output +should give you clues as to why the collector isn't working. + +- Navigate to the `plugins.d` directory, usually at `/usr/libexec/netdata/plugins.d/`. If that's not the case on + your system, open `netdata.conf` and look for the `plugins` setting under `[directories]`. + + ```bash + cd /usr/libexec/netdata/plugins.d/ + ``` + +- Switch to the `netdata` user. + + ```bash + sudo -u netdata -s + ``` + +- Run the `python.d.plugin` to debug the collector: + + ```bash + ./python.d.plugin puppet debug trace + ``` + + diff --git a/collectors/python.d.plugin/python.d.plugin.in b/collectors/python.d.plugin/python.d.plugin.in index 681ceb403..bc171e032 100644 --- a/collectors/python.d.plugin/python.d.plugin.in +++ b/collectors/python.d.plugin/python.d.plugin.in @@ -582,8 +582,8 @@ class Plugin: try: statuses = JobsStatuses().from_file(abs_path) except Exception as error: - self.log.error("[{0}] config file invalid YAML format: {1}".format( - module_name, ' '.join([v.strip() for v in str(error).split('\n')]))) + self.log.error("'{0}' invalid JSON format: {1}".format( + abs_path, ' '.join([v.strip() for v in str(error).split('\n')]))) return None self.log.debug("'{0}' is loaded".format(abs_path)) return statuses @@ -876,6 +876,17 @@ def main(): cmd = parse_command_line() log = PythonDLogger() + level = os.getenv('NETDATA_LOG_SEVERITY_LEVEL') or str() + level = level.lower() + if level == 'debug': + log.logger.severity = 'DEBUG' + elif level == 'info': + log.logger.severity = 'INFO' + elif level == 'warn' or level == 'warning': + log.logger.severity = 'WARNING' + elif level == 'err' or level == 'error': + log.logger.severity = 'ERROR' + if cmd.debug: log.logger.severity = 'DEBUG' if cmd.trace: diff --git a/collectors/python.d.plugin/rethinkdbs/README.md b/collectors/python.d.plugin/rethinkdbs/README.md index 527ce4c31..78ddcfa18 100644..120000 --- a/collectors/python.d.plugin/rethinkdbs/README.md +++ b/collectors/python.d.plugin/rethinkdbs/README.md @@ -1,77 +1 @@ -<!-- -title: "RethinkDB monitoring with Netdata" -custom_edit_url: "https://github.com/netdata/netdata/edit/master/collectors/python.d.plugin/rethinkdbs/README.md" -sidebar_label: "RethinkDB" -learn_status: "Published" -learn_topic_type: "References" -learn_rel_path: "Integrations/Monitor/Databases" ---> - -# RethinkDB collector - -Collects database server and cluster statistics. - -Following charts are drawn: - -1. **Connected Servers** - - - connected - - missing - -2. **Active Clients** - - - active - -3. **Queries** per second - - - queries - -4. **Documents** per second - - - documents - -## Configuration - -Edit the `python.d/rethinkdbs.conf` configuration file using `edit-config` from the -Netdata [config directory](https://github.com/netdata/netdata/blob/master/docs/configure/nodes.md), which is typically -at `/etc/netdata`. - -```bash -cd /etc/netdata # Replace this path with your Netdata config directory, if different -sudo ./edit-config python.d/rethinkdbs.conf -``` - -```yaml -localhost: - name: 'local' - host: '127.0.0.1' - port: 28015 - user: "user" - password: "pass" -``` - -When no configuration file is found, module tries to connect to `127.0.0.1:28015`. - - - - -### Troubleshooting - -To troubleshoot issues with the `rethinkdbs` module, run the `python.d.plugin` with the debug option enabled. The -output will give you the output of the data collection job or error messages on why the collector isn't working. - -First, navigate to your plugins directory, usually they are located under `/usr/libexec/netdata/plugins.d/`. If that's -not the case on your system, open `netdata.conf` and look for the setting `plugins directory`. Once you're in the -plugin's directory, switch to the `netdata` user. - -```bash -cd /usr/libexec/netdata/plugins.d/ -sudo su -s /bin/bash netdata -``` - -Now you can manually run the `rethinkdbs` module in debug mode: - -```bash -./python.d.plugin rethinkdbs debug trace -``` - +integrations/rethinkdb.md
\ No newline at end of file diff --git a/collectors/python.d.plugin/rethinkdbs/integrations/rethinkdb.md b/collectors/python.d.plugin/rethinkdbs/integrations/rethinkdb.md new file mode 100644 index 000000000..c0b2cfbfd --- /dev/null +++ b/collectors/python.d.plugin/rethinkdbs/integrations/rethinkdb.md @@ -0,0 +1,189 @@ +<!--startmeta +custom_edit_url: "https://github.com/netdata/netdata/edit/master/collectors/python.d.plugin/rethinkdbs/README.md" +meta_yaml: "https://github.com/netdata/netdata/edit/master/collectors/python.d.plugin/rethinkdbs/metadata.yaml" +sidebar_label: "RethinkDB" +learn_status: "Published" +learn_rel_path: "Data Collection/Databases" +message: "DO NOT EDIT THIS FILE DIRECTLY, IT IS GENERATED BY THE COLLECTOR'S metadata.yaml FILE" +endmeta--> + +# RethinkDB + + +<img src="https://netdata.cloud/img/rethinkdb.png" width="150"/> + + +Plugin: python.d.plugin +Module: rethinkdbs + +<img src="https://img.shields.io/badge/maintained%20by-Netdata-%2300ab44" /> + +## Overview + +This collector monitors metrics about RethinkDB clusters and database servers. + +It uses the `rethinkdb` python module to connect to a RethinkDB server instance and gather statistics. + +This collector is supported on all platforms. + +This collector supports collecting metrics from multiple instances of this integration, including remote instances. + + +### Default Behavior + +#### Auto-Detection + +When no configuration file is found, the collector tries to connect to 127.0.0.1:28015. + +#### Limits + +The default configuration for this integration does not impose any limits on data collection. + +#### Performance Impact + +The default configuration for this integration is not expected to impose a significant performance impact on the system. + + +## Metrics + +Metrics grouped by *scope*. + +The scope defines the instance that the metric belongs to. An instance is uniquely identified by a set of labels. + + + +### Per RethinkDB instance + +These metrics refer to the entire monitored application. + +This scope has no labels. + +Metrics: + +| Metric | Dimensions | Unit | +|:------|:----------|:----| +| rethinkdb.cluster_connected_servers | connected, missing | servers | +| rethinkdb.cluster_clients_active | active | clients | +| rethinkdb.cluster_queries | queries | queries/s | +| rethinkdb.cluster_documents | reads, writes | documents/s | + +### Per database server + + + +This scope has no labels. + +Metrics: + +| Metric | Dimensions | Unit | +|:------|:----------|:----| +| rethinkdb.client_connections | connections | connections | +| rethinkdb.clients_active | active | clients | +| rethinkdb.queries | queries | queries/s | +| rethinkdb.documents | reads, writes | documents/s | + + + +## Alerts + +There are no alerts configured by default for this integration. + + +## Setup + +### Prerequisites + +#### Required python module + +The collector requires the `rethinkdb` python module to be installed. + + +### Configuration + +#### File + +The configuration file name for this integration is `python.d/rethinkdbs.conf`. + + +You can edit the configuration file using the `edit-config` script from the +Netdata [config directory](https://github.com/netdata/netdata/blob/master/docs/configure/nodes.md#the-netdata-config-directory). + +```bash +cd /etc/netdata 2>/dev/null || cd /opt/netdata/etc/netdata +sudo ./edit-config python.d/rethinkdbs.conf +``` +#### Options + +There are 2 sections: + +* Global variables +* One or more JOBS that can define multiple different instances to monitor. + +The following options can be defined globally: priority, penalty, autodetection_retry, update_every, but can also be defined per JOB to override the global values. + +Additionally, the following collapsed table contains all the options that can be configured inside a JOB definition. + +Every configuration JOB starts with a `job_name` value which will appear in the dashboard, unless a `name` parameter is specified. + + +<details><summary>Config options</summary> + +| Name | Description | Default | Required | +|:----|:-----------|:-------|:--------:| +| update_every | Sets the default data collection frequency. | 5 | False | +| priority | Controls the order of charts at the netdata dashboard. | 60000 | False | +| autodetection_retry | Sets the job re-check interval in seconds. | 0 | False | +| penalty | Indicates whether to apply penalty to update_every in case of failures. | yes | False | +| name | Job name. This value will overwrite the `job_name` value. JOBS with the same name are mutually exclusive. Only one of them will be allowed running at any time. This allows autodetection to try several alternatives and pick the one that works. | | False | +| host | Hostname or ip of the RethinkDB server. | localhost | False | +| port | Port to connect to the RethinkDB server. | 28015 | False | +| user | The username to use to connect to the RethinkDB server. | admin | False | +| password | The password to use to connect to the RethinkDB server. | | False | +| timeout | Set a connect timeout to the RethinkDB server. | 2 | False | + +</details> + +#### Examples + +##### Local RethinkDB server + +An example of a configuration for a local RethinkDB server + +```yaml +localhost: + name: 'local' + host: '127.0.0.1' + port: 28015 + user: "user" + password: "pass" + +``` + + +## Troubleshooting + +### Debug Mode + +To troubleshoot issues with the `rethinkdbs` collector, run the `python.d.plugin` with the debug option enabled. The output +should give you clues as to why the collector isn't working. + +- Navigate to the `plugins.d` directory, usually at `/usr/libexec/netdata/plugins.d/`. If that's not the case on + your system, open `netdata.conf` and look for the `plugins` setting under `[directories]`. + + ```bash + cd /usr/libexec/netdata/plugins.d/ + ``` + +- Switch to the `netdata` user. + + ```bash + sudo -u netdata -s + ``` + +- Run the `python.d.plugin` to debug the collector: + + ```bash + ./python.d.plugin rethinkdbs debug trace + ``` + + diff --git a/collectors/python.d.plugin/retroshare/README.md b/collectors/python.d.plugin/retroshare/README.md index b7f2fcb14..4e4c2cdb7 100644..120000 --- a/collectors/python.d.plugin/retroshare/README.md +++ b/collectors/python.d.plugin/retroshare/README.md @@ -1,70 +1 @@ -<!-- -title: "RetroShare monitoring with Netdata" -custom_edit_url: "https://github.com/netdata/netdata/edit/master/collectors/python.d.plugin/retroshare/README.md" -sidebar_label: "RetroShare" -learn_status: "Published" -learn_topic_type: "References" -learn_rel_path: "Integrations/Monitor/Apm" ---> - -# RetroShare collector - -Monitors application bandwidth, peers and DHT metrics. - -This module will monitor one or more `RetroShare` applications, depending on your configuration. - -## Charts - -This module produces the following charts: - -- Bandwidth in `kilobits/s` -- Peers in `peers` -- DHT in `peers` - - -## Configuration - -Edit the `python.d/retroshare.conf` configuration file using `edit-config` from the Netdata [config -directory](https://github.com/netdata/netdata/blob/master/docs/configure/nodes.md), which is typically at `/etc/netdata`. - -```bash -cd /etc/netdata # Replace this path with your Netdata config directory, if different -sudo ./edit-config python.d/retroshare.conf -``` - -Here is an example for 2 servers: - -```yaml -localhost: - url : 'http://localhost:9090' - user : "user" - password : "pass" - -remote: - url : 'http://203.0.113.1:9090' - user : "user" - password : "pass" -``` - - - -### Troubleshooting - -To troubleshoot issues with the `retroshare` module, run the `python.d.plugin` with the debug option enabled. The -output will give you the output of the data collection job or error messages on why the collector isn't working. - -First, navigate to your plugins directory, usually they are located under `/usr/libexec/netdata/plugins.d/`. If that's -not the case on your system, open `netdata.conf` and look for the setting `plugins directory`. Once you're in the -plugin's directory, switch to the `netdata` user. - -```bash -cd /usr/libexec/netdata/plugins.d/ -sudo su -s /bin/bash netdata -``` - -Now you can manually run the `retroshare` module in debug mode: - -```bash -./python.d.plugin retroshare debug trace -``` - +integrations/retroshare.md
\ No newline at end of file diff --git a/collectors/python.d.plugin/retroshare/integrations/retroshare.md b/collectors/python.d.plugin/retroshare/integrations/retroshare.md new file mode 100644 index 000000000..753a218c1 --- /dev/null +++ b/collectors/python.d.plugin/retroshare/integrations/retroshare.md @@ -0,0 +1,190 @@ +<!--startmeta +custom_edit_url: "https://github.com/netdata/netdata/edit/master/collectors/python.d.plugin/retroshare/README.md" +meta_yaml: "https://github.com/netdata/netdata/edit/master/collectors/python.d.plugin/retroshare/metadata.yaml" +sidebar_label: "RetroShare" +learn_status: "Published" +learn_rel_path: "Data Collection/Media Services" +message: "DO NOT EDIT THIS FILE DIRECTLY, IT IS GENERATED BY THE COLLECTOR'S metadata.yaml FILE" +endmeta--> + +# RetroShare + + +<img src="https://netdata.cloud/img/retroshare.png" width="150"/> + + +Plugin: python.d.plugin +Module: retroshare + +<img src="https://img.shields.io/badge/maintained%20by-Netdata-%2300ab44" /> + +## Overview + +This collector monitors RetroShare statistics such as application bandwidth, peers, and DHT metrics. + +It connects to the RetroShare web interface to gather metrics. + +This collector is supported on all platforms. + +This collector supports collecting metrics from multiple instances of this integration, including remote instances. + + +### Default Behavior + +#### Auto-Detection + +The collector will attempt to connect and detect a RetroShare web interface through http://localhost:9090, even without any configuration. + +#### Limits + +The default configuration for this integration does not impose any limits on data collection. + +#### Performance Impact + +The default configuration for this integration is not expected to impose a significant performance impact on the system. + + +## Metrics + +Metrics grouped by *scope*. + +The scope defines the instance that the metric belongs to. An instance is uniquely identified by a set of labels. + + + +### Per RetroShare instance + +These metrics refer to the entire monitored application. + +This scope has no labels. + +Metrics: + +| Metric | Dimensions | Unit | +|:------|:----------|:----| +| retroshare.bandwidth | Upload, Download | kilobits/s | +| retroshare.peers | All friends, Connected friends | peers | +| retroshare.dht | DHT nodes estimated, RS nodes estimated | peers | + + + +## Alerts + + +The following alerts are available: + +| Alert name | On metric | Description | +|:------------|:----------|:------------| +| [ retroshare_dht_working ](https://github.com/netdata/netdata/blob/master/health/health.d/retroshare.conf) | retroshare.dht | number of DHT peers | + + +## Setup + +### Prerequisites + +#### RetroShare web interface + +RetroShare needs to be configured to enable the RetroShare WEB Interface and allow access from the Netdata host. + + + +### Configuration + +#### File + +The configuration file name for this integration is `python.d/retroshare.conf`. + + +You can edit the configuration file using the `edit-config` script from the +Netdata [config directory](https://github.com/netdata/netdata/blob/master/docs/configure/nodes.md#the-netdata-config-directory). + +```bash +cd /etc/netdata 2>/dev/null || cd /opt/netdata/etc/netdata +sudo ./edit-config python.d/retroshare.conf +``` +#### Options + +There are 2 sections: + +* Global variables +* One or more JOBS that can define multiple different instances to monitor. + +The following options can be defined globally: priority, penalty, autodetection_retry, update_every, but can also be defined per JOB to override the global values. + +Additionally, the following collapsed table contains all the options that can be configured inside a JOB definition. + +Every configuration JOB starts with a `job_name` value which will appear in the dashboard, unless a `name` parameter is specified. + + +<details><summary>Config options</summary> + +| Name | Description | Default | Required | +|:----|:-----------|:-------|:--------:| +| update_every | Sets the default data collection frequency. | 5 | False | +| priority | Controls the order of charts at the netdata dashboard. | 60000 | False | +| autodetection_retry | Sets the job re-check interval in seconds. | 0 | False | +| penalty | Indicates whether to apply penalty to update_every in case of failures. | yes | False | +| name | Job name. This value will overwrite the `job_name` value. JOBS with the same name are mutually exclusive. Only one of them will be allowed running at any time. This allows autodetection to try several alternatives and pick the one that works. | | False | +| url | The URL to the RetroShare Web UI. | http://localhost:9090 | False | + +</details> + +#### Examples + +##### Local RetroShare Web UI + +A basic configuration for a RetroShare server running on localhost. + +<details><summary>Config</summary> + +```yaml +localhost: + name: 'local retroshare' + url: 'http://localhost:9090' + +``` +</details> + +##### Remote RetroShare Web UI + +A basic configuration for a remote RetroShare server. + +<details><summary>Config</summary> + +```yaml +remote: + name: 'remote retroshare' + url: 'http://1.2.3.4:9090' + +``` +</details> + + + +## Troubleshooting + +### Debug Mode + +To troubleshoot issues with the `retroshare` collector, run the `python.d.plugin` with the debug option enabled. The output +should give you clues as to why the collector isn't working. + +- Navigate to the `plugins.d` directory, usually at `/usr/libexec/netdata/plugins.d/`. If that's not the case on + your system, open `netdata.conf` and look for the `plugins` setting under `[directories]`. + + ```bash + cd /usr/libexec/netdata/plugins.d/ + ``` + +- Switch to the `netdata` user. + + ```bash + sudo -u netdata -s + ``` + +- Run the `python.d.plugin` to debug the collector: + + ```bash + ./python.d.plugin retroshare debug trace + ``` + + diff --git a/collectors/python.d.plugin/riakkv/README.md b/collectors/python.d.plugin/riakkv/README.md index e822c551e..f43ece09b 100644..120000 --- a/collectors/python.d.plugin/riakkv/README.md +++ b/collectors/python.d.plugin/riakkv/README.md @@ -1,149 +1 @@ -<!-- -title: "Riak KV monitoring with Netdata" -custom_edit_url: "https://github.com/netdata/netdata/edit/master/collectors/python.d.plugin/riakkv/README.md" -sidebar_label: "Riak KV" -learn_status: "Published" -learn_topic_type: "References" -learn_rel_path: "Integrations/Monitor/Databases" ---> - -# Riak KV collector - -Collects database stats from `/stats` endpoint. - -## Requirements - -- An accessible `/stats` endpoint. See [the Riak KV configuration reference documentation](https://docs.riak.com/riak/kv/2.2.3/configuring/reference/#client-interfaces) - for how to enable this. - -The following charts are included, which are mostly derived from the metrics -listed -[here](https://docs.riak.com/riak/kv/latest/using/reference/statistics-monitoring/index.html#riak-metrics-to-graph). - -1. **Throughput** in operations/s - -- **KV operations** - - gets - - puts - -- **Data type updates** - - counters - - sets - - maps - -- **Search queries** - - queries - -- **Search documents** - - indexed - -- **Strong consistency operations** - - gets - - puts - -2. **Latency** in milliseconds - -- **KV latency** of the past minute - - get (mean, median, 95th / 99th / 100th percentile) - - put (mean, median, 95th / 99th / 100th percentile) - -- **Data type latency** of the past minute - - counter_merge (mean, median, 95th / 99th / 100th percentile) - - set_merge (mean, median, 95th / 99th / 100th percentile) - - map_merge (mean, median, 95th / 99th / 100th percentile) - -- **Search latency** of the past minute - - query (median, min, max, 95th / 99th percentile) - - index (median, min, max, 95th / 99th percentile) - -- **Strong consistency latency** of the past minute - - get (mean, median, 95th / 99th / 100th percentile) - - put (mean, median, 95th / 99th / 100th percentile) - -3. **Erlang VM metrics** - -- **System counters** - - processes - -- **Memory allocation** in MB - - processes.allocated - - processes.used - -4. **General load / health metrics** - -- **Siblings encountered in KV operations** during the past minute - - get (mean, median, 95th / 99th / 100th percentile) - -- **Object size in KV operations** during the past minute in KB - - get (mean, median, 95th / 99th / 100th percentile) - -- **Message queue length** in unprocessed messages - - vnodeq_size (mean, median, 95th / 99th / 100th percentile) - -- **Index operations** encountered by Search - - errors - -- **Protocol buffer connections** - - active - -- **Repair operations coordinated by this node** - - read - -- **Active finite state machines by kind** - - get - - put - - secondary_index - - list_keys - -- **Rejected finite state machines** - - get - - put - -- **Number of writes to Search failed due to bad data format by reason** - - bad_entry - - extract_fail - -## Configuration - -Edit the `python.d/riakkv.conf` configuration file using `edit-config` from the Netdata [config -directory](https://github.com/netdata/netdata/blob/master/docs/configure/nodes.md), which is typically at `/etc/netdata`. - -```bash -cd /etc/netdata # Replace this path with your Netdata config directory, if different -sudo ./edit-config python.d/riakkv.conf -``` - -The module needs to be passed the full URL to Riak's stats endpoint. -For example: - -```yaml -myriak: - url: http://myriak.example.com:8098/stats -``` - -With no explicit configuration given, the module will attempt to connect to -`http://localhost:8098/stats`. - -The default update frequency for the plugin is set to 2 seconds as Riak -internally updates the metrics every second. If we were to update the metrics -every second, the resulting graph would contain odd jitter. -### Troubleshooting - -To troubleshoot issues with the `riakkv` module, run the `python.d.plugin` with the debug option enabled. The -output will give you the output of the data collection job or error messages on why the collector isn't working. - -First, navigate to your plugins directory, usually they are located under `/usr/libexec/netdata/plugins.d/`. If that's -not the case on your system, open `netdata.conf` and look for the setting `plugins directory`. Once you're in the -plugin's directory, switch to the `netdata` user. - -```bash -cd /usr/libexec/netdata/plugins.d/ -sudo su -s /bin/bash netdata -``` - -Now you can manually run the `riakkv` module in debug mode: - -```bash -./python.d.plugin riakkv debug trace -``` - +integrations/riakkv.md
\ No newline at end of file diff --git a/collectors/python.d.plugin/riakkv/integrations/riakkv.md b/collectors/python.d.plugin/riakkv/integrations/riakkv.md new file mode 100644 index 000000000..f83def446 --- /dev/null +++ b/collectors/python.d.plugin/riakkv/integrations/riakkv.md @@ -0,0 +1,219 @@ +<!--startmeta +custom_edit_url: "https://github.com/netdata/netdata/edit/master/collectors/python.d.plugin/riakkv/README.md" +meta_yaml: "https://github.com/netdata/netdata/edit/master/collectors/python.d.plugin/riakkv/metadata.yaml" +sidebar_label: "RiakKV" +learn_status: "Published" +learn_rel_path: "Data Collection/Databases" +message: "DO NOT EDIT THIS FILE DIRECTLY, IT IS GENERATED BY THE COLLECTOR'S metadata.yaml FILE" +endmeta--> + +# RiakKV + + +<img src="https://netdata.cloud/img/riak.svg" width="150"/> + + +Plugin: python.d.plugin +Module: riakkv + +<img src="https://img.shields.io/badge/maintained%20by-Netdata-%2300ab44" /> + +## Overview + +This collector monitors RiakKV metrics about throughput, latency, resources and more.' + + +This collector reads the database stats from the `/stats` endpoint. + +This collector is supported on all platforms. + +This collector supports collecting metrics from multiple instances of this integration, including remote instances. + + +### Default Behavior + +#### Auto-Detection + +If the /stats endpoint is accessible, RiakKV instances on the local host running on port 8098 will be autodetected. + +#### Limits + +The default configuration for this integration does not impose any limits on data collection. + +#### Performance Impact + +The default configuration for this integration is not expected to impose a significant performance impact on the system. + + +## Metrics + +Metrics grouped by *scope*. + +The scope defines the instance that the metric belongs to. An instance is uniquely identified by a set of labels. + + + +### Per RiakKV instance + +These metrics refer to the entire monitored application. + +This scope has no labels. + +Metrics: + +| Metric | Dimensions | Unit | +|:------|:----------|:----| +| riak.kv.throughput | gets, puts | operations/s | +| riak.dt.vnode_updates | counters, sets, maps | operations/s | +| riak.search | queries | queries/s | +| riak.search.documents | indexed | documents/s | +| riak.consistent.operations | gets, puts | operations/s | +| riak.kv.latency.get | mean, median, 95, 99, 100 | ms | +| riak.kv.latency.put | mean, median, 95, 99, 100 | ms | +| riak.dt.latency.counter_merge | mean, median, 95, 99, 100 | ms | +| riak.dt.latency.set_merge | mean, median, 95, 99, 100 | ms | +| riak.dt.latency.map_merge | mean, median, 95, 99, 100 | ms | +| riak.search.latency.query | median, min, 95, 99, 999, max | ms | +| riak.search.latency.index | median, min, 95, 99, 999, max | ms | +| riak.consistent.latency.get | mean, median, 95, 99, 100 | ms | +| riak.consistent.latency.put | mean, median, 95, 99, 100 | ms | +| riak.vm | processes | total | +| riak.vm.memory.processes | allocated, used | MB | +| riak.kv.siblings_encountered.get | mean, median, 95, 99, 100 | siblings | +| riak.kv.objsize.get | mean, median, 95, 99, 100 | KB | +| riak.search.vnodeq_size | mean, median, 95, 99, 100 | messages | +| riak.search.index | errors | errors | +| riak.core.protobuf_connections | active | connections | +| riak.core.repairs | read | repairs | +| riak.core.fsm_active | get, put, secondary index, list keys | fsms | +| riak.core.fsm_rejected | get, put | fsms | +| riak.search.index | bad_entry, extract_fail | writes | + + + +## Alerts + + +The following alerts are available: + +| Alert name | On metric | Description | +|:------------|:----------|:------------| +| [ riakkv_1h_kv_get_mean_latency ](https://github.com/netdata/netdata/blob/master/health/health.d/riakkv.conf) | riak.kv.latency.get | average time between reception of client GET request and subsequent response to client over the last hour | +| [ riakkv_kv_get_slow ](https://github.com/netdata/netdata/blob/master/health/health.d/riakkv.conf) | riak.kv.latency.get | average time between reception of client GET request and subsequent response to the client over the last 3 minutes, compared to the average over the last hour | +| [ riakkv_1h_kv_put_mean_latency ](https://github.com/netdata/netdata/blob/master/health/health.d/riakkv.conf) | riak.kv.latency.put | average time between reception of client PUT request and subsequent response to the client over the last hour | +| [ riakkv_kv_put_slow ](https://github.com/netdata/netdata/blob/master/health/health.d/riakkv.conf) | riak.kv.latency.put | average time between reception of client PUT request and subsequent response to the client over the last 3 minutes, compared to the average over the last hour | +| [ riakkv_vm_high_process_count ](https://github.com/netdata/netdata/blob/master/health/health.d/riakkv.conf) | riak.vm | number of processes running in the Erlang VM | +| [ riakkv_list_keys_active ](https://github.com/netdata/netdata/blob/master/health/health.d/riakkv.conf) | riak.core.fsm_active | number of currently running list keys finite state machines | + + +## Setup + +### Prerequisites + +#### Configure RiakKV to enable /stats endpoint + +You can follow the RiakKV configuration reference documentation for how to enable this. + +Source : https://docs.riak.com/riak/kv/2.2.3/configuring/reference/#client-interfaces + + + +### Configuration + +#### File + +The configuration file name for this integration is `python.d/riakkv.conf`. + + +You can edit the configuration file using the `edit-config` script from the +Netdata [config directory](https://github.com/netdata/netdata/blob/master/docs/configure/nodes.md#the-netdata-config-directory). + +```bash +cd /etc/netdata 2>/dev/null || cd /opt/netdata/etc/netdata +sudo ./edit-config python.d/riakkv.conf +``` +#### Options + +There are 2 sections: + +* Global variables +* One or more JOBS that can define multiple different instances to monitor. + +The following options can be defined globally: priority, penalty, autodetection_retry, update_every, but can also be defined per JOB to override the global values. + +Additionally, the following collapsed table contains all the options that can be configured inside a JOB definition. + +Every configuration JOB starts with a `job_name` value which will appear in the dashboard, unless a `name` parameter is specified. + + +<details><summary>Config options</summary> + +| Name | Description | Default | Required | +|:----|:-----------|:-------|:--------:| +| update_every | Sets the default data collection frequency. | 5 | False | +| priority | Controls the order of charts at the netdata dashboard. | 60000 | False | +| autodetection_retry | Sets the job re-check interval in seconds. | 0 | False | +| penalty | Indicates whether to apply penalty to update_every in case of failures. | yes | False | +| url | The url of the server | no | True | + +</details> + +#### Examples + +##### Basic (default) + +A basic example configuration per job + +```yaml +local: +url: 'http://localhost:8098/stats' + +``` +##### Multi-instance + +> **Note**: When you define multiple jobs, their names must be unique. + +Collecting metrics from local and remote instances. + + +<details><summary>Config</summary> + +```yaml +local: + url: 'http://localhost:8098/stats' + +remote: + url: 'http://192.0.2.1:8098/stats' + +``` +</details> + + + +## Troubleshooting + +### Debug Mode + +To troubleshoot issues with the `riakkv` collector, run the `python.d.plugin` with the debug option enabled. The output +should give you clues as to why the collector isn't working. + +- Navigate to the `plugins.d` directory, usually at `/usr/libexec/netdata/plugins.d/`. If that's not the case on + your system, open `netdata.conf` and look for the `plugins` setting under `[directories]`. + + ```bash + cd /usr/libexec/netdata/plugins.d/ + ``` + +- Switch to the `netdata` user. + + ```bash + sudo -u netdata -s + ``` + +- Run the `python.d.plugin` to debug the collector: + + ```bash + ./python.d.plugin riakkv debug trace + ``` + + diff --git a/collectors/python.d.plugin/samba/README.md b/collectors/python.d.plugin/samba/README.md index 8fe133fd5..3b63bbab6 100644..120000 --- a/collectors/python.d.plugin/samba/README.md +++ b/collectors/python.d.plugin/samba/README.md @@ -1,144 +1 @@ -<!-- -title: "Samba monitoring with Netdata" -custom_edit_url: "https://github.com/netdata/netdata/edit/master/collectors/python.d.plugin/samba/README.md" -sidebar_label: "Samba" -learn_status: "Published" -learn_topic_type: "References" -learn_rel_path: "Integrations/Monitor/Apps" ---> - -# Samba collector - -Monitors the performance metrics of Samba file sharing using `smbstatus` command-line tool. - -Executed commands: - -- `sudo -n smbstatus -P` - -## Requirements - -- `smbstatus` program -- `sudo` program -- `smbd` must be compiled with profiling enabled -- `smbd` must be started either with the `-P 1` option or inside `smb.conf` using `smbd profiling level` - -The module uses `smbstatus`, which can only be executed by `root`. It uses -`sudo` and assumes that it is configured such that the `netdata` user can execute `smbstatus` as root without a -password. - -- Add to your `/etc/sudoers` file: - -`which smbstatus` shows the full path to the binary. - -```bash -netdata ALL=(root) NOPASSWD: /path/to/smbstatus -``` - -- Reset Netdata's systemd - unit [CapabilityBoundingSet](https://www.freedesktop.org/software/systemd/man/systemd.exec.html#Capabilities) (Linux - distributions with systemd) - -The default CapabilityBoundingSet doesn't allow using `sudo`, and is quite strict in general. Resetting is not optimal, but a next-best solution given the inability to execute `smbstatus` using `sudo`. - - -As the `root` user, do the following: - -```cmd -mkdir /etc/systemd/system/netdata.service.d -echo -e '[Service]\nCapabilityBoundingSet=~' | tee /etc/systemd/system/netdata.service.d/unset-capability-bounding-set.conf -systemctl daemon-reload -systemctl restart netdata.service -``` - -## Charts - -1. **Syscall R/Ws** in kilobytes/s - - - sendfile - - recvfile - -2. **Smb2 R/Ws** in kilobytes/s - - - readout - - writein - - readin - - writeout - -3. **Smb2 Create/Close** in operations/s - - - create - - close - -4. **Smb2 Info** in operations/s - - - getinfo - - setinfo - -5. **Smb2 Find** in operations/s - - - find - -6. **Smb2 Notify** in operations/s - - - notify - -7. **Smb2 Lesser Ops** as counters - - - tcon - - negprot - - tdis - - cancel - - logoff - - flush - - lock - - keepalive - - break - - sessetup - -## Enable the collector - -The `samba` collector is disabled by default. To enable it, use `edit-config` from the -Netdata [config directory](https://github.com/netdata/netdata/blob/master/docs/configure/nodes.md), which is typically at `/etc/netdata`, to edit the `python.d.conf` -file. - -```bash -cd /etc/netdata # Replace this path with your Netdata config directory, if different -sudo ./edit-config python.d.conf -``` - -Change the value of the `samba` setting to `yes`. Save the file and restart the Netdata Agent with `sudo systemctl -restart netdata`, or the [appropriate method](https://github.com/netdata/netdata/blob/master/docs/configure/start-stop-restart.md) for your system. - -## Configuration - -Edit the `python.d/samba.conf` configuration file using `edit-config` from the -Netdata [config directory](https://github.com/netdata/netdata/blob/master/docs/configure/nodes.md), which is typically at `/etc/netdata`. - -```bash -cd /etc/netdata # Replace this path with your Netdata config directory, if different -sudo ./edit-config python.d/samba.conf -``` - - - - -### Troubleshooting - -To troubleshoot issues with the `samba` module, run the `python.d.plugin` with the debug option enabled. The -output will give you the output of the data collection job or error messages on why the collector isn't working. - -First, navigate to your plugins directory, usually they are located under `/usr/libexec/netdata/plugins.d/`. If that's -not the case on your system, open `netdata.conf` and look for the setting `plugins directory`. Once you're in the -plugin's directory, switch to the `netdata` user. - -```bash -cd /usr/libexec/netdata/plugins.d/ -sudo su -s /bin/bash netdata -``` - -Now you can manually run the `samba` module in debug mode: - -```bash -./python.d.plugin samba debug trace -``` - +integrations/samba.md
\ No newline at end of file diff --git a/collectors/python.d.plugin/samba/integrations/samba.md b/collectors/python.d.plugin/samba/integrations/samba.md new file mode 100644 index 000000000..5638c6d94 --- /dev/null +++ b/collectors/python.d.plugin/samba/integrations/samba.md @@ -0,0 +1,220 @@ +<!--startmeta +custom_edit_url: "https://github.com/netdata/netdata/edit/master/collectors/python.d.plugin/samba/README.md" +meta_yaml: "https://github.com/netdata/netdata/edit/master/collectors/python.d.plugin/samba/metadata.yaml" +sidebar_label: "Samba" +learn_status: "Published" +learn_rel_path: "Data Collection/Storage, Mount Points and Filesystems" +message: "DO NOT EDIT THIS FILE DIRECTLY, IT IS GENERATED BY THE COLLECTOR'S metadata.yaml FILE" +endmeta--> + +# Samba + + +<img src="https://netdata.cloud/img/samba.svg" width="150"/> + + +Plugin: python.d.plugin +Module: samba + +<img src="https://img.shields.io/badge/maintained%20by-Netdata-%2300ab44" /> + +## Overview + +This collector monitors the performance metrics of Samba file sharing. + +It is using the `smbstatus` command-line tool. + +Executed commands: + +- `sudo -n smbstatus -P` + + +This collector is supported on all platforms. + +This collector only supports collecting metrics from a single instance of this integration. + +`smbstatus` is used, which can only be executed by `root`. It uses `sudo` and assumes that it is configured such that the `netdata` user can execute `smbstatus` as root without a password. + + +### Default Behavior + +#### Auto-Detection + +After all the permissions are satisfied, the `smbstatus -P` binary is executed. + +#### Limits + +The default configuration for this integration does not impose any limits on data collection. + +#### Performance Impact + +The default configuration for this integration is not expected to impose a significant performance impact on the system. + + +## Metrics + +Metrics grouped by *scope*. + +The scope defines the instance that the metric belongs to. An instance is uniquely identified by a set of labels. + + + +### Per Samba instance + +These metrics refer to the entire monitored application. + +This scope has no labels. + +Metrics: + +| Metric | Dimensions | Unit | +|:------|:----------|:----| +| syscall.rw | sendfile, recvfile | KiB/s | +| smb2.rw | readout, writein, readin, writeout | KiB/s | +| smb2.create_close | create, close | operations/s | +| smb2.get_set_info | getinfo, setinfo | operations/s | +| smb2.find | find | operations/s | +| smb2.notify | notify | operations/s | +| smb2.sm_counters | tcon, negprot, tdis, cancel, logoff, flush, lock, keepalive, break, sessetup | count | + + + +## Alerts + +There are no alerts configured by default for this integration. + + +## Setup + +### Prerequisites + +#### Enable the samba collector + +The `samba` collector is disabled by default. To enable it, use `edit-config` from the Netdata [config directory](https://github.com/netdata/netdata/blob/master/docs/configure/nodes.md), which is typically at `/etc/netdata`, to edit the `python.d.conf` file. + +```bash +cd /etc/netdata # Replace this path with your Netdata config directory, if different +sudo ./edit-config python.d.conf +``` +Change the value of the `samba` setting to `yes`. Save the file and restart the Netdata Agent with `sudo systemctl restart netdata`, or the [appropriate method](https://github.com/netdata/netdata/blob/master/docs/configure/start-stop-restart.md) for your system. + + +#### Permissions and programs + +To run the collector you need: + +- `smbstatus` program +- `sudo` program +- `smbd` must be compiled with profiling enabled +- `smbd` must be started either with the `-P 1` option or inside `smb.conf` using `smbd profiling level` + +The module uses `smbstatus`, which can only be executed by `root`. It uses `sudo` and assumes that it is configured such that the `netdata` user can execute `smbstatus` as root without a password. + +- add to your `/etc/sudoers` file: + + `which smbstatus` shows the full path to the binary. + + ```bash + netdata ALL=(root) NOPASSWD: /path/to/smbstatus + ``` + +- Reset Netdata's systemd unit [CapabilityBoundingSet](https://www.freedesktop.org/software/systemd/man/systemd.exec.html#Capabilities) (Linux distributions with systemd) + + The default CapabilityBoundingSet doesn't allow using `sudo`, and is quite strict in general. Resetting is not optimal, but a next-best solution given the inability to execute `smbstatus` using `sudo`. + + + As the `root` user, do the following: + + ```cmd + mkdir /etc/systemd/system/netdata.service.d + echo -e '[Service]\nCapabilityBoundingSet=~' | tee /etc/systemd/system/netdata.service.d/unset-capability-bounding-set.conf + systemctl daemon-reload + systemctl restart netdata.service + ``` + + + +### Configuration + +#### File + +The configuration file name for this integration is `python.d/samba.conf`. + + +You can edit the configuration file using the `edit-config` script from the +Netdata [config directory](https://github.com/netdata/netdata/blob/master/docs/configure/nodes.md#the-netdata-config-directory). + +```bash +cd /etc/netdata 2>/dev/null || cd /opt/netdata/etc/netdata +sudo ./edit-config python.d/samba.conf +``` +#### Options + +There are 2 sections: + +* Global variables +* One or more JOBS that can define multiple different instances to monitor. + +The following options can be defined globally: priority, penalty, autodetection_retry, update_every, but can also be defined per JOB to override the global values. + +Additionally, the following collapsed table contains all the options that can be configured inside a JOB definition. + +Every configuration JOB starts with a `job_name` value which will appear in the dashboard, unless a `name` parameter is specified. + + +<details><summary>Config options</summary> + +| Name | Description | Default | Required | +|:----|:-----------|:-------|:--------:| +| update_every | Sets the default data collection frequency. | 5 | False | +| priority | Controls the order of charts at the netdata dashboard. | 60000 | False | +| autodetection_retry | Sets the job re-check interval in seconds. | 0 | False | +| penalty | Indicates whether to apply penalty to update_every in case of failures. | yes | False | + +</details> + +#### Examples + +##### Basic + +A basic example configuration. + +<details><summary>Config</summary> + +```yaml +my_job_name: + name: my_name + update_every: 1 + +``` +</details> + + + +## Troubleshooting + +### Debug Mode + +To troubleshoot issues with the `samba` collector, run the `python.d.plugin` with the debug option enabled. The output +should give you clues as to why the collector isn't working. + +- Navigate to the `plugins.d` directory, usually at `/usr/libexec/netdata/plugins.d/`. If that's not the case on + your system, open `netdata.conf` and look for the `plugins` setting under `[directories]`. + + ```bash + cd /usr/libexec/netdata/plugins.d/ + ``` + +- Switch to the `netdata` user. + + ```bash + sudo -u netdata -s + ``` + +- Run the `python.d.plugin` to debug the collector: + + ```bash + ./python.d.plugin samba debug trace + ``` + + diff --git a/collectors/python.d.plugin/samba/metadata.yaml b/collectors/python.d.plugin/samba/metadata.yaml index 43bca208e..ec31e0475 100644 --- a/collectors/python.d.plugin/samba/metadata.yaml +++ b/collectors/python.d.plugin/samba/metadata.yaml @@ -23,9 +23,9 @@ modules: metrics_description: "This collector monitors the performance metrics of Samba file sharing." method_description: | It is using the `smbstatus` command-line tool. - + Executed commands: - + - `sudo -n smbstatus -P` supported_platforms: include: [] @@ -44,32 +44,41 @@ modules: setup: prerequisites: list: + - title: Enable the samba collector + description: | + The `samba` collector is disabled by default. To enable it, use `edit-config` from the Netdata [config directory](https://github.com/netdata/netdata/blob/master/docs/configure/nodes.md), which is typically at `/etc/netdata`, to edit the `python.d.conf` file. + + ```bash + cd /etc/netdata # Replace this path with your Netdata config directory, if different + sudo ./edit-config python.d.conf + ``` + Change the value of the `samba` setting to `yes`. Save the file and restart the Netdata Agent with `sudo systemctl restart netdata`, or the [appropriate method](https://github.com/netdata/netdata/blob/master/docs/configure/start-stop-restart.md) for your system. - title: Permissions and programs description: | To run the collector you need: - + - `smbstatus` program - `sudo` program - `smbd` must be compiled with profiling enabled - `smbd` must be started either with the `-P 1` option or inside `smb.conf` using `smbd profiling level` - + The module uses `smbstatus`, which can only be executed by `root`. It uses `sudo` and assumes that it is configured such that the `netdata` user can execute `smbstatus` as root without a password. - + - add to your `/etc/sudoers` file: - + `which smbstatus` shows the full path to the binary. - + ```bash netdata ALL=(root) NOPASSWD: /path/to/smbstatus ``` - + - Reset Netdata's systemd unit [CapabilityBoundingSet](https://www.freedesktop.org/software/systemd/man/systemd.exec.html#Capabilities) (Linux distributions with systemd) - + The default CapabilityBoundingSet doesn't allow using `sudo`, and is quite strict in general. Resetting is not optimal, but a next-best solution given the inability to execute `smbstatus` using `sudo`. - - + + As the `root` user, do the following: - + ```cmd mkdir /etc/systemd/system/netdata.service.d echo -e '[Service]\nCapabilityBoundingSet=~' | tee /etc/systemd/system/netdata.service.d/unset-capability-bounding-set.conf @@ -82,14 +91,14 @@ modules: options: description: | There are 2 sections: - + * Global variables * One or more JOBS that can define multiple different instances to monitor. - + The following options can be defined globally: priority, penalty, autodetection_retry, update_every, but can also be defined per JOB to override the global values. - + Additionally, the following collapsed table contains all the options that can be configured inside a JOB definition. - + Every configuration JOB starts with a `job_name` value which will appear in the dashboard, unless a `name` parameter is specified. folding: title: "Config options" diff --git a/collectors/python.d.plugin/sensors/README.md b/collectors/python.d.plugin/sensors/README.md index 7ee31bd67..4e92b0882 100644..120000 --- a/collectors/python.d.plugin/sensors/README.md +++ b/collectors/python.d.plugin/sensors/README.md @@ -1,55 +1 @@ -<!-- -title: "Linux machine sensors monitoring with Netdata" -custom_edit_url: "https://github.com/netdata/netdata/edit/master/collectors/python.d.plugin/sensors/README.md" -sidebar_label: "sensors-python.d.plugin" -learn_status: "Published" -learn_topic_type: "References" -learn_rel_path: "Integrations/Monitor/Devices" ---> - -# Linux machine sensors collector - -Reads system sensors information (temperature, voltage, electric current, power, etc.). - -Charts are created dynamically. - -## Configuration - -Edit the `python.d/sensors.conf` configuration file using `edit-config` from the Netdata [config -directory](https://github.com/netdata/netdata/blob/master/docs/configure/nodes.md), which is typically at `/etc/netdata`. - -```bash -cd /etc/netdata # Replace this path with your Netdata config directory, if different -sudo ./edit-config python.d/sensors.conf -``` - -### possible issues - -There have been reports from users that on certain servers, ACPI ring buffer errors are printed by the kernel (`dmesg`) -when ACPI sensors are being accessed. We are tracking such cases in -issue [#827](https://github.com/netdata/netdata/issues/827). Please join this discussion for help. - -When `lm-sensors` doesn't work on your device (e.g. for RPi temperatures), -use [the legacy bash collector](https://github.com/netdata/netdata/blob/master/collectors/charts.d.plugin/sensors/README.md) - - -### Troubleshooting - -To troubleshoot issues with the `sensors` module, run the `python.d.plugin` with the debug option enabled. The -output will give you the output of the data collection job or error messages on why the collector isn't working. - -First, navigate to your plugins directory, usually they are located under `/usr/libexec/netdata/plugins.d/`. If that's -not the case on your system, open `netdata.conf` and look for the setting `plugins directory`. Once you're in the -plugin's directory, switch to the `netdata` user. - -```bash -cd /usr/libexec/netdata/plugins.d/ -sudo su -s /bin/bash netdata -``` - -Now you can manually run the `sensors` module in debug mode: - -```bash -./python.d.plugin sensors debug trace -``` - +integrations/linux_sensors_lm-sensors.md
\ No newline at end of file diff --git a/collectors/python.d.plugin/sensors/integrations/linux_sensors_lm-sensors.md b/collectors/python.d.plugin/sensors/integrations/linux_sensors_lm-sensors.md new file mode 100644 index 000000000..c807d6b3e --- /dev/null +++ b/collectors/python.d.plugin/sensors/integrations/linux_sensors_lm-sensors.md @@ -0,0 +1,186 @@ +<!--startmeta +custom_edit_url: "https://github.com/netdata/netdata/edit/master/collectors/python.d.plugin/sensors/README.md" +meta_yaml: "https://github.com/netdata/netdata/edit/master/collectors/python.d.plugin/sensors/metadata.yaml" +sidebar_label: "Linux Sensors (lm-sensors)" +learn_status: "Published" +learn_rel_path: "Data Collection/Hardware Devices and Sensors" +message: "DO NOT EDIT THIS FILE DIRECTLY, IT IS GENERATED BY THE COLLECTOR'S metadata.yaml FILE" +endmeta--> + +# Linux Sensors (lm-sensors) + + +<img src="https://netdata.cloud/img/microchip.svg" width="150"/> + + +Plugin: python.d.plugin +Module: sensors + +<img src="https://img.shields.io/badge/maintained%20by-Netdata-%2300ab44" /> + +## Overview + +Examine Linux Sensors metrics with Netdata for insights into hardware health and performance. + +Enhance your system's reliability with real-time hardware health insights. + + +Reads system sensors information (temperature, voltage, electric current, power, etc.) via [lm-sensors](https://hwmon.wiki.kernel.org/lm_sensors). + + +This collector is supported on all platforms. + +This collector supports collecting metrics from multiple instances of this integration, including remote instances. + + +### Default Behavior + +#### Auto-Detection + +The following type of sensors are auto-detected: +- temperature - fan - voltage - current - power - energy - humidity + + +#### Limits + +The default configuration for this integration does not impose any limits on data collection. + +#### Performance Impact + +The default configuration for this integration is not expected to impose a significant performance impact on the system. + + +## Metrics + +Metrics grouped by *scope*. + +The scope defines the instance that the metric belongs to. An instance is uniquely identified by a set of labels. + + + +### Per chip + +Metrics related to chips. Each chip provides a set of the following metrics, each having the chip name in the metric name as reported by `sensors -u`. + + +This scope has no labels. + +Metrics: + +| Metric | Dimensions | Unit | +|:------|:----------|:----| +| sensors.temperature | a dimension per sensor | Celsius | +| sensors.voltage | a dimension per sensor | Volts | +| sensors.current | a dimension per sensor | Ampere | +| sensors.power | a dimension per sensor | Watt | +| sensors.fan | a dimension per sensor | Rotations/min | +| sensors.energy | a dimension per sensor | Joule | +| sensors.humidity | a dimension per sensor | Percent | + + + +## Alerts + +There are no alerts configured by default for this integration. + + +## Setup + +### Prerequisites + +No action required. + +### Configuration + +#### File + +The configuration file name for this integration is `python.d/sensors.conf`. + + +You can edit the configuration file using the `edit-config` script from the +Netdata [config directory](https://github.com/netdata/netdata/blob/master/docs/configure/nodes.md#the-netdata-config-directory). + +```bash +cd /etc/netdata 2>/dev/null || cd /opt/netdata/etc/netdata +sudo ./edit-config python.d/sensors.conf +``` +#### Options + +There are 2 sections: + +* Global variables +* One or more JOBS that can define multiple different instances to monitor. + +The following options can be defined globally: priority, penalty, autodetection_retry, update_every, but can also be defined per JOB to override the global values. + +Additionally, the following collapsed table contains all the options that can be configured inside a JOB definition. + +Every configuration JOB starts with a `job_name` value which will appear in the dashboard, unless a `name` parameter is specified. + + +<details><summary>Config options</summary> + +| Name | Description | Default | Required | +|:----|:-----------|:-------|:--------:| +| types | The types of sensors to collect. | temperature, fan, voltage, current, power, energy, humidity | True | +| update_every | Sets the default data collection frequency. | 1 | False | +| priority | Controls the order of charts at the netdata dashboard. | 60000 | False | +| autodetection_retry | Sets the job re-check interval in seconds. | 0 | False | +| penalty | Indicates whether to apply penalty to update_every in case of failures. | yes | False | + +</details> + +#### Examples + +##### Default + +Default configuration. + +```yaml +types: + - temperature + - fan + - voltage + - current + - power + - energy + - humidity + +``` + + +## Troubleshooting + +### Debug Mode + +To troubleshoot issues with the `sensors` collector, run the `python.d.plugin` with the debug option enabled. The output +should give you clues as to why the collector isn't working. + +- Navigate to the `plugins.d` directory, usually at `/usr/libexec/netdata/plugins.d/`. If that's not the case on + your system, open `netdata.conf` and look for the `plugins` setting under `[directories]`. + + ```bash + cd /usr/libexec/netdata/plugins.d/ + ``` + +- Switch to the `netdata` user. + + ```bash + sudo -u netdata -s + ``` + +- Run the `python.d.plugin` to debug the collector: + + ```bash + ./python.d.plugin sensors debug trace + ``` + +### lm-sensors doesn't work on your device + + + +### ACPI ring buffer errors are printed + + + + diff --git a/collectors/python.d.plugin/sensors/metadata.yaml b/collectors/python.d.plugin/sensors/metadata.yaml index c3f681915..d7cb2206f 100644 --- a/collectors/python.d.plugin/sensors/metadata.yaml +++ b/collectors/python.d.plugin/sensors/metadata.yaml @@ -117,7 +117,16 @@ modules: - humidity troubleshooting: problems: - list: [] + list: + - name: lm-sensors doesn't work on your device + description: | + When `lm-sensors` doesn't work on your device (e.g. for RPi temperatures), + use [the legacy bash collector](https://github.com/netdata/netdata/blob/master/collectors/charts.d.plugin/sensors/README.md) + - name: ACPI ring buffer errors are printed + description: | + There have been reports from users that on certain servers, ACPI ring buffer errors are printed by the kernel (`dmesg`) + when ACPI sensors are being accessed. We are tracking such cases in issue [#827](https://github.com/netdata/netdata/issues/827). + Please join this discussion for help. alerts: [] metrics: folding: diff --git a/collectors/python.d.plugin/sensors/sensors.chart.py b/collectors/python.d.plugin/sensors/sensors.chart.py index 701bf6414..0d9de3750 100644 --- a/collectors/python.d.plugin/sensors/sensors.chart.py +++ b/collectors/python.d.plugin/sensors/sensors.chart.py @@ -66,7 +66,7 @@ CHARTS = { LIMITS = { 'temperature': [-127, 1000], - 'voltage': [-127, 127], + 'voltage': [-400, 400], 'current': [-127, 127], 'fan': [0, 65535] } diff --git a/collectors/python.d.plugin/smartd_log/README.md b/collectors/python.d.plugin/smartd_log/README.md index e79348b05..63aad6c85 100644..120000 --- a/collectors/python.d.plugin/smartd_log/README.md +++ b/collectors/python.d.plugin/smartd_log/README.md @@ -1,148 +1 @@ -<!-- -title: "Storage devices monitoring with Netdata" -custom_edit_url: "https://github.com/netdata/netdata/edit/master/collectors/python.d.plugin/smartd_log/README.md" -sidebar_label: "S.M.A.R.T. attributes" -learn_status: "Published" -learn_topic_type: "References" -learn_rel_path: "Integrations/Monitor/Devices" ---> - -# Storage devices collector - -Monitors `smartd` log files to collect HDD/SSD S.M.A.R.T attributes. - -## Requirements - -- `smartmontools` - -It produces following charts for SCSI devices: - -1. **Read Error Corrected** - -2. **Read Error Uncorrected** - -3. **Write Error Corrected** - -4. **Write Error Uncorrected** - -5. **Verify Error Corrected** - -6. **Verify Error Uncorrected** - -7. **Temperature** - -For ATA devices: - -1. **Read Error Rate** - -2. **Seek Error Rate** - -3. **Soft Read Error Rate** - -4. **Write Error Rate** - -5. **SATA Interface Downshift** - -6. **UDMA CRC Error Count** - -7. **Throughput Performance** - -8. **Seek Time Performance** - -9. **Start/Stop Count** - -10. **Power-On Hours Count** - -11. **Power Cycle Count** - -12. **Unexpected Power Loss** - -13. **Spin-Up Time** - -14. **Spin-up Retries** - -15. **Calibration Retries** - -16. **Temperature** - -17. **Reallocated Sectors Count** - -18. **Reserved Block Count** - -19. **Program Fail Count** - -20. **Erase Fail Count** - -21. **Wear Leveller Worst Case Erase Count** - -22. **Unused Reserved NAND Blocks** - -23. **Reallocation Event Count** - -24. **Current Pending Sector Count** - -25. **Offline Uncorrectable Sector Count** - -26. **Percent Lifetime Used** - -## prerequisite - -`smartd` must be running with `-A` option to write smartd attribute information to files. - -For this you need to set `smartd_opts` (or `SMARTD_ARGS`, check _smartd.service_ content) in `/etc/default/smartmontools`: - -``` -# dump smartd attrs info every 600 seconds -smartd_opts="-A /var/log/smartd/ -i 600" -``` - -You may need to create the smartd directory before smartd will write to it: - -```sh -mkdir -p /var/log/smartd -``` - -Otherwise, all the smartd `.csv` files may get written to `/var/lib/smartmontools` (default location). See also <https://linux.die.net/man/8/smartd> for more info on the `-A --attributelog=PREFIX` command. - -`smartd` appends logs at every run. It's strongly recommended to use `logrotate` for smartd files. - -## Configuration - -Edit the `python.d/smartd_log.conf` configuration file using `edit-config` from the Netdata [config -directory](https://github.com/netdata/netdata/blob/master/docs/configure/nodes.md), which is typically at `/etc/netdata`. - -```bash -cd /etc/netdata # Replace this path with your Netdata config directory, if different -sudo ./edit-config python.d/smartd_log.conf -``` - -```yaml -local: - log_path : '/var/log/smartd/' -``` - -If no configuration is given, module will attempt to read log files in `/var/log/smartd/` directory. - - - - -### Troubleshooting - -To troubleshoot issues with the `smartd_log` module, run the `python.d.plugin` with the debug option enabled. The -output will give you the output of the data collection job or error messages on why the collector isn't working. - -First, navigate to your plugins directory, usually they are located under `/usr/libexec/netdata/plugins.d/`. If that's -not the case on your system, open `netdata.conf` and look for the setting `plugins directory`. Once you're in the -plugin's directory, switch to the `netdata` user. - -```bash -cd /usr/libexec/netdata/plugins.d/ -sudo su -s /bin/bash netdata -``` - -Now you can manually run the `smartd_log` module in debug mode: - -```bash -./python.d.plugin smartd_log debug trace -``` - +integrations/s.m.a.r.t..md
\ No newline at end of file diff --git a/collectors/python.d.plugin/smartd_log/integrations/s.m.a.r.t..md b/collectors/python.d.plugin/smartd_log/integrations/s.m.a.r.t..md new file mode 100644 index 000000000..a943f8704 --- /dev/null +++ b/collectors/python.d.plugin/smartd_log/integrations/s.m.a.r.t..md @@ -0,0 +1,222 @@ +<!--startmeta +custom_edit_url: "https://github.com/netdata/netdata/edit/master/collectors/python.d.plugin/smartd_log/README.md" +meta_yaml: "https://github.com/netdata/netdata/edit/master/collectors/python.d.plugin/smartd_log/metadata.yaml" +sidebar_label: "S.M.A.R.T." +learn_status: "Published" +learn_rel_path: "Data Collection/Hardware Devices and Sensors" +message: "DO NOT EDIT THIS FILE DIRECTLY, IT IS GENERATED BY THE COLLECTOR'S metadata.yaml FILE" +endmeta--> + +# S.M.A.R.T. + + +<img src="https://netdata.cloud/img/smart.png" width="150"/> + + +Plugin: python.d.plugin +Module: smartd_log + +<img src="https://img.shields.io/badge/maintained%20by-Netdata-%2300ab44" /> + +## Overview + +This collector monitors HDD/SSD S.M.A.R.T. metrics about drive health and performance. + + +It reads `smartd` log files to collect the metrics. + + +This collector is supported on all platforms. + +This collector only supports collecting metrics from a single instance of this integration. + + +### Default Behavior + +#### Auto-Detection + +Upon satisfying the prerequisites, the collector will auto-detect metrics if written in either `/var/log/smartd/` or `/var/lib/smartmontools/`. + +#### Limits + +The default configuration for this integration does not impose any limits on data collection. + +#### Performance Impact + +The default configuration for this integration is not expected to impose a significant performance impact on the system. + + +## Metrics + +Metrics grouped by *scope*. + +The scope defines the instance that the metric belongs to. An instance is uniquely identified by a set of labels. + +The metrics listed below are split in terms of availability on device type, SCSI or ATA. + +### Per S.M.A.R.T. instance + +These metrics refer to the entire monitored application. + +This scope has no labels. + +Metrics: + +| Metric | Dimensions | Unit | SCSI | ATA | +|:------|:----------|:----|:---:|:---:| +| smartd_log.read_error_rate | a dimension per device | value | | • | +| smartd_log.seek_error_rate | a dimension per device | value | | • | +| smartd_log.soft_read_error_rate | a dimension per device | errors | | • | +| smartd_log.write_error_rate | a dimension per device | value | | • | +| smartd_log.read_total_err_corrected | a dimension per device | errors | • | | +| smartd_log.read_total_unc_errors | a dimension per device | errors | • | | +| smartd_log.write_total_err_corrected | a dimension per device | errors | • | | +| smartd_log.write_total_unc_errors | a dimension per device | errors | • | | +| smartd_log.verify_total_err_corrected | a dimension per device | errors | • | | +| smartd_log.verify_total_unc_errors | a dimension per device | errors | • | | +| smartd_log.sata_interface_downshift | a dimension per device | events | | • | +| smartd_log.udma_crc_error_count | a dimension per device | errors | | • | +| smartd_log.throughput_performance | a dimension per device | value | | • | +| smartd_log.seek_time_performance | a dimension per device | value | | • | +| smartd_log.start_stop_count | a dimension per device | events | | • | +| smartd_log.power_on_hours_count | a dimension per device | hours | | • | +| smartd_log.power_cycle_count | a dimension per device | events | | • | +| smartd_log.unexpected_power_loss | a dimension per device | events | | • | +| smartd_log.spin_up_time | a dimension per device | ms | | • | +| smartd_log.spin_up_retries | a dimension per device | retries | | • | +| smartd_log.calibration_retries | a dimension per device | retries | | • | +| smartd_log.airflow_temperature_celsius | a dimension per device | celsius | | • | +| smartd_log.temperature_celsius | a dimension per device | celsius | • | • | +| smartd_log.reallocated_sectors_count | a dimension per device | sectors | | • | +| smartd_log.reserved_block_count | a dimension per device | percentage | | • | +| smartd_log.program_fail_count | a dimension per device | errors | | • | +| smartd_log.erase_fail_count | a dimension per device | failures | | • | +| smartd_log.wear_leveller_worst_case_erase_count | a dimension per device | erases | | • | +| smartd_log.unused_reserved_nand_blocks | a dimension per device | blocks | | • | +| smartd_log.reallocation_event_count | a dimension per device | events | | • | +| smartd_log.current_pending_sector_count | a dimension per device | sectors | | • | +| smartd_log.offline_uncorrectable_sector_count | a dimension per device | sectors | | • | +| smartd_log.percent_lifetime_used | a dimension per device | percentage | | • | +| smartd_log.media_wearout_indicator | a dimension per device | percentage | | • | +| smartd_log.nand_writes_1gib | a dimension per device | GiB | | • | + + + +## Alerts + +There are no alerts configured by default for this integration. + + +## Setup + +### Prerequisites + +#### Configure `smartd` to write attribute information to files. + +`smartd` must be running with `-A` option to write `smartd` attribute information to files. + +For this you need to set `smartd_opts` (or `SMARTD_ARGS`, check _smartd.service_ content) in `/etc/default/smartmontools`: + +``` +# dump smartd attrs info every 600 seconds +smartd_opts="-A /var/log/smartd/ -i 600" +``` + +You may need to create the smartd directory before smartd will write to it: + +```sh +mkdir -p /var/log/smartd +``` + +Otherwise, all the smartd `.csv` files may get written to `/var/lib/smartmontools` (default location). See also <https://linux.die.net/man/8/smartd> for more info on the `-A --attributelog=PREFIX` command. + +`smartd` appends logs at every run. It's strongly recommended to use `logrotate` for smartd files. + + + +### Configuration + +#### File + +The configuration file name for this integration is `python.d/smartd_log.conf`. + + +You can edit the configuration file using the `edit-config` script from the +Netdata [config directory](https://github.com/netdata/netdata/blob/master/docs/configure/nodes.md#the-netdata-config-directory). + +```bash +cd /etc/netdata 2>/dev/null || cd /opt/netdata/etc/netdata +sudo ./edit-config python.d/smartd_log.conf +``` +#### Options + +This particular collector does not need further configuration to work if permissions are satisfied, but you can always customize it's data collection behavior. + +There are 2 sections: + +* Global variables +* One or more JOBS that can define multiple different instances to monitor. + +The following options can be defined globally: priority, penalty, autodetection_retry, update_every, but can also be defined per JOB to override the global values. + +Additionally, the following collapsed table contains all the options that can be configured inside a JOB definition. + +Every configuration JOB starts with a `job_name` value which will appear in the dashboard, unless a `name` parameter is specified. + + +<details><summary>Config options</summary> + +| Name | Description | Default | Required | +|:----|:-----------|:-------|:--------:| +| log_path | path to smartd log files. | /var/log/smartd | True | +| exclude_disks | Space-separated patterns. If the pattern is in the drive name, the module will not collect data for it. | | False | +| age | Time in minutes since the last dump to file. | 30 | False | +| update_every | Sets the default data collection frequency. | 1 | False | +| priority | Controls the order of charts at the netdata dashboard. | 60000 | False | +| autodetection_retry | Sets the job re-check interval in seconds. | 0 | False | +| penalty | Indicates whether to apply penalty to update_every in case of failures. | yes | False | +| name | Job name. This value will overwrite the `job_name` value. JOBS with the same name are mutually exclusive. Only one of them will be allowed running at any time. This allows autodetection to try several alternatives and pick the one that works. | | False | + +</details> + +#### Examples + +##### Basic + +A basic configuration example. + +```yaml +custom: + name: smartd_log + log_path: '/var/log/smartd/' + +``` + + +## Troubleshooting + +### Debug Mode + +To troubleshoot issues with the `smartd_log` collector, run the `python.d.plugin` with the debug option enabled. The output +should give you clues as to why the collector isn't working. + +- Navigate to the `plugins.d` directory, usually at `/usr/libexec/netdata/plugins.d/`. If that's not the case on + your system, open `netdata.conf` and look for the `plugins` setting under `[directories]`. + + ```bash + cd /usr/libexec/netdata/plugins.d/ + ``` + +- Switch to the `netdata` user. + + ```bash + sudo -u netdata -s + ``` + +- Run the `python.d.plugin` to debug the collector: + + ```bash + ./python.d.plugin smartd_log debug trace + ``` + + diff --git a/collectors/python.d.plugin/spigotmc/README.md b/collectors/python.d.plugin/spigotmc/README.md index f39d9bab6..66e5c9c47 100644..120000 --- a/collectors/python.d.plugin/spigotmc/README.md +++ b/collectors/python.d.plugin/spigotmc/README.md @@ -1,61 +1 @@ -<!-- -title: "SpigotMC monitoring with Netdata" -custom_edit_url: "https://github.com/netdata/netdata/edit/master/collectors/python.d.plugin/spigotmc/README.md" -sidebar_label: "SpigotMC" -learn_status: "Published" -learn_topic_type: "References" -learn_rel_path: "Integrations/Monitor/Webapps" ---> - -# SpigotMC collector - -Performs basic monitoring for Spigot Minecraft servers. - -It provides two charts, one tracking server-side ticks-per-second in -1, 5 and 15 minute averages, and one tracking the number of currently -active users. - -This is not compatible with Spigot plugins which change the format of -the data returned by the `tps` or `list` console commands. - -## Configuration - -Edit the `python.d/spigotmc.conf` configuration file using `edit-config` from the Netdata [config -directory](https://github.com/netdata/netdata/blob/master/docs/configure/nodes.md), which is typically at `/etc/netdata`. - -```bash -cd /etc/netdata # Replace this path with your Netdata config directory, if different -sudo ./edit-config python.d/spigotmc.conf -``` - -```yaml -host: localhost -port: 25575 -password: pass -``` - -By default, a connection to port 25575 on the local system is attempted with an empty password. - - - - -### Troubleshooting - -To troubleshoot issues with the `spigotmc` module, run the `python.d.plugin` with the debug option enabled. The -output will give you the output of the data collection job or error messages on why the collector isn't working. - -First, navigate to your plugins directory, usually they are located under `/usr/libexec/netdata/plugins.d/`. If that's -not the case on your system, open `netdata.conf` and look for the setting `plugins directory`. Once you're in the -plugin's directory, switch to the `netdata` user. - -```bash -cd /usr/libexec/netdata/plugins.d/ -sudo su -s /bin/bash netdata -``` - -Now you can manually run the `spigotmc` module in debug mode: - -```bash -./python.d.plugin spigotmc debug trace -``` - +integrations/spigotmc.md
\ No newline at end of file diff --git a/collectors/python.d.plugin/spigotmc/integrations/spigotmc.md b/collectors/python.d.plugin/spigotmc/integrations/spigotmc.md new file mode 100644 index 000000000..af330bdd1 --- /dev/null +++ b/collectors/python.d.plugin/spigotmc/integrations/spigotmc.md @@ -0,0 +1,215 @@ +<!--startmeta +custom_edit_url: "https://github.com/netdata/netdata/edit/master/collectors/python.d.plugin/spigotmc/README.md" +meta_yaml: "https://github.com/netdata/netdata/edit/master/collectors/python.d.plugin/spigotmc/metadata.yaml" +sidebar_label: "SpigotMC" +learn_status: "Published" +learn_rel_path: "Data Collection/Gaming" +message: "DO NOT EDIT THIS FILE DIRECTLY, IT IS GENERATED BY THE COLLECTOR'S metadata.yaml FILE" +endmeta--> + +# SpigotMC + + +<img src="https://netdata.cloud/img/spigot.jfif" width="150"/> + + +Plugin: python.d.plugin +Module: spigotmc + +<img src="https://img.shields.io/badge/maintained%20by-Netdata-%2300ab44" /> + +## Overview + +This collector monitors SpigotMC server performance, in the form of ticks per second average, memory utilization, and active users. + + +It sends the `tps`, `list` and `online` commands to the Server, and gathers the metrics from the responses. + + +This collector is only supported on the following platforms: + +- Linux + +This collector supports collecting metrics from multiple instances of this integration, including remote instances. + + +### Default Behavior + +#### Auto-Detection + +By default, this collector will attempt to connect to a Spigot server running on the local host on port `25575`. + +#### Limits + +The default configuration for this integration does not impose any limits on data collection. + +#### Performance Impact + +The default configuration for this integration is not expected to impose a significant performance impact on the system. + + +## Metrics + +Metrics grouped by *scope*. + +The scope defines the instance that the metric belongs to. An instance is uniquely identified by a set of labels. + + + +### Per SpigotMC instance + +These metrics refer to the entire monitored application. + +This scope has no labels. + +Metrics: + +| Metric | Dimensions | Unit | +|:------|:----------|:----| +| spigotmc.tps | 1 Minute Average, 5 Minute Average, 15 Minute Average | ticks | +| spigotmc.users | Users | users | +| spigotmc.mem | used, allocated, max | MiB | + + + +## Alerts + +There are no alerts configured by default for this integration. + + +## Setup + +### Prerequisites + +#### Enable the Remote Console Protocol + +Under your SpigotMC server's `server.properties` configuration file, you should set `enable-rcon` to `true`. + +This will allow the Server to listen and respond to queries over the rcon protocol. + + + +### Configuration + +#### File + +The configuration file name for this integration is `python.d/spigotmc.conf`. + + +You can edit the configuration file using the `edit-config` script from the +Netdata [config directory](https://github.com/netdata/netdata/blob/master/docs/configure/nodes.md#the-netdata-config-directory). + +```bash +cd /etc/netdata 2>/dev/null || cd /opt/netdata/etc/netdata +sudo ./edit-config python.d/spigotmc.conf +``` +#### Options + +There are 2 sections: + +* Global variables +* One or more JOBS that can define multiple different instances to monitor. + +The following options can be defined globally: priority, penalty, autodetection_retry, update_every, but can also be defined per JOB to override the global values. + +Additionally, the following collapsed table contains all the options that can be configured inside a JOB definition. + +Every configuration JOB starts with a `job_name` value which will appear in the dashboard, unless a `name` parameter is specified. + + +<details><summary>Config options</summary> + +| Name | Description | Default | Required | +|:----|:-----------|:-------|:--------:| +| update_every | Sets the default data collection frequency. | 1 | False | +| priority | Controls the order of charts at the netdata dashboard. | 60000 | False | +| autodetection_retry | Sets the job re-check interval in seconds. | 0 | False | +| penalty | Indicates whether to apply penalty to update_every in case of failures. | yes | False | +| name | Job name. This value will overwrite the `job_name` value. JOBS with the same name are mutually exclusive. Only one of them will be allowed running at any time. This allows autodetection to try several alternatives and pick the one that works. | | False | +| host | The host's IP to connect to. | localhost | True | +| port | The port the remote console is listening on. | 25575 | True | +| password | Remote console password if any. | | False | + +</details> + +#### Examples + +##### Basic + +A basic configuration example. + +```yaml +local: + name: local_server + url: 127.0.0.1 + port: 25575 + +``` +##### Basic Authentication + +An example using basic password for authentication with the remote console. + +<details><summary>Config</summary> + +```yaml +local: + name: local_server_pass + url: 127.0.0.1 + port: 25575 + password: 'foobar' + +``` +</details> + +##### Multi-instance + +> **Note**: When you define multiple jobs, their names must be unique. + +Collecting metrics from local and remote instances. + + +<details><summary>Config</summary> + +```yaml +local_server: + name : my_local_server + url : 127.0.0.1 + port: 25575 + +remote_server: + name : another_remote_server + url : 192.0.2.1 + port: 25575 + +``` +</details> + + + +## Troubleshooting + +### Debug Mode + +To troubleshoot issues with the `spigotmc` collector, run the `python.d.plugin` with the debug option enabled. The output +should give you clues as to why the collector isn't working. + +- Navigate to the `plugins.d` directory, usually at `/usr/libexec/netdata/plugins.d/`. If that's not the case on + your system, open `netdata.conf` and look for the `plugins` setting under `[directories]`. + + ```bash + cd /usr/libexec/netdata/plugins.d/ + ``` + +- Switch to the `netdata` user. + + ```bash + sudo -u netdata -s + ``` + +- Run the `python.d.plugin` to debug the collector: + + ```bash + ./python.d.plugin spigotmc debug trace + ``` + + diff --git a/collectors/python.d.plugin/squid/README.md b/collectors/python.d.plugin/squid/README.md index da5349184..c4e5a03d7 100644..120000 --- a/collectors/python.d.plugin/squid/README.md +++ b/collectors/python.d.plugin/squid/README.md @@ -1,81 +1 @@ -<!-- -title: "Squid monitoring with Netdata" -custom_edit_url: "https://github.com/netdata/netdata/edit/master/collectors/python.d.plugin/squid/README.md" -sidebar_label: "Squid" -learn_status: "Published" -learn_topic_type: "References" -learn_rel_path: "Integrations/Monitor/Webapps" ---> - -# Squid collector - -Monitors one or more squid instances depending on configuration. - -It produces following charts: - -1. **Client Bandwidth** in kilobits/s - - - in - - out - - hits - -2. **Client Requests** in requests/s - - - requests - - hits - - errors - -3. **Server Bandwidth** in kilobits/s - - - in - - out - -4. **Server Requests** in requests/s - - - requests - - errors - -## Configuration - -Edit the `python.d/squid.conf` configuration file using `edit-config` from the Netdata [config -directory](https://github.com/netdata/netdata/blob/master/docs/configure/nodes.md), which is typically at `/etc/netdata`. - -```bash -cd /etc/netdata # Replace this path with your Netdata config directory, if different -sudo ./edit-config python.d/squid.conf -``` - -```yaml -priority : 50000 - -local: - request : 'cache_object://localhost:3128/counters' - host : 'localhost' - port : 3128 -``` - -Without any configuration module will try to autodetect where squid presents its `counters` data - - - - -### Troubleshooting - -To troubleshoot issues with the `squid` module, run the `python.d.plugin` with the debug option enabled. The -output will give you the output of the data collection job or error messages on why the collector isn't working. - -First, navigate to your plugins directory, usually they are located under `/usr/libexec/netdata/plugins.d/`. If that's -not the case on your system, open `netdata.conf` and look for the setting `plugins directory`. Once you're in the -plugin's directory, switch to the `netdata` user. - -```bash -cd /usr/libexec/netdata/plugins.d/ -sudo su -s /bin/bash netdata -``` - -Now you can manually run the `squid` module in debug mode: - -```bash -./python.d.plugin squid debug trace -``` - +integrations/squid.md
\ No newline at end of file diff --git a/collectors/python.d.plugin/squid/integrations/squid.md b/collectors/python.d.plugin/squid/integrations/squid.md new file mode 100644 index 000000000..484d8706c --- /dev/null +++ b/collectors/python.d.plugin/squid/integrations/squid.md @@ -0,0 +1,198 @@ +<!--startmeta +custom_edit_url: "https://github.com/netdata/netdata/edit/master/collectors/python.d.plugin/squid/README.md" +meta_yaml: "https://github.com/netdata/netdata/edit/master/collectors/python.d.plugin/squid/metadata.yaml" +sidebar_label: "Squid" +learn_status: "Published" +learn_rel_path: "Data Collection/Web Servers and Web Proxies" +message: "DO NOT EDIT THIS FILE DIRECTLY, IT IS GENERATED BY THE COLLECTOR'S metadata.yaml FILE" +endmeta--> + +# Squid + + +<img src="https://netdata.cloud/img/squid.png" width="150"/> + + +Plugin: python.d.plugin +Module: squid + +<img src="https://img.shields.io/badge/maintained%20by-Netdata-%2300ab44" /> + +## Overview + +This collector monitors statistics about the Squid Clients and Servers, like bandwidth and requests. + + +It collects metrics from the endpoint where Squid exposes its `counters` data. + +This collector is supported on all platforms. + +This collector supports collecting metrics from multiple instances of this integration, including remote instances. + + +### Default Behavior + +#### Auto-Detection + +By default, this collector will try to autodetect where Squid presents its `counters` data, by trying various configurations. + +#### Limits + +The default configuration for this integration does not impose any limits on data collection. + +#### Performance Impact + +The default configuration for this integration is not expected to impose a significant performance impact on the system. + + +## Metrics + +Metrics grouped by *scope*. + +The scope defines the instance that the metric belongs to. An instance is uniquely identified by a set of labels. + + + +### Per Squid instance + +These metrics refer to each monitored Squid instance. + +This scope has no labels. + +Metrics: + +| Metric | Dimensions | Unit | +|:------|:----------|:----| +| squid.clients_net | in, out, hits | kilobits/s | +| squid.clients_requests | requests, hits, errors | requests/s | +| squid.servers_net | in, out | kilobits/s | +| squid.servers_requests | requests, errors | requests/s | + + + +## Alerts + +There are no alerts configured by default for this integration. + + +## Setup + +### Prerequisites + +#### Configure Squid's Cache Manager + +Take a look at [Squid's official documentation](https://wiki.squid-cache.org/Features/CacheManager/Index#controlling-access-to-the-cache-manager) on how to configure access to the Cache Manager. + + + +### Configuration + +#### File + +The configuration file name for this integration is `python.d/squid.conf`. + + +You can edit the configuration file using the `edit-config` script from the +Netdata [config directory](https://github.com/netdata/netdata/blob/master/docs/configure/nodes.md#the-netdata-config-directory). + +```bash +cd /etc/netdata 2>/dev/null || cd /opt/netdata/etc/netdata +sudo ./edit-config python.d/squid.conf +``` +#### Options + +There are 2 sections: + +* Global variables +* One or more JOBS that can define multiple different instances to monitor. + +The following options can be defined globally: priority, penalty, autodetection_retry, update_every, but can also be defined per JOB to override the global values. + +Additionally, the following collapsed table contains all the options that can be configured inside a JOB definition. + +Every configuration JOB starts with a `job_name` value which will appear in the dashboard, unless a `name` parameter is specified. + + +<details><summary>Config options</summary> + +| Name | Description | Default | Required | +|:----|:-----------|:-------|:--------:| +| update_every | Sets the default data collection frequency. | 1 | False | +| priority | Controls the order of charts at the netdata dashboard. | 60000 | False | +| autodetection_retry | Sets the job re-check interval in seconds. | 0 | False | +| penalty | Indicates whether to apply penalty to update_every in case of failures. | yes | False | +| name | Job name. This value will overwrite the `job_name` value. JOBS with the same name are mutually exclusive. Only one of them will be allowed running at any time. This allows autodetection to try several alternatives and pick the one that works. | local | False | +| host | The host to connect to. | | True | +| port | The port to connect to. | | True | +| request | The URL to request from Squid. | | True | + +</details> + +#### Examples + +##### Basic + +A basic configuration example. + +```yaml +example_job_name: + name: 'local' + host: 'localhost' + port: 3128 + request: 'cache_object://localhost:3128/counters' + +``` +##### Multi-instance + +> **Note**: When you define multiple jobs, their names must be unique. + +Collecting metrics from local and remote instances. + + +<details><summary>Config</summary> + +```yaml +local_job: + name: 'local' + host: '127.0.0.1' + port: 3128 + request: 'cache_object://127.0.0.1:3128/counters' + +remote_job: + name: 'remote' + host: '192.0.2.1' + port: 3128 + request: 'cache_object://192.0.2.1:3128/counters' + +``` +</details> + + + +## Troubleshooting + +### Debug Mode + +To troubleshoot issues with the `squid` collector, run the `python.d.plugin` with the debug option enabled. The output +should give you clues as to why the collector isn't working. + +- Navigate to the `plugins.d` directory, usually at `/usr/libexec/netdata/plugins.d/`. If that's not the case on + your system, open `netdata.conf` and look for the `plugins` setting under `[directories]`. + + ```bash + cd /usr/libexec/netdata/plugins.d/ + ``` + +- Switch to the `netdata` user. + + ```bash + sudo -u netdata -s + ``` + +- Run the `python.d.plugin` to debug the collector: + + ```bash + ./python.d.plugin squid debug trace + ``` + + diff --git a/collectors/python.d.plugin/tomcat/README.md b/collectors/python.d.plugin/tomcat/README.md index 923d6238f..997090c35 100644..120000 --- a/collectors/python.d.plugin/tomcat/README.md +++ b/collectors/python.d.plugin/tomcat/README.md @@ -1,76 +1 @@ -<!-- -title: "Apache Tomcat monitoring with Netdata" -custom_edit_url: "https://github.com/netdata/netdata/edit/master/collectors/python.d.plugin/tomcat/README.md" -sidebar_label: "Tomcat" -learn_status: "Published" -learn_topic_type: "References" -learn_rel_path: "Integrations/Monitor/Webapps" ---> - -# Apache Tomcat collector - -Presents memory utilization of tomcat containers. - -Charts: - -1. **Requests** per second - - - accesses - -2. **Volume** in KB/s - - - volume - -3. **Threads** - - - current - - busy - -4. **JVM Free Memory** in MB - - - jvm - -## Configuration - -Edit the `python.d/tomcat.conf` configuration file using `edit-config` from the Netdata [config -directory](https://github.com/netdata/netdata/blob/master/docs/configure/nodes.md), which is typically at `/etc/netdata`. - -```bash -cd /etc/netdata # Replace this path with your Netdata config directory, if different -sudo ./edit-config python.d/tomcat.conf -``` - -```yaml -localhost: - name : 'local' - url : 'http://127.0.0.1:8080/manager/status?XML=true' - user : 'tomcat_username' - pass : 'secret_tomcat_password' -``` - -Without configuration, module attempts to connect to `http://localhost:8080/manager/status?XML=true`, without any credentials. -So it will probably fail. - - - - -### Troubleshooting - -To troubleshoot issues with the `tomcat` module, run the `python.d.plugin` with the debug option enabled. The -output will give you the output of the data collection job or error messages on why the collector isn't working. - -First, navigate to your plugins directory, usually they are located under `/usr/libexec/netdata/plugins.d/`. If that's -not the case on your system, open `netdata.conf` and look for the setting `plugins directory`. Once you're in the -plugin's directory, switch to the `netdata` user. - -```bash -cd /usr/libexec/netdata/plugins.d/ -sudo su -s /bin/bash netdata -``` - -Now you can manually run the `tomcat` module in debug mode: - -```bash -./python.d.plugin tomcat debug trace -``` - +integrations/tomcat.md
\ No newline at end of file diff --git a/collectors/python.d.plugin/tomcat/integrations/tomcat.md b/collectors/python.d.plugin/tomcat/integrations/tomcat.md new file mode 100644 index 000000000..8210835c1 --- /dev/null +++ b/collectors/python.d.plugin/tomcat/integrations/tomcat.md @@ -0,0 +1,202 @@ +<!--startmeta +custom_edit_url: "https://github.com/netdata/netdata/edit/master/collectors/python.d.plugin/tomcat/README.md" +meta_yaml: "https://github.com/netdata/netdata/edit/master/collectors/python.d.plugin/tomcat/metadata.yaml" +sidebar_label: "Tomcat" +learn_status: "Published" +learn_rel_path: "Data Collection/Web Servers and Web Proxies" +message: "DO NOT EDIT THIS FILE DIRECTLY, IT IS GENERATED BY THE COLLECTOR'S metadata.yaml FILE" +endmeta--> + +# Tomcat + + +<img src="https://netdata.cloud/img/tomcat.svg" width="150"/> + + +Plugin: python.d.plugin +Module: tomcat + +<img src="https://img.shields.io/badge/maintained%20by-Netdata-%2300ab44" /> + +## Overview + +This collector monitors Tomcat metrics about bandwidth, processing time, threads and more. + + +It parses the information provided by the http endpoint of the `/manager/status` in XML format + + +This collector is supported on all platforms. + +This collector supports collecting metrics from multiple instances of this integration, including remote instances. + +You need to provide the username and the password, to access the webserver's status page. Create a seperate user with read only rights for this particular endpoint + +### Default Behavior + +#### Auto-Detection + +If the Netdata Agent and the Tomcat webserver are in the same host, without configuration, module attempts to connect to http://localhost:8080/manager/status?XML=true, without any credentials. So it will probably fail. + +#### Limits + +This module is not supporting SSL communication. If you want a Netdata Agent to monitor a Tomcat deployment, you shouldnt try to monitor it via public network (public internet). Credentials are passed by Netdata in an unsecure port + +#### Performance Impact + +The default configuration for this integration is not expected to impose a significant performance impact on the system. + + +## Metrics + +Metrics grouped by *scope*. + +The scope defines the instance that the metric belongs to. An instance is uniquely identified by a set of labels. + + + +### Per Tomcat instance + +These metrics refer to the entire monitored application. + +This scope has no labels. + +Metrics: + +| Metric | Dimensions | Unit | +|:------|:----------|:----| +| tomcat.accesses | accesses, errors | requests/s | +| tomcat.bandwidth | sent, received | KiB/s | +| tomcat.processing_time | processing time | seconds | +| tomcat.threads | current, busy | current threads | +| tomcat.jvm | free, eden, survivor, tenured, code cache, compressed, metaspace | MiB | +| tomcat.jvm_eden | used, committed, max | MiB | +| tomcat.jvm_survivor | used, committed, max | MiB | +| tomcat.jvm_tenured | used, committed, max | MiB | + + + +## Alerts + +There are no alerts configured by default for this integration. + + +## Setup + +### Prerequisites + +#### Create a read-only `netdata` user, to monitor the `/status` endpoint. + +This is necessary for configuring the collector. + + +### Configuration + +#### File + +The configuration file name for this integration is `python.d/tomcat.conf`. + + +You can edit the configuration file using the `edit-config` script from the +Netdata [config directory](https://github.com/netdata/netdata/blob/master/docs/configure/nodes.md#the-netdata-config-directory). + +```bash +cd /etc/netdata 2>/dev/null || cd /opt/netdata/etc/netdata +sudo ./edit-config python.d/tomcat.conf +``` +#### Options + +There are 2 sections: + +* Global variables +* One or more JOBS that can define multiple different instances to monitor. + +The following options can be defined globally: priority, penalty, autodetection_retry, update_every, but can also be defined per JOB to override the global values.Additionally, the following collapsed table contains all the options that can be configured inside a JOB definition. + +Every configuration JOB starts with a `job_name` value which will appear in the dashboard, unless a `name` parameter is specified. + + +<details><summary>Config options per job</summary> + +| Name | Description | Default | Required | +|:----|:-----------|:-------|:--------:| +| update_every | Sets the default data collection frequency. | 5 | False | +| priority | Controls the order of charts at the netdata dashboard. | 60000 | False | +| autodetection_retry | Sets the job re-check interval in seconds. | 0 | False | +| penalty | Indicates whether to apply penalty to update_every in case of failures. | yes | False | +| url | The URL of the Tomcat server's status endpoint. Always add the suffix ?XML=true. | no | True | +| user | A valid user with read permission to access the /manager/status endpoint of the server. Required if the endpoint is password protected | no | False | +| pass | A valid password for the user in question. Required if the endpoint is password protected | no | False | +| connector_name | The connector component that communicates with a web connector via the AJP protocol, e.g ajp-bio-8009 | | False | + +</details> + +#### Examples + +##### Basic + +A basic example configuration + +```yaml +localhost: + name : 'local' + url : 'http://localhost:8080/manager/status?XML=true' + +``` +##### Using an IPv4 endpoint + +A typical configuration using an IPv4 endpoint + +<details><summary>Config</summary> + +```yaml +local_ipv4: + name : 'local' + url : 'http://127.0.0.1:8080/manager/status?XML=true' + +``` +</details> + +##### Using an IPv6 endpoint + +A typical configuration using an IPv6 endpoint + +<details><summary>Config</summary> + +```yaml +local_ipv6: + name : 'local' + url : 'http://[::1]:8080/manager/status?XML=true' + +``` +</details> + + + +## Troubleshooting + +### Debug Mode + +To troubleshoot issues with the `tomcat` collector, run the `python.d.plugin` with the debug option enabled. The output +should give you clues as to why the collector isn't working. + +- Navigate to the `plugins.d` directory, usually at `/usr/libexec/netdata/plugins.d/`. If that's not the case on + your system, open `netdata.conf` and look for the `plugins` setting under `[directories]`. + + ```bash + cd /usr/libexec/netdata/plugins.d/ + ``` + +- Switch to the `netdata` user. + + ```bash + sudo -u netdata -s + ``` + +- Run the `python.d.plugin` to debug the collector: + + ```bash + ./python.d.plugin tomcat debug trace + ``` + + diff --git a/collectors/python.d.plugin/tomcat/metadata.yaml b/collectors/python.d.plugin/tomcat/metadata.yaml index c22f4f58b..e68526073 100644 --- a/collectors/python.d.plugin/tomcat/metadata.yaml +++ b/collectors/python.d.plugin/tomcat/metadata.yaml @@ -45,7 +45,7 @@ modules: prerequisites: list: - title: Create a read-only `netdata` user, to monitor the `/status` endpoint. - description: You will need this configuring the collector + description: This is necessary for configuring the collector. configuration: file: name: "python.d/tomcat.conf" diff --git a/collectors/python.d.plugin/tor/README.md b/collectors/python.d.plugin/tor/README.md index 15f7e2282..7c20cd40a 100644..120000 --- a/collectors/python.d.plugin/tor/README.md +++ b/collectors/python.d.plugin/tor/README.md @@ -1,89 +1 @@ -<!-- -title: "Tor monitoring with Netdata" -custom_edit_url: "https://github.com/netdata/netdata/edit/master/collectors/python.d.plugin/tor/README.md" -sidebar_label: "Tor" -learn_status: "Published" -learn_topic_type: "References" -learn_rel_path: "Integrations/Monitor/Apps" ---> - -# Tor collector - -Connects to the Tor control port to collect traffic statistics. - -## Requirements - -- `tor` program -- `stem` python package - -It produces only one chart: - -1. **Traffic** - - - read - - write - -## Configuration - -Edit the `python.d/tor.conf` configuration file using `edit-config` from the Netdata [config -directory](https://github.com/netdata/netdata/blob/master/docs/configure/nodes.md), which is typically at `/etc/netdata`. - -```bash -cd /etc/netdata # Replace this path with your Netdata config directory, if different -sudo ./edit-config python.d/tor.conf -``` - -Needs only `control_port`. - -Here is an example for local server: - -```yaml -update_every : 1 -priority : 60000 - -local_tcp: - name: 'local' - control_port: 9051 - password: <password> # if required - -local_socket: - name: 'local' - control_port: '/var/run/tor/control' - password: <password> # if required -``` - -### prerequisite - -Add to `/etc/tor/torrc`: - -``` -ControlPort 9051 -``` - -For more options please read the manual. - -Without configuration, module attempts to connect to `127.0.0.1:9051`. - - - - -### Troubleshooting - -To troubleshoot issues with the `tor` module, run the `python.d.plugin` with the debug option enabled. The -output will give you the output of the data collection job or error messages on why the collector isn't working. - -First, navigate to your plugins directory, usually they are located under `/usr/libexec/netdata/plugins.d/`. If that's -not the case on your system, open `netdata.conf` and look for the setting `plugins directory`. Once you're in the -plugin's directory, switch to the `netdata` user. - -```bash -cd /usr/libexec/netdata/plugins.d/ -sudo su -s /bin/bash netdata -``` - -Now you can manually run the `tor` module in debug mode: - -```bash -./python.d.plugin tor debug trace -``` - +integrations/tor.md
\ No newline at end of file diff --git a/collectors/python.d.plugin/tor/integrations/tor.md b/collectors/python.d.plugin/tor/integrations/tor.md new file mode 100644 index 000000000..f5c0026af --- /dev/null +++ b/collectors/python.d.plugin/tor/integrations/tor.md @@ -0,0 +1,196 @@ +<!--startmeta +custom_edit_url: "https://github.com/netdata/netdata/edit/master/collectors/python.d.plugin/tor/README.md" +meta_yaml: "https://github.com/netdata/netdata/edit/master/collectors/python.d.plugin/tor/metadata.yaml" +sidebar_label: "Tor" +learn_status: "Published" +learn_rel_path: "Data Collection/VPNs" +message: "DO NOT EDIT THIS FILE DIRECTLY, IT IS GENERATED BY THE COLLECTOR'S metadata.yaml FILE" +endmeta--> + +# Tor + + +<img src="https://netdata.cloud/img/tor.svg" width="150"/> + + +Plugin: python.d.plugin +Module: tor + +<img src="https://img.shields.io/badge/maintained%20by-Netdata-%2300ab44" /> + +## Overview + +This collector monitors Tor bandwidth traffic . + +It connects to the Tor control port to collect traffic statistics. + +This collector is supported on all platforms. + +This collector supports collecting metrics from multiple instances of this integration, including remote instances. + + +### Default Behavior + +#### Auto-Detection + +If no configuration is provided the collector will try to connect to 127.0.0.1:9051 to detect a running tor instance. + +#### Limits + +The default configuration for this integration does not impose any limits on data collection. + +#### Performance Impact + +The default configuration for this integration is not expected to impose a significant performance impact on the system. + + +## Metrics + +Metrics grouped by *scope*. + +The scope defines the instance that the metric belongs to. An instance is uniquely identified by a set of labels. + + + +### Per Tor instance + +These metrics refer to the entire monitored application. + +This scope has no labels. + +Metrics: + +| Metric | Dimensions | Unit | +|:------|:----------|:----| +| tor.traffic | read, write | KiB/s | + + + +## Alerts + +There are no alerts configured by default for this integration. + + +## Setup + +### Prerequisites + +#### Required python module + +The `stem` python library needs to be installed. + + +#### Required Tor configuration + +Add to /etc/tor/torrc: + +ControlPort 9051 + +For more options please read the manual. + + + +### Configuration + +#### File + +The configuration file name for this integration is `python.d/tor.conf`. + + +You can edit the configuration file using the `edit-config` script from the +Netdata [config directory](https://github.com/netdata/netdata/blob/master/docs/configure/nodes.md#the-netdata-config-directory). + +```bash +cd /etc/netdata 2>/dev/null || cd /opt/netdata/etc/netdata +sudo ./edit-config python.d/tor.conf +``` +#### Options + +There are 2 sections: + +* Global variables +* One or more JOBS that can define multiple different instances to monitor. + +The following options can be defined globally: priority, penalty, autodetection_retry, update_every, but can also be defined per JOB to override the global values. + +Additionally, the following collapsed table contains all the options that can be configured inside a JOB definition. + +Every configuration JOB starts with a `job_name` value which will appear in the dashboard, unless a `name` parameter is specified. + + +<details><summary>Config options</summary> + +| Name | Description | Default | Required | +|:----|:-----------|:-------|:--------:| +| update_every | Sets the default data collection frequency. | 5 | False | +| priority | Controls the order of charts at the netdata dashboard. | 60000 | False | +| autodetection_retry | Sets the job re-check interval in seconds. | 0 | False | +| penalty | Indicates whether to apply penalty to update_every in case of failures. | yes | False | +| name | Job name. This value will overwrite the `job_name` value. JOBS with the same name are mutually exclusive. Only one of them will be allowed running at any time. This allows autodetection to try several alternatives and pick the one that works. | | False | +| control_addr | Tor control IP address | 127.0.0.1 | False | +| control_port | Tor control port. Can be either a tcp port, or a path to a socket file. | 9051 | False | +| password | Tor control password | | False | + +</details> + +#### Examples + +##### Local TCP + +A basic TCP configuration. `local_addr` is ommited and will default to `127.0.0.1` + +<details><summary>Config</summary> + +```yaml +local_tcp: + name: 'local' + control_port: 9051 + password: <password> # if required + +``` +</details> + +##### Local socket + +A basic local socket configuration + +<details><summary>Config</summary> + +```yaml +local_socket: + name: 'local' + control_port: '/var/run/tor/control' + password: <password> # if required + +``` +</details> + + + +## Troubleshooting + +### Debug Mode + +To troubleshoot issues with the `tor` collector, run the `python.d.plugin` with the debug option enabled. The output +should give you clues as to why the collector isn't working. + +- Navigate to the `plugins.d` directory, usually at `/usr/libexec/netdata/plugins.d/`. If that's not the case on + your system, open `netdata.conf` and look for the `plugins` setting under `[directories]`. + + ```bash + cd /usr/libexec/netdata/plugins.d/ + ``` + +- Switch to the `netdata` user. + + ```bash + sudo -u netdata -s + ``` + +- Run the `python.d.plugin` to debug the collector: + + ```bash + ./python.d.plugin tor debug trace + ``` + + diff --git a/collectors/python.d.plugin/tor/metadata.yaml b/collectors/python.d.plugin/tor/metadata.yaml index d0ecc1a43..8647eca23 100644 --- a/collectors/python.d.plugin/tor/metadata.yaml +++ b/collectors/python.d.plugin/tor/metadata.yaml @@ -39,6 +39,9 @@ modules: setup: prerequisites: list: + - title: 'Required python module' + description: | + The `stem` python library needs to be installed. - title: 'Required Tor configuration' description: | Add to /etc/tor/torrc: diff --git a/collectors/python.d.plugin/uwsgi/README.md b/collectors/python.d.plugin/uwsgi/README.md index 393be9fc5..44b855949 100644..120000 --- a/collectors/python.d.plugin/uwsgi/README.md +++ b/collectors/python.d.plugin/uwsgi/README.md @@ -1,75 +1 @@ -<!-- -title: "uWSGI monitoring with Netdata" -custom_edit_url: "https://github.com/netdata/netdata/edit/master/collectors/python.d.plugin/uwsgi/README.md" -sidebar_label: "uWSGI" -learn_status: "Published" -learn_topic_type: "References" -learn_rel_path: "Integrations/Monitor/Webapps" ---> - -# uWSGI collector - -Monitors performance metrics exposed by [`Stats Server`](https://uwsgi-docs.readthedocs.io/en/latest/StatsServer.html). - - -Following charts are drawn: - -1. **Requests** - - - requests per second - - transmitted data - - average request time - -2. **Memory** - - - rss - - vsz - -3. **Exceptions** -4. **Harakiris** -5. **Respawns** - -## Configuration - -Edit the `python.d/uwsgi.conf` configuration file using `edit-config` from the Netdata [config -directory](https://github.com/netdata/netdata/blob/master/docs/configure/nodes.md), which is typically at `/etc/netdata`. - -```bash -cd /etc/netdata # Replace this path with your Netdata config directory, if different -sudo ./edit-config python.d/uwsgi.conf -``` - -```yaml -socket: - name : 'local' - socket : '/tmp/stats.socket' - -localhost: - name : 'local' - host : 'localhost' - port : 1717 -``` - -When no configuration file is found, module tries to connect to TCP/IP socket: `localhost:1717`. - - -### Troubleshooting - -To troubleshoot issues with the `uwsgi` module, run the `python.d.plugin` with the debug option enabled. The -output will give you the output of the data collection job or error messages on why the collector isn't working. - -First, navigate to your plugins directory, usually they are located under `/usr/libexec/netdata/plugins.d/`. If that's -not the case on your system, open `netdata.conf` and look for the setting `plugins directory`. Once you're in the -plugin's directory, switch to the `netdata` user. - -```bash -cd /usr/libexec/netdata/plugins.d/ -sudo su -s /bin/bash netdata -``` - -Now you can manually run the `uwsgi` module in debug mode: - -```bash -./python.d.plugin uwsgi debug trace -``` - +integrations/uwsgi.md
\ No newline at end of file diff --git a/collectors/python.d.plugin/uwsgi/integrations/uwsgi.md b/collectors/python.d.plugin/uwsgi/integrations/uwsgi.md new file mode 100644 index 000000000..309265789 --- /dev/null +++ b/collectors/python.d.plugin/uwsgi/integrations/uwsgi.md @@ -0,0 +1,218 @@ +<!--startmeta +custom_edit_url: "https://github.com/netdata/netdata/edit/master/collectors/python.d.plugin/uwsgi/README.md" +meta_yaml: "https://github.com/netdata/netdata/edit/master/collectors/python.d.plugin/uwsgi/metadata.yaml" +sidebar_label: "uWSGI" +learn_status: "Published" +learn_rel_path: "Data Collection/Web Servers and Web Proxies" +message: "DO NOT EDIT THIS FILE DIRECTLY, IT IS GENERATED BY THE COLLECTOR'S metadata.yaml FILE" +endmeta--> + +# uWSGI + + +<img src="https://netdata.cloud/img/uwsgi.svg" width="150"/> + + +Plugin: python.d.plugin +Module: uwsgi + +<img src="https://img.shields.io/badge/maintained%20by-Netdata-%2300ab44" /> + +## Overview + +This collector monitors uWSGI metrics about requests, workers, memory and more. + +It collects every metric exposed from the stats server of uWSGI, either from the `stats.socket` or from the web server's TCP/IP socket. + +This collector is supported on all platforms. + +This collector supports collecting metrics from multiple instances of this integration, including remote instances. + + +### Default Behavior + +#### Auto-Detection + +This collector will auto-detect uWSGI instances deployed on the local host, running on port 1717, or exposing stats on socket `tmp/stats.socket`. + +#### Limits + +The default configuration for this integration does not impose any limits on data collection. + +#### Performance Impact + +The default configuration for this integration is not expected to impose a significant performance impact on the system. + + +## Metrics + +Metrics grouped by *scope*. + +The scope defines the instance that the metric belongs to. An instance is uniquely identified by a set of labels. + + + +### Per uWSGI instance + +These metrics refer to the entire monitored application. + +This scope has no labels. + +Metrics: + +| Metric | Dimensions | Unit | +|:------|:----------|:----| +| uwsgi.requests | a dimension per worker | requests/s | +| uwsgi.tx | a dimension per worker | KiB/s | +| uwsgi.avg_rt | a dimension per worker | milliseconds | +| uwsgi.memory_rss | a dimension per worker | MiB | +| uwsgi.memory_vsz | a dimension per worker | MiB | +| uwsgi.exceptions | exceptions | exceptions | +| uwsgi.harakiris | harakiris | harakiris | +| uwsgi.respawns | respawns | respawns | + + + +## Alerts + +There are no alerts configured by default for this integration. + + +## Setup + +### Prerequisites + +#### Enable the uWSGI Stats server + +Make sure that you uWSGI exposes it's metrics via a Stats server. + +Source: https://uwsgi-docs.readthedocs.io/en/latest/StatsServer.html + + + +### Configuration + +#### File + +The configuration file name for this integration is `python.d/uwsgi.conf`. + + +You can edit the configuration file using the `edit-config` script from the +Netdata [config directory](https://github.com/netdata/netdata/blob/master/docs/configure/nodes.md#the-netdata-config-directory). + +```bash +cd /etc/netdata 2>/dev/null || cd /opt/netdata/etc/netdata +sudo ./edit-config python.d/uwsgi.conf +``` +#### Options + +There are 2 sections: + +* Global variables +* One or more JOBS that can define multiple different instances to monitor. + +The following options can be defined globally: priority, penalty, autodetection_retry, update_every, but can also be defined per JOB to override the global values. + +Additionally, the following collapsed table contains all the options that can be configured inside a JOB definition. + +Every configuration JOB starts with a `job_name` value which will appear in the dashboard, unless a `name` parameter is specified. + + +<details><summary>Config options</summary> + +| Name | Description | Default | Required | +|:----|:-----------|:-------|:--------:| +| update_every | Sets the default data collection frequency. | 5 | False | +| priority | Controls the order of charts at the netdata dashboard. | 60000 | False | +| autodetection_retry | Sets the job re-check interval in seconds. | 0 | False | +| penalty | Indicates whether to apply penalty to update_every in case of failures. | yes | False | +| name | The JOB's name as it will appear at the dashboard (by default is the job_name) | job_name | False | +| socket | The 'path/to/uwsgistats.sock' | no | False | +| host | The host to connect to | no | False | +| port | The port to connect to | no | False | + +</details> + +#### Examples + +##### Basic (default out-of-the-box) + +A basic example configuration, one job will run at a time. Autodetect mechanism uses it by default. As all JOBs have the same name, only one can run at a time. + +<details><summary>Config</summary> + +```yaml +socket: + name : 'local' + socket : '/tmp/stats.socket' + +localhost: + name : 'local' + host : 'localhost' + port : 1717 + +localipv4: + name : 'local' + host : '127.0.0.1' + port : 1717 + +localipv6: + name : 'local' + host : '::1' + port : 1717 + +``` +</details> + +##### Multi-instance + +> **Note**: When you define multiple jobs, their names must be unique. + +Collecting metrics from local and remote instances. + + +<details><summary>Config</summary> + +```yaml +local: + name : 'local' + host : 'localhost' + port : 1717 + +remote: + name : 'remote' + host : '192.0.2.1' + port : 1717 + +``` +</details> + + + +## Troubleshooting + +### Debug Mode + +To troubleshoot issues with the `uwsgi` collector, run the `python.d.plugin` with the debug option enabled. The output +should give you clues as to why the collector isn't working. + +- Navigate to the `plugins.d` directory, usually at `/usr/libexec/netdata/plugins.d/`. If that's not the case on + your system, open `netdata.conf` and look for the `plugins` setting under `[directories]`. + + ```bash + cd /usr/libexec/netdata/plugins.d/ + ``` + +- Switch to the `netdata` user. + + ```bash + sudo -u netdata -s + ``` + +- Run the `python.d.plugin` to debug the collector: + + ```bash + ./python.d.plugin uwsgi debug trace + ``` + + diff --git a/collectors/python.d.plugin/varnish/README.md b/collectors/python.d.plugin/varnish/README.md index d30a9fb1d..194be2335 100644..120000 --- a/collectors/python.d.plugin/varnish/README.md +++ b/collectors/python.d.plugin/varnish/README.md @@ -1,88 +1 @@ -<!-- -title: "Varnish Cache monitoring with Netdata" -custom_edit_url: "https://github.com/netdata/netdata/edit/master/collectors/python.d.plugin/varnish/README.md" -sidebar_label: "Varnish Cache" -learn_status: "Published" -learn_topic_type: "References" -learn_rel_path: "Integrations/Monitor/Webapps" ---> - -# Varnish Cache collector - -Provides HTTP accelerator global, Backends (VBE) and Storages (SMF, SMA, MSE) statistics using `varnishstat` tool. - -Note that both, Varnish-Cache (free and open source) and Varnish-Plus (Commercial/Enterprise version), are supported. - -## Requirements - -- `netdata` user must be a member of the `varnish` group - -## Charts - -This module produces the following charts: - -- Connections Statistics in `connections/s` -- Client Requests in `requests/s` -- All History Hit Rate Ratio in `percent` -- Current Poll Hit Rate Ratio in `percent` -- Expired Objects in `expired/s` -- Least Recently Used Nuked Objects in `nuked/s` -- Number Of Threads In All Pools in `pools` -- Threads Statistics in `threads/s` -- Current Queue Length in `requests` -- Backend Connections Statistics in `connections/s` -- Requests To The Backend in `requests/s` -- ESI Statistics in `problems/s` -- Memory Usage in `MiB` -- Uptime in `seconds` - -For every backend (VBE): - -- Backend Response Statistics in `kilobits/s` - -For every storage (SMF, SMA, or MSE): - -- Storage Usage in `KiB` -- Storage Allocated Objects - -## Configuration - -Edit the `python.d/varnish.conf` configuration file using `edit-config` from the Netdata [config -directory](https://github.com/netdata/netdata/blob/master/docs/configure/nodes.md), which is typically at `/etc/netdata`. - -```bash -cd /etc/netdata # Replace this path with your Netdata config directory, if different -sudo ./edit-config python.d/varnish.conf -``` - -Only one parameter is supported: - -```yaml -instance_name: 'name' -``` - -The name of the `varnishd` instance to get logs from. If not specified, the host name is used. - - - - -### Troubleshooting - -To troubleshoot issues with the `varnish` module, run the `python.d.plugin` with the debug option enabled. The -output will give you the output of the data collection job or error messages on why the collector isn't working. - -First, navigate to your plugins directory, usually they are located under `/usr/libexec/netdata/plugins.d/`. If that's -not the case on your system, open `netdata.conf` and look for the setting `plugins directory`. Once you're in the -plugin's directory, switch to the `netdata` user. - -```bash -cd /usr/libexec/netdata/plugins.d/ -sudo su -s /bin/bash netdata -``` - -Now you can manually run the `varnish` module in debug mode: - -```bash -./python.d.plugin varnish debug trace -``` - +integrations/varnish.md
\ No newline at end of file diff --git a/collectors/python.d.plugin/varnish/integrations/varnish.md b/collectors/python.d.plugin/varnish/integrations/varnish.md new file mode 100644 index 000000000..142875f4b --- /dev/null +++ b/collectors/python.d.plugin/varnish/integrations/varnish.md @@ -0,0 +1,212 @@ +<!--startmeta +custom_edit_url: "https://github.com/netdata/netdata/edit/master/collectors/python.d.plugin/varnish/README.md" +meta_yaml: "https://github.com/netdata/netdata/edit/master/collectors/python.d.plugin/varnish/metadata.yaml" +sidebar_label: "Varnish" +learn_status: "Published" +learn_rel_path: "Data Collection/Web Servers and Web Proxies" +message: "DO NOT EDIT THIS FILE DIRECTLY, IT IS GENERATED BY THE COLLECTOR'S metadata.yaml FILE" +endmeta--> + +# Varnish + + +<img src="https://netdata.cloud/img/varnish.svg" width="150"/> + + +Plugin: python.d.plugin +Module: varnish + +<img src="https://img.shields.io/badge/maintained%20by-Netdata-%2300ab44" /> + +## Overview + +This collector monitors Varnish metrics about HTTP accelerator global, Backends (VBE) and Storages (SMF, SMA, MSE) statistics. + +Note that both, Varnish-Cache (free and open source) and Varnish-Plus (Commercial/Enterprise version), are supported. + + +It uses the `varnishstat` tool in order to collect the metrics. + + +This collector is supported on all platforms. + +This collector only supports collecting metrics from a single instance of this integration. + +`netdata` user must be a member of the `varnish` group. + + +### Default Behavior + +#### Auto-Detection + +By default, if the permissions are satisfied, the `varnishstat` tool will be executed on the host. + +#### Limits + +The default configuration for this integration does not impose any limits on data collection. + +#### Performance Impact + +The default configuration for this integration is not expected to impose a significant performance impact on the system. + + +## Metrics + +Metrics grouped by *scope*. + +The scope defines the instance that the metric belongs to. An instance is uniquely identified by a set of labels. + + + +### Per Varnish instance + +These metrics refer to the entire monitored application. + +This scope has no labels. + +Metrics: + +| Metric | Dimensions | Unit | +|:------|:----------|:----| +| varnish.session_connection | accepted, dropped | connections/s | +| varnish.client_requests | received | requests/s | +| varnish.all_time_hit_rate | hit, miss, hitpass | percentage | +| varnish.current_poll_hit_rate | hit, miss, hitpass | percentage | +| varnish.cached_objects_expired | objects | expired/s | +| varnish.cached_objects_nuked | objects | nuked/s | +| varnish.threads_total | None | number | +| varnish.threads_statistics | created, failed, limited | threads/s | +| varnish.threads_queue_len | in queue | requests | +| varnish.backend_connections | successful, unhealthy, reused, closed, recycled, failed | connections/s | +| varnish.backend_requests | sent | requests/s | +| varnish.esi_statistics | errors, warnings | problems/s | +| varnish.memory_usage | free, allocated | MiB | +| varnish.uptime | uptime | seconds | + +### Per Backend + + + +This scope has no labels. + +Metrics: + +| Metric | Dimensions | Unit | +|:------|:----------|:----| +| varnish.backend | header, body | kilobits/s | + +### Per Storage + + + +This scope has no labels. + +Metrics: + +| Metric | Dimensions | Unit | +|:------|:----------|:----| +| varnish.storage_usage | free, allocated | KiB | +| varnish.storage_alloc_objs | allocated | objects | + + + +## Alerts + +There are no alerts configured by default for this integration. + + +## Setup + +### Prerequisites + +#### Provide the necessary permissions + +In order for the collector to work, you need to add the `netdata` user to the `varnish` user group, so that it can execute the `varnishstat` tool: + +``` +usermod -aG varnish netdata +``` + + + +### Configuration + +#### File + +The configuration file name for this integration is `python.d/varnish.conf`. + + +You can edit the configuration file using the `edit-config` script from the +Netdata [config directory](https://github.com/netdata/netdata/blob/master/docs/configure/nodes.md#the-netdata-config-directory). + +```bash +cd /etc/netdata 2>/dev/null || cd /opt/netdata/etc/netdata +sudo ./edit-config python.d/varnish.conf +``` +#### Options + +There are 2 sections: + +* Global variables +* One or more JOBS that can define multiple different instances to monitor. + +The following options can be defined globally: priority, penalty, autodetection_retry, update_every, but can also be defined per JOB to override the global values. + +Additionally, the following collapsed table contains all the options that can be configured inside a JOB definition. + +Every configuration JOB starts with a `job_name` value which will appear in the dashboard, unless a `name` parameter is specified. + + +<details><summary>Config options</summary> + +| Name | Description | Default | Required | +|:----|:-----------|:-------|:--------:| +| instance_name | the name of the varnishd instance to get logs from. If not specified, the local host name is used. | | True | +| update_every | Sets the default data collection frequency. | 10 | False | +| priority | Controls the order of charts at the netdata dashboard. | 60000 | False | +| autodetection_retry | Sets the job re-check interval in seconds. | 0 | False | +| penalty | Indicates whether to apply penalty to update_every in case of failures. | yes | False | +| name | Job name. This value will overwrite the `job_name` value. JOBS with the same name are mutually exclusive. Only one of them will be allowed running at any time. This allows autodetection to try several alternatives and pick the one that works. | | False | + +</details> + +#### Examples + +##### Basic + +An example configuration. + +```yaml +job_name: + instance_name: '<name-of-varnishd-instance>' + +``` + + +## Troubleshooting + +### Debug Mode + +To troubleshoot issues with the `varnish` collector, run the `python.d.plugin` with the debug option enabled. The output +should give you clues as to why the collector isn't working. + +- Navigate to the `plugins.d` directory, usually at `/usr/libexec/netdata/plugins.d/`. If that's not the case on + your system, open `netdata.conf` and look for the `plugins` setting under `[directories]`. + + ```bash + cd /usr/libexec/netdata/plugins.d/ + ``` + +- Switch to the `netdata` user. + + ```bash + sudo -u netdata -s + ``` + +- Run the `python.d.plugin` to debug the collector: + + ```bash + ./python.d.plugin varnish debug trace + ``` + + diff --git a/collectors/python.d.plugin/varnish/metadata.yaml b/collectors/python.d.plugin/varnish/metadata.yaml index aa245c25f..d31c1cf6f 100644 --- a/collectors/python.d.plugin/varnish/metadata.yaml +++ b/collectors/python.d.plugin/varnish/metadata.yaml @@ -75,8 +75,8 @@ modules: enabled: true list: - name: instance_name - description: the name of the varnishd instance to get logs from. If not specified, the host name is used. - default_value: '<host name>' + description: the name of the varnishd instance to get logs from. If not specified, the local host name is used. + default_value: "" required: true - name: update_every description: Sets the default data collection frequency. diff --git a/collectors/python.d.plugin/w1sensor/README.md b/collectors/python.d.plugin/w1sensor/README.md index ca08b0400..c0fa9cd1b 100644..120000 --- a/collectors/python.d.plugin/w1sensor/README.md +++ b/collectors/python.d.plugin/w1sensor/README.md @@ -1,50 +1 @@ -<!-- -title: "1-Wire Sensors monitoring with Netdata" -custom_edit_url: "https://github.com/netdata/netdata/edit/master/collectors/python.d.plugin/w1sensor/README.md" -sidebar_label: "1-Wire sensors" -learn_status: "Published" -learn_topic_type: "References" -learn_rel_path: "Integrations/Monitor/Remotes/Devices" ---> - -# 1-Wire Sensors collector - -Monitors sensor temperature. - -On Linux these are supported by the wire, w1_gpio, and w1_therm modules. -Currently temperature sensors are supported and automatically detected. - -Charts are created dynamically based on the number of detected sensors. - -## Configuration - -Edit the `python.d/w1sensor.conf` configuration file using `edit-config` from the Netdata [config -directory](https://github.com/netdata/netdata/blob/master/docs/configure/nodes.md), which is typically at `/etc/netdata`. - -```bash -cd /etc/netdata # Replace this path with your Netdata config directory, if different -sudo ./edit-config python.d/w1sensor.conf -``` - -An example of a working configuration can be found in the default [configuration file](https://github.com/netdata/netdata/blob/master/collectors/python.d.plugin/w1sensor/w1sensor.conf) of this collector. - -### Troubleshooting - -To troubleshoot issues with the `w1sensor` module, run the `python.d.plugin` with the debug option enabled. The -output will give you the output of the data collection job or error messages on why the collector isn't working. - -First, navigate to your plugins directory, usually they are located under `/usr/libexec/netdata/plugins.d/`. If that's -not the case on your system, open `netdata.conf` and look for the setting `plugins directory`. Once you're in the -plugin's directory, switch to the `netdata` user. - -```bash -cd /usr/libexec/netdata/plugins.d/ -sudo su -s /bin/bash netdata -``` - -Now you can manually run the `w1sensor` module in debug mode: - -```bash -./python.d.plugin w1sensor debug trace -``` - +integrations/1-wire_sensors.md
\ No newline at end of file diff --git a/collectors/python.d.plugin/w1sensor/integrations/1-wire_sensors.md b/collectors/python.d.plugin/w1sensor/integrations/1-wire_sensors.md new file mode 100644 index 000000000..39987743e --- /dev/null +++ b/collectors/python.d.plugin/w1sensor/integrations/1-wire_sensors.md @@ -0,0 +1,166 @@ +<!--startmeta +custom_edit_url: "https://github.com/netdata/netdata/edit/master/collectors/python.d.plugin/w1sensor/README.md" +meta_yaml: "https://github.com/netdata/netdata/edit/master/collectors/python.d.plugin/w1sensor/metadata.yaml" +sidebar_label: "1-Wire Sensors" +learn_status: "Published" +learn_rel_path: "Data Collection/Hardware Devices and Sensors" +message: "DO NOT EDIT THIS FILE DIRECTLY, IT IS GENERATED BY THE COLLECTOR'S metadata.yaml FILE" +endmeta--> + +# 1-Wire Sensors + + +<img src="https://netdata.cloud/img/1-wire.png" width="150"/> + + +Plugin: python.d.plugin +Module: w1sensor + +<img src="https://img.shields.io/badge/maintained%20by-Netdata-%2300ab44" /> + +## Overview + +Monitor 1-Wire Sensors metrics with Netdata for optimal environmental conditions monitoring. Enhance your environmental monitoring with real-time insights and alerts. + +The collector uses the wire, w1_gpio, and w1_therm kernel modules. Currently temperature sensors are supported and automatically detected. + +This collector is only supported on the following platforms: + +- Linux + +This collector supports collecting metrics from multiple instances of this integration, including remote instances. + + +### Default Behavior + +#### Auto-Detection + +The collector will try to auto detect available 1-Wire devices. + +#### Limits + +The default configuration for this integration does not impose any limits on data collection. + +#### Performance Impact + +The default configuration for this integration is not expected to impose a significant performance impact on the system. + + +## Metrics + +Metrics grouped by *scope*. + +The scope defines the instance that the metric belongs to. An instance is uniquely identified by a set of labels. + + + +### Per 1-Wire Sensors instance + +These metrics refer to the entire monitored application. + +This scope has no labels. + +Metrics: + +| Metric | Dimensions | Unit | +|:------|:----------|:----| +| w1sensor.temp | a dimension per sensor | Celsius | + + + +## Alerts + +There are no alerts configured by default for this integration. + + +## Setup + +### Prerequisites + +#### Required Linux kernel modules + +Make sure `wire`, `w1_gpio`, and `w1_therm` kernel modules are loaded. + + +### Configuration + +#### File + +The configuration file name for this integration is `python.d/w1sensor.conf`. + + +You can edit the configuration file using the `edit-config` script from the +Netdata [config directory](https://github.com/netdata/netdata/blob/master/docs/configure/nodes.md#the-netdata-config-directory). + +```bash +cd /etc/netdata 2>/dev/null || cd /opt/netdata/etc/netdata +sudo ./edit-config python.d/w1sensor.conf +``` +#### Options + +There are 2 sections: + +* Global variables +* One or more JOBS that can define multiple different instances to monitor. + +The following options can be defined globally: priority, penalty, autodetection_retry, update_every, but can also be defined per JOB to override the global values. + +Additionally, the following collapsed table contains all the options that can be configured inside a JOB definition. + +Every configuration JOB starts with a `job_name` value which will appear in the dashboard, unless a `name` parameter is specified. + + +<details><summary>Config options</summary> + +| Name | Description | Default | Required | +|:----|:-----------|:-------|:--------:| +| update_every | Sets the default data collection frequency. | 5 | False | +| priority | Controls the order of charts at the netdata dashboard. | 60000 | False | +| autodetection_retry | Sets the job re-check interval in seconds. | 0 | False | +| penalty | Indicates whether to apply penalty to update_every in case of failures. | yes | False | +| name | Job name. This value will overwrite the `job_name` value. JOBS with the same name are mutually exclusive. Only one of them will be allowed running at any time. This allows autodetection to try several alternatives and pick the one that works. | | False | +| name_<1-Wire id> | This allows associating a human readable name with a sensor's 1-Wire identifier. | | False | + +</details> + +#### Examples + +##### Provide human readable names + +Associate two 1-Wire identifiers with human readable names. + +```yaml +sensors: + name_00000022276e: 'Machine room' + name_00000022298f: 'Rack 12' + +``` + + +## Troubleshooting + +### Debug Mode + +To troubleshoot issues with the `w1sensor` collector, run the `python.d.plugin` with the debug option enabled. The output +should give you clues as to why the collector isn't working. + +- Navigate to the `plugins.d` directory, usually at `/usr/libexec/netdata/plugins.d/`. If that's not the case on + your system, open `netdata.conf` and look for the `plugins` setting under `[directories]`. + + ```bash + cd /usr/libexec/netdata/plugins.d/ + ``` + +- Switch to the `netdata` user. + + ```bash + sudo -u netdata -s + ``` + +- Run the `python.d.plugin` to debug the collector: + + ```bash + ./python.d.plugin w1sensor debug trace + ``` + + diff --git a/collectors/python.d.plugin/zscores/README.md b/collectors/python.d.plugin/zscores/README.md index dcb685c98..159ce0787 100644..120000 --- a/collectors/python.d.plugin/zscores/README.md +++ b/collectors/python.d.plugin/zscores/README.md @@ -1,158 +1 @@ -# Basic anomaly detection using Z-scores - -By using smoothed, rolling [Z-Scores](https://en.wikipedia.org/wiki/Standard_score) for selected metrics or charts you can narrow down your focus and shorten root cause analysis. - -This collector uses the [Netdata rest api](https://github.com/netdata/netdata/blob/master/web/api/README.md) to get the `mean` and `stddev` -for each dimension on specified charts over a time range (defined by `train_secs` and `offset_secs`). For each dimension -it will calculate a Z-Score as `z = (x - mean) / stddev` (clipped at `z_clip`). Scores are then smoothed over -time (`z_smooth_n`) and, if `mode: 'per_chart'`, aggregated across dimensions to a smoothed, rolling chart level Z-Score -at each time step. - -## Charts - -Two charts are produced: - -- **Z-Score** (`zscores.z`): This chart shows the calculated Z-Score per chart (or dimension if `mode='per_dim'`). -- **Z-Score >3** (`zscores.3stddev`): This chart shows a `1` if the absolute value of the Z-Score is greater than 3 or - a `0` otherwise. - -Below is an example of the charts produced by this collector and a typical example of how they would look when things -are 'normal' on the system. Most of the zscores tend to bounce randomly around a range typically between 0 to +3 (or -3 -to +3 if `z_abs: 'false'`), a few charts might stay steady at a more constant higher value depending on your -configuration and the typical workload on your system (typically those charts that do not change that much have a -smaller range of values on which to calculate a zscore and so tend to have a higher typical zscore). - -So really its a combination of the zscores values themselves plus, perhaps more importantly, how they change when -something strange occurs on your system which can be most useful. - -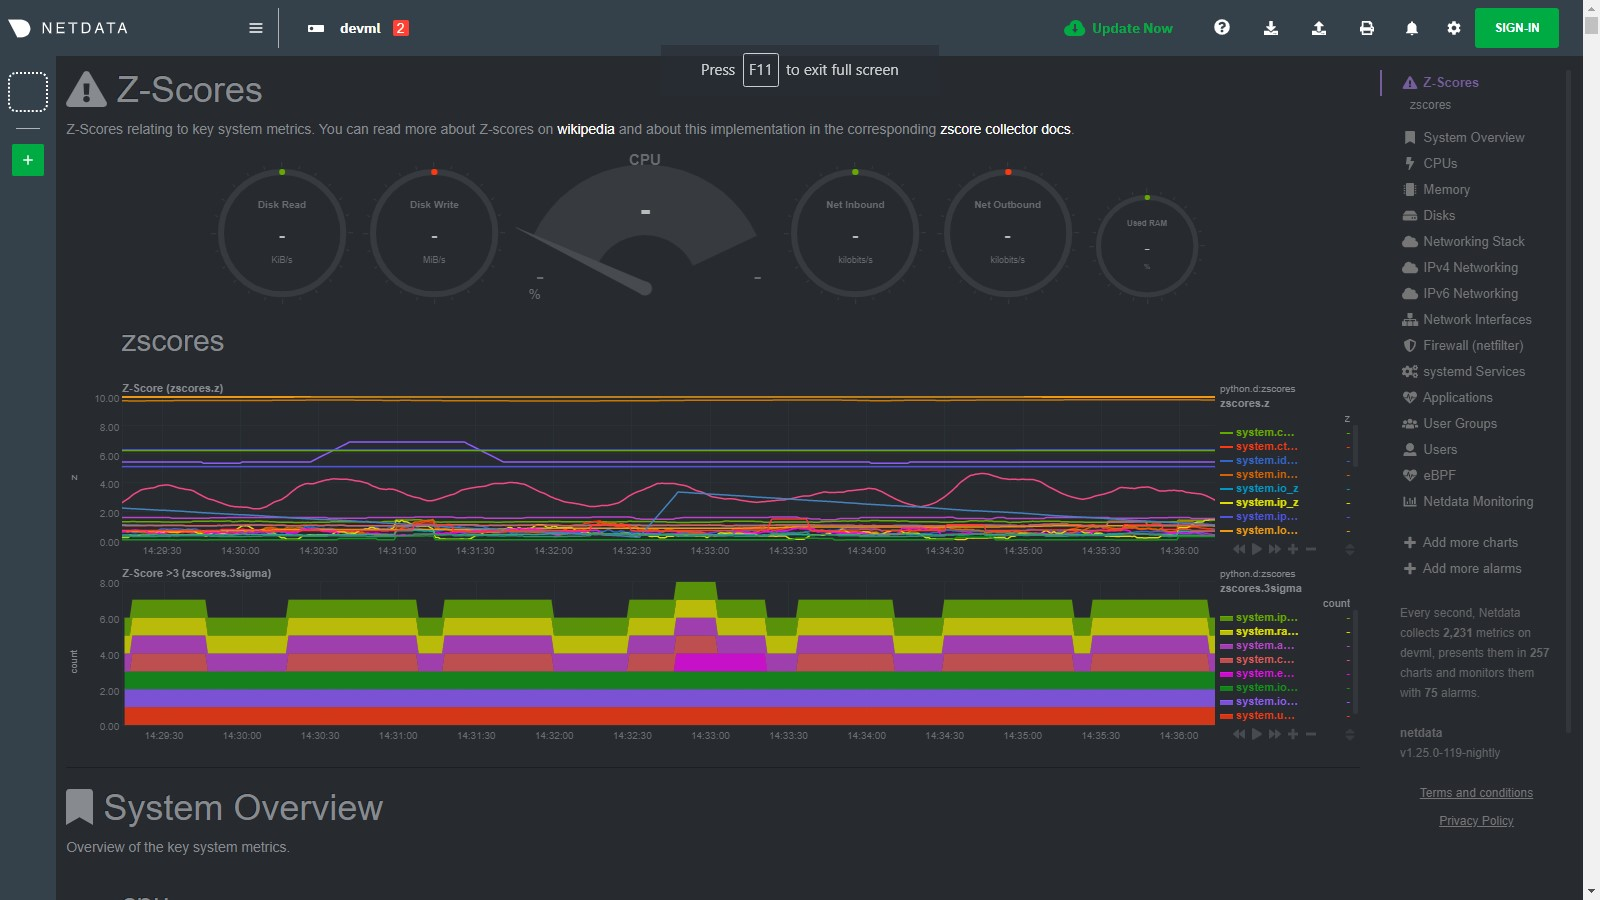 - -For example, if we go onto the system and run a command -like [`stress-ng --all 2`](https://wiki.ubuntu.com/Kernel/Reference/stress-ng) to create some stress, we see many charts -begin to have zscores that jump outside the typical range. When the absolute zscore for a chart is greater than 3 you -will see a corresponding line appear on the `zscores.3stddev` chart to make it a bit clearer what charts might be worth -looking at first (for more background information on why 3 stddev -see [here](https://en.wikipedia.org/wiki/68%E2%80%9395%E2%80%9399.7_rule#:~:text=In%20the%20empirical%20sciences%20the,99.7%25%20probability%20as%20near%20certainty.)) -. - -In the example below we basically took a sledge hammer to our system so its not surprising that lots of charts light up -after we run the stress command. In a more realistic setting you might just see a handful of charts with strange zscores -and that could be a good indication of where to look first. - -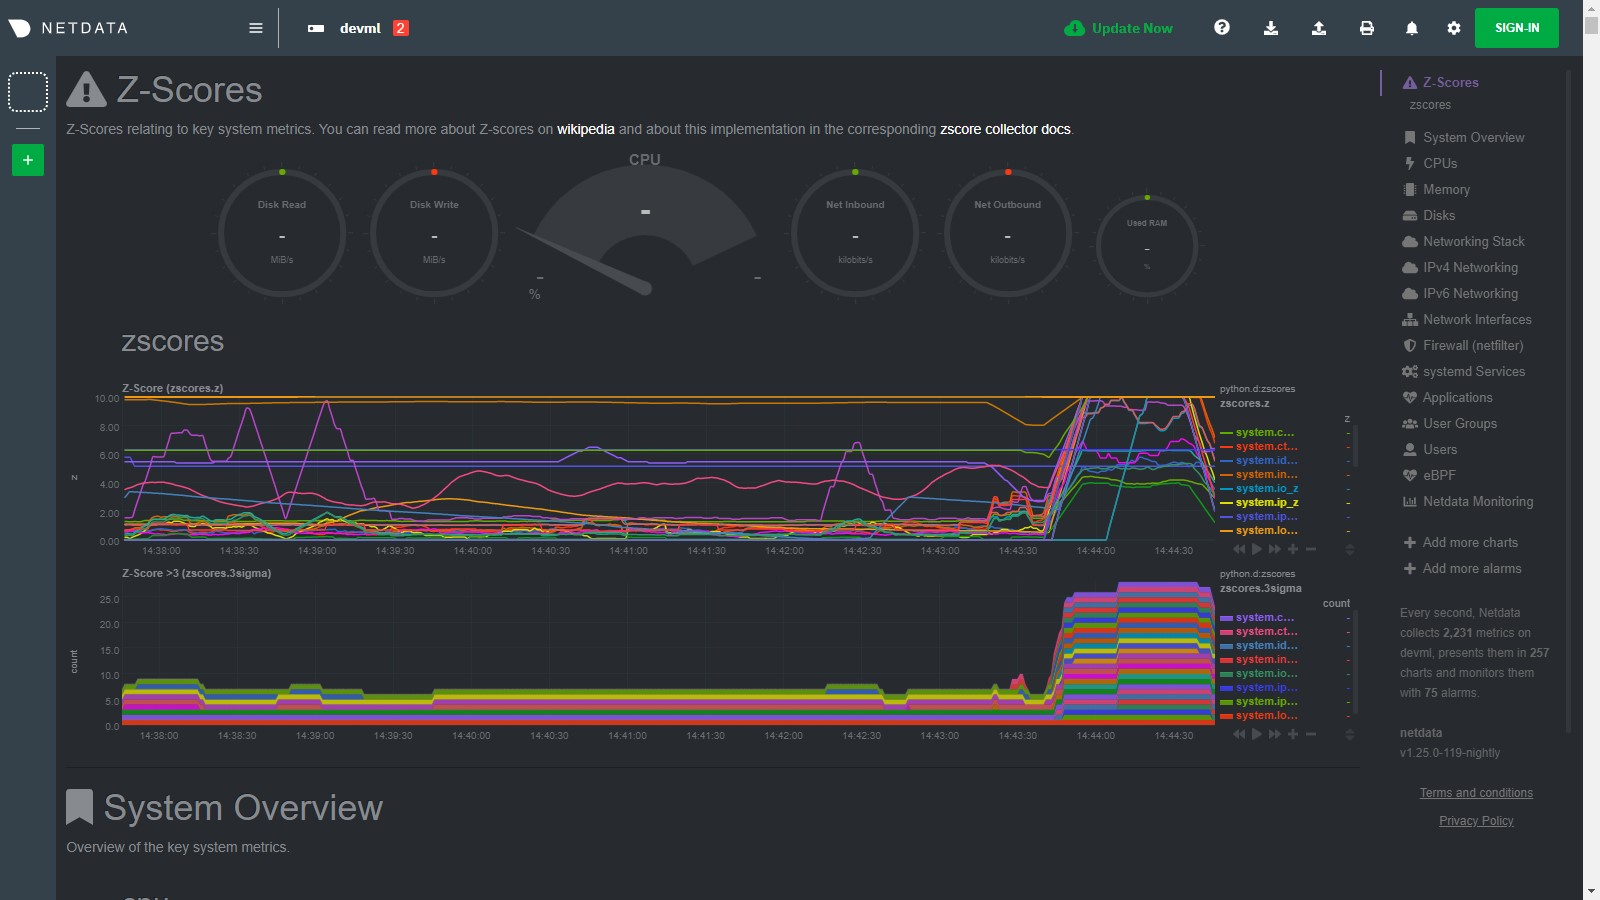 - -Then as the issue passes the zscores should settle back down into their normal range again as they are calculated in a -rolling and smoothed way (as defined by your `zscores.conf` file). - -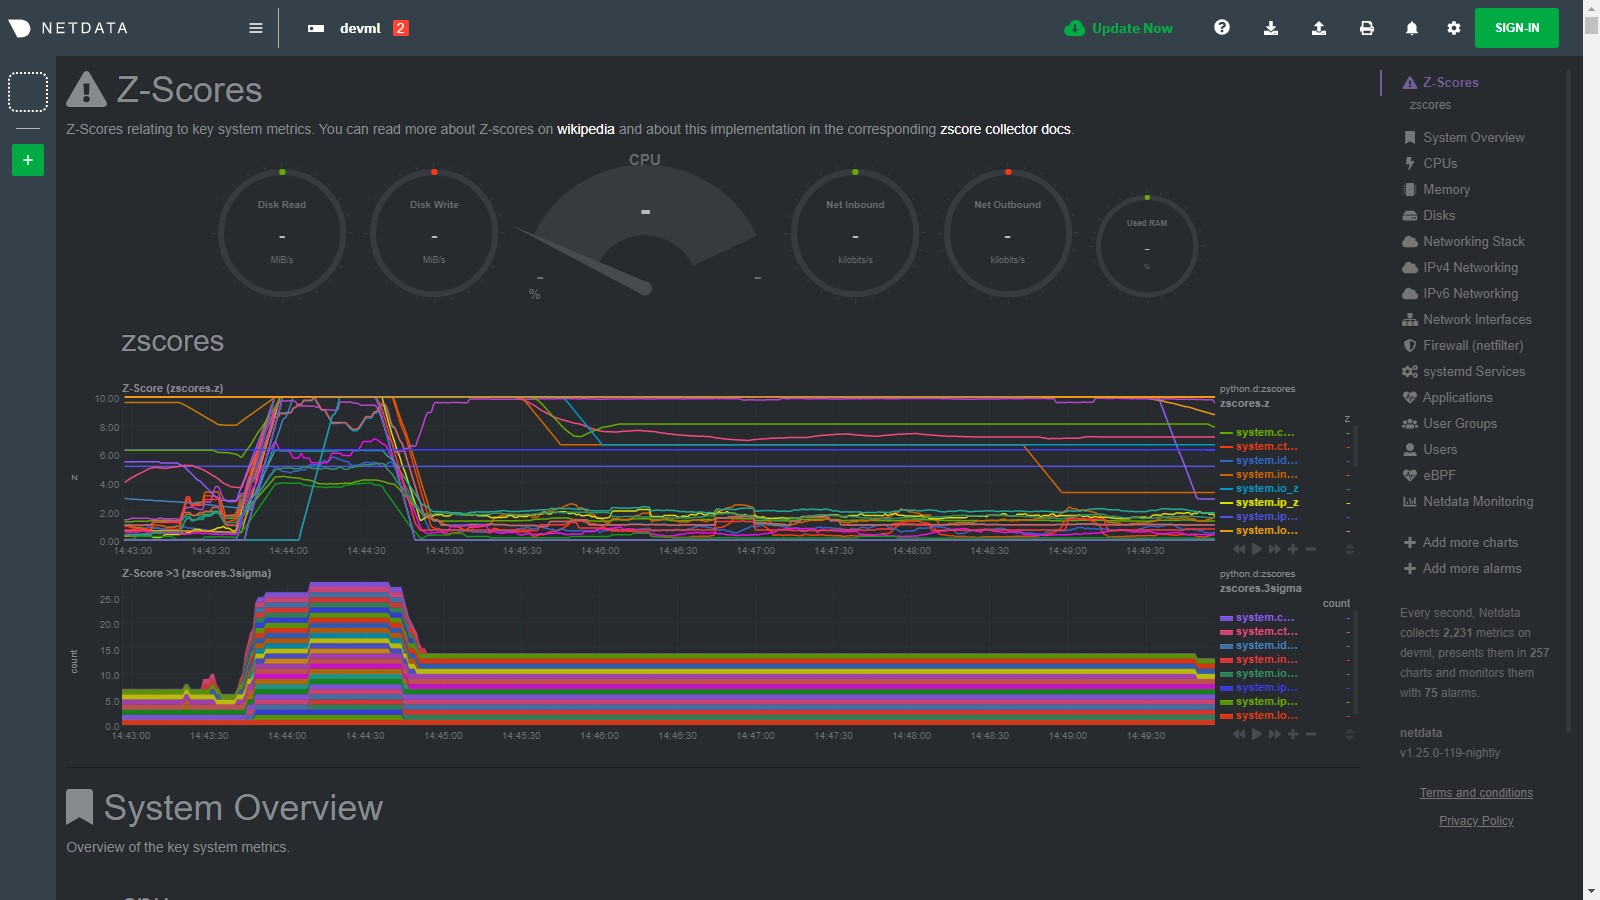 - -## Requirements - -This collector will only work with Python 3 and requires the below packages be installed. - -```bash -# become netdata user -sudo su -s /bin/bash netdata -# install required packages -pip3 install numpy pandas requests netdata-pandas==0.0.38 -``` - -## Configuration - -Install the underlying Python requirements, Enable the collector and restart Netdata. - -```bash -cd /etc/netdata/ -sudo ./edit-config python.d.conf -# Set `zscores: no` to `zscores: yes` -sudo systemctl restart netdata -``` - -The configuration for the zscores collector defines how it will behave on your system and might take some -experimentation with over time to set it optimally. Out of the box, the config comes with -some [sane defaults](https://www.netdata.cloud/blog/redefining-monitoring-netdata/) to get you started. - -If you are unsure about any of the below configuration options then it's best to just ignore all this and leave -the `zscores.conf` files alone to begin with. Then you can return to it later if you would like to tune things a bit -more once the collector is running for a while. - -Edit the `python.d/zscores.conf` configuration file using `edit-config` from the your -agent's [config directory](https://github.com/netdata/netdata/blob/master/docs/configure/nodes.md#the-netdata-config-directory), which is -usually at `/etc/netdata`. - -```bash -cd /etc/netdata # Replace this path with your Netdata config directory, if different -sudo ./edit-config python.d/zscores.conf -``` - -The default configuration should look something like this. Here you can see each parameter (with sane defaults) and some -information about each one and what it does. - -```bash -# what host to pull data from -host: '127.0.0.1:19999' -# What charts to pull data for - A regex like 'system\..*|' or 'system\..*|apps.cpu|apps.mem' etc. -charts_regex: 'system\..*' -# length of time to base calculations off for mean and stddev -train_secs: 14400 # use last 4 hours to work out the mean and stddev for the zscore -# offset preceding latest data to ignore when calculating mean and stddev -offset_secs: 300 # ignore last 5 minutes of data when calculating the mean and stddev -# recalculate the mean and stddev every n steps of the collector -train_every_n: 900 # recalculate mean and stddev every 15 minutes -# smooth the z score by averaging it over last n values -z_smooth_n: 15 # take a rolling average of the last 15 zscore values to reduce sensitivity to temporary 'spikes' -# cap absolute value of zscore (before smoothing) for better stability -z_clip: 10 # cap each zscore at 10 so as to avoid really large individual zscores swamping any rolling average -# set z_abs: 'true' to make all zscores be absolute values only. -z_abs: 'true' -# burn in period in which to initially calculate mean and stddev on every step -burn_in: 2 # on startup of the collector continually update the mean and stddev in case any gaps or initial calculations fail to return -# mode can be to get a zscore 'per_dim' or 'per_chart' -mode: 'per_chart' # 'per_chart' means individual dimension level smoothed zscores will be aggregated to one zscore per chart per time step -# per_chart_agg is how you aggregate from dimension to chart when mode='per_chart' -per_chart_agg: 'mean' # 'absmax' will take the max absolute value across all dimensions but will maintain the sign. 'mean' will just average. -``` - -## Notes - -- Python 3 is required as the [`netdata-pandas`](https://github.com/netdata/netdata-pandas) package uses python async - libraries ([asks](https://pypi.org/project/asks/) and [trio](https://pypi.org/project/trio/)) to make asynchronous - calls to the netdata rest api to get the required data for each chart when calculating the mean and stddev. -- It may take a few hours or so for the collector to 'settle' into it's typical behaviour in terms of the scores you - will see in the normal running of your system. -- The zscore you see for each chart when using `mode: 'per_chart'` as actually an aggregated zscore across all the - dimensions on the underlying chart. -- If you set `mode: 'per_dim'` then you will see a zscore for each dimension on each chart as opposed to one per chart. -- As this collector does some calculations itself in python you may want to try it out first on a test or development - system to get a sense of its performance characteristics. Most of the work in calculating the mean and stddev will be - pushed down to the underlying Netdata C libraries via the rest api. But some data wrangling and calculations are then - done using [Pandas](https://pandas.pydata.org/) and [Numpy](https://numpy.org/) within the collector itself. -- On a development n1-standard-2 (2 vCPUs, 7.5 GB memory) vm running Ubuntu 18.04 LTS and not doing any work some of the - typical performance characteristics we saw from running this collector were: - - A runtime (`netdata.runtime_zscores`) of ~50ms when doing scoring and ~500ms when recalculating the mean and - stddev. - - Typically 3%-3.5% cpu usage from scoring, jumping to ~35% for one second when recalculating the mean and stddev. - - About ~50mb of ram (`apps.mem`) being continually used by the `python.d.plugin`. -- If you activate this collector on a fresh node, it might take a little while to build up enough data to calculate a - proper zscore. So until you actually have `train_secs` of available data the mean and stddev calculated will be subject - to more noise. -### Troubleshooting - -To troubleshoot issues with the `zscores` module, run the `python.d.plugin` with the debug option enabled. The -output will give you the output of the data collection job or error messages on why the collector isn't working. - -First, navigate to your plugins directory, usually they are located under `/usr/libexec/netdata/plugins.d/`. If that's -not the case on your system, open `netdata.conf` and look for the setting `plugins directory`. Once you're in the -plugin's directory, switch to the `netdata` user. - -```bash -cd /usr/libexec/netdata/plugins.d/ -sudo su -s /bin/bash netdata -``` - -Now you can manually run the `zscores` module in debug mode: - -```bash -./python.d.plugin zscores debug trace -``` - +integrations/python.d_zscores.md
\ No newline at end of file diff --git a/collectors/python.d.plugin/zscores/integrations/python.d_zscores.md b/collectors/python.d.plugin/zscores/integrations/python.d_zscores.md new file mode 100644 index 000000000..1ebe865f0 --- /dev/null +++ b/collectors/python.d.plugin/zscores/integrations/python.d_zscores.md @@ -0,0 +1,194 @@ +<!--startmeta +custom_edit_url: "https://github.com/netdata/netdata/edit/master/collectors/python.d.plugin/zscores/README.md" +meta_yaml: "https://github.com/netdata/netdata/edit/master/collectors/python.d.plugin/zscores/metadata.yaml" +sidebar_label: "python.d zscores" +learn_status: "Published" +learn_rel_path: "Data Collection/Other" +message: "DO NOT EDIT THIS FILE DIRECTLY, IT IS GENERATED BY THE COLLECTOR'S metadata.yaml FILE" +endmeta--> + +# python.d zscores + +Plugin: python.d.plugin +Module: zscores + +<img src="https://img.shields.io/badge/maintained%20by-Netdata-%2300ab44" /> + +## Overview + +By using smoothed, rolling [Z-Scores](https://en.wikipedia.org/wiki/Standard_score) for selected metrics or charts you can narrow down your focus and shorten root cause analysis. + + +This collector uses the [Netdata rest api](https://github.com/netdata/netdata/blob/master/web/api/README.md) to get the `mean` and `stddev` +for each dimension on specified charts over a time range (defined by `train_secs` and `offset_secs`). + +For each dimension it will calculate a Z-Score as `z = (x - mean) / stddev` (clipped at `z_clip`). Scores are then smoothed over +time (`z_smooth_n`) and, if `mode: 'per_chart'`, aggregated across dimensions to a smoothed, rolling chart level Z-Score at each time step. + + +This collector is supported on all platforms. + +This collector supports collecting metrics from multiple instances of this integration, including remote instances. + + +### Default Behavior + +#### Auto-Detection + +This integration doesn't support auto-detection. + +#### Limits + +The default configuration for this integration does not impose any limits on data collection. + +#### Performance Impact + +The default configuration for this integration is not expected to impose a significant performance impact on the system. + + +## Metrics + +Metrics grouped by *scope*. + +The scope defines the instance that the metric belongs to. An instance is uniquely identified by a set of labels. + + + +### Per python.d zscores instance + +These metrics refer to the entire monitored application. + +This scope has no labels. + +Metrics: + +| Metric | Dimensions | Unit | +|:------|:----------|:----| +| zscores.z | a dimension per chart or dimension | z | +| zscores.3stddev | a dimension per chart or dimension | count | + + + +## Alerts + +There are no alerts configured by default for this integration. + + +## Setup + +### Prerequisites + +#### Python Requirements + +This collector will only work with Python 3 and requires the below packages be installed. + +```bash +# become netdata user +sudo su -s /bin/bash netdata +# install required packages +pip3 install numpy pandas requests netdata-pandas==0.0.38 +``` + + + +### Configuration + +#### File + +The configuration file name for this integration is `python.d/zscores.conf`. + + +You can edit the configuration file using the `edit-config` script from the +Netdata [config directory](https://github.com/netdata/netdata/blob/master/docs/configure/nodes.md#the-netdata-config-directory). + +```bash +cd /etc/netdata 2>/dev/null || cd /opt/netdata/etc/netdata +sudo ./edit-config python.d/zscores.conf +``` +#### Options + +There are 2 sections: + +* Global variables +* One or more JOBS that can define multiple different instances to monitor. + +The following options can be defined globally: priority, penalty, autodetection_retry, update_every, but can also be defined per JOB to override the global values. + +Additionally, the following collapsed table contains all the options that can be configured inside a JOB definition. + +Every configuration JOB starts with a `job_name` value which will appear in the dashboard, unless a `name` parameter is specified. + + +<details><summary>Config options</summary> + +| Name | Description | Default | Required | +|:----|:-----------|:-------|:--------:| +| charts_regex | what charts to pull data for - A regex like `system\..*/` or `system\..*/apps.cpu/apps.mem` etc. | system\..* | True | +| train_secs | length of time (in seconds) to base calculations off for mean and stddev. | 14400 | True | +| offset_secs | offset (in seconds) preceding latest data to ignore when calculating mean and stddev. | 300 | True | +| train_every_n | recalculate the mean and stddev every n steps of the collector. | 900 | True | +| z_smooth_n | smooth the z score (to reduce sensitivity to spikes) by averaging it over last n values. | 15 | True | +| z_clip | cap absolute value of zscore (before smoothing) for better stability. | 10 | True | +| z_abs | set z_abs: 'true' to make all zscores be absolute values only. | true | True | +| burn_in | burn in period in which to initially calculate mean and stddev on every step. | 2 | True | +| mode | mode can be to get a zscore 'per_dim' or 'per_chart'. | per_chart | True | +| per_chart_agg | per_chart_agg is how you aggregate from dimension to chart when mode='per_chart'. | mean | True | +| update_every | Sets the default data collection frequency. | 5 | False | +| priority | Controls the order of charts at the netdata dashboard. | 60000 | False | +| autodetection_retry | Sets the job re-check interval in seconds. | 0 | False | +| penalty | Indicates whether to apply penalty to update_every in case of failures. | yes | False | + +</details> + +#### Examples + +##### Default + +Default configuration. + +```yaml +local: + name: 'local' + host: '127.0.0.1:19999' + charts_regex: 'system\..*' + charts_to_exclude: 'system.uptime' + train_secs: 14400 + offset_secs: 300 + train_every_n: 900 + z_smooth_n: 15 + z_clip: 10 + z_abs: 'true' + burn_in: 2 + mode: 'per_chart' + per_chart_agg: 'mean' + +``` + + +## Troubleshooting + +### Debug Mode + +To troubleshoot issues with the `zscores` collector, run the `python.d.plugin` with the debug option enabled. The output +should give you clues as to why the collector isn't working. + +- Navigate to the `plugins.d` directory, usually at `/usr/libexec/netdata/plugins.d/`. If that's not the case on + your system, open `netdata.conf` and look for the `plugins` setting under `[directories]`. + + ```bash + cd /usr/libexec/netdata/plugins.d/ + ``` + +- Switch to the `netdata` user. + + ```bash + sudo -u netdata -s + ``` + +- Run the `python.d.plugin` to debug the collector: + + ```bash + ./python.d.plugin zscores debug trace + ``` + + |