
diff options
Diffstat (limited to 'collectors/python.d.plugin')
112 files changed, 1541 insertions, 2065 deletions
diff --git a/collectors/python.d.plugin/Makefile.am b/collectors/python.d.plugin/Makefile.am index 6ea7b21b5..ca49c1c02 100644 --- a/collectors/python.d.plugin/Makefile.am +++ b/collectors/python.d.plugin/Makefile.am @@ -65,14 +65,11 @@ include memcached/Makefile.inc include monit/Makefile.inc include nvidia_smi/Makefile.inc include nsd/Makefile.inc -include ntpd/Makefile.inc include openldap/Makefile.inc include oracledb/Makefile.inc include pandas/Makefile.inc include postfix/Makefile.inc -include proxysql/Makefile.inc include puppet/Makefile.inc -include rabbitmq/Makefile.inc include rethinkdbs/Makefile.inc include retroshare/Makefile.inc include riakkv/Makefile.inc diff --git a/collectors/python.d.plugin/README.md b/collectors/python.d.plugin/README.md index b6d658fae..569543d16 100644 --- a/collectors/python.d.plugin/README.md +++ b/collectors/python.d.plugin/README.md @@ -4,7 +4,7 @@ custom_edit_url: "https://github.com/netdata/netdata/edit/master/collectors/pyth sidebar_label: "python.d.plugin" learn_status: "Published" learn_topic_type: "Tasks" -learn_rel_path: "Developers/Collectors" +learn_rel_path: "Developers/External plugins/python.d.plugin" --> # python.d.plugin @@ -74,201 +74,4 @@ Where `[module]` is the directory name under <https://github.com/netdata/netdata ## How to write a new module -Writing new python module is simple. You just need to remember to include 5 major things: - -- **ORDER** global list -- **CHART** global dictionary -- **Service** class -- **\_get_data** method - -If you plan to submit the module in a PR, make sure and go through the [PR checklist for new modules](#pull-request-checklist-for-python-plugins) beforehand to make sure you have updated all the files you need to. - -For a quick start, you can look at the [example -plugin](https://raw.githubusercontent.com/netdata/netdata/master/collectors/python.d.plugin/example/example.chart.py). - -**Note**: If you are working 'locally' on a new collector and would like to run it in an already installed and running -Netdata (as opposed to having to install Netdata from source again with your new changes) to can copy over the relevant -file to where Netdata expects it and then either `sudo systemctl restart netdata` to have it be picked up and used by -Netdata or you can just run the updated collector in debug mode by following a process like below (this assumes you have -[installed Netdata from a GitHub fork](https://github.com/netdata/netdata/blob/master/packaging/installer/methods/manual.md) you -have made to do your development on). - -```bash -# clone your fork (done once at the start but shown here for clarity) -#git clone --branch my-example-collector https://github.com/mygithubusername/netdata.git --depth=100 --recursive -# go into your netdata source folder -cd netdata -# git pull your latest changes (assuming you built from a fork you are using to develop on) -git pull -# instead of running the installer we can just copy over the updated collector files -#sudo ./netdata-installer.sh --dont-wait -# copy over the file you have updated locally (pretending we are working on the 'example' collector) -sudo cp collectors/python.d.plugin/example/example.chart.py /usr/libexec/netdata/python.d/ -# become user netdata -sudo su -s /bin/bash netdata -# run your updated collector in debug mode to see if it works without having to reinstall netdata -/usr/libexec/netdata/plugins.d/python.d.plugin example debug trace nolock -``` - -### Global variables `ORDER` and `CHART` - -`ORDER` list should contain the order of chart ids. Example: - -```py -ORDER = ['first_chart', 'second_chart', 'third_chart'] -``` - -`CHART` dictionary is a little bit trickier. It should contain the chart definition in following format: - -```py -CHART = { - id: { - 'options': [name, title, units, family, context, charttype], - 'lines': [ - [unique_dimension_name, name, algorithm, multiplier, divisor] - ]} -``` - -All names are better explained in the [External Plugins](https://github.com/netdata/netdata/blob/master/collectors/plugins.d/README.md) section. -Parameters like `priority` and `update_every` are handled by `python.d.plugin`. - -### `Service` class - -Every module needs to implement its own `Service` class. This class should inherit from one of the framework classes: - -- `SimpleService` -- `UrlService` -- `SocketService` -- `LogService` -- `ExecutableService` - -Also it needs to invoke the parent class constructor in a specific way as well as assign global variables to class variables. - -Simple example: - -```py -from base import UrlService -class Service(UrlService): - def __init__(self, configuration=None, name=None): - UrlService.__init__(self, configuration=configuration, name=name) - self.order = ORDER - self.definitions = CHARTS -``` - -### `_get_data` collector/parser - -This method should grab raw data from `_get_raw_data`, parse it, and return a dictionary where keys are unique dimension names or `None` if no data is collected. - -Example: - -```py -def _get_data(self): - try: - raw = self._get_raw_data().split(" ") - return {'active': int(raw[2])} - except (ValueError, AttributeError): - return None -``` - -# More about framework classes - -Every framework class has some user-configurable variables which are specific to this particular class. Those variables should have default values initialized in the child class constructor. - -If module needs some additional user-configurable variable, it can be accessed from the `self.configuration` list and assigned in constructor or custom `check` method. Example: - -```py -def __init__(self, configuration=None, name=None): - UrlService.__init__(self, configuration=configuration, name=name) - try: - self.baseurl = str(self.configuration['baseurl']) - except (KeyError, TypeError): - self.baseurl = "http://localhost:5001" -``` - -Classes implement `_get_raw_data` which should be used to grab raw data. This method usually returns a list of strings. - -### `SimpleService` - -_This is last resort class, if a new module cannot be written by using other framework class this one can be used._ - -_Example: `ceph`, `sensors`_ - -It is the lowest-level class which implements most of module logic, like: - -- threading -- handling run times -- chart formatting -- logging -- chart creation and updating - -### `LogService` - -_Examples: `apache_cache`, `nginx_log`_ - -_Variable from config file_: `log_path`. - -Object created from this class reads new lines from file specified in `log_path` variable. It will check if file exists and is readable. Also `_get_raw_data` returns list of strings where each string is one line from file specified in `log_path`. - -### `ExecutableService` - -_Examples: `exim`, `postfix`_ - -_Variable from config file_: `command`. - -This allows to execute a shell command in a secure way. It will check for invalid characters in `command` variable and won't proceed if there is one of: - -- '&' -- '|' -- ';' -- '>' -- '\<' - -For additional security it uses python `subprocess.Popen` (without `shell=True` option) to execute command. Command can be specified with absolute or relative name. When using relative name, it will try to find `command` in `PATH` environment variable as well as in `/sbin` and `/usr/sbin`. - -`_get_raw_data` returns list of decoded lines returned by `command`. - -### UrlService - -_Examples: `apache`, `nginx`, `tomcat`_ - -_Multiple Endpoints (urls) Examples: [`rabbitmq`](https://github.com/netdata/netdata/blob/master/collectors/python.d.plugin/rabbitmq/README.md) (simpler). - - -_Variables from config file_: `url`, `user`, `pass`. - -If data is grabbed by accessing service via HTTP protocol, this class can be used. It can handle HTTP Basic Auth when specified with `user` and `pass` credentials. - -Please note that the config file can use different variables according to the specification of each module. - -`_get_raw_data` returns list of utf-8 decoded strings (lines). - -### SocketService - -_Examples: `dovecot`, `redis`_ - -_Variables from config file_: `unix_socket`, `host`, `port`, `request`. - -Object will try execute `request` using either `unix_socket` or TCP/IP socket with combination of `host` and `port`. This can access unix sockets with SOCK_STREAM or SOCK_DGRAM protocols and TCP/IP sockets in version 4 and 6 with SOCK_STREAM setting. - -Sockets are accessed in non-blocking mode with 15 second timeout. - -After every execution of `_get_raw_data` socket is closed, to prevent this module needs to set `_keep_alive` variable to `True` and implement custom `_check_raw_data` method. - -`_check_raw_data` should take raw data and return `True` if all data is received otherwise it should return `False`. Also it should do it in fast and efficient way. - -## Pull Request Checklist for Python Plugins - -This is a generic checklist for submitting a new Python plugin for Netdata. It is by no means comprehensive. - -At minimum, to be buildable and testable, the PR needs to include: - -- The module itself, following proper naming conventions: `collectors/python.d.plugin/<module_dir>/<module_name>.chart.py` -- A README.md file for the plugin under `collectors/python.d.plugin/<module_dir>`. -- The configuration file for the module: `collectors/python.d.plugin/<module_dir>/<module_name>.conf`. Python config files are in YAML format, and should include comments describing what options are present. The instructions are also needed in the configuration section of the README.md -- A basic configuration for the plugin in the appropriate global config file: `collectors/python.d.plugin/python.d.conf`, which is also in YAML format. Either add a line that reads `# <module_name>: yes` if the module is to be enabled by default, or one that reads `<module_name>: no` if it is to be disabled by default. -- A makefile for the plugin at `collectors/python.d.plugin/<module_dir>/Makefile.inc`. Check an existing plugin for what this should look like. -- A line in `collectors/python.d.plugin/Makefile.am` including the above-mentioned makefile. Place it with the other plugin includes (please keep the includes sorted alphabetically). -- Optionally, chart information in `web/gui/dashboard_info.js`. This generally involves specifying a name and icon for the section, and may include descriptions for the section or individual charts. -- Optionally, some default alarm configurations for your collector in `health/health.d/<module_name>.conf` and a line adding `<module_name>.conf` in `health/Makefile.am`. - - +See [develop a custom collector in Python](https://github.com/netdata/netdata/edit/master/docs/guides/python-collector.md). diff --git a/collectors/python.d.plugin/adaptec_raid/README.md b/collectors/python.d.plugin/adaptec_raid/README.md index 90ef8fa3c..41d5b62e0 100644 --- a/collectors/python.d.plugin/adaptec_raid/README.md +++ b/collectors/python.d.plugin/adaptec_raid/README.md @@ -4,10 +4,10 @@ custom_edit_url: "https://github.com/netdata/netdata/edit/master/collectors/pyth sidebar_label: "Adaptec RAID" learn_status: "Published" learn_topic_type: "References" -learn_rel_path: "References/Collectors references/Hardware" +learn_rel_path: "Integrations/Monitor/Hardware" --> -# Adaptec RAID controller monitoring with Netdata +# Adaptec RAID controller collector Collects logical and physical devices metrics using `arcconf` command-line utility. @@ -78,6 +78,26 @@ sudo ./edit-config python.d/adaptec_raid.conf 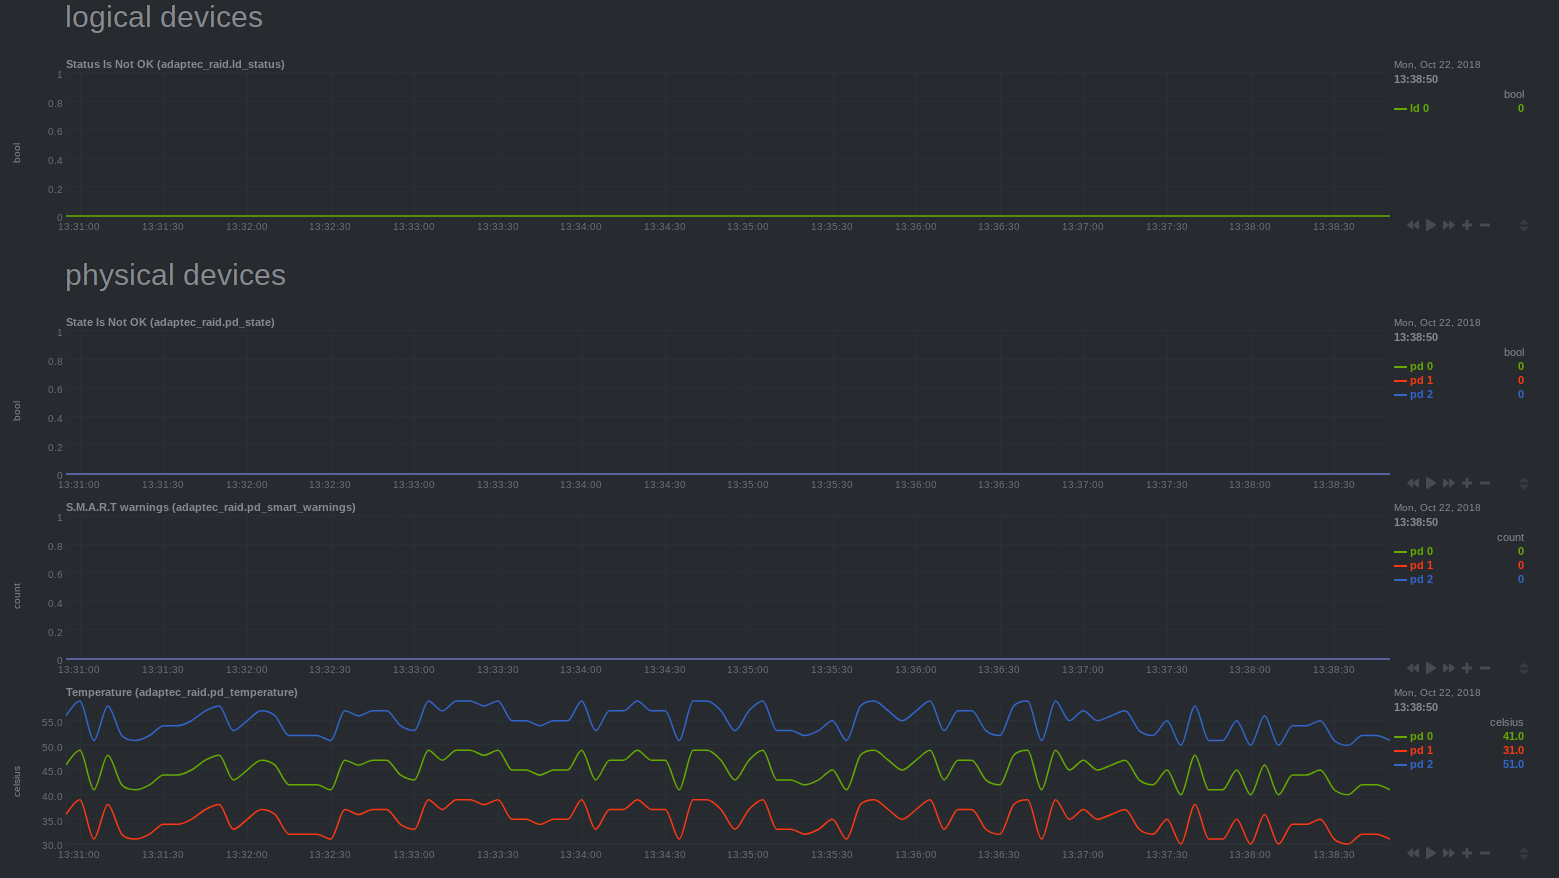 ---- + +### Troubleshooting + +To troubleshoot issues with the `adaptec_raid` module, run the `python.d.plugin` with the debug option enabled. The +output will give you the output of the data collection job or error messages on why the collector isn't working. + +First, navigate to your plugins directory, usually they are located under `/usr/libexec/netdata/plugins.d/`. If that's +not the case on your system, open `netdata.conf` and look for the setting `plugins directory`. Once you're in the +plugin's directory, switch to the `netdata` user. + +```bash +cd /usr/libexec/netdata/plugins.d/ +sudo su -s /bin/bash netdata +``` + +Now you can manually run the `adaptec_raid` module in debug mode: + +```bash +./python.d.plugin adaptec_raid debug trace +``` + diff --git a/collectors/python.d.plugin/adaptec_raid/metrics.csv b/collectors/python.d.plugin/adaptec_raid/metrics.csv new file mode 100644 index 000000000..1462940cd --- /dev/null +++ b/collectors/python.d.plugin/adaptec_raid/metrics.csv @@ -0,0 +1,5 @@ +metric,scope,dimensions,unit,description,chart_type,labels,plugin,module +adaptec_raid.ld_status,,a dimension per logical device,bool,Status of logical devices (1: Failed or Degraded),line,,python.d.plugin,adaptec_raid +adaptec_raid.pd_state,,a dimension per physical device,bool,State of physical devices (1: not Online),line,,python.d.plugin,adaptec_raid +adaptec_raid.smart_warnings,,a dimension per physical device,count,S.M.A.R.T warnings,line,,python.d.plugin,adaptec_raid +adaptec_raid.temperature,,a dimension per physical device,celsius,Temperature,line,,python.d.plugin,adaptec_raid diff --git a/collectors/python.d.plugin/alarms/README.md b/collectors/python.d.plugin/alarms/README.md index 4804bd0d7..0f956b291 100644 --- a/collectors/python.d.plugin/alarms/README.md +++ b/collectors/python.d.plugin/alarms/README.md @@ -1,14 +1,14 @@ <!-- title: "Alarms" custom_edit_url: "https://github.com/netdata/netdata/edit/master/collectors/python.d.plugin/alarms/README.md" -sidebar_label: "alarms" -learn_status: "Unpublished" -learn_topic_type: "References" +sidebar_label: "Alarms" +learn_status: "Published" +learn_rel_path: "Integrations/Monitor/Netdata" --> -# Alarms - graphing Netdata alarm states over time +# Alarms -This collector creates an 'Alarms' menu with one line plot showing alarm states over time. Alarm states are mapped to integer values according to the below default mapping. Any alarm status types not in this mapping will be ignored (Note: This mapping can be changed by editing the `status_map` in the `alarms.conf` file). If you would like to learn more about the different alarm statuses check out the docs [here](https://learn.netdata.cloud/docs/agent/health/reference#alarm-statuses). +This collector creates an 'Alarms' menu with one line plot showing alarm states over time. Alarm states are mapped to integer values according to the below default mapping. Any alarm status types not in this mapping will be ignored (Note: This mapping can be changed by editing the `status_map` in the `alarms.conf` file). If you would like to learn more about the different alarm statuses check out the docs [here](https://github.com/netdata/netdata/blob/master/health/REFERENCE.md#alarm-statuses). ``` { @@ -67,3 +67,23 @@ local: ``` It will default to pulling all alarms at each time step from the Netdata rest api at `http://127.0.0.1:19999/api/v1/alarms?all` +### Troubleshooting + +To troubleshoot issues with the `alarms` module, run the `python.d.plugin` with the debug option enabled. The +output will give you the output of the data collection job or error messages on why the collector isn't working. + +First, navigate to your plugins directory, usually they are located under `/usr/libexec/netdata/plugins.d/`. If that's +not the case on your system, open `netdata.conf` and look for the setting `plugins directory`. Once you're in the +plugin's directory, switch to the `netdata` user. + +```bash +cd /usr/libexec/netdata/plugins.d/ +sudo su -s /bin/bash netdata +``` + +Now you can manually run the `alarms` module in debug mode: + +```bash +./python.d.plugin alarms debug trace +``` + diff --git a/collectors/python.d.plugin/alarms/metrics.csv b/collectors/python.d.plugin/alarms/metrics.csv new file mode 100644 index 000000000..1c28a836c --- /dev/null +++ b/collectors/python.d.plugin/alarms/metrics.csv @@ -0,0 +1,3 @@ +metric,scope,dimensions,unit,description,chart_type,labels,plugin,module +alarms.status,,a dimension per alarm,status,Alarms ({status mapping}),line,,python.d.plugin,alarms +alarms.status,,a dimension per alarm,value,Alarm Values,line,,python.d.plugin,alarms diff --git a/collectors/python.d.plugin/am2320/README.md b/collectors/python.d.plugin/am2320/README.md index 070e8eb38..b8a6acb0b 100644 --- a/collectors/python.d.plugin/am2320/README.md +++ b/collectors/python.d.plugin/am2320/README.md @@ -4,7 +4,7 @@ custom_edit_url: "https://github.com/netdata/netdata/edit/master/collectors/pyth sidebar_label: "AM2320" learn_status: "Published" learn_topic_type: "References" -learn_rel_path: "References/Collectors references/Remotes/Devices" +learn_rel_path: "Integrations/Monitor/Remotes/Devices" --> # AM2320 sensor monitoring with netdata @@ -54,3 +54,23 @@ Software install: - restart the netdata service. - check the dashboard. +### Troubleshooting + +To troubleshoot issues with the `am2320` module, run the `python.d.plugin` with the debug option enabled. The +output will give you the output of the data collection job or error messages on why the collector isn't working. + +First, navigate to your plugins directory, usually they are located under `/usr/libexec/netdata/plugins.d/`. If that's +not the case on your system, open `netdata.conf` and look for the setting `plugins directory`. Once you're in the +plugin's directory, switch to the `netdata` user. + +```bash +cd /usr/libexec/netdata/plugins.d/ +sudo su -s /bin/bash netdata +``` + +Now you can manually run the `am2320` module in debug mode: + +```bash +./python.d.plugin am2320 debug trace +``` + diff --git a/collectors/python.d.plugin/am2320/metrics.csv b/collectors/python.d.plugin/am2320/metrics.csv new file mode 100644 index 000000000..0f3b79f2f --- /dev/null +++ b/collectors/python.d.plugin/am2320/metrics.csv @@ -0,0 +1,3 @@ +metric,scope,dimensions,unit,description,chart_type,labels,plugin,module +am2320.temperature,,temperature,celsius,Temperature,line,,python.d.plugin,am2320 +am2320.humidity,,humidity,percentage,Relative Humidity,line,,python.d.plugin,am2320 diff --git a/collectors/python.d.plugin/anomalies/README.md b/collectors/python.d.plugin/anomalies/README.md index 7c59275f9..80f505375 100644 --- a/collectors/python.d.plugin/anomalies/README.md +++ b/collectors/python.d.plugin/anomalies/README.md @@ -4,14 +4,13 @@ description: "Use ML-driven anomaly detection to narrow your focus to only affec custom_edit_url: "https://github.com/netdata/netdata/edit/master/collectors/python.d.plugin/anomalies/README.md" sidebar_url: "Anomalies" sidebar_label: "anomalies" -learn_status: "Unpublished" -learn_topic_type: "References" -learn_rel_path: "References/Collectors references/Misc" +learn_status: "Published" +learn_rel_path: "Integrations/Monitor/Anything" --> # Anomaly detection with Netdata -**Note**: Check out the [Netdata Anomaly Advisor](https://github.com/netdata/netdata/blob/master/docs/cloud/insights/anomaly-advisor.mdx) for a more native anomaly detection experience within Netdata. +**Note**: Check out the [Netdata Anomaly Advisor](https://github.com/netdata/netdata/blob/master/docs/cloud/insights/anomaly-advisor.md) for a more native anomaly detection experience within Netdata. This collector uses the Python [PyOD](https://pyod.readthedocs.io/en/latest/index.html) library to perform unsupervised [anomaly detection](https://en.wikipedia.org/wiki/Anomaly_detection) on your Netdata charts and/or dimensions. @@ -84,7 +83,7 @@ sudo ./edit-config python.d/anomalies.conf The default configuration should look something like this. Here you can see each parameter (with sane defaults) and some information about each one and what it does. ```conf -# ---------------------------------------------------------------------- +# - # JOBS (data collection sources) # Pull data from local Netdata node. diff --git a/collectors/python.d.plugin/anomalies/anomalies.chart.py b/collectors/python.d.plugin/anomalies/anomalies.chart.py index 8ca3df682..24e84cc15 100644 --- a/collectors/python.d.plugin/anomalies/anomalies.chart.py +++ b/collectors/python.d.plugin/anomalies/anomalies.chart.py @@ -58,8 +58,7 @@ class Service(SimpleService): self.collected_dims = {'probability': set(), 'anomaly': set()} def check(self): - python_version = float('{}.{}'.format(sys.version_info[0], sys.version_info[1])) - if python_version < 3.6: + if not (sys.version_info[0] >= 3 and sys.version_info[1] >= 6): self.error("anomalies collector only works with Python>=3.6") if len(self.host_charts_dict[self.host]) > 0: _ = get_allmetrics_async(host_charts_dict=self.host_charts_dict, protocol=self.protocol, user=self.username, pwd=self.password) diff --git a/collectors/python.d.plugin/anomalies/metrics.csv b/collectors/python.d.plugin/anomalies/metrics.csv new file mode 100644 index 000000000..847d9d1d9 --- /dev/null +++ b/collectors/python.d.plugin/anomalies/metrics.csv @@ -0,0 +1,3 @@ +metric,scope,dimensions,unit,description,chart_type,labels,plugin,module +anomalies.probability,,a dimension per probability,probability,Anomaly Probability,line,,python.d.plugin,anomalies +anomalies.anomaly,,a dimension per anomaly,count,Anomaly,stacked,,python.d.plugin,anomalies diff --git a/collectors/python.d.plugin/beanstalk/README.md b/collectors/python.d.plugin/beanstalk/README.md index 7e7f30de9..c86ca354a 100644 --- a/collectors/python.d.plugin/beanstalk/README.md +++ b/collectors/python.d.plugin/beanstalk/README.md @@ -4,10 +4,10 @@ custom_edit_url: "https://github.com/netdata/netdata/edit/master/collectors/pyth sidebar_label: "Beanstalk" learn_status: "Published" learn_topic_type: "References" -learn_rel_path: "References/Collectors references/Message brokers" +learn_rel_path: "Integrations/Monitor/Message brokers" --> -# Beanstalk monitoring with Netdata +# Beanstalk collector Provides server and tube-level statistics. @@ -131,6 +131,26 @@ port : 11300 If no configuration is given, module will attempt to connect to beanstalkd on `127.0.0.1:11300` address ---- + +### Troubleshooting + +To troubleshoot issues with the `beanstalk` module, run the `python.d.plugin` with the debug option enabled. The +output will give you the output of the data collection job or error messages on why the collector isn't working. + +First, navigate to your plugins directory, usually they are located under `/usr/libexec/netdata/plugins.d/`. If that's +not the case on your system, open `netdata.conf` and look for the setting `plugins directory`. Once you're in the +plugin's directory, switch to the `netdata` user. + +```bash +cd /usr/libexec/netdata/plugins.d/ +sudo su -s /bin/bash netdata +``` + +Now you can manually run the `beanstalk` module in debug mode: + +```bash +./python.d.plugin beanstalk debug trace +``` + diff --git a/collectors/python.d.plugin/beanstalk/metrics.csv b/collectors/python.d.plugin/beanstalk/metrics.csv new file mode 100644 index 000000000..fe0219d1a --- /dev/null +++ b/collectors/python.d.plugin/beanstalk/metrics.csv @@ -0,0 +1,15 @@ +metric,scope,dimensions,unit,description,chart_type,labels,plugin,module +beanstalk.cpu_usage,,"user, system",cpu time,Cpu Usage,area,,python.d.plugin,beanstalk +beanstalk.jobs_rate,,"total, timeouts",jobs/s,Jobs Rate,line,,python.d.plugin,beanstalk +beanstalk.connections_rate,,connections,connections/s,Connections Rate,area,,python.d.plugin,beanstalk +beanstalk.commands_rate,,"put, peek, peek-ready, peek-delayed, peek-buried, reserve, use, watch, ignore, delete, bury, kick, stats, stats-job, stats-tube, list-tubes, list-tube-used, list-tubes-watched, pause-tube",commands/s,Commands Rate,stacked,,python.d.plugin,beanstalk +beanstalk.connections_rate,,tubes,tubes,Current Tubes,area,,python.d.plugin,beanstalk +beanstalk.current_jobs,,"urgent, ready, reserved, delayed, buried",jobs,Current Jobs,stacked,,python.d.plugin,beanstalk +beanstalk.current_connections,,"written, producers, workers, waiting",connections,Current Connections,line,,python.d.plugin,beanstalk +beanstalk.binlog,,"written, migrated",records/s,Binlog,line,,python.d.plugin,beanstalk +beanstalk.uptime,,uptime,seconds,seconds,line,,python.d.plugin,beanstalk +beanstalk.jobs_rate,tube,jobs,jobs/s,Jobs Rate,area,,python.d.plugin,beanstalk +beanstalk.jobs,tube,"urgent, ready, reserved, delayed, buried",jobs,Jobs,stacked,,python.d.plugin,beanstalk +beanstalk.connections,tube,"using, waiting, watching",connections,Connections,stacked,,python.d.plugin,beanstalk +beanstalk.commands,tube,"deletes, pauses",commands/s,Commands,stacked,,python.d.plugin,beanstalk +beanstalk.pause,tube,"since, left",seconds,Pause,stacked,,python.d.plugin,beanstalk diff --git a/collectors/python.d.plugin/bind_rndc/README.md b/collectors/python.d.plugin/bind_rndc/README.md index e87001884..aa173f385 100644 --- a/collectors/python.d.plugin/bind_rndc/README.md +++ b/collectors/python.d.plugin/bind_rndc/README.md @@ -4,10 +4,10 @@ custom_edit_url: "https://github.com/netdata/netdata/edit/master/collectors/pyth sidebar_label: "ISC Bind" learn_status: "Published" learn_topic_type: "References" -learn_rel_path: "References/Collectors references/Webapps" +learn_rel_path: "Integrations/Monitor/Webapps" --> -# ISC Bind monitoring with Netdata +# ISC Bind collector Collects Name server summary performance statistics using `rndc` tool. @@ -77,6 +77,26 @@ local: If no configuration is given, module will attempt to read named.stats file at `/var/log/bind/named.stats` ---- + +### Troubleshooting + +To troubleshoot issues with the `bind_rndc` module, run the `python.d.plugin` with the debug option enabled. The +output will give you the output of the data collection job or error messages on why the collector isn't working. + +First, navigate to your plugins directory, usually they are located under `/usr/libexec/netdata/plugins.d/`. If that's +not the case on your system, open `netdata.conf` and look for the setting `plugins directory`. Once you're in the +plugin's directory, switch to the `netdata` user. + +```bash +cd /usr/libexec/netdata/plugins.d/ +sudo su -s /bin/bash netdata +``` + +Now you can manually run the `bind_rndc` module in debug mode: + +```bash +./python.d.plugin bind_rndc debug trace +``` + diff --git a/collectors/python.d.plugin/bind_rndc/metrics.csv b/collectors/python.d.plugin/bind_rndc/metrics.csv new file mode 100644 index 000000000..3b0733099 --- /dev/null +++ b/collectors/python.d.plugin/bind_rndc/metrics.csv @@ -0,0 +1,5 @@ +metric,scope,dimensions,unit,description,chart_type,labels,plugin,module +bind_rndc.name_server_statistics,,"requests, rejected_queries, success, failure, responses, duplicate, recursion, nxrrset, nxdomain, non_auth_answer, auth_answer, dropped_queries",stats,Name Server Statistics,line,,python.d.plugin,bind_rndc +bind_rndc.incoming_queries,,a dimension per incoming query type,queries,Incoming queries,line,,python.d.plugin,bind_rndc +bind_rndc.outgoing_queries,,a dimension per outgoing query type,queries,Outgoing queries,line,,python.d.plugin,bind_rndc +bind_rndc.stats_size,,stats_size,MiB,Named Stats File Size,line,,python.d.plugin,bind_rndc diff --git a/collectors/python.d.plugin/boinc/README.md b/collectors/python.d.plugin/boinc/README.md index 149d37ca1..ea4397754 100644 --- a/collectors/python.d.plugin/boinc/README.md +++ b/collectors/python.d.plugin/boinc/README.md @@ -4,10 +4,10 @@ custom_edit_url: "https://github.com/netdata/netdata/edit/master/collectors/pyth sidebar_label: "BOINC" learn_status: "Published" learn_topic_type: "References" -learn_rel_path: "References/Collectors references/Distributed computing" +learn_rel_path: "Integrations/Monitor/Distributed computing" --> -# BOINC monitoring with Netdata +# BOINC collector Monitors task counts for the Berkeley Open Infrastructure Networking Computing (BOINC) distributed computing client using the same RPC interface that the BOINC monitoring GUI does. @@ -39,6 +39,26 @@ remote: password: some-password ``` ---- + +### Troubleshooting + +To troubleshoot issues with the `boinc` module, run the `python.d.plugin` with the debug option enabled. The +output will give you the output of the data collection job or error messages on why the collector isn't working. + +First, navigate to your plugins directory, usually they are located under `/usr/libexec/netdata/plugins.d/`. If that's +not the case on your system, open `netdata.conf` and look for the setting `plugins directory`. Once you're in the +plugin's directory, switch to the `netdata` user. + +```bash +cd /usr/libexec/netdata/plugins.d/ +sudo su -s /bin/bash netdata +``` + +Now you can manually run the `boinc` module in debug mode: + +```bash +./python.d.plugin boinc debug trace +``` + diff --git a/collectors/python.d.plugin/boinc/metrics.csv b/collectors/python.d.plugin/boinc/metrics.csv new file mode 100644 index 000000000..98c6e8660 --- /dev/null +++ b/collectors/python.d.plugin/boinc/metrics.csv @@ -0,0 +1,5 @@ +metric,scope,dimensions,unit,description,chart_type,labels,plugin,module +boinc.tasks,,"Total, Active",tasks,Overall Tasks,line,,python.d.plugin,boinc +boinc.states,,"New, Downloading, Ready to Run, Compute Errors, Uploading, Uploaded, Aborted, Failed Uploads",tasks,Tasks per State,line,,python.d.plugin,boinc +boinc.sched,,"Uninitialized, Preempted, Scheduled",tasks,Tasks per Scheduler State,line,,python.d.plugin,boinc +boinc.process,,"Uninitialized, Executing, Suspended, Aborted, Quit, Copy Pending",tasks,Tasks per Process State,line,,python.d.plugin,boinc diff --git a/collectors/python.d.plugin/ceph/README.md b/collectors/python.d.plugin/ceph/README.md index e7d0f51e2..555491ad7 100644 --- a/collectors/python.d.plugin/ceph/README.md +++ b/collectors/python.d.plugin/ceph/README.md @@ -4,10 +4,10 @@ custom_edit_url: "https://github.com/netdata/netdata/edit/master/collectors/pyth sidebar_label: "CEPH" learn_status: "Published" learn_topic_type: "References" -learn_rel_path: "References/Collectors references/Storage" +learn_rel_path: "Integrations/Monitor/Storage" --> -# CEPH monitoring with Netdata +# CEPH collector Monitors the ceph cluster usage and consumption data of a server, and produces: @@ -46,6 +46,26 @@ local: keyring_file: '/etc/ceph/ceph.client.admin.keyring' ``` ---- + +### Troubleshooting + +To troubleshoot issues with the `ceph` module, run the `python.d.plugin` with the debug option enabled. The +output will give you the output of the data collection job or error messages on why the collector isn't working. + +First, navigate to your plugins directory, usually they are located under `/usr/libexec/netdata/plugins.d/`. If that's +not the case on your system, open `netdata.conf` and look for the setting `plugins directory`. Once you're in the +plugin's directory, switch to the `netdata` user. + +```bash +cd /usr/libexec/netdata/plugins.d/ +sudo su -s /bin/bash netdata +``` + +Now you can manually run the `ceph` module in debug mode: + +```bash +./python.d.plugin ceph debug trace +``` + diff --git a/collectors/python.d.plugin/ceph/ceph.chart.py b/collectors/python.d.plugin/ceph/ceph.chart.py index 494eef45d..4bcbe1979 100644 --- a/collectors/python.d.plugin/ceph/ceph.chart.py +++ b/collectors/python.d.plugin/ceph/ceph.chart.py @@ -331,7 +331,7 @@ class Service(SimpleService): return json.loads(self.cluster.mon_command(json.dumps({ 'prefix': 'df', 'format': 'json' - }), '')[1].decode('utf-8')) + }), b'')[1].decode('utf-8')) def _get_osd_df(self): """ @@ -341,7 +341,7 @@ class Service(SimpleService): return json.loads(self.cluster.mon_command(json.dumps({ 'prefix': 'osd df', 'format': 'json' - }), '')[1].decode('utf-8').replace('-nan', '"-nan"')) + }), b'')[1].decode('utf-8').replace('-nan', '"-nan"')) def _get_osd_perf(self): """ @@ -351,7 +351,7 @@ class Service(SimpleService): return json.loads(self.cluster.mon_command(json.dumps({ 'prefix': 'osd perf', 'format': 'json' - }), '')[1].decode('utf-8')) + }), b'')[1].decode('utf-8')) def _get_osd_pool_stats(self): """ @@ -363,7 +363,7 @@ class Service(SimpleService): return json.loads(self.cluster.mon_command(json.dumps({ 'prefix': 'osd pool stats', 'format': 'json' - }), '')[1].decode('utf-8')) + }), b'')[1].decode('utf-8')) def get_osd_perf_infos(osd_perf): diff --git a/collectors/python.d.plugin/ceph/metrics.csv b/collectors/python.d.plugin/ceph/metrics.csv new file mode 100644 index 000000000..e64f2cf53 --- /dev/null +++ b/collectors/python.d.plugin/ceph/metrics.csv @@ -0,0 +1,16 @@ +metric,scope,dimensions,unit,description,chart_type,labels,plugin,module +ceph.general_usage,,"avail, used",KiB,Ceph General Space,stacked,,python.d.plugin,ceph +ceph.general_objects,,cluster,objects,Ceph General Objects,area,,python.d.plugin,ceph +ceph.general_bytes,,"read, write",KiB/s,Ceph General Read/Write Data/s,area,,python.d.plugin,ceph +ceph.general_operations,,"read, write",operations,Ceph General Read/Write Operations/s,area,,python.d.plugin,ceph +ceph.general_latency,,"apply, commit",milliseconds,Ceph General Apply/Commit latency,area,,python.d.plugin,ceph +ceph.pool_usage,,a dimension per Ceph Pool,KiB,Ceph Pools,line,,python.d.plugin,ceph +ceph.pool_objects,,a dimension per Ceph Pool,objects,Ceph Pools,line,,python.d.plugin,ceph +ceph.pool_read_bytes,,a dimension per Ceph Pool,KiB/s,Ceph Read Pool Data/s,area,,python.d.plugin,ceph +ceph.pool_write_bytes,,a dimension per Ceph Pool,KiB/s,Ceph Write Pool Data/s,area,,python.d.plugin,ceph +ceph.pool_read_operations,,a dimension per Ceph Pool,operations,Ceph Read Pool Operations/s,area,,python.d.plugin,ceph +ceph.pool_write_operations,,a dimension per Ceph Pool,operations,Ceph Write Pool Operations/s,area,,python.d.plugin,ceph +ceph.osd_usage,,a dimension per Ceph OSD,KiB,Ceph OSDs,line,,python.d.plugin,ceph +ceph.osd_size,,a dimension per Ceph OSD,KiB,Ceph OSDs size,line,,python.d.plugin,ceph +ceph.apply_latency,,a dimension per Ceph OSD,milliseconds,Ceph OSDs apply latency,line,,python.d.plugin,ceph +ceph.commit_latency,,a dimension per Ceph OSD,milliseconds,Ceph OSDs commit latency,line,,python.d.plugin,ceph diff --git a/collectors/python.d.plugin/changefinder/README.md b/collectors/python.d.plugin/changefinder/README.md index 326a69dd5..0e9bab887 100644 --- a/collectors/python.d.plugin/changefinder/README.md +++ b/collectors/python.d.plugin/changefinder/README.md @@ -5,10 +5,10 @@ custom_edit_url: "https://github.com/netdata/netdata/edit/master/collectors/pyth sidebar_label: "changefinder" learn_status: "Published" learn_topic_type: "References" -learn_rel_path: "References/Collectors references/QoS" +learn_rel_path: "Integrations/Monitor/QoS" --> -# Online changepoint detection with Netdata +# Online change point detection with Netdata This collector uses the Python [changefinder](https://github.com/shunsukeaihara/changefinder) library to perform [online](https://en.wikipedia.org/wiki/Online_machine_learning) [changepoint detection](https://en.wikipedia.org/wiki/Change_detection) @@ -108,7 +108,7 @@ The default configuration should look something like this. Here you can see each information about each one and what it does. ```yaml -# ---------------------------------------------------------------------- +# - # JOBS (data collection sources) # Pull data from local Netdata node. @@ -219,3 +219,23 @@ sudo su -s /bin/bash netdata - Novelty and outlier detection in the [scikit-learn documentation](https://scikit-learn.org/stable/modules/outlier_detection.html). +### Troubleshooting + +To troubleshoot issues with the `changefinder` module, run the `python.d.plugin` with the debug option enabled. The +output will give you the output of the data collection job or error messages on why the collector isn't working. + +First, navigate to your plugins directory, usually they are located under `/usr/libexec/netdata/plugins.d/`. If that's +not the case on your system, open `netdata.conf` and look for the setting `plugins directory`. Once you're in the +plugin's directory, switch to the `netdata` user. + +```bash +cd /usr/libexec/netdata/plugins.d/ +sudo su -s /bin/bash netdata +``` + +Now you can manually run the `changefinder` module in debug mode: + +```bash +./python.d.plugin changefinder debug trace +``` + diff --git a/collectors/python.d.plugin/changefinder/changefinder.chart.py b/collectors/python.d.plugin/changefinder/changefinder.chart.py index c18e5600a..2a69cd9f5 100644 --- a/collectors/python.d.plugin/changefinder/changefinder.chart.py +++ b/collectors/python.d.plugin/changefinder/changefinder.chart.py @@ -22,11 +22,11 @@ ORDER = [ CHARTS = { 'scores': { - 'options': [None, 'ChangeFinder', 'score', 'Scores', 'scores', 'line'], + 'options': [None, 'ChangeFinder', 'score', 'Scores', 'changefinder.scores', 'line'], 'lines': [] }, 'flags': { - 'options': [None, 'ChangeFinder', 'flag', 'Flags', 'flags', 'stacked'], + 'options': [None, 'ChangeFinder', 'flag', 'Flags', 'changefinder.flags', 'stacked'], 'lines': [] } } diff --git a/collectors/python.d.plugin/changefinder/metrics.csv b/collectors/python.d.plugin/changefinder/metrics.csv new file mode 100644 index 000000000..ecad582ba --- /dev/null +++ b/collectors/python.d.plugin/changefinder/metrics.csv @@ -0,0 +1,3 @@ +metric,scope,dimensions,unit,description,chart_type,labels,plugin,module +changefinder.scores,,a dimension per chart,score,ChangeFinder,line,,python.d.plugin,changefinder +changefinder.flags,,a dimension per chart,flag,ChangeFinder,stacked,,python.d.plugin,changefinder diff --git a/collectors/python.d.plugin/dovecot/README.md b/collectors/python.d.plugin/dovecot/README.md index 358f1ba81..2397b7478 100644 --- a/collectors/python.d.plugin/dovecot/README.md +++ b/collectors/python.d.plugin/dovecot/README.md @@ -4,10 +4,10 @@ custom_edit_url: "https://github.com/netdata/netdata/edit/master/collectors/pyth sidebar_label: "Dovecot" learn_status: "Published" learn_topic_type: "References" -learn_rel_path: "References/Collectors references/Webapps" +learn_rel_path: "Integrations/Monitor/Webapps" --> -# Dovecot monitoring with Netdata +# Dovecot collector Provides statistics information from Dovecot server. @@ -103,6 +103,26 @@ localsocket: If no configuration is given, module will attempt to connect to dovecot using unix socket localized in `/var/run/dovecot/stats` ---- + +### Troubleshooting + +To troubleshoot issues with the `dovecot` module, run the `python.d.plugin` with the debug option enabled. The +output will give you the output of the data collection job or error messages on why the collector isn't working. + +First, navigate to your plugins directory, usually they are located under `/usr/libexec/netdata/plugins.d/`. If that's +not the case on your system, open `netdata.conf` and look for the setting `plugins directory`. Once you're in the +plugin's directory, switch to the `netdata` user. + +```bash +cd /usr/libexec/netdata/plugins.d/ +sudo su -s /bin/bash netdata +``` + +Now you can manually run the `dovecot` module in debug mode: + +```bash +./python.d.plugin dovecot debug trace +``` + diff --git a/collectors/python.d.plugin/dovecot/metrics.csv b/collectors/python.d.plugin/dovecot/metrics.csv new file mode 100644 index 000000000..dbffd0b3e --- /dev/null +++ b/collectors/python.d.plugin/dovecot/metrics.csv @@ -0,0 +1,13 @@ +metric,scope,dimensions,unit,description,chart_type,labels,plugin,module +dovecot.sessions,,active sessions,number,Dovecot Active Sessions,line,,python.d.plugin,dovecot +dovecot.logins,,logins,number,Dovecot Logins,line,,python.d.plugin,dovecot +dovecot.commands,,commands,commands,Dovecot Commands,line,,python.d.plugin,dovecot +dovecot.faults,,"minor, major",faults,Dovecot Page Faults,line,,python.d.plugin,dovecot +dovecot.context_switches,,"voluntary, involuntary",switches,Dovecot Context Switches,line,,python.d.plugin,dovecot +dovecot.io,,"read, write",KiB/s,Dovecot Disk I/O,area,,python.d.plugin,dovecot +dovecot.net,,"read, write",kilobits/s,Dovecot Network Bandwidth,area,,python.d.plugin,dovecot +dovecot.syscalls,,"read, write",syscalls/s,Dovecot Number of SysCalls,line,,python.d.plugin,dovecot +dovecot.lookup,,"path, attr",number/s,Dovecot Lookups,stacked,,python.d.plugin,dovecot +dovecot.cache,,hits,hits/s,Dovecot Cache Hits,line,,python.d.plugin,dovecot +dovecot.auth,,"ok, failed",attempts,Dovecot Authentications,stacked,,python.d.plugin,dovecot +dovecot.auth_cache,,"hit, miss",number,Dovecot Authentication Cache,stacked,,python.d.plugin,dovecot diff --git a/collectors/python.d.plugin/example/README.md b/collectors/python.d.plugin/example/README.md index 7e6d2b913..63ec7a298 100644 --- a/collectors/python.d.plugin/example/README.md +++ b/collectors/python.d.plugin/example/README.md @@ -4,10 +4,10 @@ custom_edit_url: "https://github.com/netdata/netdata/edit/master/collectors/pyth sidebar_label: "Example module in Python" learn_status: "Published" learn_topic_type: "References" -learn_rel_path: "References/Collectors references/Mock Collectors" +learn_rel_path: "Integrations/Monitor/Mock Collectors" --> -# Example +# Example module in Python You can add custom data collectors using Python. @@ -16,3 +16,23 @@ Netdata provides an [example python data collection module](https://github.com/n If you want to write your own collector, read our [writing a new Python module](https://github.com/netdata/netdata/blob/master/collectors/python.d.plugin/README.md#how-to-write-a-new-module) tutorial. +### Troubleshooting + +To troubleshoot issues with the `example` module, run the `python.d.plugin` with the debug option enabled. The +output will give you the output of the data collection job or error messages on why the collector isn't working. + +First, navigate to your plugins directory, usually they are located under `/usr/libexec/netdata/plugins.d/`. If that's +not the case on your system, open `netdata.conf` and look for the setting `plugins directory`. Once you're in the +plugin's directory, switch to the `netdata` user. + +```bash +cd /usr/libexec/netdata/plugins.d/ +sudo su -s /bin/bash netdata +``` + +Now you can manually run the `example` module in debug mode: + +```bash +./python.d.plugin example debug trace +``` + diff --git a/collectors/python.d.plugin/exim/README.md b/collectors/python.d.plugin/exim/README.md index a9c66c057..bc00ab7c6 100644 --- a/collectors/python.d.plugin/exim/README.md +++ b/collectors/python.d.plugin/exim/README.md @@ -4,10 +4,10 @@ custom_edit_url: "https://github.com/netdata/netdata/edit/master/collectors/pyth sidebar_label: "Exim" learn_status: "Published" learn_topic_type: "References" -learn_rel_path: "References/Collectors references/Webapps" +learn_rel_path: "Integrations/Monitor/Webapps" --> -# Exim monitoring with Netdata +# Exim collector Simple module executing `exim -bpc` to grab exim queue. This command can take a lot of time to finish its execution thus it is not recommended to run it every second. @@ -39,6 +39,26 @@ It produces only one chart: Configuration is not needed. ---- + +### Troubleshooting + +To troubleshoot issues with the `exim` module, run the `python.d.plugin` with the debug option enabled. The +output will give you the output of the data collection job or error messages on why the collector isn't working. + +First, navigate to your plugins directory, usually they are located under `/usr/libexec/netdata/plugins.d/`. If that's +not the case on your system, open `netdata.conf` and look for the setting `plugins directory`. Once you're in the +plugin's directory, switch to the `netdata` user. + +```bash +cd /usr/libexec/netdata/plugins.d/ +sudo su -s /bin/bash netdata +``` + +Now you can manually run the `exim` module in debug mode: + +```bash +./python.d.plugin exim debug trace +``` + diff --git a/collectors/python.d.plugin/exim/metrics.csv b/collectors/python.d.plugin/exim/metrics.csv new file mode 100644 index 000000000..8e6cc0c22 --- /dev/null +++ b/collectors/python.d.plugin/exim/metrics.csv @@ -0,0 +1,2 @@ +metric,scope,dimensions,unit,description,chart_type,labels,plugin,module +exim.qemails,,emails,emails,Exim Queue Emails,line,,python.d.plugin,exim diff --git a/collectors/python.d.plugin/fail2ban/README.md b/collectors/python.d.plugin/fail2ban/README.md index 6b2c6bba1..41276d5f7 100644 --- a/collectors/python.d.plugin/fail2ban/README.md +++ b/collectors/python.d.plugin/fail2ban/README.md @@ -4,10 +4,10 @@ custom_edit_url: "https://github.com/netdata/netdata/edit/master/collectors/pyth sidebar_label: "Fail2ban" learn_status: "Published" learn_topic_type: "References" -learn_rel_path: "References/Collectors references/Apps" +learn_rel_path: "Integrations/Monitor/Apps" --> -# Fail2ban monitoring with Netdata +# Fail2ban collector Monitors the fail2ban log file to show all bans for all active jails. @@ -80,6 +80,26 @@ local: If no configuration is given, module will attempt to read log file at `/var/log/fail2ban.log` and conf file at `/etc/fail2ban/jail.local`. If conf file is not found default jail is `ssh`. ---- + +### Troubleshooting + +To troubleshoot issues with the `fail2ban` module, run the `python.d.plugin` with the debug option enabled. The +output will give you the output of the data collection job or error messages on why the collector isn't working. + +First, navigate to your plugins directory, usually they are located under `/usr/libexec/netdata/plugins.d/`. If that's +not the case on your system, open `netdata.conf` and look for the setting `plugins directory`. Once you're in the +plugin's directory, switch to the `netdata` user. + +```bash +cd /usr/libexec/netdata/plugins.d/ +sudo su -s /bin/bash netdata +``` + +Now you can manually run the `fail2ban` module in debug mode: + +```bash +./python.d.plugin fail2ban debug trace +``` + diff --git a/collectors/python.d.plugin/fail2ban/metrics.csv b/collectors/python.d.plugin/fail2ban/metrics.csv new file mode 100644 index 000000000..13ef80f40 --- /dev/null +++ b/collectors/python.d.plugin/fail2ban/metrics.csv @@ -0,0 +1,4 @@ +metric,scope,dimensions,unit,description,chart_type,labels,plugin,module +fail2ban.faile_attempts,,a dimension per jail,attempts/s,Failed attempts,line,,python.d.plugin,fail2ban +fail2ban.bans,,a dimension per jail,bans/s,Bans,line,,python.d.plugin,fail2ban +fail2ban.banned_ips,,a dimension per jail,ips,Banned IP addresses (since the last restart of netdata),line,,python.d.plugin,fail2ban diff --git a/collectors/python.d.plugin/gearman/README.md b/collectors/python.d.plugin/gearman/README.md index 9ac53cb8e..329c34726 100644 --- a/collectors/python.d.plugin/gearman/README.md +++ b/collectors/python.d.plugin/gearman/README.md @@ -4,10 +4,10 @@ custom_edit_url: "https://github.com/netdata/netdata/edit/master/collectors/pyth sidebar_label: "Gearman" learn_status: "Published" learn_topic_type: "References" -learn_rel_path: "References/Collectors references/Distributed computing" +learn_rel_path: "Integrations/Monitor/Distributed computing" --> -# Gearman monitoring with Netdata +# Gearman collector Monitors Gearman worker statistics. A chart is shown for each job as well as one showing a summary of all workers. @@ -51,3 +51,23 @@ localhost: When no configuration file is found, module tries to connect to TCP/IP socket: `localhost:4730`. +### Troubleshooting + +To troubleshoot issues with the `gearman` module, run the `python.d.plugin` with the debug option enabled. The +output will give you the output of the data collection job or error messages on why the collector isn't working. + +First, navigate to your plugins directory, usually they are located under `/usr/libexec/netdata/plugins.d/`. If that's +not the case on your system, open `netdata.conf` and look for the setting `plugins directory`. Once you're in the +plugin's directory, switch to the `netdata` user. + +```bash +cd /usr/libexec/netdata/plugins.d/ +sudo su -s /bin/bash netdata +``` + +Now you can manually run the `gearman` module in debug mode: + +```bash +./python.d.plugin gearman debug trace +``` + diff --git a/collectors/python.d.plugin/gearman/metrics.csv b/collectors/python.d.plugin/gearman/metrics.csv new file mode 100644 index 000000000..0592e75d6 --- /dev/null +++ b/collectors/python.d.plugin/gearman/metrics.csv @@ -0,0 +1,3 @@ +metric,scope,dimensions,unit,description,chart_type,labels,plugin,module +gearman.total_jobs,,"Pending, Running",Jobs,Total Jobs,line,,python.d.plugin,gearman +gearman.single_job,gearman job,"Pending, Idle, Runnning",Jobs,{job_name},stacked,,python.d.plugin,gearman diff --git a/collectors/python.d.plugin/go_expvar/README.md b/collectors/python.d.plugin/go_expvar/README.md index ff786e7c4..f86fa6d04 100644 --- a/collectors/python.d.plugin/go_expvar/README.md +++ b/collectors/python.d.plugin/go_expvar/README.md @@ -4,10 +4,10 @@ custom_edit_url: "https://github.com/netdata/netdata/edit/master/collectors/pyth sidebar_label: "Go applications" learn_status: "Published" learn_topic_type: "References" -learn_rel_path: "References/Collectors references/Application Performance Monitoring" +learn_rel_path: "Integrations/Monitor/Application Performance Monitoring" --> -# Go applications monitoring with Netdata +# Go applications collector Monitors Go application that exposes its metrics with the use of `expvar` package from the Go standard library. The package produces charts for Go runtime memory statistics and optionally any number of custom charts. @@ -320,3 +320,23 @@ The images below show how do the final charts in Netdata look.  +### Troubleshooting + +To troubleshoot issues with the `go_expvar` module, run the `python.d.plugin` with the debug option enabled. The +output will give you the output of the data collection job or error messages on why the collector isn't working. + +First, navigate to your plugins directory, usually they are located under `/usr/libexec/netdata/plugins.d/`. If that's +not the case on your system, open `netdata.conf` and look for the setting `plugins directory`. Once you're in the +plugin's directory, switch to the `netdata` user. + +```bash +cd /usr/libexec/netdata/plugins.d/ +sudo su -s /bin/bash netdata +``` + +Now you can manually run the `go_expvar` module in debug mode: + +```bash +./python.d.plugin go_expvar debug trace +``` + diff --git a/collectors/python.d.plugin/go_expvar/metrics.csv b/collectors/python.d.plugin/go_expvar/metrics.csv new file mode 100644 index 000000000..5d96ff753 --- /dev/null +++ b/collectors/python.d.plugin/go_expvar/metrics.csv @@ -0,0 +1,8 @@ +metric,scope,dimensions,unit,description,chart_type,labels,plugin,module +expvar.memstats.heap,,"alloc, inuse",KiB,memory: size of heap memory structures,line,,python.d.plugin,go_expvar +expvar.memstats.stack,,inuse,KiB,memory: size of stack memory structures,line,,python.d.plugin,go_expvar +expvar.memstats.mspan,,inuse,KiB,memory: size of mspan memory structures,line,,python.d.plugin,go_expvar +expvar.memstats.mcache,,inuse,KiB,memory: size of mcache memory structures,line,,python.d.plugin,go_expvar +expvar.memstats.live_objects,,live,objects,memory: number of live objects,line,,python.d.plugin,go_expvar +expvar.memstats.sys,,sys,KiB,memory: size of reserved virtual address space,line,,python.d.plugin,go_expvar +expvar.memstats.gc_pauses,,avg,ns,memory: average duration of GC pauses,line,,python.d.plugin,go_expvar diff --git a/collectors/python.d.plugin/haproxy/README.md b/collectors/python.d.plugin/haproxy/README.md index 1aa1a214a..2fa203f60 100644 --- a/collectors/python.d.plugin/haproxy/README.md +++ b/collectors/python.d.plugin/haproxy/README.md @@ -4,10 +4,10 @@ custom_edit_url: "https://github.com/netdata/netdata/edit/master/collectors/pyth sidebar_label: "haproxy-python.d.plugin" learn_status: "Published" learn_topic_type: "References" -learn_rel_path: "References/Collectors references/Webapps" +learn_rel_path: "Integrations/Monitor/Webapps" --> -# HAProxy monitoring with Netdata +# HAProxy collector Monitors frontend and backend metrics such as bytes in, bytes out, sessions current, sessions in queue current. And health metrics such as backend servers status (server check should be used). @@ -67,4 +67,24 @@ via_socket: If no configuration is given, module will fail to run. ---- + +### Troubleshooting + +To troubleshoot issues with the `haproxy` module, run the `python.d.plugin` with the debug option enabled. The +output will give you the output of the data collection job or error messages on why the collector isn't working. + +First, navigate to your plugins directory, usually they are located under `/usr/libexec/netdata/plugins.d/`. If that's +not the case on your system, open `netdata.conf` and look for the setting `plugins directory`. Once you're in the +plugin's directory, switch to the `netdata` user. + +```bash +cd /usr/libexec/netdata/plugins.d/ +sudo su -s /bin/bash netdata +``` + +Now you can manually run the `haproxy` module in debug mode: + +```bash +./python.d.plugin haproxy debug trace +``` + diff --git a/collectors/python.d.plugin/haproxy/metrics.csv b/collectors/python.d.plugin/haproxy/metrics.csv new file mode 100644 index 000000000..7c92c5665 --- /dev/null +++ b/collectors/python.d.plugin/haproxy/metrics.csv @@ -0,0 +1,31 @@ +metric,scope,dimensions,unit,description,chart_type,labels,plugin,module +haproxy_f.bin,,a dimension per frontend server,KiB/s,Kilobytes In,line,,python.d.plugin,haproxy +haproxy_f.bout,,a dimension per frontend server,KiB/s,Kilobytes Out,line,,python.d.plugin,haproxy +haproxy_f.scur,,a dimension per frontend server,sessions,Sessions Active,line,,python.d.plugin,haproxy +haproxy_f.qcur,,a dimension per frontend server,sessions,Session In Queue,line,,python.d.plugin,haproxy +haproxy_f.hrsp_1xx,,a dimension per frontend server,responses/s,HTTP responses with 1xx code,line,,python.d.plugin,haproxy +haproxy_f.hrsp_2xx,,a dimension per frontend server,responses/s,HTTP responses with 2xx code,line,,python.d.plugin,haproxy +haproxy_f.hrsp_3xx,,a dimension per frontend server,responses/s,HTTP responses with 3xx code,line,,python.d.plugin,haproxy +haproxy_f.hrsp_4xx,,a dimension per frontend server,responses/s,HTTP responses with 4xx code,line,,python.d.plugin,haproxy +haproxy_f.hrsp_5xx,,a dimension per frontend server,responses/s,HTTP responses with 5xx code,line,,python.d.plugin,haproxy +haproxy_f.hrsp_other,,a dimension per frontend server,responses/s,HTTP responses with other codes (protocol error),line,,python.d.plugin,haproxy +haproxy_f.hrsp_total,,a dimension per frontend server,responses,HTTP responses,line,,python.d.plugin,haproxy +haproxy_b.bin,,a dimension per backend server,KiB/s,Kilobytes In,line,,python.d.plugin,haproxy +haproxy_b.bout,,a dimension per backend server,KiB/s,Kilobytes Out,line,,python.d.plugin,haproxy +haproxy_b.scur,,a dimension per backend server,sessions,Sessions Active,line,,python.d.plugin,haproxy +haproxy_b.qcur,,a dimension per backend server,sessions,Sessions In Queue,line,,python.d.plugin,haproxy +haproxy_b.hrsp_1xx,,a dimension per backend server,responses/s,HTTP responses with 1xx code,line,,python.d.plugin,haproxy +haproxy_b.hrsp_2xx,,a dimension per backend server,responses/s,HTTP responses with 2xx code,line,,python.d.plugin,haproxy +haproxy_b.hrsp_3xx,,a dimension per backend server,responses/s,HTTP responses with 3xx code,line,,python.d.plugin,haproxy +haproxy_b.hrsp_4xx,,a dimension per backend server,responses/s,HTTP responses with 4xx code,line,,python.d.plugin,haproxy +haproxy_b.hrsp_5xx,,a dimension per backend server,responses/s,HTTP responses with 5xx code,line,,python.d.plugin,haproxy +haproxy_b.hrsp_other,,a dimension per backend server,responses/s,HTTP responses with other codes (protocol error),line,,python.d.plugin,haproxy +haproxy_b.hrsp_total,,a dimension per backend server,responses/s,HTTP responses (total),line,,python.d.plugin,haproxy +haproxy_b.qtime,,a dimension per backend server,milliseconds,The average queue time over the 1024 last requests,line,,python.d.plugin,haproxy +haproxy_b.ctime,,a dimension per backend server,milliseconds,The average connect time over the 1024 last requests,line,,python.d.plugin,haproxy +haproxy_b.rtime,,a dimension per backend server,milliseconds,The average response time over the 1024 last requests,line,,python.d.plugin,haproxy +haproxy_b.ttime,,a dimension per backend server,milliseconds,The average total session time over the 1024 last requests,line,,python.d.plugin,haproxy +haproxy_hs.down,,a dimension per backend server,failed servers,Backend Servers In DOWN State,line,,python.d.plugin,haproxy +haproxy_hs.up,,a dimension per backend server,health servers,Backend Servers In UP State,line,,python.d.plugin,haproxy +haproxy_hb.down,,a dimension per backend server,boolean,Is Backend Failed?,line,,python.d.plugin,haproxy +haproxy.idle,,idle,percentage,The Ratio Of Polling Time Vs Total Time,line,,python.d.plugin,haproxy diff --git a/collectors/python.d.plugin/hddtemp/README.md b/collectors/python.d.plugin/hddtemp/README.md index 6a253b5bf..b42da7346 100644 --- a/collectors/python.d.plugin/hddtemp/README.md +++ b/collectors/python.d.plugin/hddtemp/README.md @@ -4,10 +4,10 @@ custom_edit_url: "https://github.com/netdata/netdata/edit/master/collectors/pyth sidebar_label: "Hard drive temperature" learn_status: "Published" learn_topic_type: "References" -learn_rel_path: "References/Collectors references/Hardware" +learn_rel_path: "Integrations/Monitor/Hardware" --> -# Hard drive temperature monitoring with Netdata +# Hard drive temperature collector Monitors disk temperatures from one or more `hddtemp` daemons. @@ -36,6 +36,26 @@ port: 7634 If no configuration is given, module will attempt to connect to hddtemp daemon on `127.0.0.1:7634` address ---- + +### Troubleshooting + +To troubleshoot issues with the `hddtemp` module, run the `python.d.plugin` with the debug option enabled. The +output will give you the output of the data collection job or error messages on why the collector isn't working. + +First, navigate to your plugins directory, usually they are located under `/usr/libexec/netdata/plugins.d/`. If that's +not the case on your system, open `netdata.conf` and look for the setting `plugins directory`. Once you're in the +plugin's directory, switch to the `netdata` user. + +```bash +cd /usr/libexec/netdata/plugins.d/ +sudo su -s /bin/bash netdata +``` + +Now you can manually run the `hddtemp` module in debug mode: + +```bash +./python.d.plugin hddtemp debug trace +``` + diff --git a/collectors/python.d.plugin/hddtemp/metrics.csv b/collectors/python.d.plugin/hddtemp/metrics.csv new file mode 100644 index 000000000..c3a858db8 --- /dev/null +++ b/collectors/python.d.plugin/hddtemp/metrics.csv @@ -0,0 +1,2 @@ +metric,scope,dimensions,unit,description,chart_type,labels,plugin,module +hddtemp.temperatures,,a dimension per disk,Celsius,Disk Temperatures,line,,python.d.plugin,hddtemp diff --git a/collectors/python.d.plugin/hpssa/README.md b/collectors/python.d.plugin/hpssa/README.md index 72dc78032..12b250475 100644 --- a/collectors/python.d.plugin/hpssa/README.md +++ b/collectors/python.d.plugin/hpssa/README.md @@ -4,10 +4,10 @@ custom_edit_url: "https://github.com/netdata/netdata/edit/master/collectors/pyth sidebar_label: "HP Smart Storage Arrays" learn_status: "Published" learn_topic_type: "References" -learn_rel_path: "References/Collectors references/Storage" +learn_rel_path: "Integrations/Monitor/Storage" --> -# HP Smart Storage Arrays monitoring with Netdata +# HP Smart Storage Arrays collector Monitors controller, cache module, logical and physical drive state and temperature using `ssacli` tool. @@ -84,3 +84,23 @@ ssacli_path: /usr/sbin/ssacli Save the file and restart the Netdata Agent with `sudo systemctl restart netdata`, or the [appropriate method](https://github.com/netdata/netdata/blob/master/docs/configure/start-stop-restart.md) for your system. +### Troubleshooting + +To troubleshoot issues with the `hpssa` module, run the `python.d.plugin` with the debug option enabled. The +output will give you the output of the data collection job or error messages on why the collector isn't working. + +First, navigate to your plugins directory, usually they are located under `/usr/libexec/netdata/plugins.d/`. If that's +not the case on your system, open `netdata.conf` and look for the setting `plugins directory`. Once you're in the +plugin's directory, switch to the `netdata` user. + +```bash +cd /usr/libexec/netdata/plugins.d/ +sudo su -s /bin/bash netdata +``` + +Now you can manually run the `hpssa` module in debug mode: + +```bash +./python.d.plugin hpssa debug trace +``` + diff --git a/collectors/python.d.plugin/hpssa/metrics.csv b/collectors/python.d.plugin/hpssa/metrics.csv new file mode 100644 index 000000000..126ba5daa --- /dev/null +++ b/collectors/python.d.plugin/hpssa/metrics.csv @@ -0,0 +1,6 @@ +metric,scope,dimensions,unit,description,chart_type,labels,plugin,module +hpssa.ctrl_status,,"ctrl_{adapter slot}_status, cache_{adapter slot}_status, battery_{adapter slot}_status per adapter",Status,"Status 1 is OK, Status 0 is not OK",line,,python.d.plugin,hpssa +hpssa.ctrl_temperature,,"ctrl_{adapter slot}_temperature, cache_{adapter slot}_temperature per adapter",Celsius,Temperature,line,,python.d.plugin,hpssa +hpssa.ld_status,,a dimension per logical drive,Status,"Status 1 is OK, Status 0 is not OK",line,,python.d.plugin,hpssa +hpssa.pd_status,,a dimension per physical drive,Status,"Status 1 is OK, Status 0 is not OK",line,,python.d.plugin,hpssa +hpssa.pd_temperature,,a dimension per physical drive,Celsius,Temperature,line,,python.d.plugin,hpssa diff --git a/collectors/python.d.plugin/icecast/README.md b/collectors/python.d.plugin/icecast/README.md index 6fca34ba6..25bbf738e 100644 --- a/collectors/python.d.plugin/icecast/README.md +++ b/collectors/python.d.plugin/icecast/README.md @@ -4,10 +4,10 @@ custom_edit_url: "https://github.com/netdata/netdata/edit/master/collectors/pyth sidebar_label: "Icecast" learn_status: "Published" learn_topic_type: "References" -learn_rel_path: "References/Collectors references/Networking" +learn_rel_path: "Integrations/Monitor/Networking" --> -# Icecast monitoring with Netdata +# Icecast collector Monitors the number of listeners for active sources. @@ -42,6 +42,26 @@ remote: Without configuration, module attempts to connect to `http://localhost:8443/status-json.xsl` ---- + +### Troubleshooting + +To troubleshoot issues with the `icecast` module, run the `python.d.plugin` with the debug option enabled. The +output will give you the output of the data collection job or error messages on why the collector isn't working. + +First, navigate to your plugins directory, usually they are located under `/usr/libexec/netdata/plugins.d/`. If that's +not the case on your system, open `netdata.conf` and look for the setting `plugins directory`. Once you're in the +plugin's directory, switch to the `netdata` user. + +```bash +cd /usr/libexec/netdata/plugins.d/ +sudo su -s /bin/bash netdata +``` + +Now you can manually run the `icecast` module in debug mode: + +```bash +./python.d.plugin icecast debug trace +``` + diff --git a/collectors/python.d.plugin/icecast/metrics.csv b/collectors/python.d.plugin/icecast/metrics.csv new file mode 100644 index 000000000..e05c0504a --- /dev/null +++ b/collectors/python.d.plugin/icecast/metrics.csv @@ -0,0 +1,2 @@ +metric,scope,dimensions,unit,description,chart_type,labels,plugin,module +icecast.listeners,,a dimension for each active source,listeners,Number Of Listeners,line,,python.d.plugin,icecast diff --git a/collectors/python.d.plugin/ipfs/README.md b/collectors/python.d.plugin/ipfs/README.md index 8f5e53b10..c990ae34f 100644 --- a/collectors/python.d.plugin/ipfs/README.md +++ b/collectors/python.d.plugin/ipfs/README.md @@ -4,10 +4,10 @@ custom_edit_url: "https://github.com/netdata/netdata/edit/master/collectors/pyth sidebar_label: "IPFS" learn_status: "Published" learn_topic_type: "References" -learn_rel_path: "References/Collectors references/Storage" +learn_rel_path: "Integrations/Monitor/Storage" --> -# IPFS monitoring with Netdata +# IPFS collector Collects [`IPFS`](https://ipfs.io) basic information like file system bandwidth, peers and repo metrics. @@ -30,7 +30,7 @@ cd /etc/netdata # Replace this path with your Netdata config directory, if dif sudo ./edit-config python.d/ipfs.conf ``` ---- + Calls to the following endpoints are disabled due to `IPFS` bugs: @@ -49,6 +49,26 @@ remote: url: 'http://203.0.113.10::5001' ``` ---- + +### Troubleshooting + +To troubleshoot issues with the `ipfs` module, run the `python.d.plugin` with the debug option enabled. The +output will give you the output of the data collection job or error messages on why the collector isn't working. + +First, navigate to your plugins directory, usually they are located under `/usr/libexec/netdata/plugins.d/`. If that's +not the case on your system, open `netdata.conf` and look for the setting `plugins directory`. Once you're in the +plugin's directory, switch to the `netdata` user. + +```bash +cd /usr/libexec/netdata/plugins.d/ +sudo su -s /bin/bash netdata +``` + +Now you can manually run the `ipfs` module in debug mode: + +```bash +./python.d.plugin ipfs debug trace +``` + diff --git a/collectors/python.d.plugin/ipfs/metrics.csv b/collectors/python.d.plugin/ipfs/metrics.csv new file mode 100644 index 000000000..33dd43c99 --- /dev/null +++ b/collectors/python.d.plugin/ipfs/metrics.csv @@ -0,0 +1,5 @@ +metric,scope,dimensions,unit,description,chart_type,labels,plugin,module +ipfs.bandwidth,,"in, out",kilobits/s,IPFS Bandwidth,line,,python.d.plugin,ipfs +ipfs.peers,,peers,peers,IPFS Peers,line,,python.d.plugin,ipfs +ipfs.repo_size,,"avail, size",GiB,IPFS Repo Size,area,,python.d.plugin,ipfs +ipfs.repo_objects,,"objects, pinned, recursive_pins",objects,IPFS Repo Objects,line,,python.d.plugin,ipfs diff --git a/collectors/python.d.plugin/litespeed/README.md b/collectors/python.d.plugin/litespeed/README.md index b9bad4635..1ad5ad42c 100644 --- a/collectors/python.d.plugin/litespeed/README.md +++ b/collectors/python.d.plugin/litespeed/README.md @@ -4,10 +4,10 @@ custom_edit_url: "https://github.com/netdata/netdata/edit/master/collectors/pyth sidebar_label: "LiteSpeed" learn_status: "Published" learn_topic_type: "References" -learn_rel_path: "References/Collectors references/Application Performance Monitoring" +learn_rel_path: "Integrations/Monitor/Application Performance Monitoring" --> -# LiteSpeed monitoring with Netdata +# LiteSpeed collector Collects web server performance metrics for network, connection, requests, and cache. @@ -70,6 +70,26 @@ local: If no configuration is given, module will use "/tmp/lshttpd/". ---- + +### Troubleshooting + +To troubleshoot issues with the `litespeed` module, run the `python.d.plugin` with the debug option enabled. The +output will give you the output of the data collection job or error messages on why the collector isn't working. + +First, navigate to your plugins directory, usually they are located under `/usr/libexec/netdata/plugins.d/`. If that's +not the case on your system, open `netdata.conf` and look for the setting `plugins directory`. Once you're in the +plugin's directory, switch to the `netdata` user. + +```bash +cd /usr/libexec/netdata/plugins.d/ +sudo su -s /bin/bash netdata +``` + +Now you can manually run the `litespeed` module in debug mode: + +```bash +./python.d.plugin litespeed debug trace +``` + diff --git a/collectors/python.d.plugin/litespeed/metrics.csv b/collectors/python.d.plugin/litespeed/metrics.csv new file mode 100644 index 000000000..56e50e423 --- /dev/null +++ b/collectors/python.d.plugin/litespeed/metrics.csv @@ -0,0 +1,10 @@ +metric,scope,dimensions,unit,description,chart_type,labels,plugin,module +litespeed.net_throughput,,"in, out",kilobits/s,Network Throughput HTTP,area,,python.d.plugin,litespeed +litespeed.net_throughput,,"in, out",kilobits/s,Network Throughput HTTPS,area,,python.d.plugin,litespeed +litespeed.connections,,"free, used",conns,Connections HTTP,stacked,,python.d.plugin,litespeed +litespeed.connections,,"free, used",conns,Connections HTTPS,stacked,,python.d.plugin,litespeed +litespeed.requests,,requests,requests/s,Requests,line,,python.d.plugin,litespeed +litespeed.requests_processing,,processing,requests,Requests In Processing,line,,python.d.plugin,litespeed +litespeed.cache,,hits,hits/s,Public Cache Hits,line,,python.d.plugin,litespeed +litespeed.cache,,hits,hits/s,Private Cache Hits,line,,python.d.plugin,litespeed +litespeed.static,,hits,hits/s,Static Hits,line,,python.d.plugin,litespeed diff --git a/collectors/python.d.plugin/megacli/README.md b/collectors/python.d.plugin/megacli/README.md index 3900de381..1af4d0ea7 100644 --- a/collectors/python.d.plugin/megacli/README.md +++ b/collectors/python.d.plugin/megacli/README.md @@ -4,10 +4,10 @@ custom_edit_url: "https://github.com/netdata/netdata/edit/master/collectors/pyth sidebar_label: "MegaRAID controllers" learn_status: "Published" learn_topic_type: "References" -learn_rel_path: "References/Collectors references/Devices" +learn_rel_path: "Integrations/Monitor/Devices" --> -# MegaRAID controller monitoring with Netdata +# MegaRAID controller collector Collects adapter, physical drives and battery stats using `megacli` command-line tool. @@ -87,3 +87,23 @@ Save the file and restart the Netdata Agent with `sudo systemctl restart netdata method](https://github.com/netdata/netdata/blob/master/docs/configure/start-stop-restart.md) for your system. +### Troubleshooting + +To troubleshoot issues with the `megacli` module, run the `python.d.plugin` with the debug option enabled. The +output will give you the output of the data collection job or error messages on why the collector isn't working. + +First, navigate to your plugins directory, usually they are located under `/usr/libexec/netdata/plugins.d/`. If that's +not the case on your system, open `netdata.conf` and look for the setting `plugins directory`. Once you're in the +plugin's directory, switch to the `netdata` user. + +```bash +cd /usr/libexec/netdata/plugins.d/ +sudo su -s /bin/bash netdata +``` + +Now you can manually run the `megacli` module in debug mode: + +```bash +./python.d.plugin megacli debug trace +``` + diff --git a/collectors/python.d.plugin/megacli/metrics.csv b/collectors/python.d.plugin/megacli/metrics.csv new file mode 100644 index 000000000..6d7b00bfd --- /dev/null +++ b/collectors/python.d.plugin/megacli/metrics.csv @@ -0,0 +1,6 @@ +metric,scope,dimensions,unit,description,chart_type,labels,plugin,module +megacli.adapter_degraded,,a dimension per adapter,is degraded,Adapter State,line,,python.d.plugin,megacli +megacli.pd_media_error,,a dimension per physical drive,errors/s,Physical Drives Media Errors,line,,python.d.plugin,megacli +megacli.pd_predictive_failure,,a dimension per physical drive,failures/s,Physical Drives Predictive Failures,line,,python.d.plugin,megacli +megacli.bbu_relative_charge,battery,adapter {battery id},percentage,Relative State of Charge,line,,python.d.plugin,megacli +megacli.bbu_cycle_count,battery,adapter {battery id},cycle count,Cycle Count,line,,python.d.plugin,megacli diff --git a/collectors/python.d.plugin/memcached/README.md b/collectors/python.d.plugin/memcached/README.md index 4158ab19c..612bd49d7 100644 --- a/collectors/python.d.plugin/memcached/README.md +++ b/collectors/python.d.plugin/memcached/README.md @@ -4,10 +4,10 @@ custom_edit_url: "https://github.com/netdata/netdata/edit/master/collectors/pyth sidebar_label: "Memcached" learn_status: "Published" learn_topic_type: "References" -learn_rel_path: "References/Collectors references/Databases" +learn_rel_path: "Integrations/Monitor/Databases" --> -# Memcached monitoring with Netdata +# Memcached collector Collects memory-caching system performance metrics. It reads server response to stats command ([stats interface](https://github.com/memcached/memcached/wiki/Commands#stats)). @@ -97,6 +97,26 @@ localtcpip: If no configuration is given, module will attempt to connect to memcached instance on `127.0.0.1:11211` address. ---- + +### Troubleshooting + +To troubleshoot issues with the `memcached` module, run the `python.d.plugin` with the debug option enabled. The +output will give you the output of the data collection job or error messages on why the collector isn't working. + +First, navigate to your plugins directory, usually they are located under `/usr/libexec/netdata/plugins.d/`. If that's +not the case on your system, open `netdata.conf` and look for the setting `plugins directory`. Once you're in the +plugin's directory, switch to the `netdata` user. + +```bash +cd /usr/libexec/netdata/plugins.d/ +sudo su -s /bin/bash netdata +``` + +Now you can manually run the `memcached` module in debug mode: + +```bash +./python.d.plugin memcached debug trace +``` + diff --git a/collectors/python.d.plugin/memcached/memcached.chart.py b/collectors/python.d.plugin/memcached/memcached.chart.py index bb656a2d6..adb9560b7 100644 --- a/collectors/python.d.plugin/memcached/memcached.chart.py +++ b/collectors/python.d.plugin/memcached/memcached.chart.py @@ -53,40 +53,40 @@ CHARTS = { ] }, 'evicted_reclaimed': { - 'options': [None, 'Items', 'items', 'items', 'memcached.evicted_reclaimed', 'line'], + 'options': [None, 'Evicted and Reclaimed Items', 'items', 'items', 'memcached.evicted_reclaimed', 'line'], 'lines': [ ['reclaimed', 'reclaimed', 'absolute'], ['evictions', 'evicted', 'absolute'] ] }, 'get': { - 'options': [None, 'Requests', 'requests', 'get ops', 'memcached.get', 'stacked'], + 'options': [None, 'Get Requests', 'requests', 'get ops', 'memcached.get', 'stacked'], 'lines': [ ['get_hits', 'hits', 'percent-of-absolute-row'], ['get_misses', 'misses', 'percent-of-absolute-row'] ] }, 'get_rate': { - 'options': [None, 'Rate', 'requests/s', 'get ops', 'memcached.get_rate', 'line'], + 'options': [None, 'Get Request Rate', 'requests/s', 'get ops', 'memcached.get_rate', 'line'], 'lines': [ ['cmd_get', 'rate', 'incremental'] ] }, 'set_rate': { - 'options': [None, 'Rate', 'requests/s', 'set ops', 'memcached.set_rate', 'line'], + 'options': [None, 'Set Request Rate', 'requests/s', 'set ops', 'memcached.set_rate', 'line'], 'lines': [ ['cmd_set', 'rate', 'incremental'] ] }, 'delete': { - 'options': [None, 'Requests', 'requests', 'delete ops', 'memcached.delete', 'stacked'], + 'options': [None, 'Delete Requests', 'requests', 'delete ops', 'memcached.delete', 'stacked'], 'lines': [ ['delete_hits', 'hits', 'percent-of-absolute-row'], ['delete_misses', 'misses', 'percent-of-absolute-row'], ] }, 'cas': { - 'options': [None, 'Requests', 'requests', 'check and set ops', 'memcached.cas', 'stacked'], + 'options': [None, 'Check and Set Requests', 'requests', 'check and set ops', 'memcached.cas', 'stacked'], 'lines': [ ['cas_hits', 'hits', 'percent-of-absolute-row'], ['cas_misses', 'misses', 'percent-of-absolute-row'], @@ -94,28 +94,28 @@ CHARTS = { ] }, 'increment': { - 'options': [None, 'Requests', 'requests', 'increment ops', 'memcached.increment', 'stacked'], + 'options': [None, 'Increment Requests', 'requests', 'increment ops', 'memcached.increment', 'stacked'], 'lines': [ ['incr_hits', 'hits', 'percent-of-absolute-row'], ['incr_misses', 'misses', 'percent-of-absolute-row'] ] }, 'decrement': { - 'options': [None, 'Requests', 'requests', 'decrement ops', 'memcached.decrement', 'stacked'], + 'options': [None, 'Decrement Requests', 'requests', 'decrement ops', 'memcached.decrement', 'stacked'], 'lines': [ ['decr_hits', 'hits', 'percent-of-absolute-row'], ['decr_misses', 'misses', 'percent-of-absolute-row'] ] }, 'touch': { - 'options': [None, 'Requests', 'requests', 'touch ops', 'memcached.touch', 'stacked'], + 'options': [None, 'Touch Requests', 'requests', 'touch ops', 'memcached.touch', 'stacked'], 'lines': [ ['touch_hits', 'hits', 'percent-of-absolute-row'], ['touch_misses', 'misses', 'percent-of-absolute-row'] ] }, 'touch_rate': { - 'options': [None, 'Rate', 'requests/s', 'touch ops', 'memcached.touch_rate', 'line'], + 'options': [None, 'Touch Request Rate', 'requests/s', 'touch ops', 'memcached.touch_rate', 'line'], 'lines': [ ['cmd_touch', 'rate', 'incremental'] ] diff --git a/collectors/python.d.plugin/memcached/metrics.csv b/collectors/python.d.plugin/memcached/metrics.csv new file mode 100644 index 000000000..c73620752 --- /dev/null +++ b/collectors/python.d.plugin/memcached/metrics.csv @@ -0,0 +1,15 @@ +metric,scope,dimensions,unit,description,chart_type,labels,plugin,module +memcached.cache,,"available, used",MiB,Cache Size,stacked,,python.d.plugin,memcached +memcached.net,,"in, out",kilobits/s,Network,area,,python.d.plugin,memcached +memcached.connections,,"current, rejected, total",connections/s,Connections,line,,python.d.plugin,memcached +memcached.items,,"current,total",items,Items,line,,python.d.plugin,memcached +memcached.evicted_reclaimed,,"reclaimed, evicted", items,Evicted and Reclaimed Items,line,,python.d.plugin,memcached +memcached.get,,"hints, misses",requests,Get Requests,stacked,,python.d.plugin,memcached +memcached.get_rate,,rate,requests/s,Get Request Rate,line,,python.d.plugin,memcached +memcached.set_rate,,rate,requests/s,Set Request Rate,line,,python.d.plugin,memcached +memcached.delete,,"hits, misses",requests,Delete Requests,stacked,,python.d.plugin,memcached +memcached.cas,,"hits, misses, bad value",requests,Check and Set Requests,stacked,,python.d.plugin,memcached +memcached.increment,,"hits, misses",requests,Increment Requests,stacked,,python.d.plugin,memcached +memcached.decrement,,"hits, misses",requests,Decrement Requests,stacked,,python.d.plugin,memcached +memcached.touch,,"hits, misses",requests,Touch Requests,stacked,,python.d.plugin,memcached +memcached.touch_rate,,rate,requests/s,Touch Request Rate,line,,python.d.plugin,memcached diff --git a/collectors/python.d.plugin/monit/README.md b/collectors/python.d.plugin/monit/README.md index 816143ebf..f762de0d3 100644 --- a/collectors/python.d.plugin/monit/README.md +++ b/collectors/python.d.plugin/monit/README.md @@ -4,10 +4,10 @@ custom_edit_url: "https://github.com/netdata/netdata/edit/master/collectors/pyth sidebar_label: "Monit" learn_status: "Published" learn_topic_type: "References" -learn_rel_path: "References/Collectors references/Storage" +learn_rel_path: "Integrations/Monitor/Storage" --> -# Monit monitoring with Netdata +# Monit collector Monit monitoring module. Data is grabbed from stats XML interface (exists for a long time, but not mentioned in official documentation). Mostly this plugin shows statuses of monit targets, i.e. @@ -53,6 +53,26 @@ local: If no configuration is given, module will attempt to connect to monit as `http://localhost:2812`. ---- + +### Troubleshooting + +To troubleshoot issues with the `monit` module, run the `python.d.plugin` with the debug option enabled. The +output will give you the output of the data collection job or error messages on why the collector isn't working. + +First, navigate to your plugins directory, usually they are located under `/usr/libexec/netdata/plugins.d/`. If that's +not the case on your system, open `netdata.conf` and look for the setting `plugins directory`. Once you're in the +plugin's directory, switch to the `netdata` user. + +```bash +cd /usr/libexec/netdata/plugins.d/ +sudo su -s /bin/bash netdata +``` + +Now you can manually run the `monit` module in debug mode: + +```bash +./python.d.plugin monit debug trace +``` + diff --git a/collectors/python.d.plugin/monit/metrics.csv b/collectors/python.d.plugin/monit/metrics.csv new file mode 100644 index 000000000..1981a07e4 --- /dev/null +++ b/collectors/python.d.plugin/monit/metrics.csv @@ -0,0 +1,13 @@ +metric,scope,dimensions,unit,description,chart_type,labels,plugin,module +monit.filesystems,,a dimension per target,filesystems,Filesystems,line,,python.d.plugin,monit +monit.directories,,a dimension per target,directories,Directories,line,,python.d.plugin,monit +monit.files,,a dimension per target,files,Files,line,,python.d.plugin,monit +monit.fifos,,a dimension per target,pipes,Pipes (fifo),line,,python.d.plugin,monit +monit.programs,,a dimension per target,programs,Programs statuses,line,,python.d.plugin,monit +monit.services,,a dimension per target,processes,Processes statuses,line,,python.d.plugin,monit +monit.process_uptime,,a dimension per target,seconds,Processes uptime,line,,python.d.plugin,monit +monit.process_threads,,a dimension per target,threads,Processes threads,line,,python.d.plugin,monit +monit.process_childrens,,a dimension per target,children,Child processes,line,,python.d.plugin,monit +monit.hosts,,a dimension per target,hosts,Hosts,line,,python.d.plugin,monit +monit.host_latency,,a dimension per target,milliseconds,Hosts latency,line,,python.d.plugin,monit +monit.networks,,a dimension per target,interfaces,Network interfaces and addresses,line,,python.d.plugin,monit diff --git a/collectors/python.d.plugin/monit/monit.chart.py b/collectors/python.d.plugin/monit/monit.chart.py index bfc182349..5d926961b 100644 --- a/collectors/python.d.plugin/monit/monit.chart.py +++ b/collectors/python.d.plugin/monit/monit.chart.py @@ -99,7 +99,7 @@ CHARTS = { 'lines': [] }, 'process_children': { - 'options': ['processes childrens', 'Child processes', 'childrens', 'applications', + 'options': ['processes childrens', 'Child processes', 'children', 'applications', 'monit.process_childrens', 'line'], 'lines': [] }, diff --git a/collectors/python.d.plugin/nsd/README.md b/collectors/python.d.plugin/nsd/README.md index f99726c30..ccc4e712b 100644 --- a/collectors/python.d.plugin/nsd/README.md +++ b/collectors/python.d.plugin/nsd/README.md @@ -4,10 +4,10 @@ custom_edit_url: "https://github.com/netdata/netdata/edit/master/collectors/pyth sidebar_label: "NSD" learn_status: "Published" learn_topic_type: "References" -learn_rel_path: "References/Collectors references/Networking" +learn_rel_path: "Integrations/Monitor/Networking" --> -# NSD monitoring with Netdata +# NSD collector Uses the `nsd-control stats_noreset` command to provide `nsd` statistics. @@ -66,6 +66,26 @@ It produces: Configuration is not needed. ---- + +### Troubleshooting + +To troubleshoot issues with the `nsd` module, run the `python.d.plugin` with the debug option enabled. The +output will give you the output of the data collection job or error messages on why the collector isn't working. + +First, navigate to your plugins directory, usually they are located under `/usr/libexec/netdata/plugins.d/`. If that's +not the case on your system, open `netdata.conf` and look for the setting `plugins directory`. Once you're in the +plugin's directory, switch to the `netdata` user. + +```bash +cd /usr/libexec/netdata/plugins.d/ +sudo su -s /bin/bash netdata +``` + +Now you can manually run the `nsd` module in debug mode: + +```bash +./python.d.plugin nsd debug trace +``` + diff --git a/collectors/python.d.plugin/nsd/metrics.csv b/collectors/python.d.plugin/nsd/metrics.csv new file mode 100644 index 000000000..b82812bf6 --- /dev/null +++ b/collectors/python.d.plugin/nsd/metrics.csv @@ -0,0 +1,7 @@ +metric,scope,dimensions,unit,description,chart_type,labels,plugin,module +nsd.queries,,queries,queries/s,queries,line,,python.d.plugin,nsd +nsd.zones,,"master, slave",zones,zones,stacked,,python.d.plugin,nsd +nsd.protocols,,"udp, udp6, tcp, tcp6",queries/s,protocol,stacked,,python.d.plugin,nsd +nsd.type,,"A, NS, CNAME, SOA, PTR, HINFO, MX, NAPTR, TXT, AAAA, SRV, ANY",queries/s,query type,stacked,,python.d.plugin,nsd +nsd.transfer,,"NOTIFY, AXFR",queries/s,transfer,stacked,,python.d.plugin,nsd +nsd.rcode,,"NOERROR, FORMERR, SERVFAIL, NXDOMAIN, NOTIMP, REFUSED, YXDOMAIN",queries/s,return code,stacked,,python.d.plugin,nsd diff --git a/collectors/python.d.plugin/ntpd/Makefile.inc b/collectors/python.d.plugin/ntpd/Makefile.inc deleted file mode 100644 index 81210ebab..000000000 --- a/collectors/python.d.plugin/ntpd/Makefile.inc +++ /dev/null @@ -1,13 +0,0 @@ -# SPDX-License-Identifier: GPL-3.0-or-later - -# THIS IS NOT A COMPLETE Makefile -# IT IS INCLUDED BY ITS PARENT'S Makefile.am -# IT IS REQUIRED TO REFERENCE ALL FILES RELATIVE TO THE PARENT - -# install these files -dist_python_DATA += ntpd/ntpd.chart.py -dist_pythonconfig_DATA += ntpd/ntpd.conf - -# do not install these files, but include them in the distribution -dist_noinst_DATA += ntpd/README.md ntpd/Makefile.inc - diff --git a/collectors/python.d.plugin/ntpd/README.md b/collectors/python.d.plugin/ntpd/README.md deleted file mode 100644 index 8ae923da5..000000000 --- a/collectors/python.d.plugin/ntpd/README.md +++ /dev/null @@ -1,14 +0,0 @@ -<!-- -title: "NTP daemon monitoring with Netdata" -custom_edit_url: "https://github.com/netdata/netdata/edit/master/collectors/python.d.plugin/ntpd/README.md" -sidebar_label: "NTP daemon" -learn_status: "Published" -learn_topic_type: "References" -learn_rel_path: "References/Collectors references/Qos" ---> - -# NTP daemon monitoring with Netdata - -This collector is deprecated. -Use [go.d/ntpd](https://github.com/netdata/go.d.plugin/tree/master/modules/ntpd#ntp-daemon-monitoring-with-netdata) -instead.
\ No newline at end of file diff --git a/collectors/python.d.plugin/ntpd/ntpd.chart.py b/collectors/python.d.plugin/ntpd/ntpd.chart.py deleted file mode 100644 index 077124b4f..000000000 --- a/collectors/python.d.plugin/ntpd/ntpd.chart.py +++ /dev/null @@ -1,387 +0,0 @@ -# -*- coding: utf-8 -*- -# Description: ntpd netdata python.d module -# Author: Sven Mäder (rda0) -# Author: Ilya Mashchenko (ilyam8) -# SPDX-License-Identifier: GPL-3.0-or-later - -import re -import struct - -from bases.FrameworkServices.SocketService import SocketService - -disabled_by_default = True - -# NTP Control Message Protocol constants -MODE = 6 -HEADER_FORMAT = '!BBHHHHH' -HEADER_LEN = 12 -OPCODES = { - 'readstat': 1, - 'readvar': 2 -} - -# Maximal dimension precision -PRECISION = 1000000 - -# Static charts -ORDER = [ - 'sys_offset', - 'sys_jitter', - 'sys_frequency', - 'sys_wander', - 'sys_rootdelay', - 'sys_rootdisp', - 'sys_stratum', - 'sys_tc', - 'sys_precision', - 'peer_offset', - 'peer_delay', - 'peer_dispersion', - 'peer_jitter', - 'peer_xleave', - 'peer_rootdelay', - 'peer_rootdisp', - 'peer_stratum', - 'peer_hmode', - 'peer_pmode', - 'peer_hpoll', - 'peer_ppoll', - 'peer_precision' -] - -CHARTS = { - 'sys_offset': { - 'options': [None, 'Combined offset of server relative to this host', 'milliseconds', - 'system', 'ntpd.sys_offset', 'area'], - 'lines': [ - ['offset', 'offset', 'absolute', 1, PRECISION] - ] - }, - 'sys_jitter': { - 'options': [None, 'Combined system jitter and clock jitter', 'milliseconds', - 'system', 'ntpd.sys_jitter', 'line'], - 'lines': [ - ['sys_jitter', 'system', 'absolute', 1, PRECISION], - ['clk_jitter', 'clock', 'absolute', 1, PRECISION] - ] - }, - 'sys_frequency': { - 'options': [None, 'Frequency offset relative to hardware clock', 'ppm', 'system', 'ntpd.sys_frequency', 'area'], - 'lines': [ - ['frequency', 'frequency', 'absolute', 1, PRECISION] - ] - }, - 'sys_wander': { - 'options': [None, 'Clock frequency wander', 'ppm', 'system', 'ntpd.sys_wander', 'area'], - 'lines': [ - ['clk_wander', 'clock', 'absolute', 1, PRECISION] - ] - }, - 'sys_rootdelay': { - 'options': [None, 'Total roundtrip delay to the primary reference clock', 'milliseconds', 'system', - 'ntpd.sys_rootdelay', 'area'], - 'lines': [ - ['rootdelay', 'delay', 'absolute', 1, PRECISION] - ] - }, - 'sys_rootdisp': { - 'options': [None, 'Total root dispersion to the primary reference clock', 'milliseconds', 'system', - 'ntpd.sys_rootdisp', 'area'], - 'lines': [ - ['rootdisp', 'dispersion', 'absolute', 1, PRECISION] - ] - }, - 'sys_stratum': { - 'options': [None, 'Stratum (1-15)', 'stratum', 'system', 'ntpd.sys_stratum', 'line'], - 'lines': [ - ['stratum', 'stratum', 'absolute', 1, PRECISION] - ] - }, - 'sys_tc': { - 'options': [None, 'Time constant and poll exponent (3-17)', 'log2 s', 'system', 'ntpd.sys_tc', 'line'], - 'lines': [ - ['tc', 'current', 'absolute', 1, PRECISION], - ['mintc', 'minimum', 'absolute', 1, PRECISION] - ] - }, - 'sys_precision': { - 'options': [None, 'Precision', 'log2 s', 'system', 'ntpd.sys_precision', 'line'], - 'lines': [ - ['precision', 'precision', 'absolute', 1, PRECISION] - ] - } -} - -PEER_CHARTS = { - 'peer_offset': { - 'options': [None, 'Filter offset', 'milliseconds', 'peers', 'ntpd.peer_offset', 'line'], - 'lines': [] - }, - 'peer_delay': { - 'options': [None, 'Filter delay', 'milliseconds', 'peers', 'ntpd.peer_delay', 'line'], - 'lines': [] - }, - 'peer_dispersion': { - 'options': [None, 'Filter dispersion', 'milliseconds', 'peers', 'ntpd.peer_dispersion', 'line'], - 'lines': [] - }, - 'peer_jitter': { - 'options': [None, 'Filter jitter', 'milliseconds', 'peers', 'ntpd.peer_jitter', 'line'], - 'lines': [] - }, - 'peer_xleave': { - 'options': [None, 'Interleave delay', 'milliseconds', 'peers', 'ntpd.peer_xleave', 'line'], - 'lines': [] - }, - 'peer_rootdelay': { - 'options': [None, 'Total roundtrip delay to the primary reference clock', 'milliseconds', 'peers', - 'ntpd.peer_rootdelay', 'line'], - 'lines': [] - }, - 'peer_rootdisp': { - 'options': [None, 'Total root dispersion to the primary reference clock', 'ms', 'peers', - 'ntpd.peer_rootdisp', 'line'], - 'lines': [] - }, - 'peer_stratum': { - 'options': [None, 'Stratum (1-15)', 'stratum', 'peers', 'ntpd.peer_stratum', 'line'], - 'lines': [] - }, - 'peer_hmode': { - 'options': [None, 'Host mode (1-6)', 'hmode', 'peers', 'ntpd.peer_hmode', 'line'], - 'lines': [] - }, - 'peer_pmode': { - 'options': [None, 'Peer mode (1-5)', 'pmode', 'peers', 'ntpd.peer_pmode', 'line'], - 'lines': [] - }, - 'peer_hpoll': { - 'options': [None, 'Host poll exponent', 'log2 s', 'peers', 'ntpd.peer_hpoll', 'line'], - 'lines': [] - }, - 'peer_ppoll': { - 'options': [None, 'Peer poll exponent', 'log2 s', 'peers', 'ntpd.peer_ppoll', 'line'], - 'lines': [] - }, - 'peer_precision': { - 'options': [None, 'Precision', 'log2 s', 'peers', 'ntpd.peer_precision', 'line'], - 'lines': [] - } -} - - -class Base: - regex = re.compile(r'([a-z_]+)=((?:-)?[0-9]+(?:\.[0-9]+)?)') - - @staticmethod - def get_header(associd=0, operation='readvar'): - """ - Constructs the NTP Control Message header: - 0 1 2 3 - 0 1 2 3 4 5 6 7 8 9 0 1 2 3 4 5 6 7 8 9 0 1 2 3 4 5 6 7 8 9 0 1 - +-+-+-+-+-+-+-+-+-+-+-+-+-+-+-+-+-+-+-+-+-+-+-+-+-+-+-+-+-+-+-+-+ - |LI | VN |Mode |R|E|M| OpCode | Sequence Number | - +-+-+-+-+-+-+-+-+-+-+-+-+-+-+-+-+-+-+-+-+-+-+-+-+-+-+-+-+-+-+-+-+ - | Status | Association ID | - +-+-+-+-+-+-+-+-+-+-+-+-+-+-+-+-+-+-+-+-+-+-+-+-+-+-+-+-+-+-+-+-+ - | Offset | Count | - +-+-+-+-+-+-+-+-+-+-+-+-+-+-+-+-+-+-+-+-+-+-+-+-+-+-+-+-+-+-+-+-+ - """ - version = 2 - sequence = 1 - status = 0 - offset = 0 - count = 0 - header = struct.pack(HEADER_FORMAT, (version << 3 | MODE), OPCODES[operation], - sequence, status, associd, offset, count) - return header - - -class System(Base): - def __init__(self): - self.request = self.get_header() - - def get_data(self, raw): - """ - Extracts key=value pairs with float/integer from ntp response packet data. - """ - data = dict() - for key, value in self.regex.findall(raw): - data[key] = float(value) * PRECISION - return data - - -class Peer(Base): - def __init__(self, idx, name): - self.id = idx - self.real_name = name - self.name = name.replace('.', '_') - self.request = self.get_header(self.id) - - def get_data(self, raw): - """ - Extracts key=value pairs with float/integer from ntp response packet data. - """ - data = dict() - for key, value in self.regex.findall(raw): - dimension = '_'.join([self.name, key]) - data[dimension] = float(value) * PRECISION - return data - - -class Service(SocketService): - def __init__(self, configuration=None, name=None): - SocketService.__init__(self, configuration=configuration, name=name) - self.order = list(ORDER) - self.definitions = dict(CHARTS) - self.port = 'ntp' - self.dgram_socket = True - self.system = System() - self.peers = dict() - self.request = str() - self.retries = 0 - self.show_peers = self.configuration.get('show_peers', False) - self.peer_rescan = self.configuration.get('peer_rescan', 60) - if self.show_peers: - self.definitions.update(PEER_CHARTS) - - def check(self): - """ - Checks if we can get valid systemvars. - If not, returns None to disable module. - """ - self._parse_config() - - peer_filter = self.configuration.get('peer_filter', r'127\..*') - try: - self.peer_filter = re.compile(r'^((0\.0\.0\.0)|({0}))$'.format(peer_filter)) - except re.error as error: - self.error('Compile pattern error (peer_filter) : {0}'.format(error)) - return None - - self.request = self.system.request - raw_systemvars = self._get_raw_data() - - if not self.system.get_data(raw_systemvars): - return None - - return True - - def get_data(self): - """ - Gets systemvars data on each update. - Gets peervars data for all peers on each update. - """ - data = dict() - - self.request = self.system.request - raw = self._get_raw_data() - if not raw: - return None - - data.update(self.system.get_data(raw)) - - if not self.show_peers: - return data - - if not self.peers or self.runs_counter % self.peer_rescan == 0 or self.retries > 8: - self.find_new_peers() - - for peer in self.peers.values(): - self.request = peer.request - peer_data = peer.get_data(self._get_raw_data()) - if peer_data: - data.update(peer_data) - else: - self.retries += 1 - - return data - - def find_new_peers(self): - new_peers = dict((p.real_name, p) for p in self.get_peers()) - if new_peers: - - peers_to_remove = set(self.peers) - set(new_peers) - peers_to_add = set(new_peers) - set(self.peers) - - for peer_name in peers_to_remove: - self.hide_old_peer_from_charts(self.peers[peer_name]) - del self.peers[peer_name] - - for peer_name in peers_to_add: - self.add_new_peer_to_charts(new_peers[peer_name]) - - self.peers.update(new_peers) - self.retries = 0 - - def add_new_peer_to_charts(self, peer): - for chart_id in set(self.charts.charts) & set(PEER_CHARTS): - dim_id = peer.name + chart_id[4:] - if dim_id not in self.charts[chart_id]: - self.charts[chart_id].add_dimension([dim_id, peer.real_name, 'absolute', 1, PRECISION]) - else: - self.charts[chart_id].hide_dimension(dim_id, reverse=True) - - def hide_old_peer_from_charts(self, peer): - for chart_id in set(self.charts.charts) & set(PEER_CHARTS): - dim_id = peer.name + chart_id[4:] - self.charts[chart_id].hide_dimension(dim_id) - - def get_peers(self): - self.request = Base.get_header(operation='readstat') - - raw_data = self._get_raw_data(raw=True) - if not raw_data: - return list() - - peer_ids = self.get_peer_ids(raw_data) - if not peer_ids: - return list() - - new_peers = list() - for peer_id in peer_ids: - self.request = Base.get_header(peer_id) - raw_peer_data = self._get_raw_data() - if not raw_peer_data: - continue - srcadr = re.search(r'(srcadr)=([^,]+)', raw_peer_data) - if not srcadr: - continue - srcadr = srcadr.group(2) - if self.peer_filter.search(srcadr): - continue - stratum = re.search(r'(stratum)=([^,]+)', raw_peer_data) - if not stratum: - continue - if int(stratum.group(2)) > 15: - continue - - new_peer = Peer(idx=peer_id, name=srcadr) - new_peers.append(new_peer) - return new_peers - - def get_peer_ids(self, res): - """ - Unpack the NTP Control Message header - Get data length from header - Get list of association ids returned in the readstat response - """ - - try: - count = struct.unpack(HEADER_FORMAT, res[:HEADER_LEN])[6] - except struct.error as error: - self.error('error unpacking header: {0}'.format(error)) - return None - if not count: - self.error('empty data field in NTP control packet') - return None - - data_end = HEADER_LEN + count - data = res[HEADER_LEN:data_end] - data_format = ''.join(['!', 'H' * int(count / 2)]) - try: - peer_ids = list(struct.unpack(data_format, data))[::2] - except struct.error as error: - self.error('error unpacking data: {0}'.format(error)) - return None - return peer_ids diff --git a/collectors/python.d.plugin/ntpd/ntpd.conf b/collectors/python.d.plugin/ntpd/ntpd.conf deleted file mode 100644 index 80bd468d1..000000000 --- a/collectors/python.d.plugin/ntpd/ntpd.conf +++ /dev/null @@ -1,89 +0,0 @@ -# netdata python.d.plugin configuration for ntpd -# -# This file is in YaML format. Generally the format is: -# -# name: value -# -# There are 2 sections: -# - global variables -# - one or more JOBS -# -# JOBS allow you to collect values from multiple sources. -# Each source will have its own set of charts. -# -# JOB parameters have to be indented (using spaces only, example below). - -# ---------------------------------------------------------------------- -# Global Variables -# These variables set the defaults for all JOBs, however each JOB -# may define its own, overriding the defaults. - -# update_every sets the default data collection frequency. -# If unset, the python.d.plugin default is used. -# update_every: 1 - -# priority controls the order of charts at the netdata dashboard. -# Lower numbers move the charts towards the top of the page. -# If unset, the default for python.d.plugin is used. -# priority: 60000 - -# penalty indicates whether to apply penalty to update_every in case of failures. -# Penalty will increase every 5 failed updates in a row. Maximum penalty is 10 minutes. -# penalty: yes - -# ---------------------------------------------------------------------- -# JOBS (data collection sources) -# -# The default JOBS share the same *name*. JOBS with the same name -# are mutually exclusive. Only one of them will be allowed running at -# any time. This allows autodetection to try several alternatives and -# pick the one that works. -# -# Any number of jobs is supported. -# -# All python.d.plugin JOBS (for all its modules) support a set of -# predefined parameters. These are: -# -# job_name: -# name: myname # the JOB's name as it will appear at the -# # dashboard (by default is the job_name) -# # JOBs sharing a name are mutually exclusive -# update_every: 1 # the JOB's data collection frequency -# priority: 60000 # the JOB's order on the dashboard -# penalty: yes # the JOB's penalty -# -# Additionally to the above, ntp also supports the following: -# -# host: 'localhost' # the host to query -# port: '123' # the UDP port where `ntpd` listens -# show_peers: no # use `yes` to show peer charts. enabling this -# # option is recommended only for debugging, as -# # it could possibly imply memory leaks if the -# # peers change frequently. -# peer_filter: '127\..*' # regex to exclude peers -# # by default local peers are hidden -# # use `''` to show all peers. -# peer_rescan: 60 # interval (>0) to check for new/changed peers -# # use `1` to check on every update -# -# ---------------------------------------------------------------------- -# AUTO-DETECTION JOBS -# only one of them will run (they have the same name) - -localhost: - name: 'local' - host: 'localhost' - port: '123' - show_peers: no - -localhost_ipv4: - name: 'local' - host: '127.0.0.1' - port: '123' - show_peers: no - -localhost_ipv6: - name: 'local' - host: '::1' - port: '123' - show_peers: no diff --git a/collectors/python.d.plugin/nvidia_smi/README.md b/collectors/python.d.plugin/nvidia_smi/README.md index ce5473c26..7d45289a4 100644 --- a/collectors/python.d.plugin/nvidia_smi/README.md +++ b/collectors/python.d.plugin/nvidia_smi/README.md @@ -4,16 +4,13 @@ custom_edit_url: "https://github.com/netdata/netdata/edit/master/collectors/pyth sidebar_label: "nvidia_smi-python.d.plugin" learn_status: "Published" learn_topic_type: "References" -learn_rel_path: "References/Collectors references/Devices" +learn_rel_path: "Integrations/Monitor/Devices" --> -# Nvidia GPU monitoring with Netdata +# Nvidia GPU collector Monitors performance metrics (memory usage, fan speed, pcie bandwidth utilization, temperature, etc.) using `nvidia-smi` cli tool. -> **Warning**: this collector does not work when the Netdata Agent is [running in a container](https://github.com/netdata/netdata/blob/master/packaging/docker/README.md). - - ## Requirements and Notes - You must have the `nvidia-smi` tool installed and your NVIDIA GPU(s) must support the tool. Mostly the newer high end models used for AI / ML and Crypto or Pro range, read more about [nvidia_smi](https://developer.nvidia.com/nvidia-system-management-interface). @@ -67,3 +64,94 @@ exclude_zero_memory_users : yes ``` +### Troubleshooting + +To troubleshoot issues with the `nvidia_smi` module, run the `python.d.plugin` with the debug option enabled. The +output will give you the output of the data collection job or error messages on why the collector isn't working. + +First, navigate to your plugins directory, usually they are located under `/usr/libexec/netdata/plugins.d/`. If that's +not the case on your system, open `netdata.conf` and look for the setting `plugins directory`. Once you're in the +plugin's directory, switch to the `netdata` user. + +```bash +cd /usr/libexec/netdata/plugins.d/ +sudo su -s /bin/bash netdata +``` + +Now you can manually run the `nvidia_smi` module in debug mode: + +```bash +./python.d.plugin nvidia_smi debug trace +``` + +## Docker + +GPU monitoring in a docker container is possible with [nvidia-container-toolkit](https://docs.nvidia.com/datacenter/cloud-native/container-toolkit/install-guide.html) installed on the host system, and `gcompat` added to the `NETDATA_EXTRA_APK_PACKAGES` environment variable. + +Sample `docker-compose.yml` +```yaml +version: '3' +services: + netdata: + image: netdata/netdata + container_name: netdata + hostname: example.com # set to fqdn of host + ports: + - 19999:19999 + restart: unless-stopped + cap_add: + - SYS_PTRACE + security_opt: + - apparmor:unconfined + environment: + - NETDATA_EXTRA_APK_PACKAGES=gcompat + volumes: + - netdataconfig:/etc/netdata + - netdatalib:/var/lib/netdata + - netdatacache:/var/cache/netdata + - /etc/passwd:/host/etc/passwd:ro + - /etc/group:/host/etc/group:ro + - /proc:/host/proc:ro + - /sys:/host/sys:ro + - /etc/os-release:/host/etc/os-release:ro + deploy: + resources: + reservations: + devices: + - driver: nvidia + count: all + capabilities: [gpu] + +volumes: + netdataconfig: + netdatalib: + netdatacache: +``` + +Sample `docker run` +```yaml +docker run -d --name=netdata \ + -p 19999:19999 \ + -e NETDATA_EXTRA_APK_PACKAGES=gcompat \ + -v netdataconfig:/etc/netdata \ + -v netdatalib:/var/lib/netdata \ + -v netdatacache:/var/cache/netdata \ + -v /etc/passwd:/host/etc/passwd:ro \ + -v /etc/group:/host/etc/group:ro \ + -v /proc:/host/proc:ro \ + -v /sys:/host/sys:ro \ + -v /etc/os-release:/host/etc/os-release:ro \ + --restart unless-stopped \ + --cap-add SYS_PTRACE \ + --security-opt apparmor=unconfined \ + --gpus all \ + netdata/netdata +``` + +### Docker Troubleshooting +To troubleshoot `nvidia-smi` in a docker container, first confirm that `nvidia-smi` is working on the host system. If that is working correctly, run `docker exec -it netdata nvidia-smi` to confirm it's working within the docker container. If `nvidia-smi` is fuctioning both inside and outside of the container, confirm that `nvidia-smi: yes` is uncommented in `python.d.conf`. +```bash +docker exec -it netdata bash +cd /etc/netdata +./edit-config python.d.conf +``` diff --git a/collectors/python.d.plugin/nvidia_smi/metrics.csv b/collectors/python.d.plugin/nvidia_smi/metrics.csv new file mode 100644 index 000000000..683ea5650 --- /dev/null +++ b/collectors/python.d.plugin/nvidia_smi/metrics.csv @@ -0,0 +1,16 @@ +metric,scope,dimensions,unit,description,chart_type,labels,plugin,module +nvidia_smi.pci_bandwidth,GPU,"rx, tx",KiB/s,PCI Express Bandwidth Utilization,area,,python.d.plugin,nvidia_smi +nvidia_smi.pci_bandwidth_percent,GPU,"rx_percent, tx_percent",percentage,PCI Express Bandwidth Percent,area,,python.d.plugin,nvidia_smi +nvidia_smi.fan_speed,GPU,speed,percentage,Fan Speed,line,,python.d.plugin,nvidia_smi +nvidia_smi.gpu_utilization,GPU,utilization,percentage,GPU Utilization,line,,python.d.plugin,nvidia_smi +nvidia_smi.mem_utilization,GPU,utilization,percentage,Memory Bandwidth Utilization,line,,python.d.plugin,nvidia_smi +nvidia_smi.encoder_utilization,GPU,"encoder, decoder",percentage,Encoder/Decoder Utilization,line,,python.d.plugin,nvidia_smi +nvidia_smi.memory_allocated,GPU,"free, used",MiB,Memory Usage,stacked,,python.d.plugin,nvidia_smi +nvidia_smi.bar1_memory_usage,GPU,"free, used",MiB,Bar1 Memory Usage,stacked,,python.d.plugin,nvidia_smi +nvidia_smi.temperature,GPU,temp,celsius,Temperature,line,,python.d.plugin,nvidia_smi +nvidia_smi.clocks,GPU,"graphics, video, sm, mem",MHz,Clock Frequencies,line,,python.d.plugin,nvidia_smi +nvidia_smi.power,GPU,power,Watts,Power Utilization,line,,python.d.plugin,nvidia_smi +nvidia_smi.power_state,GPU,a dimension per {power_state},state,Power State,line,,python.d.plugin,nvidia_smi +nvidia_smi.processes_mem,GPU,a dimension per process,MiB,Memory Used by Each Process,stacked,,python.d.plugin,nvidia_smi +nvidia_smi.user_mem,GPU,a dimension per user,MiB,Memory Used by Each User,stacked,,python.d.plugin,nvidia_smi +nvidia_smi.user_num,GPU,users,num,Number of User on GPU,line,,python.d.plugin,nvidia_smi diff --git a/collectors/python.d.plugin/openldap/README.md b/collectors/python.d.plugin/openldap/README.md index 4f29bbb49..eddf40b2c 100644 --- a/collectors/python.d.plugin/openldap/README.md +++ b/collectors/python.d.plugin/openldap/README.md @@ -4,10 +4,10 @@ custom_edit_url: "https://github.com/netdata/netdata/edit/master/collectors/pyth sidebar_label: "OpenLDAP" learn_status: "Published" learn_topic_type: "References" -learn_rel_path: "References/Collectors references/Networking" +learn_rel_path: "Integrations/Monitor/Networking" --> -# OpenLDAP monitoring with Netdata +# OpenLDAP collector Provides statistics information from openldap (slapd) server. Statistics are taken from LDAP monitoring interface. Manual page, slapd-monitor(5) is available. @@ -77,6 +77,26 @@ openldap: port : 389 ``` ---- + +### Troubleshooting + +To troubleshoot issues with the `openldap` module, run the `python.d.plugin` with the debug option enabled. The +output will give you the output of the data collection job or error messages on why the collector isn't working. + +First, navigate to your plugins directory, usually they are located under `/usr/libexec/netdata/plugins.d/`. If that's +not the case on your system, open `netdata.conf` and look for the setting `plugins directory`. Once you're in the +plugin's directory, switch to the `netdata` user. + +```bash +cd /usr/libexec/netdata/plugins.d/ +sudo su -s /bin/bash netdata +``` + +Now you can manually run the `openldap` module in debug mode: + +```bash +./python.d.plugin openldap debug trace +``` + diff --git a/collectors/python.d.plugin/openldap/metrics.csv b/collectors/python.d.plugin/openldap/metrics.csv new file mode 100644 index 000000000..0386b8896 --- /dev/null +++ b/collectors/python.d.plugin/openldap/metrics.csv @@ -0,0 +1,8 @@ +metric,scope,dimensions,unit,description,chart_type,labels,plugin,module +openldap.total_connections,,connections,connections/s,Total Connections,line,,python.d.plugin,openldap +openldap.traffic_stats,,sent,KiB/s,Traffic,line,,python.d.plugin,openldap +openldap.operations_status,,"completed, initiated",ops/s,Operations Status,line,,python.d.plugin,openldap +openldap.referrals,,sent,referrals/s,Referrals,line,,python.d.plugin,openldap +openldap.entries,,sent,entries/s,Entries,line,,python.d.plugin,openldap +openldap.ldap_operations,,"bind, search, unbind, add, delete, modify, compare",ops/s,Operations,line,,python.d.plugin,openldap +openldap.waiters,,"write, read",waiters/s,Waiters,line,,python.d.plugin,openldap diff --git a/collectors/python.d.plugin/oracledb/README.md b/collectors/python.d.plugin/oracledb/README.md index 78f807d61..722c77b75 100644 --- a/collectors/python.d.plugin/oracledb/README.md +++ b/collectors/python.d.plugin/oracledb/README.md @@ -4,10 +4,10 @@ custom_edit_url: "https://github.com/netdata/netdata/edit/master/collectors/pyth sidebar_label: "OracleDB" learn_status: "Published" learn_topic_type: "References" -learn_rel_path: "References/Collectors references/Databases" +learn_rel_path: "Integrations/Monitor/Databases" --> -# OracleDB monitoring with Netdata +# OracleDB collector Monitors the performance and health metrics of the Oracle database. @@ -98,3 +98,23 @@ remote: All parameters are required. Without them module will fail to start. +### Troubleshooting + +To troubleshoot issues with the `oracledb` module, run the `python.d.plugin` with the debug option enabled. The +output will give you the output of the data collection job or error messages on why the collector isn't working. + +First, navigate to your plugins directory, usually they are located under `/usr/libexec/netdata/plugins.d/`. If that's +not the case on your system, open `netdata.conf` and look for the setting `plugins directory`. Once you're in the +plugin's directory, switch to the `netdata` user. + +```bash +cd /usr/libexec/netdata/plugins.d/ +sudo su -s /bin/bash netdata +``` + +Now you can manually run the `oracledb` module in debug mode: + +```bash +./python.d.plugin oracledb debug trace +``` + diff --git a/collectors/python.d.plugin/oracledb/metrics.csv b/collectors/python.d.plugin/oracledb/metrics.csv new file mode 100644 index 000000000..126c5c4c5 --- /dev/null +++ b/collectors/python.d.plugin/oracledb/metrics.csv @@ -0,0 +1,23 @@ +metric,scope,dimensions,unit,description,chart_type,labels,plugin,module +oracledb.session_count,,"total, active",sessions,Session Count,line,,python.d.plugin,oracledb +oracledb.session_limit_usage,,usage,%,Session Limit Usage,area,,python.d.plugin,oracledb +oracledb.logons,,logons,events/s,Logons,area,,python.d.plugin,oracledb +oracledb.physical_disk_read_writes,,"reads, writes",events/s,Physical Disk Reads/Writes,area,,python.d.plugin,oracledb +oracledb.sorts_on_disks,,sorts,events/s,Sorts On Disk,line,,python.d.plugin,oracledb +oracledb.full_table_scans,,full table scans,events/s,Full Table Scans,line,,python.d.plugin,oracledb +oracledb.database_wait_time_ratio,,wait time ratio,%,Database Wait Time Ratio,line,,python.d.plugin,oracledb +oracledb.shared_pool_free_memory,,free memory,%,Shared Pool Free Memory,line,,python.d.plugin,oracledb +oracledb.in_memory_sorts_ratio,,in-memory sorts,%,In-Memory Sorts Ratio,line,,python.d.plugin,oracledb +oracledb.sql_service_response_time,,time,seconds,SQL Service Response Time,line,,python.d.plugin,oracledb +oracledb.user_rollbacks,,rollbacks,events/s,User Rollbacks,line,,python.d.plugin,oracledb +oracledb.enqueue_timeouts,,enqueue timeouts,events/s,Enqueue Timeouts,line,,python.d.plugin,oracledb +oracledb.cache_hit_ration,,"buffer, cursor, library, row",%,Cache Hit Ratio,stacked,,python.d.plugin,oracledb +oracledb.global_cache_blocks,,"corrupted, lost",events/s,Global Cache Blocks Events,area,,python.d.plugin,oracledb +oracledb.activity,,"parse count, execute count, user commits, user rollbacks",events/s,Activities,stacked,,python.d.plugin,oracledb +oracledb.wait_time,,"application, configuration, administrative, concurrency, commit, network, user I/O, system I/O, scheduler, other",ms,Wait Time,stacked,,python.d.plugin,oracledb +oracledb.tablespace_size,,a dimension per active tablespace,KiB,Size,line,,python.d.plugin,oracledb +oracledb.tablespace_usage,,a dimension per active tablespace,KiB,Usage,line,,python.d.plugin,oracledb +oracledb.tablespace_usage_in_percent,,a dimension per active tablespace,%,Usage,line,,python.d.plugin,oracledb +oracledb.allocated_size,,a dimension per active tablespace,B,Size,line,,python.d.plugin,oracledb +oracledb.allocated_usage,,a dimension per active tablespace,B,Usage,line,,python.d.plugin,oracledb +oracledb.allocated_usage_in_percent,,a dimension per active tablespace,%,Usage,line,,python.d.plugin,oracledb diff --git a/collectors/python.d.plugin/pandas/README.md b/collectors/python.d.plugin/pandas/README.md index 141549478..19b11d5be 100644 --- a/collectors/python.d.plugin/pandas/README.md +++ b/collectors/python.d.plugin/pandas/README.md @@ -1,16 +1,15 @@ -<!-- -title: "Pandas" -custom_edit_url: https://github.com/netdata/netdata/edit/master/collectors/python.d.plugin/pandas/README.md ---> - -# Pandas Netdata Collector +# Ingest structured data (Pandas) <a href="https://pandas.pydata.org/" target="_blank"> <img src="https://pandas.pydata.org/docs/_static/pandas.svg" alt="Pandas" width="100px" height="50px" /> </a> -A python collector using [pandas](https://pandas.pydata.org/) to pull data and do pandas based -preprocessing before feeding to Netdata. +[Pandas](https://pandas.pydata.org/) is a de-facto standard in reading and processing most types of structured data in Python. +If you have metrics appearing in a CSV, JSON, XML, HTML, or [other supported format](https://pandas.pydata.org/docs/user_guide/io.html), +either locally or via some HTTP endpoint, you can easily ingest and present those metrics in Netdata, by leveraging the Pandas collector. + +The collector uses [pandas](https://pandas.pydata.org/) to pull data and do pandas-based +preprocessing, before feeding to Netdata. ## Requirements @@ -20,6 +19,12 @@ This collector depends on some Python (Python 3 only) packages that can usually sudo pip install pandas requests ``` +Note: If you would like to use [`pandas.read_sql`](https://pandas.pydata.org/docs/reference/api/pandas.read_sql.html) to query a database, you will need to install the below packages as well. + +```bash +sudo pip install 'sqlalchemy<2.0' psycopg2-binary +``` + ## Configuration Below is an example configuration to query some json weather data from [Open-Meteo](https://open-meteo.com), @@ -66,12 +71,11 @@ temperature: `chart_configs` is a list of dictionary objects where each one defines the sequence of `df_steps` to be run using [`pandas`](https://pandas.pydata.org/), and the `name`, `title` etc to define the -[CHART variables](https://learn.netdata.cloud/docs/agent/collectors/python.d.plugin#global-variables-order-and-chart) +[CHART variables](https://github.com/netdata/netdata/blob/master/docs/guides/python-collector.md#create-charts) that will control how the results will look in netdata. The example configuration above would result in a `data` dictionary like the below being collected by Netdata -at each time step. They keys in this dictionary will be the -[dimension](https://learn.netdata.cloud/docs/agent/web#dimensions) names on the chart. +at each time step. They keys in this dictionary will be the "dimensions" of the chart. ```javascript {'athens_max': 26.2, 'athens_mean': 19.45952380952381, 'athens_min': 12.2, 'berlin_max': 17.4, 'berlin_mean': 10.764285714285714, 'berlin_min': 5.7, 'dublin_max': 15.3, 'dublin_mean': 12.008928571428571, 'dublin_min': 6.6, 'london_max': 18.9, 'london_mean': 12.510714285714286, 'london_min': 5.2, 'paris_max': 19.4, 'paris_mean': 12.054166666666665, 'paris_min': 4.8} diff --git a/collectors/python.d.plugin/pandas/pandas.chart.py b/collectors/python.d.plugin/pandas/pandas.chart.py index 8eb4452fb..7977bcb36 100644 --- a/collectors/python.d.plugin/pandas/pandas.chart.py +++ b/collectors/python.d.plugin/pandas/pandas.chart.py @@ -3,6 +3,7 @@ # Author: Andrew Maguire (andrewm4894) # SPDX-License-Identifier: GPL-3.0-or-later +import os import pandas as pd try: @@ -11,6 +12,12 @@ try: except ImportError: HAS_REQUESTS = False +try: + from sqlalchemy import create_engine + HAS_SQLALCHEMY = True +except ImportError: + HAS_SQLALCHEMY = False + from bases.FrameworkServices.SimpleService import SimpleService ORDER = [] @@ -46,7 +53,10 @@ class Service(SimpleService): """ensure charts and dims all configured and that we can get data""" if not HAS_REQUESTS: - self.warn('requests library could not be imported') + self.warning('requests library could not be imported') + + if not HAS_SQLALCHEMY: + self.warning('sqlalchemy library could not be imported') if not self.chart_configs: self.error('chart_configs must be defined') diff --git a/collectors/python.d.plugin/pandas/pandas.conf b/collectors/python.d.plugin/pandas/pandas.conf index 6684af9d5..ca523ed36 100644 --- a/collectors/python.d.plugin/pandas/pandas.conf +++ b/collectors/python.d.plugin/pandas/pandas.conf @@ -188,4 +188,26 @@ update_every: 5 # df_steps: > # pd.read_xml('http://metwdb-openaccess.ichec.ie/metno-wdb2ts/locationforecast?lat=54.7210798611;long=-8.7237392806', xpath='./product/time[1]/location/temperature', parser='etree')| # df.rename(columns={'value': 'dublin'})| -# df[['dublin']]|
\ No newline at end of file +# df[['dublin']]| + +# example showing a read_sql from a postgres database using sqlalchemy. +# note: example assumes a running postgress db on localhost with a netdata users and password netdata. +# sql: +# name: "sql" +# update_every: 5 +# chart_configs: +# - name: "sql" +# title: "SQL Example" +# family: "sql.example" +# context: "example" +# type: "line" +# units: "percent" +# df_steps: > +# pd.read_sql_query( +# sql='\ +# select \ +# random()*100 as metric_1, \ +# random()*100 as metric_2 \ +# ', +# con=create_engine('postgresql://localhost/postgres?user=netdata&password=netdata') +# ); diff --git a/collectors/python.d.plugin/postfix/README.md b/collectors/python.d.plugin/postfix/README.md index 8d646ad51..ba5565499 100644 --- a/collectors/python.d.plugin/postfix/README.md +++ b/collectors/python.d.plugin/postfix/README.md @@ -4,10 +4,10 @@ custom_edit_url: "https://github.com/netdata/netdata/edit/master/collectors/pyth sidebar_label: "Postfix" learn_status: "Published" learn_topic_type: "References" -learn_rel_path: "References/Collectors references/Webapps" +learn_rel_path: "Integrations/Monitor/Webapps" --> -# Postfix monitoring with Netdata +# Postfix collector Monitors MTA email queue statistics using [postqueue](http://www.postfix.org/postqueue.1.html) tool. @@ -37,3 +37,23 @@ It produces only two charts: ## Configuration Configuration is not needed. +### Troubleshooting + +To troubleshoot issues with the `postfix` module, run the `python.d.plugin` with the debug option enabled. The +output will give you the output of the data collection job or error messages on why the collector isn't working. + +First, navigate to your plugins directory, usually they are located under `/usr/libexec/netdata/plugins.d/`. If that's +not the case on your system, open `netdata.conf` and look for the setting `plugins directory`. Once you're in the +plugin's directory, switch to the `netdata` user. + +```bash +cd /usr/libexec/netdata/plugins.d/ +sudo su -s /bin/bash netdata +``` + +Now you can manually run the `postfix` module in debug mode: + +```bash +./python.d.plugin postfix debug trace +``` + diff --git a/collectors/python.d.plugin/postfix/metrics.csv b/collectors/python.d.plugin/postfix/metrics.csv new file mode 100644 index 000000000..696f6ad3a --- /dev/null +++ b/collectors/python.d.plugin/postfix/metrics.csv @@ -0,0 +1,3 @@ +metric,scope,dimensions,unit,description,chart_type,labels,plugin,module +postfix.qemails,,emails,emails,Postfix Queue Emails,line,,python.d.plugin,postfix +postfix.qsize,,size,KiB,Postfix Queue Emails Size,area,,python.d.plugin,postfix diff --git a/collectors/python.d.plugin/proxysql/Makefile.inc b/collectors/python.d.plugin/proxysql/Makefile.inc deleted file mode 100644 index 66be372ce..000000000 --- a/collectors/python.d.plugin/proxysql/Makefile.inc +++ /dev/null @@ -1,13 +0,0 @@ -# SPDX-License-Identifier: GPL-3.0-or-later - -# THIS IS NOT A COMPLETE Makefile -# IT IS INCLUDED BY ITS PARENT'S Makefile.am -# IT IS REQUIRED TO REFERENCE ALL FILES RELATIVE TO THE PARENT - -# install these files -dist_python_DATA += proxysql/proxysql.chart.py -dist_pythonconfig_DATA += proxysql/proxysql.conf - -# do not install these files, but include them in the distribution -dist_noinst_DATA += proxysql/README.md proxysql/Makefile.inc - diff --git a/collectors/python.d.plugin/proxysql/README.md b/collectors/python.d.plugin/proxysql/README.md deleted file mode 100644 index d6c626b51..000000000 --- a/collectors/python.d.plugin/proxysql/README.md +++ /dev/null @@ -1,14 +0,0 @@ -<!-- -title: "ProxySQL monitoring with Netdata" -custom_edit_url: "https://github.com/netdata/netdata/edit/master/collectors/python.d.plugin/proxysql/README.md" -sidebar_label: "proxysql-python.d.plugin" -learn_status: "Published" -learn_topic_type: "References" -learn_rel_path: "References/Collectors references/Databases" ---> - -# ProxySQL monitoring with Netdata - -This collector is deprecated. -Use [go.d/proxysql](https://github.com/netdata/go.d.plugin/tree/master/modules/proxysql#proxysql-monitoring-with-netdata) -instead.
\ No newline at end of file diff --git a/collectors/python.d.plugin/proxysql/proxysql.chart.py b/collectors/python.d.plugin/proxysql/proxysql.chart.py deleted file mode 100644 index 7e06b7bdc..000000000 --- a/collectors/python.d.plugin/proxysql/proxysql.chart.py +++ /dev/null @@ -1,354 +0,0 @@ -# -*- coding: utf-8 -*- -# Description: Proxysql netdata python.d module -# Author: Ali Borhani (alibo) -# SPDX-License-Identifier: GPL-3.0+ - -from bases.FrameworkServices.MySQLService import MySQLService - - -disabled_by_default = True - -def query(table, *params): - return 'SELECT {params} FROM {table}'.format(table=table, params=', '.join(params)) - - -# https://github.com/sysown/proxysql/blob/master/doc/admin_tables.md#stats_mysql_global -QUERY_GLOBAL = query( - "stats_mysql_global", - "Variable_Name", - "Variable_Value" -) - -# https://github.com/sysown/proxysql/blob/master/doc/admin_tables.md#stats_mysql_connection_pool -QUERY_CONNECTION_POOL = query( - "stats_mysql_connection_pool", - "hostgroup", - "srv_host", - "srv_port", - "status", - "ConnUsed", - "ConnFree", - "ConnOK", - "ConnERR", - "Queries", - "Bytes_data_sent", - "Bytes_data_recv", - "Latency_us" -) - -# https://github.com/sysown/proxysql/blob/master/doc/admin_tables.md#stats_mysql_commands_counters -QUERY_COMMANDS = query( - "stats_mysql_commands_counters", - "Command", - "Total_Time_us", - "Total_cnt", - "cnt_100us", - "cnt_500us", - "cnt_1ms", - "cnt_5ms", - "cnt_10ms", - "cnt_50ms", - "cnt_100ms", - "cnt_500ms", - "cnt_1s", - "cnt_5s", - "cnt_10s", - "cnt_INFs" -) - -GLOBAL_STATS = [ - 'client_connections_aborted', - 'client_connections_connected', - 'client_connections_created', - 'client_connections_non_idle', - 'proxysql_uptime', - 'questions', - 'slow_queries' -] - -CONNECTION_POOL_STATS = [ - 'status', - 'connused', - 'connfree', - 'connok', - 'connerr', - 'queries', - 'bytes_data_sent', - 'bytes_data_recv', - 'latency_us' -] - -ORDER = [ - 'connections', - 'active_transactions', - 'questions', - 'pool_overall_net', - 'commands_count', - 'commands_duration', - 'pool_status', - 'pool_net', - 'pool_queries', - 'pool_latency', - 'pool_connection_used', - 'pool_connection_free', - 'pool_connection_ok', - 'pool_connection_error' -] - -HISTOGRAM_ORDER = [ - '100us', - '500us', - '1ms', - '5ms', - '10ms', - '50ms', - '100ms', - '500ms', - '1s', - '5s', - '10s', - 'inf' -] - -STATUS = { - "ONLINE": 1, - "SHUNNED": 2, - "OFFLINE_SOFT": 3, - "OFFLINE_HARD": 4 -} - -CHARTS = { - 'pool_status': { - 'options': [None, 'ProxySQL Backend Status', 'status', 'status', 'proxysql.pool_status', 'line'], - 'lines': [] - }, - 'pool_net': { - 'options': [None, 'ProxySQL Backend Bandwidth', 'kilobits/s', 'bandwidth', 'proxysql.pool_net', 'area'], - 'lines': [] - }, - 'pool_overall_net': { - 'options': [None, 'ProxySQL Backend Overall Bandwidth', 'kilobits/s', 'overall_bandwidth', - 'proxysql.pool_overall_net', 'area'], - 'lines': [ - ['bytes_data_recv', 'in', 'incremental', 8, 1000], - ['bytes_data_sent', 'out', 'incremental', -8, 1000] - ] - }, - 'questions': { - 'options': [None, 'ProxySQL Frontend Questions', 'questions/s', 'questions', 'proxysql.questions', 'line'], - 'lines': [ - ['questions', 'questions', 'incremental'], - ['slow_queries', 'slow_queries', 'incremental'] - ] - }, - 'pool_queries': { - 'options': [None, 'ProxySQL Backend Queries', 'queries/s', 'queries', 'proxysql.queries', 'line'], - 'lines': [] - }, - 'active_transactions': { - 'options': [None, 'ProxySQL Frontend Active Transactions', 'transactions/s', 'active_transactions', - 'proxysql.active_transactions', 'line'], - 'lines': [ - ['active_transactions', 'active_transactions', 'absolute'] - ] - }, - 'pool_latency': { - 'options': [None, 'ProxySQL Backend Latency', 'milliseconds', 'latency', 'proxysql.latency', 'line'], - 'lines': [] - }, - 'connections': { - 'options': [None, 'ProxySQL Frontend Connections', 'connections/s', 'connections', 'proxysql.connections', - 'line'], - 'lines': [ - ['client_connections_connected', 'connected', 'absolute'], - ['client_connections_created', 'created', 'incremental'], - ['client_connections_aborted', 'aborted', 'incremental'], - ['client_connections_non_idle', 'non_idle', 'absolute'] - ] - }, - 'pool_connection_used': { - 'options': [None, 'ProxySQL Used Connections', 'connections', 'pool_connections', - 'proxysql.pool_used_connections', 'line'], - 'lines': [] - }, - 'pool_connection_free': { - 'options': [None, 'ProxySQL Free Connections', 'connections', 'pool_connections', - 'proxysql.pool_free_connections', 'line'], - 'lines': [] - }, - 'pool_connection_ok': { - 'options': [None, 'ProxySQL Established Connections', 'connections', 'pool_connections', - 'proxysql.pool_ok_connections', 'line'], - 'lines': [] - }, - 'pool_connection_error': { - 'options': [None, 'ProxySQL Error Connections', 'connections', 'pool_connections', - 'proxysql.pool_error_connections', 'line'], - 'lines': [] - }, - 'commands_count': { - 'options': [None, 'ProxySQL Commands', 'commands', 'commands', 'proxysql.commands_count', 'line'], - 'lines': [] - }, - 'commands_duration': { - 'options': [None, 'ProxySQL Commands Duration', 'milliseconds', 'commands', 'proxysql.commands_duration', - 'line'], - 'lines': [] - } -} - - -class Service(MySQLService): - def __init__(self, configuration=None, name=None): - MySQLService.__init__(self, configuration=configuration, name=name) - self.order = ORDER - self.definitions = CHARTS - self.queries = dict( - global_status=QUERY_GLOBAL, - connection_pool_status=QUERY_CONNECTION_POOL, - commands_status=QUERY_COMMANDS - ) - - def _get_data(self): - raw_data = self._get_raw_data(description=True) - - if not raw_data: - return None - - to_netdata = dict() - - if 'global_status' in raw_data: - global_status = dict(raw_data['global_status'][0]) - for key in global_status: - if key.lower() in GLOBAL_STATS: - to_netdata[key.lower()] = global_status[key] - - if 'connection_pool_status' in raw_data: - - to_netdata['bytes_data_recv'] = 0 - to_netdata['bytes_data_sent'] = 0 - - for record in raw_data['connection_pool_status'][0]: - backend = self.generate_backend(record) - name = self.generate_backend_name(backend) - - for key in backend: - if key in CONNECTION_POOL_STATS: - if key == 'status': - backend[key] = self.convert_status(backend[key]) - - if len(self.charts) > 0: - if (name + '_status') not in self.charts['pool_status']: - self.add_backend_dimensions(name) - - to_netdata["{0}_{1}".format(name, key)] = backend[key] - - if key == 'bytes_data_recv': - to_netdata['bytes_data_recv'] += int(backend[key]) - - if key == 'bytes_data_sent': - to_netdata['bytes_data_sent'] += int(backend[key]) - - if 'commands_status' in raw_data: - for record in raw_data['commands_status'][0]: - cmd = self.generate_command_stats(record) - name = cmd['name'] - - if len(self.charts) > 0: - if (name + '_count') not in self.charts['commands_count']: - self.add_command_dimensions(name) - self.add_histogram_chart(cmd) - - to_netdata[name + '_count'] = cmd['count'] - to_netdata[name + '_duration'] = cmd['duration'] - for histogram in cmd['histogram']: - dimId = 'commands_histogram_{0}_{1}'.format(name, histogram) - to_netdata[dimId] = cmd['histogram'][histogram] - - return to_netdata or None - - def add_backend_dimensions(self, name): - self.charts['pool_status'].add_dimension([name + '_status', name, 'absolute']) - self.charts['pool_net'].add_dimension([name + '_bytes_data_recv', 'from_' + name, 'incremental', 8, 1024]) - self.charts['pool_net'].add_dimension([name + '_bytes_data_sent', 'to_' + name, 'incremental', -8, 1024]) - self.charts['pool_queries'].add_dimension([name + '_queries', name, 'incremental']) - self.charts['pool_latency'].add_dimension([name + '_latency_us', name, 'absolute', 1, 1000]) - self.charts['pool_connection_used'].add_dimension([name + '_connused', name, 'absolute']) - self.charts['pool_connection_free'].add_dimension([name + '_connfree', name, 'absolute']) - self.charts['pool_connection_ok'].add_dimension([name + '_connok', name, 'incremental']) - self.charts['pool_connection_error'].add_dimension([name + '_connerr', name, 'incremental']) - - def add_command_dimensions(self, cmd): - self.charts['commands_count'].add_dimension([cmd + '_count', cmd, 'incremental']) - self.charts['commands_duration'].add_dimension([cmd + '_duration', cmd, 'incremental', 1, 1000]) - - def add_histogram_chart(self, cmd): - chart = self.charts.add_chart(self.histogram_chart(cmd)) - - for histogram in HISTOGRAM_ORDER: - dimId = 'commands_histogram_{0}_{1}'.format(cmd['name'], histogram) - chart.add_dimension([dimId, histogram, 'incremental']) - - @staticmethod - def histogram_chart(cmd): - return [ - 'commands_histogram_' + cmd['name'], - None, - 'ProxySQL {0} Command Histogram'.format(cmd['name'].title()), - 'commands', - 'commands_histogram', - 'proxysql.commands_histogram_' + cmd['name'], - 'stacked' - ] - - @staticmethod - def generate_backend(data): - return { - 'hostgroup': data[0], - 'srv_host': data[1], - 'srv_port': data[2], - 'status': data[3], - 'connused': data[4], - 'connfree': data[5], - 'connok': data[6], - 'connerr': data[7], - 'queries': data[8], - 'bytes_data_sent': data[9], - 'bytes_data_recv': data[10], - 'latency_us': data[11] - } - - @staticmethod - def generate_command_stats(data): - return { - 'name': data[0].lower(), - 'duration': data[1], - 'count': data[2], - 'histogram': { - '100us': data[3], - '500us': data[4], - '1ms': data[5], - '5ms': data[6], - '10ms': data[7], - '50ms': data[8], - '100ms': data[9], - '500ms': data[10], - '1s': data[11], - '5s': data[12], - '10s': data[13], - 'inf': data[14] - } - } - - @staticmethod - def generate_backend_name(backend): - hostgroup = backend['hostgroup'].replace(' ', '_').lower() - host = backend['srv_host'].replace('.', '_') - - return "{0}_{1}_{2}".format(hostgroup, host, backend['srv_port']) - - @staticmethod - def convert_status(status): - if status in STATUS: - return STATUS[status] - return -1 diff --git a/collectors/python.d.plugin/proxysql/proxysql.conf b/collectors/python.d.plugin/proxysql/proxysql.conf deleted file mode 100644 index 3c503a895..000000000 --- a/collectors/python.d.plugin/proxysql/proxysql.conf +++ /dev/null @@ -1,116 +0,0 @@ -# netdata python.d.plugin configuration for ProxySQL -# -# This file is in YaML format. Generally the format is: -# -# name: value -# -# There are 2 sections: -# - global variables -# - one or more JOBS -# -# JOBS allow you to collect values from multiple sources. -# Each source will have its own set of charts. -# -# JOB parameters have to be indented (using spaces only, example below). - -# ---------------------------------------------------------------------- -# Global Variables -# These variables set the defaults for all JOBs, however each JOB -# may define its own, overriding the defaults. - -# update_every sets the default data collection frequency. -# If unset, the python.d.plugin default is used. -# update_every: 1 - -# priority controls the order of charts at the netdata dashboard. -# Lower numbers move the charts towards the top of the page. -# If unset, the default for python.d.plugin is used. -# priority: 60000 - -# penalty indicates whether to apply penalty to update_every in case of failures. -# Penalty will increase every 5 failed updates in a row. Maximum penalty is 10 minutes. -# penalty: yes - -# autodetection_retry sets the job re-check interval in seconds. -# The job is not deleted if check fails. -# Attempts to start the job are made once every autodetection_retry. -# This feature is disabled by default. -# autodetection_retry: 0 - -# ---------------------------------------------------------------------- -# JOBS (data collection sources) -# -# The default JOBS share the same *name*. JOBS with the same name -# are mutually exclusive. Only one of them will be allowed running at -# any time. This allows autodetection to try several alternatives and -# pick the one that works. -# -# Any number of jobs is supported. -# -# All python.d.plugin JOBS (for all its modules) support a set of -# predefined parameters. These are: -# -# job_name: -# name: myname # the JOB's name as it will appear at the -# # dashboard (by default is the job_name) -# # JOBs sharing a name are mutually exclusive -# update_every: 1 # the JOB's data collection frequency -# priority: 60000 # the JOB's order on the dashboard -# penalty: yes # the JOB's penalty -# autodetection_retry: 0 # the JOB's re-check interval in seconds -# -# Additionally to the above, proxysql also supports the following: -# -# host: 'IP or HOSTNAME' # the host to connect to -# port: PORT # the port to connect to -# -# in all cases, the following can also be set: -# -# user: 'username' # the proxysql username to use -# pass: 'password' # the proxysql password to use -# - -# AUTO-DETECTION JOBS -# only one of them will run (they have the same name) - -tcp: - name : 'local' - user : 'stats' - pass : 'stats' - host : 'localhost' - port : '6032' - -tcpipv4: - name : 'local' - user : 'stats' - pass : 'stats' - host : '127.0.0.1' - port : '6032' - -tcpipv6: - name : 'local' - user : 'stats' - pass : 'stats' - host : '::1' - port : '6032' - -tcp_admin: - name : 'local' - user : 'admin' - pass : 'admin' - host : 'localhost' - port : '6032' - -tcpipv4_admin: - name : 'local' - user : 'admin' - pass : 'admin' - host : '127.0.0.1' - port : '6032' - -tcpipv6_admin: - name : 'local' - user : 'admin' - pass : 'admin' - host : '::1' - port : '6032' diff --git a/collectors/python.d.plugin/puppet/README.md b/collectors/python.d.plugin/puppet/README.md index 8b98b8a2d..3b0c55b97 100644 --- a/collectors/python.d.plugin/puppet/README.md +++ b/collectors/python.d.plugin/puppet/README.md @@ -4,10 +4,10 @@ custom_edit_url: "https://github.com/netdata/netdata/edit/master/collectors/pyth sidebar_label: "Puppet" learn_status: "Published" learn_topic_type: "References" -learn_rel_path: "References/Collectors references/Provisioning tools" +learn_rel_path: "Integrations/Monitor/Provisioning tools" --> -# Puppet monitoring with Netdata +# Puppet collector Monitor status of Puppet Server and Puppet DB. @@ -65,6 +65,26 @@ When no configuration is given, module uses `https://fqdn.example.com:8140`. - Secure PuppetDB config may require client certificate. Not applies to default PuppetDB configuration though. ---- + +### Troubleshooting + +To troubleshoot issues with the `puppet` module, run the `python.d.plugin` with the debug option enabled. The +output will give you the output of the data collection job or error messages on why the collector isn't working. + +First, navigate to your plugins directory, usually they are located under `/usr/libexec/netdata/plugins.d/`. If that's +not the case on your system, open `netdata.conf` and look for the setting `plugins directory`. Once you're in the +plugin's directory, switch to the `netdata` user. + +```bash +cd /usr/libexec/netdata/plugins.d/ +sudo su -s /bin/bash netdata +``` + +Now you can manually run the `puppet` module in debug mode: + +```bash +./python.d.plugin puppet debug trace +``` + diff --git a/collectors/python.d.plugin/puppet/metrics.csv b/collectors/python.d.plugin/puppet/metrics.csv new file mode 100644 index 000000000..1ec99e10e --- /dev/null +++ b/collectors/python.d.plugin/puppet/metrics.csv @@ -0,0 +1,5 @@ +metric,scope,dimensions,unit,description,chart_type,labels,plugin,module +puppet.jvm,,"committed, used",MiB,JVM Heap,area,,python.d.plugin,puppet +puppet.jvm,,"committed, used",MiB,JVM Non-Heap,area,,python.d.plugin,puppet +puppet.cpu,,"execution, GC",percentage,CPU usage,stacked,,python.d.plugin,puppet +puppet.fdopen,,used,descriptors,File Descriptors,line,,python.d.plugin,puppet diff --git a/collectors/python.d.plugin/python.d.conf b/collectors/python.d.plugin/python.d.conf index 41385dac6..3953ce2b4 100644 --- a/collectors/python.d.plugin/python.d.conf +++ b/collectors/python.d.plugin/python.d.conf @@ -56,14 +56,11 @@ hpssa: no # monit: yes # nvidia_smi: yes # nsd: yes -# ntpd: yes # openldap: yes # oracledb: yes # pandas: yes # postfix: yes -# proxysql: yes # puppet: yes -# rabbitmq: yes # rethinkdbs: yes # retroshare: yes # riakkv: yes diff --git a/collectors/python.d.plugin/rabbitmq/Makefile.inc b/collectors/python.d.plugin/rabbitmq/Makefile.inc deleted file mode 100644 index 7e67ef512..000000000 --- a/collectors/python.d.plugin/rabbitmq/Makefile.inc +++ /dev/null @@ -1,13 +0,0 @@ -# SPDX-License-Identifier: GPL-3.0-or-later - -# THIS IS NOT A COMPLETE Makefile -# IT IS INCLUDED BY ITS PARENT'S Makefile.am -# IT IS REQUIRED TO REFERENCE ALL FILES RELATIVE TO THE PARENT - -# install these files -dist_python_DATA += rabbitmq/rabbitmq.chart.py -dist_pythonconfig_DATA += rabbitmq/rabbitmq.conf - -# do not install these files, but include them in the distribution -dist_noinst_DATA += rabbitmq/README.md rabbitmq/Makefile.inc - diff --git a/collectors/python.d.plugin/rabbitmq/README.md b/collectors/python.d.plugin/rabbitmq/README.md deleted file mode 100644 index 19df65694..000000000 --- a/collectors/python.d.plugin/rabbitmq/README.md +++ /dev/null @@ -1,141 +0,0 @@ -<!-- -title: "RabbitMQ monitoring with Netdata" -custom_edit_url: "https://github.com/netdata/netdata/edit/master/collectors/python.d.plugin/rabbitmq/README.md" -sidebar_label: "rabbitmq-python.d.plugin" -learn_status: "Published" -learn_topic_type: "References" -learn_rel_path: "References/Collectors references/Message brokers" ---> - -# RabbitMQ monitoring with Netdata - -Collects message broker global and per virtual host metrics. - - -Following charts are drawn: - -1. **Queued Messages** - - - ready - - unacknowledged - -2. **Message Rates** - - - ack - - redelivered - - deliver - - publish - -3. **Global Counts** - - - channels - - consumers - - connections - - queues - - exchanges - -4. **File Descriptors** - - - used descriptors - -5. **Socket Descriptors** - - - used descriptors - -6. **Erlang processes** - - - used processes - -7. **Erlang run queue** - - - Erlang run queue - -8. **Memory** - - - free memory in megabytes - -9. **Disk Space** - - - free disk space in gigabytes - - -Per Vhost charts: - -1. **Vhost Messages** - - - ack - - confirm - - deliver - - get - - get_no_ack - - publish - - redeliver - - return_unroutable - -2. Per Queue charts: - - 1. **Queued Messages** - - - messages - - paged_out - - persistent - - ready - - unacknowledged - - 2. **Queue Messages stats** - - - ack - - confirm - - deliver - - get - - get_no_ack - - publish - - redeliver - - return_unroutable - -## Configuration - -Edit the `python.d/rabbitmq.conf` configuration file using `edit-config` from the Netdata [config -directory](https://github.com/netdata/netdata/blob/master/docs/configure/nodes.md), which is typically at `/etc/netdata`. - -```bash -cd /etc/netdata # Replace this path with your Netdata config directory, if different -sudo ./edit-config python.d/rabbitmq.conf -``` - -When no configuration file is found, module tries to connect to: `localhost:15672`. - -```yaml -socket: - name : 'local' - host : '127.0.0.1' - port : 15672 - user : 'guest' - pass : 'guest' -``` - ---- - -### Per-Queue Chart configuration - -RabbitMQ users with the "monitoring" tag cannot see all queue data. You'll need a user with read permissions. -To create a dedicated user for netdata: - -```bash -rabbitmqctl add_user netdata ChangeThisSuperSecretPassword -rabbitmqctl set_permissions netdata "^$" "^$" ".*" -``` - -See [set_permissions](https://www.rabbitmq.com/rabbitmqctl.8.html#set_permissions) for details. - -Once the user is set up, add `collect_queues_metrics: yes` to your `rabbitmq.conf`: - -```yaml -local: - name : 'local' - host : '127.0.0.1' - port : 15672 - user : 'netdata' - pass : 'ChangeThisSuperSecretPassword' - collect_queues_metrics : 'yes' -``` diff --git a/collectors/python.d.plugin/rabbitmq/rabbitmq.chart.py b/collectors/python.d.plugin/rabbitmq/rabbitmq.chart.py deleted file mode 100644 index 866b777f7..000000000 --- a/collectors/python.d.plugin/rabbitmq/rabbitmq.chart.py +++ /dev/null @@ -1,443 +0,0 @@ -# -*- coding: utf-8 -*- -# Description: rabbitmq netdata python.d module -# Author: ilyam8 -# SPDX-License-Identifier: GPL-3.0-or-later - -from json import loads - -from bases.FrameworkServices.UrlService import UrlService - -API_NODE = 'api/nodes' -API_OVERVIEW = 'api/overview' -API_QUEUES = 'api/queues' -API_VHOSTS = 'api/vhosts' - -NODE_STATS = [ - 'fd_used', - 'mem_used', - 'sockets_used', - 'proc_used', - 'disk_free', - 'run_queue' -] - -OVERVIEW_STATS = [ - 'object_totals.channels', - 'object_totals.consumers', - 'object_totals.connections', - 'object_totals.queues', - 'object_totals.exchanges', - 'queue_totals.messages_ready', - 'queue_totals.messages_unacknowledged', - 'message_stats.ack', - 'message_stats.redeliver', - 'message_stats.deliver', - 'message_stats.publish', - 'churn_rates.connection_created_details.rate', - 'churn_rates.connection_closed_details.rate', - 'churn_rates.channel_created_details.rate', - 'churn_rates.channel_closed_details.rate', - 'churn_rates.queue_created_details.rate', - 'churn_rates.queue_declared_details.rate', - 'churn_rates.queue_deleted_details.rate' -] - -QUEUE_STATS = [ - 'messages', - 'messages_paged_out', - 'messages_persistent', - 'messages_ready', - 'messages_unacknowledged', - 'message_stats.ack', - 'message_stats.confirm', - 'message_stats.deliver', - 'message_stats.get', - 'message_stats.get_no_ack', - 'message_stats.publish', - 'message_stats.redeliver', - 'message_stats.return_unroutable', -] - -VHOST_MESSAGE_STATS = [ - 'message_stats.ack', - 'message_stats.confirm', - 'message_stats.deliver', - 'message_stats.get', - 'message_stats.get_no_ack', - 'message_stats.publish', - 'message_stats.redeliver', - 'message_stats.return_unroutable', -] - -ORDER = [ - 'queued_messages', - 'connection_churn_rates', - 'channel_churn_rates', - 'queue_churn_rates', - 'message_rates', - 'global_counts', - 'file_descriptors', - 'socket_descriptors', - 'erlang_processes', - 'erlang_run_queue', - 'memory', - 'disk_space' -] - -CHARTS = { - 'file_descriptors': { - 'options': [None, 'File Descriptors', 'descriptors', 'overview', 'rabbitmq.file_descriptors', 'line'], - 'lines': [ - ['fd_used', 'used', 'absolute'] - ] - }, - 'memory': { - 'options': [None, 'Memory', 'MiB', 'overview', 'rabbitmq.memory', 'area'], - 'lines': [ - ['mem_used', 'used', 'absolute', 1, 1 << 20] - ] - }, - 'disk_space': { - 'options': [None, 'Disk Space', 'GiB', 'overview', 'rabbitmq.disk_space', 'area'], - 'lines': [ - ['disk_free', 'free', 'absolute', 1, 1 << 30] - ] - }, - 'socket_descriptors': { - 'options': [None, 'Socket Descriptors', 'descriptors', 'overview', 'rabbitmq.sockets', 'line'], - 'lines': [ - ['sockets_used', 'used', 'absolute'] - ] - }, - 'erlang_processes': { - 'options': [None, 'Erlang Processes', 'processes', 'overview', 'rabbitmq.processes', 'line'], - 'lines': [ - ['proc_used', 'used', 'absolute'] - ] - }, - 'erlang_run_queue': { - 'options': [None, 'Erlang Run Queue', 'processes', 'overview', 'rabbitmq.erlang_run_queue', 'line'], - 'lines': [ - ['run_queue', 'length', 'absolute'] - ] - }, - 'global_counts': { - 'options': [None, 'Global Counts', 'counts', 'overview', 'rabbitmq.global_counts', 'line'], - 'lines': [ - ['object_totals_channels', 'channels', 'absolute'], - ['object_totals_consumers', 'consumers', 'absolute'], - ['object_totals_connections', 'connections', 'absolute'], - ['object_totals_queues', 'queues', 'absolute'], - ['object_totals_exchanges', 'exchanges', 'absolute'] - ] - }, - 'connection_churn_rates': { - 'options': [None, 'Connection Churn Rates', 'operations/s', 'overview', 'rabbitmq.connection_churn_rates', 'line'], - 'lines': [ - ['churn_rates_connection_created_details_rate', 'created', 'absolute'], - ['churn_rates_connection_closed_details_rate', 'closed', 'absolute'] - ] - }, - 'channel_churn_rates': { - 'options': [None, 'Channel Churn Rates', 'operations/s', 'overview', 'rabbitmq.channel_churn_rates', 'line'], - 'lines': [ - ['churn_rates_channel_created_details_rate', 'created', 'absolute'], - ['churn_rates_channel_closed_details_rate', 'closed', 'absolute'] - ] - }, - 'queue_churn_rates': { - 'options': [None, 'Queue Churn Rates', 'operations/s', 'overview', 'rabbitmq.queue_churn_rates', 'line'], - 'lines': [ - ['churn_rates_queue_created_details_rate', 'created', 'absolute'], - ['churn_rates_queue_declared_details_rate', 'declared', 'absolute'], - ['churn_rates_queue_deleted_details_rate', 'deleted', 'absolute'] - ] - }, - 'queued_messages': { - 'options': [None, 'Queued Messages', 'messages', 'overview', 'rabbitmq.queued_messages', 'stacked'], - 'lines': [ - ['queue_totals_messages_ready', 'ready', 'absolute'], - ['queue_totals_messages_unacknowledged', 'unacknowledged', 'absolute'] - ] - }, - 'message_rates': { - 'options': [None, 'Message Rates', 'messages/s', 'overview', 'rabbitmq.message_rates', 'line'], - 'lines': [ - ['message_stats_ack', 'ack', 'incremental'], - ['message_stats_redeliver', 'redeliver', 'incremental'], - ['message_stats_deliver', 'deliver', 'incremental'], - ['message_stats_publish', 'publish', 'incremental'] - ] - } -} - - -def vhost_chart_template(name): - order = [ - 'vhost_{0}_message_stats'.format(name), - ] - family = 'vhost {0}'.format(name) - - charts = { - order[0]: { - 'options': [ - None, 'Vhost "{0}" Messages'.format(name), 'messages/s', family, 'rabbitmq.vhost_messages', 'stacked'], - 'lines': [ - ['vhost_{0}_message_stats_ack'.format(name), 'ack', 'incremental'], - ['vhost_{0}_message_stats_confirm'.format(name), 'confirm', 'incremental'], - ['vhost_{0}_message_stats_deliver'.format(name), 'deliver', 'incremental'], - ['vhost_{0}_message_stats_get'.format(name), 'get', 'incremental'], - ['vhost_{0}_message_stats_get_no_ack'.format(name), 'get_no_ack', 'incremental'], - ['vhost_{0}_message_stats_publish'.format(name), 'publish', 'incremental'], - ['vhost_{0}_message_stats_redeliver'.format(name), 'redeliver', 'incremental'], - ['vhost_{0}_message_stats_return_unroutable'.format(name), 'return_unroutable', 'incremental'], - ] - }, - } - - return order, charts - -def queue_chart_template(queue_id): - vhost, name = queue_id - order = [ - 'vhost_{0}_queue_{1}_queued_message'.format(vhost, name), - 'vhost_{0}_queue_{1}_messages_stats'.format(vhost, name), - ] - family = 'vhost {0}'.format(vhost) - - charts = { - order[0]: { - 'options': [ - None, 'Queue "{0}" in "{1}" queued messages'.format(name, vhost), 'messages', family, 'rabbitmq.queue_messages', 'line'], - 'lines': [ - ['vhost_{0}_queue_{1}_messages'.format(vhost, name), 'messages', 'absolute'], - ['vhost_{0}_queue_{1}_messages_paged_out'.format(vhost, name), 'paged_out', 'absolute'], - ['vhost_{0}_queue_{1}_messages_persistent'.format(vhost, name), 'persistent', 'absolute'], - ['vhost_{0}_queue_{1}_messages_ready'.format(vhost, name), 'ready', 'absolute'], - ['vhost_{0}_queue_{1}_messages_unacknowledged'.format(vhost, name), 'unack', 'absolute'], - ] - }, - order[1]: { - 'options': [ - None, 'Queue "{0}" in "{1}" messages stats'.format(name, vhost), 'messages/s', family, 'rabbitmq.queue_messages_stats', 'line'], - 'lines': [ - ['vhost_{0}_queue_{1}_message_stats_ack'.format(vhost, name), 'ack', 'incremental'], - ['vhost_{0}_queue_{1}_message_stats_confirm'.format(vhost, name), 'confirm', 'incremental'], - ['vhost_{0}_queue_{1}_message_stats_deliver'.format(vhost, name), 'deliver', 'incremental'], - ['vhost_{0}_queue_{1}_message_stats_get'.format(vhost, name), 'get', 'incremental'], - ['vhost_{0}_queue_{1}_message_stats_get_no_ack'.format(vhost, name), 'get_no_ack', 'incremental'], - ['vhost_{0}_queue_{1}_message_stats_publish'.format(vhost, name), 'publish', 'incremental'], - ['vhost_{0}_queue_{1}_message_stats_redeliver'.format(vhost, name), 'redeliver', 'incremental'], - ['vhost_{0}_queue_{1}_message_stats_return_unroutable'.format(vhost, name), 'return_unroutable', 'incremental'], - ] - }, - } - - return order, charts - - -class VhostStatsBuilder: - def __init__(self): - self.stats = None - - def set(self, raw_stats): - self.stats = raw_stats - - def name(self): - return self.stats['name'] - - def has_msg_stats(self): - return bool(self.stats.get('message_stats')) - - def msg_stats(self): - name = self.name() - stats = fetch_data(raw_data=self.stats, metrics=VHOST_MESSAGE_STATS) - return dict(('vhost_{0}_{1}'.format(name, k), v) for k, v in stats.items()) - -class QueueStatsBuilder: - def __init__(self): - self.stats = None - - def set(self, raw_stats): - self.stats = raw_stats - - def id(self): - return self.stats['vhost'], self.stats['name'] - - def queue_stats(self): - vhost, name = self.id() - stats = fetch_data(raw_data=self.stats, metrics=QUEUE_STATS) - return dict(('vhost_{0}_queue_{1}_{2}'.format(vhost, name, k), v) for k, v in stats.items()) - - -class Service(UrlService): - def __init__(self, configuration=None, name=None): - UrlService.__init__(self, configuration=configuration, name=name) - self.order = ORDER - self.definitions = CHARTS - self.url = '{0}://{1}:{2}'.format( - configuration.get('scheme', 'http'), - configuration.get('host', '127.0.0.1'), - configuration.get('port', 15672), - ) - self.node_name = str() - self.vhost = VhostStatsBuilder() - self.collected_vhosts = set() - self.collect_queues_metrics = configuration.get('collect_queues_metrics', False) - self.debug("collect_queues_metrics is {0}".format("enabled" if self.collect_queues_metrics else "disabled")) - if self.collect_queues_metrics: - self.queue = QueueStatsBuilder() - self.collected_queues = set() - - def _get_data(self): - data = dict() - - stats = self.get_overview_stats() - if not stats: - return None - - data.update(stats) - - stats = self.get_nodes_stats() - if not stats: - return None - - data.update(stats) - - stats = self.get_vhosts_stats() - if stats: - data.update(stats) - - if self.collect_queues_metrics: - stats = self.get_queues_stats() - if stats: - data.update(stats) - - return data or None - - def get_overview_stats(self): - url = '{0}/{1}'.format(self.url, API_OVERVIEW) - self.debug("doing http request to '{0}'".format(url)) - raw = self._get_raw_data(url) - if not raw: - return None - - data = loads(raw) - self.node_name = data['node'] - self.debug("found node name: '{0}'".format(self.node_name)) - - stats = fetch_data(raw_data=data, metrics=OVERVIEW_STATS) - self.debug("number of metrics: {0}".format(len(stats))) - return stats - - def get_nodes_stats(self): - if self.node_name == "": - self.error("trying to get node stats, but node name is not set") - return None - - url = '{0}/{1}/{2}'.format(self.url, API_NODE, self.node_name) - self.debug("doing http request to '{0}'".format(url)) - raw = self._get_raw_data(url) - if not raw: - return None - - data = loads(raw) - stats = fetch_data(raw_data=data, metrics=NODE_STATS) - handle_disabled_disk_monitoring(stats) - self.debug("number of metrics: {0}".format(len(stats))) - return stats - - def get_vhosts_stats(self): - url = '{0}/{1}'.format(self.url, API_VHOSTS) - self.debug("doing http request to '{0}'".format(url)) - raw = self._get_raw_data(url) - if not raw: - return None - - data = dict() - vhosts = loads(raw) - charts_initialized = len(self.charts) > 0 - - for vhost in vhosts: - self.vhost.set(vhost) - if not self.vhost.has_msg_stats(): - continue - - if charts_initialized and self.vhost.name() not in self.collected_vhosts: - self.collected_vhosts.add(self.vhost.name()) - self.add_vhost_charts(self.vhost.name()) - - data.update(self.vhost.msg_stats()) - - self.debug("number of vhosts: {0}, metrics: {1}".format(len(vhosts), len(data))) - return data - - def get_queues_stats(self): - url = '{0}/{1}'.format(self.url, API_QUEUES) - self.debug("doing http request to '{0}'".format(url)) - raw = self._get_raw_data(url) - if not raw: - return None - - data = dict() - queues = loads(raw) - charts_initialized = len(self.charts) > 0 - - for queue in queues: - self.queue.set(queue) - if self.queue.id()[0] not in self.collected_vhosts: - continue - - if charts_initialized and self.queue.id() not in self.collected_queues: - self.collected_queues.add(self.queue.id()) - self.add_queue_charts(self.queue.id()) - - data.update(self.queue.queue_stats()) - - self.debug("number of queues: {0}, metrics: {1}".format(len(queues), len(data))) - return data - - def add_vhost_charts(self, vhost_name): - order, charts = vhost_chart_template(vhost_name) - - for chart_name in order: - params = [chart_name] + charts[chart_name]['options'] - dimensions = charts[chart_name]['lines'] - - new_chart = self.charts.add_chart(params) - for dimension in dimensions: - new_chart.add_dimension(dimension) - - def add_queue_charts(self, queue_id): - order, charts = queue_chart_template(queue_id) - - for chart_name in order: - params = [chart_name] + charts[chart_name]['options'] - dimensions = charts[chart_name]['lines'] - - new_chart = self.charts.add_chart(params) - for dimension in dimensions: - new_chart.add_dimension(dimension) - - -def fetch_data(raw_data, metrics): - data = dict() - for metric in metrics: - value = raw_data - metrics_list = metric.split('.') - try: - for m in metrics_list: - value = value[m] - except (KeyError, TypeError): - continue - data['_'.join(metrics_list)] = value - - return data - - -def handle_disabled_disk_monitoring(node_stats): - # https://github.com/netdata/netdata/issues/7218 - # can be "disk_free": "disk_free_monitoring_disabled" - v = node_stats.get('disk_free') - if v and not isinstance(v, int): - del node_stats['disk_free'] diff --git a/collectors/python.d.plugin/rabbitmq/rabbitmq.conf b/collectors/python.d.plugin/rabbitmq/rabbitmq.conf deleted file mode 100644 index 47d47a1bf..000000000 --- a/collectors/python.d.plugin/rabbitmq/rabbitmq.conf +++ /dev/null @@ -1,86 +0,0 @@ -# netdata python.d.plugin configuration for rabbitmq -# -# This file is in YaML format. Generally the format is: -# -# name: value -# -# There are 2 sections: -# - global variables -# - one or more JOBS -# -# JOBS allow you to collect values from multiple sources. -# Each source will have its own set of charts. -# -# JOB parameters have to be indented (using spaces only, example below). - -# ---------------------------------------------------------------------- -# Global Variables -# These variables set the defaults for all JOBs, however each JOB -# may define its own, overriding the defaults. - -# update_every sets the default data collection frequency. -# If unset, the python.d.plugin default is used. -# update_every: 1 - -# priority controls the order of charts at the netdata dashboard. -# Lower numbers move the charts towards the top of the page. -# If unset, the default for python.d.plugin is used. -# priority: 60000 - -# penalty indicates whether to apply penalty to update_every in case of failures. -# Penalty will increase every 5 failed updates in a row. Maximum penalty is 10 minutes. -# penalty: yes - -# autodetection_retry sets the job re-check interval in seconds. -# The job is not deleted if check fails. -# Attempts to start the job are made once every autodetection_retry. -# This feature is disabled by default. -# autodetection_retry: 0 - -# ---------------------------------------------------------------------- -# JOBS (data collection sources) -# -# The default JOBS share the same *name*. JOBS with the same name -# are mutually exclusive. Only one of them will be allowed running at -# any time. This allows autodetection to try several alternatives and -# pick the one that works. -# -# Any number of jobs is supported. -# -# All python.d.plugin JOBS (for all its modules) support a set of -# predefined parameters. These are: -# -# job_name: -# name: myname # the JOB's name as it will appear at the -# # dashboard (by default is the job_name) -# # JOBs sharing a name are mutually exclusive -# update_every: 1 # the JOB's data collection frequency -# priority: 60000 # the JOB's order on the dashboard -# penalty: yes # the JOB's penalty -# autodetection_retry: 0 # the JOB's re-check interval in seconds -# -# Additionally to the above, rabbitmq plugin also supports the following: -# -# host: 'ipaddress' # Server ip address or hostname. Default: 127.0.0.1 -# port: 'port' # Rabbitmq port. Default: 15672 -# scheme: 'scheme' # http or https. Default: http -# -# if the URL is password protected, the following are supported: -# -# user: 'username' -# pass: 'password' -# -# Rabbitmq plugin can also collect stats per vhost per queues, which is disabled -# by default. Please note that enabling this can induced a serious overhead on -# both netdata and rabbitmq if a look of queues are configured and used. -# -# collect_queues_metrics: 'yes/no' -# -# ---------------------------------------------------------------------- -# AUTO-DETECTION JOBS -# only one of them will run (they have the same name) -# -local: - host: '127.0.0.1' - user: 'guest' - pass: 'guest' diff --git a/collectors/python.d.plugin/rethinkdbs/README.md b/collectors/python.d.plugin/rethinkdbs/README.md index 578c1c0b1..527ce4c31 100644 --- a/collectors/python.d.plugin/rethinkdbs/README.md +++ b/collectors/python.d.plugin/rethinkdbs/README.md @@ -4,10 +4,10 @@ custom_edit_url: "https://github.com/netdata/netdata/edit/master/collectors/pyth sidebar_label: "RethinkDB" learn_status: "Published" learn_topic_type: "References" -learn_rel_path: "References/Collectors references/Databases" +learn_rel_path: "Integrations/Monitor/Databases" --> -# RethinkDB monitoring with Netdata +# RethinkDB collector Collects database server and cluster statistics. @@ -52,6 +52,26 @@ localhost: When no configuration file is found, module tries to connect to `127.0.0.1:28015`. ---- + +### Troubleshooting + +To troubleshoot issues with the `rethinkdbs` module, run the `python.d.plugin` with the debug option enabled. The +output will give you the output of the data collection job or error messages on why the collector isn't working. + +First, navigate to your plugins directory, usually they are located under `/usr/libexec/netdata/plugins.d/`. If that's +not the case on your system, open `netdata.conf` and look for the setting `plugins directory`. Once you're in the +plugin's directory, switch to the `netdata` user. + +```bash +cd /usr/libexec/netdata/plugins.d/ +sudo su -s /bin/bash netdata +``` + +Now you can manually run the `rethinkdbs` module in debug mode: + +```bash +./python.d.plugin rethinkdbs debug trace +``` + diff --git a/collectors/python.d.plugin/rethinkdbs/metrics.csv b/collectors/python.d.plugin/rethinkdbs/metrics.csv new file mode 100644 index 000000000..2eb1eb7aa --- /dev/null +++ b/collectors/python.d.plugin/rethinkdbs/metrics.csv @@ -0,0 +1,9 @@ +metric,scope,dimensions,unit,description,chart_type,labels,plugin,module +rethinkdb.cluster_connected_servers,,"connected, missing",servers,Connected Servers,stacked,,python.d.plugin,rethinkdbs +rethinkdb.cluster_clients_active,,active,clients,Active Clients,line,,python.d.plugin,rethinkdbs +rethinkdb.cluster_queries,,queries,queries/s,Queries,line,,python.d.plugin,rethinkdbs +rethinkdb.cluster_documents,,"reads, writes",documents/s,Documents,line,,python.d.plugin,rethinkdbs +rethinkdb.client_connections,database server,connections,connections,Client Connections,line,,python.d.plugin,rethinkdbs +rethinkdb.clients_active,database server,active,clients,Active Clients,line,,python.d.plugin,rethinkdbs +rethinkdb.queries,database server,queries,queries/s,Queries,line,,python.d.plugin,rethinkdbs +rethinkdb.documents,database server,"reads, writes",documents/s,Documents,line,,python.d.plugin,rethinkdbs diff --git a/collectors/python.d.plugin/retroshare/README.md b/collectors/python.d.plugin/retroshare/README.md index 142b7d5bf..b7f2fcb14 100644 --- a/collectors/python.d.plugin/retroshare/README.md +++ b/collectors/python.d.plugin/retroshare/README.md @@ -4,10 +4,10 @@ custom_edit_url: "https://github.com/netdata/netdata/edit/master/collectors/pyth sidebar_label: "RetroShare" learn_status: "Published" learn_topic_type: "References" -learn_rel_path: "References/Collectors references/Apm" +learn_rel_path: "Integrations/Monitor/Apm" --> -# RetroShare monitoring with Netdata +# RetroShare collector Monitors application bandwidth, peers and DHT metrics. @@ -45,6 +45,26 @@ remote: user : "user" password : "pass" ``` ---- + +### Troubleshooting + +To troubleshoot issues with the `retroshare` module, run the `python.d.plugin` with the debug option enabled. The +output will give you the output of the data collection job or error messages on why the collector isn't working. + +First, navigate to your plugins directory, usually they are located under `/usr/libexec/netdata/plugins.d/`. If that's +not the case on your system, open `netdata.conf` and look for the setting `plugins directory`. Once you're in the +plugin's directory, switch to the `netdata` user. + +```bash +cd /usr/libexec/netdata/plugins.d/ +sudo su -s /bin/bash netdata +``` + +Now you can manually run the `retroshare` module in debug mode: + +```bash +./python.d.plugin retroshare debug trace +``` + diff --git a/collectors/python.d.plugin/retroshare/metrics.csv b/collectors/python.d.plugin/retroshare/metrics.csv new file mode 100644 index 000000000..35a0a48c6 --- /dev/null +++ b/collectors/python.d.plugin/retroshare/metrics.csv @@ -0,0 +1,4 @@ +metric,scope,dimensions,unit,description,chart_type,labels,plugin,module +retroshare.bandwidth,,"Upload, Download",kilobits/s,RetroShare Bandwidth,area,,python.d.plugin,retroshare +retroshare.peers,,"All friends, Connected friends",peers,RetroShare Peers,line,,python.d.plugin,retroshare +retroshare.dht,,"DHT nodes estimated, RS nodes estimated",peers,Retroshare DHT,line,,python.d.plugin,retroshare diff --git a/collectors/python.d.plugin/riakkv/README.md b/collectors/python.d.plugin/riakkv/README.md index 5e533a419..e822c551e 100644 --- a/collectors/python.d.plugin/riakkv/README.md +++ b/collectors/python.d.plugin/riakkv/README.md @@ -4,10 +4,10 @@ custom_edit_url: "https://github.com/netdata/netdata/edit/master/collectors/pyth sidebar_label: "Riak KV" learn_status: "Published" learn_topic_type: "References" -learn_rel_path: "References/Collectors references/Databases" +learn_rel_path: "Integrations/Monitor/Databases" --> -# Riak KV monitoring with Netdata +# Riak KV collector Collects database stats from `/stats` endpoint. @@ -127,3 +127,23 @@ With no explicit configuration given, the module will attempt to connect to The default update frequency for the plugin is set to 2 seconds as Riak internally updates the metrics every second. If we were to update the metrics every second, the resulting graph would contain odd jitter. +### Troubleshooting + +To troubleshoot issues with the `riakkv` module, run the `python.d.plugin` with the debug option enabled. The +output will give you the output of the data collection job or error messages on why the collector isn't working. + +First, navigate to your plugins directory, usually they are located under `/usr/libexec/netdata/plugins.d/`. If that's +not the case on your system, open `netdata.conf` and look for the setting `plugins directory`. Once you're in the +plugin's directory, switch to the `netdata` user. + +```bash +cd /usr/libexec/netdata/plugins.d/ +sudo su -s /bin/bash netdata +``` + +Now you can manually run the `riakkv` module in debug mode: + +```bash +./python.d.plugin riakkv debug trace +``` + diff --git a/collectors/python.d.plugin/riakkv/metrics.csv b/collectors/python.d.plugin/riakkv/metrics.csv new file mode 100644 index 000000000..fbac7603a --- /dev/null +++ b/collectors/python.d.plugin/riakkv/metrics.csv @@ -0,0 +1,26 @@ +metric,scope,dimensions,unit,description,chart_type,labels,plugin,module +riak.kv.throughput,,"gets, puts",operations/s,Reads & writes coordinated by this node,line,,python.d.plugin,riakkv +riak.dt.vnode_updates,,"counters, sets, maps",operations/s,Update operations coordinated by local vnodes by data type,line,,python.d.plugin,riakkv +riak.search,,queries,queries/s,Search queries on the node,line,,python.d.plugin,riakkv +riak.search.documents,,indexed,documents/s,Documents indexed by search,line,,python.d.plugin,riakkv +riak.consistent.operations,,"gets, puts",operations/s,Consistent node operations,line,,python.d.plugin,riakkv +riak.kv.latency.get,,"mean, median, 95, 99, 100",ms,Time between reception of a client GET request and subsequent response to client,line,,python.d.plugin,riakkv +riak.kv.latency.put,,"mean, median, 95, 99, 100",ms,Time between reception of a client PUT request and subsequent response to client,line,,python.d.plugin,riakkv +riak.dt.latency.counter_merge,,"mean, median, 95, 99, 100",ms,Time it takes to perform an Update Counter operation,line,,python.d.plugin,riakkv +riak.dt.latency.set_merge,,"mean, median, 95, 99, 100",ms,Time it takes to perform an Update Set operation,line,,python.d.plugin,riakkv +riak.dt.latency.map_merge,,"mean, median, 95, 99, 100",ms,Time it takes to perform an Update Map operation,line,,python.d.plugin,riakkv +riak.search.latency.query,,"median, min, 95, 99, 999, max",ms,Search query latency,line,,python.d.plugin,riakkv +riak.search.latency.index,,"median, min, 95, 99, 999, max",ms,Time it takes Search to index a new document,line,,python.d.plugin,riakkv +riak.consistent.latency.get,,"mean, median, 95, 99, 100",ms,Strongly consistent read latency,line,,python.d.plugin,riakkv +riak.consistent.latency.put,,"mean, median, 95, 99, 100",ms,Strongly consistent write latency,line,,python.d.plugin,riakkv +riak.vm,,processes,total,Total processes running in the Erlang VM,line,,python.d.plugin,riakkv +riak.vm.memory.processes,,"allocated, used",MB,Memory allocated & used by Erlang processes,line,,python.d.plugin,riakkv +riak.kv.siblings_encountered.get,,"mean, median, 95, 99, 100",siblings,Number of siblings encountered during GET operations by this node during the past minute,line,,python.d.plugin,riakkv +riak.kv.objsize.get,,"mean, median, 95, 99, 100",KB,Object size encountered by this node during the past minute,line,,python.d.plugin,riakkv +riak.search.vnodeq_size,,"mean, median, 95, 99, 100",messages,Number of unprocessed messages in the vnode message queues of Search on this node in the past minute,line,,python.d.plugin,riakkv +riak.search.index,,errors,errors,Number of document index errors encountered by Search,line,,python.d.plugin,riakkv +riak.core.protobuf_connections,,active,connections,Protocol buffer connections by status,line,,python.d.plugin,riakkv +riak.core.repairs,,read,repairs,Number of repair operations this node has coordinated,line,,python.d.plugin,riakkv +riak.core.fsm_active,,"get, put, secondary index, list keys",fsms,Active finite state machines by kind,line,,python.d.plugin,riakkv +riak.core.fsm_rejected,,"get, put",fsms,Finite state machines being rejected by Sidejobs overload protection,line,,python.d.plugin,riakkv +riak.search.index,,"bad_entry, extract_fail",writes,Number of writes to Search failed due to bad data format by reason,line,,python.d.plugin,riakkv diff --git a/collectors/python.d.plugin/samba/README.md b/collectors/python.d.plugin/samba/README.md index 41ae1c5ba..8fe133fd5 100644 --- a/collectors/python.d.plugin/samba/README.md +++ b/collectors/python.d.plugin/samba/README.md @@ -4,10 +4,10 @@ custom_edit_url: "https://github.com/netdata/netdata/edit/master/collectors/pyth sidebar_label: "Samba" learn_status: "Published" learn_topic_type: "References" -learn_rel_path: "References/Collectors references/Apps" +learn_rel_path: "Integrations/Monitor/Apps" --> -# Samba monitoring with Netdata +# Samba collector Monitors the performance metrics of Samba file sharing using `smbstatus` command-line tool. @@ -119,6 +119,26 @@ cd /etc/netdata # Replace this path with your Netdata config directory, if dif sudo ./edit-config python.d/samba.conf ``` ---- + +### Troubleshooting + +To troubleshoot issues with the `samba` module, run the `python.d.plugin` with the debug option enabled. The +output will give you the output of the data collection job or error messages on why the collector isn't working. + +First, navigate to your plugins directory, usually they are located under `/usr/libexec/netdata/plugins.d/`. If that's +not the case on your system, open `netdata.conf` and look for the setting `plugins directory`. Once you're in the +plugin's directory, switch to the `netdata` user. + +```bash +cd /usr/libexec/netdata/plugins.d/ +sudo su -s /bin/bash netdata +``` + +Now you can manually run the `samba` module in debug mode: + +```bash +./python.d.plugin samba debug trace +``` + diff --git a/collectors/python.d.plugin/samba/metrics.csv b/collectors/python.d.plugin/samba/metrics.csv new file mode 100644 index 000000000..600181f63 --- /dev/null +++ b/collectors/python.d.plugin/samba/metrics.csv @@ -0,0 +1,8 @@ +metric,scope,dimensions,unit,description,chart_type,labels,plugin,module +syscall.rw,,"sendfile, recvfile",KiB/s,R/Ws,area,,python.d.plugin,samba +smb2.rw,,"readout, writein, readin, writeout",KiB/s,R/Ws,area,,python.d.plugin,samba +smb2.create_close,,"create, close",operations/s,Create/Close,line,,python.d.plugin,samba +smb2.get_set_info,,"getinfo, setinfo",operations/s,Info,line,,python.d.plugin,samba +smb2.find,,find,operations/s,Find,line,,python.d.plugin,samba +smb2.notify,,notify,operations/s,Notify,line,,python.d.plugin,samba +smb2.sm_counters,,"tcon, negprot, tdis, cancel, logoff, flush, lock, keepalive, break, sessetup",count,Lesser Ops,stacked,,python.d.plugin,samba diff --git a/collectors/python.d.plugin/sensors/README.md b/collectors/python.d.plugin/sensors/README.md index f5f435854..7ee31bd67 100644 --- a/collectors/python.d.plugin/sensors/README.md +++ b/collectors/python.d.plugin/sensors/README.md @@ -4,10 +4,10 @@ custom_edit_url: "https://github.com/netdata/netdata/edit/master/collectors/pyth sidebar_label: "sensors-python.d.plugin" learn_status: "Published" learn_topic_type: "References" -learn_rel_path: "References/Collectors references/Devices" +learn_rel_path: "Integrations/Monitor/Devices" --> -# Linux machine sensors monitoring with Netdata +# Linux machine sensors collector Reads system sensors information (temperature, voltage, electric current, power, etc.). @@ -25,12 +25,31 @@ sudo ./edit-config python.d/sensors.conf ### possible issues -There have been reports from users that on certain servers, ACPI ring buffer errors are printed by the kernel (`dmesg`) when ACPI sensors are being accessed. -We are tracking such cases in issue [#827](https://github.com/netdata/netdata/issues/827). -Please join this discussion for help. +There have been reports from users that on certain servers, ACPI ring buffer errors are printed by the kernel (`dmesg`) +when ACPI sensors are being accessed. We are tracking such cases in +issue [#827](https://github.com/netdata/netdata/issues/827). Please join this discussion for help. -When `lm-sensors` doesn't work on your device (e.g. for RPi temperatures), use [the legacy bash collector](https://github.com/netdata/netdata/blob/master/collectors/charts.d.plugin/sensors/README.md) +When `lm-sensors` doesn't work on your device (e.g. for RPi temperatures), +use [the legacy bash collector](https://github.com/netdata/netdata/blob/master/collectors/charts.d.plugin/sensors/README.md) ---- +### Troubleshooting + +To troubleshoot issues with the `sensors` module, run the `python.d.plugin` with the debug option enabled. The +output will give you the output of the data collection job or error messages on why the collector isn't working. + +First, navigate to your plugins directory, usually they are located under `/usr/libexec/netdata/plugins.d/`. If that's +not the case on your system, open `netdata.conf` and look for the setting `plugins directory`. Once you're in the +plugin's directory, switch to the `netdata` user. + +```bash +cd /usr/libexec/netdata/plugins.d/ +sudo su -s /bin/bash netdata +``` + +Now you can manually run the `sensors` module in debug mode: + +```bash +./python.d.plugin sensors debug trace +``` diff --git a/collectors/python.d.plugin/sensors/metrics.csv b/collectors/python.d.plugin/sensors/metrics.csv new file mode 100644 index 000000000..d49e19384 --- /dev/null +++ b/collectors/python.d.plugin/sensors/metrics.csv @@ -0,0 +1,8 @@ +metric,scope,dimensions,unit,description,chart_type,labels,plugin,module +sensors.temperature,chip,a dimension per sensor,Celsius,Temperature,line,,python.d.plugin,sensors +sensors.voltage,chip,a dimension per sensor,Volts,Voltage,line,,python.d.plugin,sensors +sensors.current,chip,a dimension per sensor,Ampere,Current,line,,python.d.plugin,sensors +sensors.power,chip,a dimension per sensor,Watt,Power,line,,python.d.plugin,sensors +sensors.fan,chip,a dimension per sensor,Rotations/min,Fans speed,line,,python.d.plugin,sensors +sensors.energy,chip,a dimension per sensor,Joule,Energy,line,,python.d.plugin,sensors +sensors.humidity,chip,a dimension per sensor,Percent,Humidity,line,,python.d.plugin,sensors diff --git a/collectors/python.d.plugin/smartd_log/README.md b/collectors/python.d.plugin/smartd_log/README.md index 7c1e845f8..e79348b05 100644 --- a/collectors/python.d.plugin/smartd_log/README.md +++ b/collectors/python.d.plugin/smartd_log/README.md @@ -4,10 +4,10 @@ custom_edit_url: "https://github.com/netdata/netdata/edit/master/collectors/pyth sidebar_label: "S.M.A.R.T. attributes" learn_status: "Published" learn_topic_type: "References" -learn_rel_path: "References/Collectors references/Devices" +learn_rel_path: "Integrations/Monitor/Devices" --> -# Storage devices monitoring with Netdata +# Storage devices collector Monitors `smartd` log files to collect HDD/SSD S.M.A.R.T attributes. @@ -123,6 +123,26 @@ local: If no configuration is given, module will attempt to read log files in `/var/log/smartd/` directory. ---- + +### Troubleshooting + +To troubleshoot issues with the `smartd_log` module, run the `python.d.plugin` with the debug option enabled. The +output will give you the output of the data collection job or error messages on why the collector isn't working. + +First, navigate to your plugins directory, usually they are located under `/usr/libexec/netdata/plugins.d/`. If that's +not the case on your system, open `netdata.conf` and look for the setting `plugins directory`. Once you're in the +plugin's directory, switch to the `netdata` user. + +```bash +cd /usr/libexec/netdata/plugins.d/ +sudo su -s /bin/bash netdata +``` + +Now you can manually run the `smartd_log` module in debug mode: + +```bash +./python.d.plugin smartd_log debug trace +``` + diff --git a/collectors/python.d.plugin/smartd_log/metrics.csv b/collectors/python.d.plugin/smartd_log/metrics.csv new file mode 100644 index 000000000..7dcc703ca --- /dev/null +++ b/collectors/python.d.plugin/smartd_log/metrics.csv @@ -0,0 +1,36 @@ +metric,scope,dimensions,unit,description,chart_type,labels,plugin,module +smartd_log.read_error_rate,,a dimension per device,value,Read Error Rate,line,,python.d.plugin,smartd_log +smartd_log.seek_error_rate,,a dimension per device,value,Seek Error Rate,line,,python.d.plugin,smartd_log +smartd_log.soft_read_error_rate,,a dimension per device,errors,Soft Read Error Rate,line,,python.d.plugin,smartd_log +smartd_log.write_error_rate,,a dimension per device,value,Write Error Rate,line,,python.d.plugin,smartd_log +smartd_log.read_total_err_corrected,,a dimension per device,errors,Read Error Corrected,line,,python.d.plugin,smartd_log +smartd_log.read_total_unc_errors,,a dimension per device,errors,Read Error Uncorrected,line,,python.d.plugin,smartd_log +smartd_log.write_total_err_corrected,,a dimension per device,errors,Write Error Corrected,line,,python.d.plugin,smartd_log +smartd_log.write_total_unc_errors,,a dimension per device,errors,Write Error Uncorrected,line,,python.d.plugin,smartd_log +smartd_log.verify_total_err_corrected,,a dimension per device,errors,Verify Error Corrected,line,,python.d.plugin,smartd_log +smartd_log.verify_total_unc_errors,,a dimension per device,errors,Verify Error Uncorrected,line,,python.d.plugin,smartd_log +smartd_log.sata_interface_downshift,,a dimension per device,events,SATA Interface Downshift,line,,python.d.plugin,smartd_log +smartd_log.udma_crc_error_count,,a dimension per device,errors,UDMA CRC Error Count,line,,python.d.plugin,smartd_log +smartd_log.throughput_performance,,a dimension per device,value,Throughput Performance,line,,python.d.plugin,smartd_log +smartd_log.seek_time_performance,,a dimension per device,value,Seek Time Performance,line,,python.d.plugin,smartd_log +smartd_log.start_stop_count,,a dimension per device,events,Start/Stop Count,line,,python.d.plugin,smartd_log +smartd_log.power_on_hours_count,,a dimension per device,hours,Power-On Hours Count,line,,python.d.plugin,smartd_log +smartd_log.power_cycle_count,,a dimension per device,events,Power Cycle Count,line,,python.d.plugin,smartd_log +smartd_log.unexpected_power_loss,,a dimension per device,events,Unexpected Power Loss,line,,python.d.plugin,smartd_log +smartd_log.spin_up_time,,a dimension per device,ms,Spin-Up Time,line,,python.d.plugin,smartd_log +smartd_log.spin_up_retries,,a dimension per device,retries,Spin-up Retries,line,,python.d.plugin,smartd_log +smartd_log.calibration_retries,,a dimension per device,retries,Calibration Retries,line,,python.d.plugin,smartd_log +smartd_log.airflow_temperature_celsius,,a dimension per device,celsius,Airflow Temperature Celsius,line,,python.d.plugin,smartd_log +smartd_log.temperature_celsius,,"a dimension per device",celsius,Temperature,line,,python.d.plugin,smartd_log +smartd_log.reallocated_sectors_count,,a dimension per device,sectors,Reallocated Sectors Count,line,,python.d.plugin,smartd_log +smartd_log.reserved_block_count,,a dimension per device,percentage,Reserved Block Count,line,,python.d.plugin,smartd_log +smartd_log.program_fail_count,,a dimension per device,errors,Program Fail Count,line,,python.d.plugin,smartd_log +smartd_log.erase_fail_count,,a dimension per device,failures,Erase Fail Count,line,,python.d.plugin,smartd_log +smartd_log.wear_leveller_worst_case_erase_count,,a dimension per device,erases,Wear Leveller Worst Case Erase Count,line,,python.d.plugin,smartd_log +smartd_log.unused_reserved_nand_blocks,,a dimension per device,blocks,Unused Reserved NAND Blocks,line,,python.d.plugin,smartd_log +smartd_log.reallocation_event_count,,a dimension per device,events,Reallocation Event Count,line,,python.d.plugin,smartd_log +smartd_log.current_pending_sector_count,,a dimension per device,sectors,Current Pending Sector Count,line,,python.d.plugin,smartd_log +smartd_log.offline_uncorrectable_sector_count,,a dimension per device,sectors,Offline Uncorrectable Sector Count,line,,python.d.plugin,smartd_log +smartd_log.percent_lifetime_used,,a dimension per device,percentage,Percent Lifetime Used,line,,python.d.plugin,smartd_log +smartd_log.media_wearout_indicator,,a dimension per device,percentage,Media Wearout Indicator,line,,python.d.plugin,smartd_log +smartd_log.nand_writes_1gib,,a dimension per device,GiB,NAND Writes,line,,python.d.plugin,smartd_log diff --git a/collectors/python.d.plugin/spigotmc/README.md b/collectors/python.d.plugin/spigotmc/README.md index 6d8e4b62b..f39d9bab6 100644 --- a/collectors/python.d.plugin/spigotmc/README.md +++ b/collectors/python.d.plugin/spigotmc/README.md @@ -4,10 +4,10 @@ custom_edit_url: "https://github.com/netdata/netdata/edit/master/collectors/pyth sidebar_label: "SpigotMC" learn_status: "Published" learn_topic_type: "References" -learn_rel_path: "References/Collectors references/Webapps" +learn_rel_path: "Integrations/Monitor/Webapps" --> -# SpigotMC monitoring with Netdata +# SpigotMC collector Performs basic monitoring for Spigot Minecraft servers. @@ -36,6 +36,26 @@ password: pass By default, a connection to port 25575 on the local system is attempted with an empty password. ---- + +### Troubleshooting + +To troubleshoot issues with the `spigotmc` module, run the `python.d.plugin` with the debug option enabled. The +output will give you the output of the data collection job or error messages on why the collector isn't working. + +First, navigate to your plugins directory, usually they are located under `/usr/libexec/netdata/plugins.d/`. If that's +not the case on your system, open `netdata.conf` and look for the setting `plugins directory`. Once you're in the +plugin's directory, switch to the `netdata` user. + +```bash +cd /usr/libexec/netdata/plugins.d/ +sudo su -s /bin/bash netdata +``` + +Now you can manually run the `spigotmc` module in debug mode: + +```bash +./python.d.plugin spigotmc debug trace +``` + diff --git a/collectors/python.d.plugin/spigotmc/metrics.csv b/collectors/python.d.plugin/spigotmc/metrics.csv new file mode 100644 index 000000000..8d040b959 --- /dev/null +++ b/collectors/python.d.plugin/spigotmc/metrics.csv @@ -0,0 +1,4 @@ +metric,scope,dimensions,unit,description,chart_type,labels,plugin,module +spigotmc.tps,,"1 Minute Average, 5 Minute Average, 15 Minute Average",ticks,Spigot Ticks Per Second,line,,python.d.plugin,spigotmc +spigotmc.users,,Users,users,Minecraft Users,area,,python.d.plugin,spigotmc +spigotmc.mem,,"used, allocated, max",MiB,Minecraft Memory Usage,line,,python.d.plugin,spigotmc diff --git a/collectors/python.d.plugin/squid/README.md b/collectors/python.d.plugin/squid/README.md index ac6c83714..da5349184 100644 --- a/collectors/python.d.plugin/squid/README.md +++ b/collectors/python.d.plugin/squid/README.md @@ -4,10 +4,10 @@ custom_edit_url: "https://github.com/netdata/netdata/edit/master/collectors/pyth sidebar_label: "Squid" learn_status: "Published" learn_topic_type: "References" -learn_rel_path: "References/Collectors references/Webapps" +learn_rel_path: "Integrations/Monitor/Webapps" --> -# Squid monitoring with Netdata +# Squid collector Monitors one or more squid instances depending on configuration. @@ -56,6 +56,26 @@ local: Without any configuration module will try to autodetect where squid presents its `counters` data ---- + +### Troubleshooting + +To troubleshoot issues with the `squid` module, run the `python.d.plugin` with the debug option enabled. The +output will give you the output of the data collection job or error messages on why the collector isn't working. + +First, navigate to your plugins directory, usually they are located under `/usr/libexec/netdata/plugins.d/`. If that's +not the case on your system, open `netdata.conf` and look for the setting `plugins directory`. Once you're in the +plugin's directory, switch to the `netdata` user. + +```bash +cd /usr/libexec/netdata/plugins.d/ +sudo su -s /bin/bash netdata +``` + +Now you can manually run the `squid` module in debug mode: + +```bash +./python.d.plugin squid debug trace +``` + diff --git a/collectors/python.d.plugin/squid/metrics.csv b/collectors/python.d.plugin/squid/metrics.csv new file mode 100644 index 000000000..c2899f2e9 --- /dev/null +++ b/collectors/python.d.plugin/squid/metrics.csv @@ -0,0 +1,5 @@ +metric,scope,dimensions,unit,description,chart_type,labels,plugin,module +squid.clients_net,squid instance,"in, out, hits",kilobits/s,Squid Client Bandwidth,area,,python.d.plugin,squid +squid.clients_requests,squid instance,"requests, hits, errors",requests/s,Squid Client Requests,line,,python.d.plugin,squid +squid.servers_net,squid instance,"in, out",kilobits/s,Squid Server Bandwidth,area,,python.d.plugin,squid +squid.servers_requests,squid instance,"requests, errors",requests/s,Squid Server Requests,line,,python.d.plugin,squid diff --git a/collectors/python.d.plugin/tomcat/README.md b/collectors/python.d.plugin/tomcat/README.md index 66ed6d97a..923d6238f 100644 --- a/collectors/python.d.plugin/tomcat/README.md +++ b/collectors/python.d.plugin/tomcat/README.md @@ -4,10 +4,10 @@ custom_edit_url: "https://github.com/netdata/netdata/edit/master/collectors/pyth sidebar_label: "Tomcat" learn_status: "Published" learn_topic_type: "References" -learn_rel_path: "References/Collectors references/Webapps" +learn_rel_path: "Integrations/Monitor/Webapps" --> -# Apache Tomcat monitoring with Netdata +# Apache Tomcat collector Presents memory utilization of tomcat containers. @@ -51,6 +51,26 @@ localhost: Without configuration, module attempts to connect to `http://localhost:8080/manager/status?XML=true`, without any credentials. So it will probably fail. ---- + +### Troubleshooting + +To troubleshoot issues with the `tomcat` module, run the `python.d.plugin` with the debug option enabled. The +output will give you the output of the data collection job or error messages on why the collector isn't working. + +First, navigate to your plugins directory, usually they are located under `/usr/libexec/netdata/plugins.d/`. If that's +not the case on your system, open `netdata.conf` and look for the setting `plugins directory`. Once you're in the +plugin's directory, switch to the `netdata` user. + +```bash +cd /usr/libexec/netdata/plugins.d/ +sudo su -s /bin/bash netdata +``` + +Now you can manually run the `tomcat` module in debug mode: + +```bash +./python.d.plugin tomcat debug trace +``` + diff --git a/collectors/python.d.plugin/tomcat/metrics.csv b/collectors/python.d.plugin/tomcat/metrics.csv new file mode 100644 index 000000000..6769fa3f8 --- /dev/null +++ b/collectors/python.d.plugin/tomcat/metrics.csv @@ -0,0 +1,9 @@ +metric,scope,dimensions,unit,description,chart_type,labels,plugin,module +tomcat.accesses,,"accesses, errors",requests/s,Requests,area,,python.d.plugin,tomcat +tomcat.bandwidth,,"sent, received",KiB/s,Bandwidth,area,,python.d.plugin,tomcat +tomcat.processing_time,,processing time,seconds,processing time,area,,python.d.plugin,tomcat +tomcat.threads,,"current, busy",current threads,Threads,area,,python.d.plugin,tomcat +tomcat.jvm,,"free, eden, survivor, tenured, code cache, compressed, metaspace",MiB,JVM Memory Pool Usage,stacked,,python.d.plugin,tomcat +tomcat.jvm_eden,,"used, committed, max",MiB,Eden Memory Usage,area,,python.d.plugin,tomcat +tomcat.jvm_survivor,,"used, committed, max",MiB,Survivor Memory Usage,area,,python.d.plugin,tomcat +tomcat.jvm_tenured,,"used, committed, max",MiB,Tenured Memory Usage,area,,python.d.plugin,tomcat diff --git a/collectors/python.d.plugin/tor/README.md b/collectors/python.d.plugin/tor/README.md index c66803766..15f7e2282 100644 --- a/collectors/python.d.plugin/tor/README.md +++ b/collectors/python.d.plugin/tor/README.md @@ -4,10 +4,10 @@ custom_edit_url: "https://github.com/netdata/netdata/edit/master/collectors/pyth sidebar_label: "Tor" learn_status: "Published" learn_topic_type: "References" -learn_rel_path: "References/Collectors references/Apps" +learn_rel_path: "Integrations/Monitor/Apps" --> -# Tor monitoring with Netdata +# Tor collector Connects to the Tor control port to collect traffic statistics. @@ -64,6 +64,26 @@ For more options please read the manual. Without configuration, module attempts to connect to `127.0.0.1:9051`. ---- + +### Troubleshooting + +To troubleshoot issues with the `tor` module, run the `python.d.plugin` with the debug option enabled. The +output will give you the output of the data collection job or error messages on why the collector isn't working. + +First, navigate to your plugins directory, usually they are located under `/usr/libexec/netdata/plugins.d/`. If that's +not the case on your system, open `netdata.conf` and look for the setting `plugins directory`. Once you're in the +plugin's directory, switch to the `netdata` user. + +```bash +cd /usr/libexec/netdata/plugins.d/ +sudo su -s /bin/bash netdata +``` + +Now you can manually run the `tor` module in debug mode: + +```bash +./python.d.plugin tor debug trace +``` + diff --git a/collectors/python.d.plugin/tor/metrics.csv b/collectors/python.d.plugin/tor/metrics.csv new file mode 100644 index 000000000..62402d8d7 --- /dev/null +++ b/collectors/python.d.plugin/tor/metrics.csv @@ -0,0 +1,2 @@ +metric,scope,dimensions,unit,description,chart_type,labels,plugin,module +tor.traffic,,"read, write",KiB/s,Tor Traffic,area,,python.d.plugin,tor diff --git a/collectors/python.d.plugin/traefik/README.md b/collectors/python.d.plugin/traefik/README.md index cf30a82a4..40ed24f04 100644 --- a/collectors/python.d.plugin/traefik/README.md +++ b/collectors/python.d.plugin/traefik/README.md @@ -4,10 +4,10 @@ custom_edit_url: "https://github.com/netdata/netdata/edit/master/collectors/pyth sidebar_label: "traefik-python.d.plugin" learn_status: "Published" learn_topic_type: "References" -learn_rel_path: "References/Collectors references/Webapps" +learn_rel_path: "Integrations/Monitor/Webapps" --> -# Traefik monitoring with Netdata +# Traefik collector Uses the `health` API to provide statistics. @@ -73,6 +73,26 @@ local: Without configuration, module attempts to connect to `http://localhost:8080/health`. ---- + +### Troubleshooting + +To troubleshoot issues with the `traefik` module, run the `python.d.plugin` with the debug option enabled. The +output will give you the output of the data collection job or error messages on why the collector isn't working. + +First, navigate to your plugins directory, usually they are located under `/usr/libexec/netdata/plugins.d/`. If that's +not the case on your system, open `netdata.conf` and look for the setting `plugins directory`. Once you're in the +plugin's directory, switch to the `netdata` user. + +```bash +cd /usr/libexec/netdata/plugins.d/ +sudo su -s /bin/bash netdata +``` + +Now you can manually run the `traefik` module in debug mode: + +```bash +./python.d.plugin traefik debug trace +``` + diff --git a/collectors/python.d.plugin/traefik/metrics.csv b/collectors/python.d.plugin/traefik/metrics.csv new file mode 100644 index 000000000..77e1c2949 --- /dev/null +++ b/collectors/python.d.plugin/traefik/metrics.csv @@ -0,0 +1,9 @@ +metric,scope,dimensions,unit,description,chart_type,labels,plugin,module +traefik.response_statuses,,"success, error, redirect, bad, other",requests/s,Response statuses,stacked,,python.d.plugin,traefik +traefik.response_codes,,"2xx, 5xx, 3xx, 4xx, 1xx, other",requests/s,Responses by codes,stacked,,python.d.plugin,traefik +traefik.detailed_response_codes,,a dimension for each response code family,requests/s,Detailed response codes,stacked,,python.d.plugin,traefik +traefik.requests,,requests,requests/s,Requests,line,,python.d.plugin,traefik +traefik.total_response_time,,response,seconds,Total response time,line,,python.d.plugin,traefik +traefik.average_response_time,,response,milliseconds,Average response time,line,,python.d.plugin,traefik +traefik.average_response_time_per_iteration,,response,milliseconds,Average response time per iteration,line,,python.d.plugin,traefik +traefik.uptime,,uptime,seconds,Uptime,line,,python.d.plugin,traefik diff --git a/collectors/python.d.plugin/uwsgi/README.md b/collectors/python.d.plugin/uwsgi/README.md index dcc2dc38e..393be9fc5 100644 --- a/collectors/python.d.plugin/uwsgi/README.md +++ b/collectors/python.d.plugin/uwsgi/README.md @@ -4,10 +4,10 @@ custom_edit_url: "https://github.com/netdata/netdata/edit/master/collectors/pyth sidebar_label: "uWSGI" learn_status: "Published" learn_topic_type: "References" -learn_rel_path: "References/Collectors references/Webapps" +learn_rel_path: "Integrations/Monitor/Webapps" --> -# uWSGI monitoring with Netdata +# uWSGI collector Monitors performance metrics exposed by [`Stats Server`](https://uwsgi-docs.readthedocs.io/en/latest/StatsServer.html). @@ -53,3 +53,23 @@ localhost: When no configuration file is found, module tries to connect to TCP/IP socket: `localhost:1717`. +### Troubleshooting + +To troubleshoot issues with the `uwsgi` module, run the `python.d.plugin` with the debug option enabled. The +output will give you the output of the data collection job or error messages on why the collector isn't working. + +First, navigate to your plugins directory, usually they are located under `/usr/libexec/netdata/plugins.d/`. If that's +not the case on your system, open `netdata.conf` and look for the setting `plugins directory`. Once you're in the +plugin's directory, switch to the `netdata` user. + +```bash +cd /usr/libexec/netdata/plugins.d/ +sudo su -s /bin/bash netdata +``` + +Now you can manually run the `uwsgi` module in debug mode: + +```bash +./python.d.plugin uwsgi debug trace +``` + diff --git a/collectors/python.d.plugin/uwsgi/metrics.csv b/collectors/python.d.plugin/uwsgi/metrics.csv new file mode 100644 index 000000000..c974653f5 --- /dev/null +++ b/collectors/python.d.plugin/uwsgi/metrics.csv @@ -0,0 +1,9 @@ +metric,scope,dimensions,unit,description,chart_type,labels,plugin,module +uwsgi.requests,,a dimension per worker,requests/s,Requests,stacked,,python.d.plugin,uwsgi +uwsgi.tx,,a dimension per worker,KiB/s,Transmitted data,stacked,,python.d.plugin,uwsgi +uwsgi.avg_rt,,a dimension per worker,milliseconds,Average request time,line,,python.d.plugin,uwsgi +uwsgi.memory_rss,,a dimension per worker,MiB,RSS (Resident Set Size),stacked,,python.d.plugin,uwsgi +uwsgi.memory_vsz,,a dimension per worker,MiB,VSZ (Virtual Memory Size),stacked,,python.d.plugin,uwsgi +uwsgi.exceptions,,exceptions,exceptions,Exceptions,line,,python.d.plugin,uwsgi +uwsgi.harakiris,,harakiris,harakiris,Harakiris,line,,python.d.plugin,uwsgi +uwsgi.respawns,,respawns,respawns,Respawns,line,,python.d.plugin,uwsgi diff --git a/collectors/python.d.plugin/varnish/README.md b/collectors/python.d.plugin/varnish/README.md index ebcc00c51..d30a9fb1d 100644 --- a/collectors/python.d.plugin/varnish/README.md +++ b/collectors/python.d.plugin/varnish/README.md @@ -4,10 +4,10 @@ custom_edit_url: "https://github.com/netdata/netdata/edit/master/collectors/pyth sidebar_label: "Varnish Cache" learn_status: "Published" learn_topic_type: "References" -learn_rel_path: "References/Collectors references/Webapps" +learn_rel_path: "Integrations/Monitor/Webapps" --> -# Varnish Cache monitoring with Netdata +# Varnish Cache collector Provides HTTP accelerator global, Backends (VBE) and Storages (SMF, SMA, MSE) statistics using `varnishstat` tool. @@ -63,6 +63,26 @@ instance_name: 'name' The name of the `varnishd` instance to get logs from. If not specified, the host name is used. ---- + +### Troubleshooting + +To troubleshoot issues with the `varnish` module, run the `python.d.plugin` with the debug option enabled. The +output will give you the output of the data collection job or error messages on why the collector isn't working. + +First, navigate to your plugins directory, usually they are located under `/usr/libexec/netdata/plugins.d/`. If that's +not the case on your system, open `netdata.conf` and look for the setting `plugins directory`. Once you're in the +plugin's directory, switch to the `netdata` user. + +```bash +cd /usr/libexec/netdata/plugins.d/ +sudo su -s /bin/bash netdata +``` + +Now you can manually run the `varnish` module in debug mode: + +```bash +./python.d.plugin varnish debug trace +``` + diff --git a/collectors/python.d.plugin/varnish/metrics.csv b/collectors/python.d.plugin/varnish/metrics.csv new file mode 100644 index 000000000..bafb9fd17 --- /dev/null +++ b/collectors/python.d.plugin/varnish/metrics.csv @@ -0,0 +1,18 @@ +metric,scope,dimensions,unit,description,chart_type,labels,plugin,module +varnish.session_connection,,"accepted, dropped",connections/s,Connections Statistics,line,,python.d.plugin,varnish +varnish.client_requests,,received,requests/s,Client Requests,line,,python.d.plugin,varnish +varnish.all_time_hit_rate,,"hit, miss, hitpass",percentage,All History Hit Rate Ratio,stacked,,python.d.plugin,varnish +varnish.current_poll_hit_rate,,"hit, miss, hitpass",percentage,Current Poll Hit Rate Ratio,stacked,,python.d.plugin,varnish +varnish.cached_objects_expired,,objects,expired/s,Expired Objects,line,,python.d.plugin,varnish +varnish.cached_objects_nuked,,objects,nuked/s,Least Recently Used Nuked Objects,line,,python.d.plugin,varnish +varnish.threads_total,,None,number,Number Of Threads In All Pools,line,,python.d.plugin,varnish +varnish.threads_statistics,,"created, failed, limited",threads/s,Threads Statistics,line,,python.d.plugin,varnish +varnish.threads_queue_len,,in queue,requests,Current Queue Length,line,,python.d.plugin,varnish +varnish.backend_connections,,"successful, unhealthy, reused, closed, recycled, failed",connections/s,Backend Connections Statistics,line,,python.d.plugin,varnish +varnish.backend_requests,,sent,requests/s,Requests To The Backend,line,,python.d.plugin,varnish +varnish.esi_statistics,,"errors, warnings",problems/s,ESI Statistics,line,,python.d.plugin,varnish +varnish.memory_usage,,"free, allocated",MiB,Memory Usage,stacked,,python.d.plugin,varnish +varnish.uptime,,uptime,seconds,Uptime,line,,python.d.plugin,varnish +varnish.backend,Backend,"header, body",kilobits/s,Backend {backend_name},area,,python.d.plugin,varnish +varnish.storage_usage,Storage,"free, allocated",KiB,Storage {storage_name} Usage,stacked,,python.d.plugin,varnish +varnish.storage_alloc_objs,Storage,allocated,objects,Storage {storage_name} Allocated Objects,line,,python.d.plugin,varnish diff --git a/collectors/python.d.plugin/w1sensor/README.md b/collectors/python.d.plugin/w1sensor/README.md index 12a14a19a..ca08b0400 100644 --- a/collectors/python.d.plugin/w1sensor/README.md +++ b/collectors/python.d.plugin/w1sensor/README.md @@ -4,10 +4,10 @@ custom_edit_url: "https://github.com/netdata/netdata/edit/master/collectors/pyth sidebar_label: "1-Wire sensors" learn_status: "Published" learn_topic_type: "References" -learn_rel_path: "References/Collectors references/Remotes/Devices" +learn_rel_path: "Integrations/Monitor/Remotes/Devices" --> -# 1-Wire Sensors monitoring with Netdata +# 1-Wire Sensors collector Monitors sensor temperature. @@ -26,6 +26,25 @@ cd /etc/netdata # Replace this path with your Netdata config directory, if dif sudo ./edit-config python.d/w1sensor.conf ``` ---- +An example of a working configuration can be found in the default [configuration file](https://github.com/netdata/netdata/blob/master/collectors/python.d.plugin/w1sensor/w1sensor.conf) of this collector. +### Troubleshooting + +To troubleshoot issues with the `w1sensor` module, run the `python.d.plugin` with the debug option enabled. The +output will give you the output of the data collection job or error messages on why the collector isn't working. + +First, navigate to your plugins directory, usually they are located under `/usr/libexec/netdata/plugins.d/`. If that's +not the case on your system, open `netdata.conf` and look for the setting `plugins directory`. Once you're in the +plugin's directory, switch to the `netdata` user. + +```bash +cd /usr/libexec/netdata/plugins.d/ +sudo su -s /bin/bash netdata +``` + +Now you can manually run the `w1sensor` module in debug mode: + +```bash +./python.d.plugin w1sensor debug trace +``` diff --git a/collectors/python.d.plugin/w1sensor/metrics.csv b/collectors/python.d.plugin/w1sensor/metrics.csv new file mode 100644 index 000000000..545649347 --- /dev/null +++ b/collectors/python.d.plugin/w1sensor/metrics.csv @@ -0,0 +1,2 @@ +metric,scope,dimensions,unit,description,chart_type,labels,plugin,module +w1sensor.temp,,a dimension per sensor,Celsius,1-Wire Temperature Sensor,line,,python.d.plugin,w1sensor diff --git a/collectors/python.d.plugin/zscores/README.md b/collectors/python.d.plugin/zscores/README.md index d89aa6a0f..dcb685c98 100644 --- a/collectors/python.d.plugin/zscores/README.md +++ b/collectors/python.d.plugin/zscores/README.md @@ -1,16 +1,6 @@ -<!-- -title: "zscores" -description: "Use statistical anomaly detection to narrow your focus and shorten root cause analysis." -custom_edit_url: "https://github.com/netdata/netdata/edit/master/collectors/python.d.plugin/zscores/README.md" -sidebar_label: "zscores" -learn_status: "Published" -learn_topic_type: "References" -learn_rel_path: "References/Collectors references/Uncategorized" ---> +# Basic anomaly detection using Z-scores -# Z-Scores - basic anomaly detection for your key metrics and charts - -Smoothed, rolling [Z-Scores](https://en.wikipedia.org/wiki/Standard_score) for selected metrics or charts. +By using smoothed, rolling [Z-Scores](https://en.wikipedia.org/wiki/Standard_score) for selected metrics or charts you can narrow down your focus and shorten root cause analysis. This collector uses the [Netdata rest api](https://github.com/netdata/netdata/blob/master/web/api/README.md) to get the `mean` and `stddev` for each dimension on specified charts over a time range (defined by `train_secs` and `offset_secs`). For each dimension @@ -87,7 +77,7 @@ the `zscores.conf` files alone to begin with. Then you can return to it later if more once the collector is running for a while. Edit the `python.d/zscores.conf` configuration file using `edit-config` from the your -agent's [config directory](https://learn.netdata.cloud/guides/step-by-step/step-04#find-your-netdataconf-file), which is +agent's [config directory](https://github.com/netdata/netdata/blob/master/docs/configure/nodes.md#the-netdata-config-directory), which is usually at `/etc/netdata`. ```bash @@ -146,3 +136,23 @@ per_chart_agg: 'mean' # 'absmax' will take the max absolute value across all dim - If you activate this collector on a fresh node, it might take a little while to build up enough data to calculate a proper zscore. So until you actually have `train_secs` of available data the mean and stddev calculated will be subject to more noise. +### Troubleshooting + +To troubleshoot issues with the `zscores` module, run the `python.d.plugin` with the debug option enabled. The +output will give you the output of the data collection job or error messages on why the collector isn't working. + +First, navigate to your plugins directory, usually they are located under `/usr/libexec/netdata/plugins.d/`. If that's +not the case on your system, open `netdata.conf` and look for the setting `plugins directory`. Once you're in the +plugin's directory, switch to the `netdata` user. + +```bash +cd /usr/libexec/netdata/plugins.d/ +sudo su -s /bin/bash netdata +``` + +Now you can manually run the `zscores` module in debug mode: + +```bash +./python.d.plugin zscores debug trace +``` + diff --git a/collectors/python.d.plugin/zscores/metrics.csv b/collectors/python.d.plugin/zscores/metrics.csv new file mode 100644 index 000000000..5066c7c33 --- /dev/null +++ b/collectors/python.d.plugin/zscores/metrics.csv @@ -0,0 +1,3 @@ +metric,scope,dimensions,unit,description,chart_type,labels,plugin,module +zscores.z,,a dimension per chart or dimension,z,Z Score,line,,python.d.plugin,zscores +zscores.3stddev,,a dimension per chart or dimension,count,Z Score >3,stacked,,python.d.plugin,zscores |