
diff options
Diffstat (limited to 'collectors/statsd.plugin')
| -rw-r--r-- | collectors/statsd.plugin/Makefile.am | 20 | ||||
| -rw-r--r-- | collectors/statsd.plugin/Makefile.in | 556 | ||||
| -rw-r--r-- | collectors/statsd.plugin/README.md | 523 | ||||
| -rw-r--r-- | collectors/statsd.plugin/example.conf | 64 | ||||
| -rw-r--r-- | collectors/statsd.plugin/statsd.c | 2556 | ||||
| -rw-r--r-- | collectors/statsd.plugin/statsd.h | 25 |
6 files changed, 3744 insertions, 0 deletions
diff --git a/collectors/statsd.plugin/Makefile.am b/collectors/statsd.plugin/Makefile.am new file mode 100644 index 000000000..7f09bacd7 --- /dev/null +++ b/collectors/statsd.plugin/Makefile.am @@ -0,0 +1,20 @@ +# SPDX-License-Identifier: GPL-3.0-or-later + +AUTOMAKE_OPTIONS = subdir-objects +MAINTAINERCLEANFILES = $(srcdir)/Makefile.in + +dist_noinst_DATA = \ + README.md \ + $(NULL) + +statsdconfigdir=$(libconfigdir)/statsd.d +dist_statsdconfig_DATA = \ + $(top_srcdir)/installer/.keep \ + example.conf \ + $(NULL) + +userstatsdconfigdir=$(configdir)/statsd.d +dist_userstatsdconfig_DATA = \ + $(top_srcdir)/installer/.keep \ + $(NULL) + diff --git a/collectors/statsd.plugin/Makefile.in b/collectors/statsd.plugin/Makefile.in new file mode 100644 index 000000000..5c16a86d1 --- /dev/null +++ b/collectors/statsd.plugin/Makefile.in @@ -0,0 +1,556 @@ +# Makefile.in generated by automake 1.14.1 from Makefile.am. +# @configure_input@ + +# Copyright (C) 1994-2013 Free Software Foundation, Inc. + +# This Makefile.in is free software; the Free Software Foundation +# gives unlimited permission to copy and/or distribute it, +# with or without modifications, as long as this notice is preserved. + +# This program is distributed in the hope that it will be useful, +# but WITHOUT ANY WARRANTY, to the extent permitted by law; without +# even the implied warranty of MERCHANTABILITY or FITNESS FOR A +# PARTICULAR PURPOSE. + +@SET_MAKE@ + +# SPDX-License-Identifier: GPL-3.0-or-later + +VPATH = @srcdir@ +am__is_gnu_make = test -n '$(MAKEFILE_LIST)' && test -n '$(MAKELEVEL)' +am__make_running_with_option = \ + case $${target_option-} in \ + ?) ;; \ + *) echo "am__make_running_with_option: internal error: invalid" \ + "target option '$${target_option-}' specified" >&2; \ + exit 1;; \ + esac; \ + has_opt=no; \ + sane_makeflags=$$MAKEFLAGS; \ + if $(am__is_gnu_make); then \ + sane_makeflags=$$MFLAGS; \ + else \ + case $$MAKEFLAGS in \ + *\\[\ \ ]*) \ + bs=\\; \ + sane_makeflags=`printf '%s\n' "$$MAKEFLAGS" \ + | sed "s/$$bs$$bs[$$bs $$bs ]*//g"`;; \ + esac; \ + fi; \ + skip_next=no; \ + strip_trailopt () \ + { \ + flg=`printf '%s\n' "$$flg" | sed "s/$$1.*$$//"`; \ + }; \ + for flg in $$sane_makeflags; do \ + test $$skip_next = yes && { skip_next=no; continue; }; \ + case $$flg in \ + *=*|--*) continue;; \ + -*I) strip_trailopt 'I'; skip_next=yes;; \ + -*I?*) strip_trailopt 'I';; \ + -*O) strip_trailopt 'O'; skip_next=yes;; \ + -*O?*) strip_trailopt 'O';; \ + -*l) strip_trailopt 'l'; skip_next=yes;; \ + -*l?*) strip_trailopt 'l';; \ + -[dEDm]) skip_next=yes;; \ + -[JT]) skip_next=yes;; \ + esac; \ + case $$flg in \ + *$$target_option*) has_opt=yes; break;; \ + esac; \ + done; \ + test $$has_opt = yes +am__make_dryrun = (target_option=n; $(am__make_running_with_option)) +am__make_keepgoing = (target_option=k; $(am__make_running_with_option)) +pkgdatadir = $(datadir)/@PACKAGE@ +pkgincludedir = $(includedir)/@PACKAGE@ +pkglibdir = $(libdir)/@PACKAGE@ +pkglibexecdir = $(libexecdir)/@PACKAGE@ +am__cd = CDPATH="$${ZSH_VERSION+.}$(PATH_SEPARATOR)" && cd +install_sh_DATA = $(install_sh) -c -m 644 +install_sh_PROGRAM = $(install_sh) -c +install_sh_SCRIPT = $(install_sh) -c +INSTALL_HEADER = $(INSTALL_DATA) +transform = $(program_transform_name) +NORMAL_INSTALL = : +PRE_INSTALL = : +POST_INSTALL = : +NORMAL_UNINSTALL = : +PRE_UNINSTALL = : +POST_UNINSTALL = : +build_triplet = @build@ +host_triplet = @host@ +subdir = collectors/statsd.plugin +DIST_COMMON = $(srcdir)/Makefile.in $(srcdir)/Makefile.am \ + $(dist_noinst_DATA) $(dist_statsdconfig_DATA) \ + $(dist_userstatsdconfig_DATA) +ACLOCAL_M4 = $(top_srcdir)/aclocal.m4 +am__aclocal_m4_deps = $(top_srcdir)/build/m4/ax_c___atomic.m4 \ + $(top_srcdir)/build/m4/ax_c__generic.m4 \ + $(top_srcdir)/build/m4/ax_c_lto.m4 \ + $(top_srcdir)/build/m4/ax_c_mallinfo.m4 \ + $(top_srcdir)/build/m4/ax_c_mallopt.m4 \ + $(top_srcdir)/build/m4/ax_check_compile_flag.m4 \ + $(top_srcdir)/build/m4/ax_gcc_func_attribute.m4 \ + $(top_srcdir)/build/m4/ax_pthread.m4 \ + $(top_srcdir)/build/m4/jemalloc.m4 \ + $(top_srcdir)/build/m4/tcmalloc.m4 $(top_srcdir)/configure.ac +am__configure_deps = $(am__aclocal_m4_deps) $(CONFIGURE_DEPENDENCIES) \ + $(ACLOCAL_M4) +mkinstalldirs = $(install_sh) -d +CONFIG_HEADER = $(top_builddir)/config.h +CONFIG_CLEAN_FILES = +CONFIG_CLEAN_VPATH_FILES = +AM_V_P = $(am__v_P_@AM_V@) +am__v_P_ = $(am__v_P_@AM_DEFAULT_V@) +am__v_P_0 = false +am__v_P_1 = : +AM_V_GEN = $(am__v_GEN_@AM_V@) +am__v_GEN_ = $(am__v_GEN_@AM_DEFAULT_V@) +am__v_GEN_0 = @echo " GEN " $@; +am__v_GEN_1 = +AM_V_at = $(am__v_at_@AM_V@) +am__v_at_ = $(am__v_at_@AM_DEFAULT_V@) +am__v_at_0 = @ +am__v_at_1 = +SOURCES = +DIST_SOURCES = +am__can_run_installinfo = \ + case $$AM_UPDATE_INFO_DIR in \ + n|no|NO) false;; \ + *) (install-info --version) >/dev/null 2>&1;; \ + esac +am__vpath_adj_setup = srcdirstrip=`echo "$(srcdir)" | sed 's|.|.|g'`; +am__vpath_adj = case $$p in \ + $(srcdir)/*) f=`echo "$$p" | sed "s|^$$srcdirstrip/||"`;; \ + *) f=$$p;; \ + esac; +am__strip_dir = f=`echo $$p | sed -e 's|^.*/||'`; +am__install_max = 40 +am__nobase_strip_setup = \ + srcdirstrip=`echo "$(srcdir)" | sed 's/[].[^$$\\*|]/\\\\&/g'` +am__nobase_strip = \ + for p in $$list; do echo "$$p"; done | sed -e "s|$$srcdirstrip/||" +am__nobase_list = $(am__nobase_strip_setup); \ + for p in $$list; do echo "$$p $$p"; done | \ + sed "s| $$srcdirstrip/| |;"' / .*\//!s/ .*/ ./; s,\( .*\)/[^/]*$$,\1,' | \ + $(AWK) 'BEGIN { files["."] = "" } { files[$$2] = files[$$2] " " $$1; \ + if (++n[$$2] == $(am__install_max)) \ + { print $$2, files[$$2]; n[$$2] = 0; files[$$2] = "" } } \ + END { for (dir in files) print dir, files[dir] }' +am__base_list = \ + sed '$$!N;$$!N;$$!N;$$!N;$$!N;$$!N;$$!N;s/\n/ /g' | \ + sed '$$!N;$$!N;$$!N;$$!N;s/\n/ /g' +am__uninstall_files_from_dir = { \ + test -z "$$files" \ + || { test ! -d "$$dir" && test ! -f "$$dir" && test ! -r "$$dir"; } \ + || { echo " ( cd '$$dir' && rm -f" $$files ")"; \ + $(am__cd) "$$dir" && rm -f $$files; }; \ + } +am__installdirs = "$(DESTDIR)$(statsdconfigdir)" \ + "$(DESTDIR)$(userstatsdconfigdir)" +DATA = $(dist_noinst_DATA) $(dist_statsdconfig_DATA) \ + $(dist_userstatsdconfig_DATA) +am__tagged_files = $(HEADERS) $(SOURCES) $(TAGS_FILES) $(LISP) +DISTFILES = $(DIST_COMMON) $(DIST_SOURCES) $(TEXINFOS) $(EXTRA_DIST) +ACLOCAL = @ACLOCAL@ +AMTAR = @AMTAR@ +AM_DEFAULT_VERBOSITY = @AM_DEFAULT_VERBOSITY@ +AUTOCONF = @AUTOCONF@ +AUTOHEADER = @AUTOHEADER@ +AUTOMAKE = @AUTOMAKE@ +AWK = @AWK@ +CC = @CC@ +CCDEPMODE = @CCDEPMODE@ +CFLAGS = @CFLAGS@ +CPP = @CPP@ +CPPFLAGS = @CPPFLAGS@ +CYGPATH_W = @CYGPATH_W@ +DEFS = @DEFS@ +DEPDIR = @DEPDIR@ +ECHO_C = @ECHO_C@ +ECHO_N = @ECHO_N@ +ECHO_T = @ECHO_T@ +EGREP = @EGREP@ +EXEEXT = @EXEEXT@ +GREP = @GREP@ +INSTALL = @INSTALL@ +INSTALL_DATA = @INSTALL_DATA@ +INSTALL_PROGRAM = @INSTALL_PROGRAM@ +INSTALL_SCRIPT = @INSTALL_SCRIPT@ +INSTALL_STRIP_PROGRAM = @INSTALL_STRIP_PROGRAM@ +IPMIMONITORING_CFLAGS = @IPMIMONITORING_CFLAGS@ +IPMIMONITORING_LIBS = @IPMIMONITORING_LIBS@ +LDFLAGS = @LDFLAGS@ +LIBCAP_CFLAGS = @LIBCAP_CFLAGS@ +LIBCAP_LIBS = @LIBCAP_LIBS@ +LIBMNL_CFLAGS = @LIBMNL_CFLAGS@ +LIBMNL_LIBS = @LIBMNL_LIBS@ +LIBOBJS = @LIBOBJS@ +LIBS = @LIBS@ +LTLIBOBJS = @LTLIBOBJS@ +MAINT = @MAINT@ +MAKEINFO = @MAKEINFO@ +MATH_CFLAGS = @MATH_CFLAGS@ +MATH_LIBS = @MATH_LIBS@ +MKDIR_P = @MKDIR_P@ +NFACCT_CFLAGS = @NFACCT_CFLAGS@ +NFACCT_LIBS = @NFACCT_LIBS@ +OBJEXT = @OBJEXT@ +OPTIONAL_IPMIMONITORING_CFLAGS = @OPTIONAL_IPMIMONITORING_CFLAGS@ +OPTIONAL_IPMIMONITORING_LIBS = @OPTIONAL_IPMIMONITORING_LIBS@ +OPTIONAL_LIBCAP_CFLAGS = @OPTIONAL_LIBCAP_CFLAGS@ +OPTIONAL_LIBCAP_LIBS = @OPTIONAL_LIBCAP_LIBS@ +OPTIONAL_MATH_CLFAGS = @OPTIONAL_MATH_CLFAGS@ +OPTIONAL_MATH_LIBS = @OPTIONAL_MATH_LIBS@ +OPTIONAL_NFACCT_CLFAGS = @OPTIONAL_NFACCT_CLFAGS@ +OPTIONAL_NFACCT_LIBS = @OPTIONAL_NFACCT_LIBS@ +OPTIONAL_UUID_CLFAGS = @OPTIONAL_UUID_CLFAGS@ +OPTIONAL_UUID_LIBS = @OPTIONAL_UUID_LIBS@ +OPTIONAL_ZLIB_CLFAGS = @OPTIONAL_ZLIB_CLFAGS@ +OPTIONAL_ZLIB_LIBS = @OPTIONAL_ZLIB_LIBS@ +PACKAGE = @PACKAGE@ +PACKAGE_BUGREPORT = @PACKAGE_BUGREPORT@ +PACKAGE_NAME = @PACKAGE_NAME@ +PACKAGE_RPM_RELEASE = @PACKAGE_RPM_RELEASE@ +PACKAGE_RPM_VERSION = @PACKAGE_RPM_VERSION@ +PACKAGE_STRING = @PACKAGE_STRING@ +PACKAGE_TARNAME = @PACKAGE_TARNAME@ +PACKAGE_URL = @PACKAGE_URL@ +PACKAGE_VERSION = @PACKAGE_VERSION@ +PATH_SEPARATOR = @PATH_SEPARATOR@ +PKG_CONFIG = @PKG_CONFIG@ +PKG_CONFIG_LIBDIR = @PKG_CONFIG_LIBDIR@ +PKG_CONFIG_PATH = @PKG_CONFIG_PATH@ +PTHREAD_CC = @PTHREAD_CC@ +PTHREAD_CFLAGS = @PTHREAD_CFLAGS@ +PTHREAD_LIBS = @PTHREAD_LIBS@ +SET_MAKE = @SET_MAKE@ +SHELL = @SHELL@ +SSE_CANDIDATE = @SSE_CANDIDATE@ +STRIP = @STRIP@ +UUID_CFLAGS = @UUID_CFLAGS@ +UUID_LIBS = @UUID_LIBS@ +VERSION = @VERSION@ +ZLIB_CFLAGS = @ZLIB_CFLAGS@ +ZLIB_LIBS = @ZLIB_LIBS@ +abs_builddir = @abs_builddir@ +abs_srcdir = @abs_srcdir@ +abs_top_builddir = @abs_top_builddir@ +abs_top_srcdir = @abs_top_srcdir@ +ac_ct_CC = @ac_ct_CC@ +am__include = @am__include@ +am__leading_dot = @am__leading_dot@ +am__quote = @am__quote@ +am__tar = @am__tar@ +am__untar = @am__untar@ +ax_pthread_config = @ax_pthread_config@ +bindir = @bindir@ +build = @build@ +build_alias = @build_alias@ +build_cpu = @build_cpu@ +build_os = @build_os@ +build_target = @build_target@ +build_vendor = @build_vendor@ +builddir = @builddir@ +cachedir = @cachedir@ +chartsdir = @chartsdir@ +configdir = @configdir@ +datadir = @datadir@ +datarootdir = @datarootdir@ +docdir = @docdir@ +dvidir = @dvidir@ +exec_prefix = @exec_prefix@ +has_jemalloc = @has_jemalloc@ +has_tcmalloc = @has_tcmalloc@ +host = @host@ +host_alias = @host_alias@ +host_cpu = @host_cpu@ +host_os = @host_os@ +host_vendor = @host_vendor@ +htmldir = @htmldir@ +includedir = @includedir@ +infodir = @infodir@ +install_sh = @install_sh@ +libconfigdir = @libconfigdir@ +libdir = @libdir@ +libexecdir = @libexecdir@ +localedir = @localedir@ +localstatedir = @localstatedir@ +logdir = @logdir@ +mandir = @mandir@ +mkdir_p = @mkdir_p@ +nodedir = @nodedir@ +oldincludedir = @oldincludedir@ +pdfdir = @pdfdir@ +pluginsdir = @pluginsdir@ +prefix = @prefix@ +program_transform_name = @program_transform_name@ +psdir = @psdir@ +pythondir = @pythondir@ +registrydir = @registrydir@ +sbindir = @sbindir@ +sharedstatedir = @sharedstatedir@ +srcdir = @srcdir@ +sysconfdir = @sysconfdir@ +target_alias = @target_alias@ +top_build_prefix = @top_build_prefix@ +top_builddir = @top_builddir@ +top_srcdir = @top_srcdir@ +varlibdir = @varlibdir@ +webdir = @webdir@ +AUTOMAKE_OPTIONS = subdir-objects +MAINTAINERCLEANFILES = $(srcdir)/Makefile.in +dist_noinst_DATA = \ + README.md \ + $(NULL) + +statsdconfigdir = $(libconfigdir)/statsd.d +dist_statsdconfig_DATA = \ + $(top_srcdir)/installer/.keep \ + example.conf \ + $(NULL) + +userstatsdconfigdir = $(configdir)/statsd.d +dist_userstatsdconfig_DATA = \ + $(top_srcdir)/installer/.keep \ + $(NULL) + +all: all-am + +.SUFFIXES: +$(srcdir)/Makefile.in: @MAINTAINER_MODE_TRUE@ $(srcdir)/Makefile.am $(am__configure_deps) + @for dep in $?; do \ + case '$(am__configure_deps)' in \ + *$$dep*) \ + ( cd $(top_builddir) && $(MAKE) $(AM_MAKEFLAGS) am--refresh ) \ + && { if test -f $@; then exit 0; else break; fi; }; \ + exit 1;; \ + esac; \ + done; \ + echo ' cd $(top_srcdir) && $(AUTOMAKE) --gnu collectors/statsd.plugin/Makefile'; \ + $(am__cd) $(top_srcdir) && \ + $(AUTOMAKE) --gnu collectors/statsd.plugin/Makefile +.PRECIOUS: Makefile +Makefile: $(srcdir)/Makefile.in $(top_builddir)/config.status + @case '$?' in \ + *config.status*) \ + cd $(top_builddir) && $(MAKE) $(AM_MAKEFLAGS) am--refresh;; \ + *) \ + echo ' cd $(top_builddir) && $(SHELL) ./config.status $(subdir)/$@ $(am__depfiles_maybe)'; \ + cd $(top_builddir) && $(SHELL) ./config.status $(subdir)/$@ $(am__depfiles_maybe);; \ + esac; + +$(top_builddir)/config.status: $(top_srcdir)/configure $(CONFIG_STATUS_DEPENDENCIES) + cd $(top_builddir) && $(MAKE) $(AM_MAKEFLAGS) am--refresh + +$(top_srcdir)/configure: @MAINTAINER_MODE_TRUE@ $(am__configure_deps) + cd $(top_builddir) && $(MAKE) $(AM_MAKEFLAGS) am--refresh +$(ACLOCAL_M4): @MAINTAINER_MODE_TRUE@ $(am__aclocal_m4_deps) + cd $(top_builddir) && $(MAKE) $(AM_MAKEFLAGS) am--refresh +$(am__aclocal_m4_deps): +install-dist_statsdconfigDATA: $(dist_statsdconfig_DATA) + @$(NORMAL_INSTALL) + @list='$(dist_statsdconfig_DATA)'; test -n "$(statsdconfigdir)" || list=; \ + if test -n "$$list"; then \ + echo " $(MKDIR_P) '$(DESTDIR)$(statsdconfigdir)'"; \ + $(MKDIR_P) "$(DESTDIR)$(statsdconfigdir)" || exit 1; \ + fi; \ + for p in $$list; do \ + if test -f "$$p"; then d=; else d="$(srcdir)/"; fi; \ + echo "$$d$$p"; \ + done | $(am__base_list) | \ + while read files; do \ + echo " $(INSTALL_DATA) $$files '$(DESTDIR)$(statsdconfigdir)'"; \ + $(INSTALL_DATA) $$files "$(DESTDIR)$(statsdconfigdir)" || exit $$?; \ + done + +uninstall-dist_statsdconfigDATA: + @$(NORMAL_UNINSTALL) + @list='$(dist_statsdconfig_DATA)'; test -n "$(statsdconfigdir)" || list=; \ + files=`for p in $$list; do echo $$p; done | sed -e 's|^.*/||'`; \ + dir='$(DESTDIR)$(statsdconfigdir)'; $(am__uninstall_files_from_dir) +install-dist_userstatsdconfigDATA: $(dist_userstatsdconfig_DATA) + @$(NORMAL_INSTALL) + @list='$(dist_userstatsdconfig_DATA)'; test -n "$(userstatsdconfigdir)" || list=; \ + if test -n "$$list"; then \ + echo " $(MKDIR_P) '$(DESTDIR)$(userstatsdconfigdir)'"; \ + $(MKDIR_P) "$(DESTDIR)$(userstatsdconfigdir)" || exit 1; \ + fi; \ + for p in $$list; do \ + if test -f "$$p"; then d=; else d="$(srcdir)/"; fi; \ + echo "$$d$$p"; \ + done | $(am__base_list) | \ + while read files; do \ + echo " $(INSTALL_DATA) $$files '$(DESTDIR)$(userstatsdconfigdir)'"; \ + $(INSTALL_DATA) $$files "$(DESTDIR)$(userstatsdconfigdir)" || exit $$?; \ + done + +uninstall-dist_userstatsdconfigDATA: + @$(NORMAL_UNINSTALL) + @list='$(dist_userstatsdconfig_DATA)'; test -n "$(userstatsdconfigdir)" || list=; \ + files=`for p in $$list; do echo $$p; done | sed -e 's|^.*/||'`; \ + dir='$(DESTDIR)$(userstatsdconfigdir)'; $(am__uninstall_files_from_dir) +tags TAGS: + +ctags CTAGS: + +cscope cscopelist: + + +distdir: $(DISTFILES) + @srcdirstrip=`echo "$(srcdir)" | sed 's/[].[^$$\\*]/\\\\&/g'`; \ + topsrcdirstrip=`echo "$(top_srcdir)" | sed 's/[].[^$$\\*]/\\\\&/g'`; \ + list='$(DISTFILES)'; \ + dist_files=`for file in $$list; do echo $$file; done | \ + sed -e "s|^$$srcdirstrip/||;t" \ + -e "s|^$$topsrcdirstrip/|$(top_builddir)/|;t"`; \ + case $$dist_files in \ + */*) $(MKDIR_P) `echo "$$dist_files" | \ + sed '/\//!d;s|^|$(distdir)/|;s,/[^/]*$$,,' | \ + sort -u` ;; \ + esac; \ + for file in $$dist_files; do \ + if test -f $$file || test -d $$file; then d=.; else d=$(srcdir); fi; \ + if test -d $$d/$$file; then \ + dir=`echo "/$$file" | sed -e 's,/[^/]*$$,,'`; \ + if test -d "$(distdir)/$$file"; then \ + find "$(distdir)/$$file" -type d ! -perm -700 -exec chmod u+rwx {} \;; \ + fi; \ + if test -d $(srcdir)/$$file && test $$d != $(srcdir); then \ + cp -fpR $(srcdir)/$$file "$(distdir)$$dir" || exit 1; \ + find "$(distdir)/$$file" -type d ! -perm -700 -exec chmod u+rwx {} \;; \ + fi; \ + cp -fpR $$d/$$file "$(distdir)$$dir" || exit 1; \ + else \ + test -f "$(distdir)/$$file" \ + || cp -p $$d/$$file "$(distdir)/$$file" \ + || exit 1; \ + fi; \ + done +check-am: all-am +check: check-am +all-am: Makefile $(DATA) +installdirs: + for dir in "$(DESTDIR)$(statsdconfigdir)" "$(DESTDIR)$(userstatsdconfigdir)"; do \ + test -z "$$dir" || $(MKDIR_P) "$$dir"; \ + done +install: install-am +install-exec: install-exec-am +install-data: install-data-am +uninstall: uninstall-am + +install-am: all-am + @$(MAKE) $(AM_MAKEFLAGS) install-exec-am install-data-am + +installcheck: installcheck-am +install-strip: + if test -z '$(STRIP)'; then \ + $(MAKE) $(AM_MAKEFLAGS) INSTALL_PROGRAM="$(INSTALL_STRIP_PROGRAM)" \ + install_sh_PROGRAM="$(INSTALL_STRIP_PROGRAM)" INSTALL_STRIP_FLAG=-s \ + install; \ + else \ + $(MAKE) $(AM_MAKEFLAGS) INSTALL_PROGRAM="$(INSTALL_STRIP_PROGRAM)" \ + install_sh_PROGRAM="$(INSTALL_STRIP_PROGRAM)" INSTALL_STRIP_FLAG=-s \ + "INSTALL_PROGRAM_ENV=STRIPPROG='$(STRIP)'" install; \ + fi +mostlyclean-generic: + +clean-generic: + +distclean-generic: + -test -z "$(CONFIG_CLEAN_FILES)" || rm -f $(CONFIG_CLEAN_FILES) + -test . = "$(srcdir)" || test -z "$(CONFIG_CLEAN_VPATH_FILES)" || rm -f $(CONFIG_CLEAN_VPATH_FILES) + +maintainer-clean-generic: + @echo "This command is intended for maintainers to use" + @echo "it deletes files that may require special tools to rebuild." + -test -z "$(MAINTAINERCLEANFILES)" || rm -f $(MAINTAINERCLEANFILES) +clean: clean-am + +clean-am: clean-generic mostlyclean-am + +distclean: distclean-am + -rm -f Makefile +distclean-am: clean-am distclean-generic + +dvi: dvi-am + +dvi-am: + +html: html-am + +html-am: + +info: info-am + +info-am: + +install-data-am: install-dist_statsdconfigDATA \ + install-dist_userstatsdconfigDATA + +install-dvi: install-dvi-am + +install-dvi-am: + +install-exec-am: + +install-html: install-html-am + +install-html-am: + +install-info: install-info-am + +install-info-am: + +install-man: + +install-pdf: install-pdf-am + +install-pdf-am: + +install-ps: install-ps-am + +install-ps-am: + +installcheck-am: + +maintainer-clean: maintainer-clean-am + -rm -f Makefile +maintainer-clean-am: distclean-am maintainer-clean-generic + +mostlyclean: mostlyclean-am + +mostlyclean-am: mostlyclean-generic + +pdf: pdf-am + +pdf-am: + +ps: ps-am + +ps-am: + +uninstall-am: uninstall-dist_statsdconfigDATA \ + uninstall-dist_userstatsdconfigDATA + +.MAKE: install-am install-strip + +.PHONY: all all-am check check-am clean clean-generic cscopelist-am \ + ctags-am distclean distclean-generic distdir dvi dvi-am html \ + html-am info info-am install install-am install-data \ + install-data-am install-dist_statsdconfigDATA \ + install-dist_userstatsdconfigDATA install-dvi install-dvi-am \ + install-exec install-exec-am install-html install-html-am \ + install-info install-info-am install-man install-pdf \ + install-pdf-am install-ps install-ps-am install-strip \ + installcheck installcheck-am installdirs maintainer-clean \ + maintainer-clean-generic mostlyclean mostlyclean-generic pdf \ + pdf-am ps ps-am tags-am uninstall uninstall-am \ + uninstall-dist_statsdconfigDATA \ + uninstall-dist_userstatsdconfigDATA + + +# Tell versions [3.59,3.63) of GNU make to not export all variables. +# Otherwise a system limit (for SysV at least) may be exceeded. +.NOEXPORT: diff --git a/collectors/statsd.plugin/README.md b/collectors/statsd.plugin/README.md new file mode 100644 index 000000000..6ef038343 --- /dev/null +++ b/collectors/statsd.plugin/README.md @@ -0,0 +1,523 @@ +# Netdata Statsd + +statsd is a system to collect data from any application. Applications are sending metrics to it, usually via non-blocking UDP communication, and statsd servers collect these metrics, perform a few simple calculations on them and push them to backend time-series databases. + +There is a [plethora of client libraries](https://github.com/etsy/statsd/wiki#client-implementations) for embedding statsd metrics to any application framework. This makes statsd quite popular for custom application metrics. + +## netdata statsd + +netdata is a fully featured statsd server. It can collect statsd formatted metrics, visualize them on its dashboards, stream them to other netdata servers or archive them to backend time-series databases. + +netdata statsd is inside netdata (an internal plugin, running inside the netdata daemon), it is configured via `netdata.conf` and by-default listens on standard statsd ports (tcp and udp 8125 - yes, netdata statsd server supports both tcp and udp at the same time). + +Since statsd is embedded in netdata, it means you now have a statsd server embedded on all your servers. So, the application can send its metrics to `localhost:8125`. This provides a distributed statsd implementation. + +netdata statsd is fast. It can collect more than **1.200.000 metrics per second** on modern hardware, more than **200Mbps of sustained statsd traffic**, using 1 CPU core (yes, it is single threaded - actually double-threaded, one thread collects metrics, another one updates the charts from the collected data). + +## metrics supported by netdata + +netdata fully supports the statsd protocol. All statsd client libraries can be used with netdata too. + +- **Gauges** + + The application sends `name:value|g`, where `value` is any **decimal/fractional** number, statsd reports the latest value collected and the number of times it was updated (events). + + The application may increment or decrement a previous value, by setting the first character of the value to ` + ` or ` - ` (so, the only way to set a gauge to an absolute negative value, is to first set it to zero). + + Sampling rate is supported (check below). + + When a gauge is not collected and the setting is not to show gaps on the charts (the default), the last value will be shown, until a data collection event changes it. + +- **Counters** and **Meters** + + The application sends `name:value|c`, `name:value|C` or `name:value|m`, where `value` is a positive or negative **integer** number of events occurred, statsd reports the **rate** and the number of times it was updated (events). + + `:value` can be omitted and statsd will assume it is `1`. `|c`, `|C` and `|m` can be omitted an statsd will assume it is `|m`. So, the application may send just `name` and statsd will parse it as `name:1|m`. + + For counters use `|c` (esty/statsd compatible) or `|C` (brubeck compatible), for meters use `|m`. + + Sampling rate is supported (check below). + + When a counter or meter is not collected and the setting is not to show gaps on the charts (the default), zero will be shown, until a data collection event changes it. + +- **Timers** and **Histograms** + + The application sends `name:value|ms` or `name:value|h`, where ` value` is any **decimal/fractional** number, statsd reports **min**, **max**, **average**, **sum**, **95th percentile**, **median** and **standard deviation** and the total number of times it was updated (events). + + For timers use `|ms`, or histograms use `|h`. The only difference between the two, is the `units` of the charts (timers report milliseconds). + + Sampling rate is supported (check below). + + When a timer or histogram is not collected and the setting is not to show gaps on the charts (the default), zero will be shown, until a data collection event changes it. + +- **Sets** + + The application sends `name:value|s`, where `value` is anything (**number or text**, leading and trailing spaces are removed), statsd reports the number of unique values sent and the number of times it was updated (events). + + Sampling rate is **not** supported for Sets. `value` is always considered text. + + When a set is not collected and the setting is not to show gaps on the charts (the default), zero will be shown, until a data collection event changes it. + +#### Sampling Rates + +The application may append `|@sampling_rate`, where `sampling_rate` is a number from `0.0` to `1.0`, to have statsd extrapolate the value, to predict to total for the whole period. So, if the application reports to statsd a value for 1/10th of the time, it can append `|@0.1` to the metrics it sends to statsd. + +#### Overlapping metrics + +netdata statsd maintains different indexes for each of the types supported. This means the same metric `name` may exist under different types concurrently. + +#### Multiple metrics per packet + +netdata accepts multiple metrics per packet if each is terminated with `\n`. + +#### TCP packets + +netdata listens for both TCP and UDP packets. For TCP though, is it important to always append `\n` on each metric. netdata uses this to detect if a metric is split into multiple TCP packets. On disconnect, even the remaining (non terminated with `\n`) buffer, is processed. + +#### UDP packets + +When sending multiple packets over UDP, it is important not to exceed the network MTU (usually 1500 bytes minus a few bytes for the headers). netdata will accept UDP packets up to 9000 bytes, but the underlying network will not exceed MTU. + +## configuration + +This is the statsd configuration at `/etc/netdata/netdata.conf`: + +``` +[statsd] + # enabled = yes + # decimal detail = 1000 + # update every (flushInterval) = 1 + # udp messages to process at once = 10 + # create private charts for metrics matching = * + # max private charts allowed = 200 + # max private charts hard limit = 1000 + # private charts memory mode = save + # private charts history = 3996 + # histograms and timers percentile (percentThreshold) = 95.00000 + # add dimension for number of events received = yes + # gaps on gauges (deleteGauges) = no + # gaps on counters (deleteCounters) = no + # gaps on meters (deleteMeters) = no + # gaps on sets (deleteSets) = no + # gaps on histograms (deleteHistograms) = no + # gaps on timers (deleteTimers) = no + # listen backlog = 4096 + # default port = 8125 + # bind to = udp:localhost:8125 tcp:localhost:8125 +``` + +### statsd main config options +- `enabled = yes|no` + + controls if statsd will be enabled for this netdata. The default is enabled. + +- `default port = 8125` + + controls the port statsd will use. This is the default, since the next line, allows defining ports too. + +- `bind to = udp:localhost tcp:localhost` + + is a space separated list of IPs and ports to listen to. The format is `PROTOCOL:IP:PORT` - if `PORT` is omitted, the `default port` will be used. If `IP` is IPv6, it needs to be enclosed in `[]`. `IP` can also be ` * ` (to listen on all IPs) or even a hostname. + +- `update every (flushInterval) = 1` seconds, controls the frequency statsd will push the collected metrics to netdata charts. + +- `decimal detail = 1000` controls the number of fractional digits in gauges and histograms. netdata collects metrics using signed 64 bit integers and their fractional detail is controlled using multipliers and divisors. This setting is used to multiply all collected values to convert them to integers and is also set as the divisors, so that the final data will be a floating point number with this fractional detail (1000 = X.0 - X.999, 10000 = X.0 - X.9999, etc). + +The rest of the settings are discussed below. + +## statsd charts + +netdata can visualize statsd collected metrics in 2 ways: + +1. Each metric gets its own **private chart**. This is the default and does not require any configuration (although there are a few options to tweak). + +2. **Synthetic charts** can be created, combining multiple metrics, independently of their metric types. For this type of charts, special configuration is required, to define the chart title, type, units, its dimensions, etc. + +### private metric charts + +Private charts are controlled with `create private charts for metrics matching = *`. This setting accepts a space separated list of simple patterns (use `*` as wildcard, prepend a pattern with `!` for a negative match, the order of patterns is important). + +So to render charts for all `myapp.*` metrics, except `myapp.*.badmetric`, use: + +``` +create private charts for metrics matching = !myapp.*.badmetric myapp.* +``` + +The default is to render private charts for all metrics. + +The `memory mode` of the round robin database and the `history` of private metric charts are controlled with `private charts memory mode` and `private charts history`. The defaults for both settings is to use the global netdata settings. So, you need to edit them only when you want statsd to use different settings compared to the global ones. + +If you have thousands of metrics, each with its own private chart, you may notice that your web browser becomes slow when you view the netdata dashboard (this is a web browser issue we need to address at the netdata UI). So, netdata has a protection to stop creating charts when `max private charts allowed = 200` (soft limit) is reached. + +The metrics above this soft limit are still processed by netdata and will be available to be sent to backend time-series databases, up to `max private charts hard limit = 1000`. So, between 200 and 1000 charts, netdata will still generate charts, but they will automatically be created with `memory mode = none` (netdata will not maintain a database for them). These metrics will be sent to backend time series databases, if the backend configuration is set to `as collected`. + +Metrics above the hard limit are still collected, but they can only be used in synthetic charts (once a metric is added to chart, it will be sent to backend servers too). + +Example private charts (automatically generated without any configuration): + +#### counters + +- Scope: **count the events of something** (e.g. number of file downloads) +- Format: `name:INTEGER|c` or `name:INTEGER|C` or `name|c` +- statsd increments the counter by the `INTEGER` number supplied (positive, or negative). + + + +#### gauges + +- Scope: **report the value of something** (e.g. cache memory used by the application server) +- Format: `name:FLOAT|g` +- statsd remembers the last value supplied, and can increment or decrement the latest value if `FLOAT` begins with ` + ` or ` - `. + + + +#### histograms + +- Scope: **statistics on a size of events** (e.g. statistics on the sizes of files downloaded) +- Format: `name:FLOAT|h` +- statsd maintains a list of all the values supplied and provides statistics on them. + + + +The same chart with `sum` unselected, to show the detail of the dimensions supported: + + +#### meters + +This is identical to `counter`. + +- Scope: **count the events of something** (e.g. number of file downloads) +- Format: `name:INTEGER|m` or `name|m` or just `name` +- statsd increments the counter by the `INTEGER` number supplied (positive, or negative). + + + +#### sets + +- Scope: **count the unique occurrences of something** (e.g. unique filenames downloaded, or unique users that downloaded files) +- Format: `name:TEXT|s` +- statsd maintains a unique index of all values supplied, and reports the unique entries in it. + + + +#### timers + +- Scope: **statistics on the duration of events** (e.g. statistics for the duration of file downloads) +- Format: `name:FLOAT|ms` +- statsd maintains a list of all the values supplied and provides statistics on them. + + + +The same chart with the `sum` unselected: + + + + +### synthetic statsd charts + +Using synthetic charts, you can create dedicated sections on the dashboard to render the charts. You can control everything: the main menu, the submenus, the charts, the dimensions on each chart, etc. + +Synthetic charts are organized in + +- **applications** (i.e. entries at the main menu of the netdata dashboard) +- **charts for each application** (grouped in families - i.e. submenus at the dashboard menu) +- **statsd metrics for each chart** (i.e. dimensions of the charts) + +For each application you need to create a `.conf` file in `/etc/netdata/statsd.d`. + +So, to create the statsd application `myapp`, you can create the file `/etc/netdata/statsd.d/myapp.conf`, with this content: + +``` +[app] + name = myapp + metrics = myapp.* + private charts = no + gaps when not collected = no + memory mode = ram + history = 60 + +[dictionary] + m1 = metric1 + m2 = metric2 + +# replace 'mychart' with the chart id +# the chart will be named: myapp.mychart +[mychart] + name = mychart + title = my chart title + family = my family + context = chart.context + units = tests/s + priority = 91000 + type = area + dimension = myapp.metric1 m1 + dimension = myapp.metric2 m2 +``` + +Using the above configuration `myapp` should get its own section on the dashboard, having one chart with 2 dimensions. + +`[app]` starts a new application definition. The supported settings in this section are: + +- `name` defines the name of the app. +- `metrics` is a netdata simple pattern (space separated patterns, using `*` for wildcard, possibly starting with `!` for negative match). This pattern should match all the possible statsd metrics that will be participating in the application `myapp`. +- `private charts = yes|no`, enables or disables private charts for the metrics matched. +- `gaps when not collected = yes|no`, enables or disables gaps on the charts of the application, when metrics are not collected. +- `memory mode` sets the memory mode for all charts of the application. The default is the global default for netdata (not the global default for statsd private charts). +- `history` sets the size of the round robin database for this application. The default is the global default for netdata (not the global default for statsd private charts). + +`[dictionary]` defines name-value associations. These are used to renaming metrics, when added to synthetic charts. Metric names are also defined at each `dimension` line. However, using the dictionary dimension names can be declared globally, for each app and is the only way to rename dimensions when using patterns. Of course the dictionary can be empty or missing. + +Then, you can add any number of charts. Each chart should start with `[id]`. The chart will be called `app_name.id`. `family` controls the submenu on the dashboard. `context` controls the alarm templates. `priority` controls the ordering of the charts on the dashboard. The rest of the settings are informational. + +You can add any number of metrics to a chart, using `dimension` lines. These lines accept 5 space separated parameters: + +1. the metric name, as it is collected (it has to be matched by the `metrics = ` pattern of the app) +2. the dimension name, as it should be shown on the chart +3. an optional selector (type) of the value to shown (see below) +4. an optional multiplier +5. an optional divider +6. optional flags, space separated and enclosed in quotes. All the external plugins `DIMENSION` flags can be used. Currently the only usable flag is `hidden`, to add the dimension, but not show it on the dashboard. This is usually needed to have the values available for percentage calculation, or use them in alarms. + +So, the format is this: +``` +dimension = [pattern] METRIC NAME TYPE MULTIPLIER DIVIDER OPTIONS +``` + +`pattern` is a keyword. When set, `METRIC` is expected to be a netdata simple pattern that will be used to match all the statsd metrics to be added to the chart. So, `pattern` automatically matches any number of statsd metrics, all of which will be added as separate chart dimensions. + +`TYPE`, `MUTLIPLIER`, `DIVIDER` and `OPTIONS` are optional. + +`TYPE` can be: + +- `events` to show the number of events received by statsd for this metric +- `last` to show the last value, as calculated at the flush interval of the metric (the default) + +Then for histograms and timers the following types are also supported: + +- `min`, show the minimum value +- `max`, show the maximum value +- `sum`, show the sum of all values +- `average` (same as `last`) +- `percentile`, show the 95th percentile (or any other percentile, as configured at statsd global config) +- `median`, show the median of all values (i.e. sort all values and get the middle value) +- `stddev`, show the standard deviation of the values + +#### example synthetic charts + +statsd metrics: `foo` and `bar`. + +Contents of file `/etc/netdata/stats.d/foobar.conf`: + +``` +[app] + name = foobarapp + metrics = foo bar + private charts = yes + +[foobar_chart1] + title = Hey, foo and bar together + family = foobar_family + context = foobarapp.foobars + units = foobars + type = area + dimension = foo 'foo me' last 1 1 + dimension = bar 'bar me' last 1 1 +``` + +I sent to statsd: `foo:10|g` and `bar:20|g`. + +I got these private charts: + +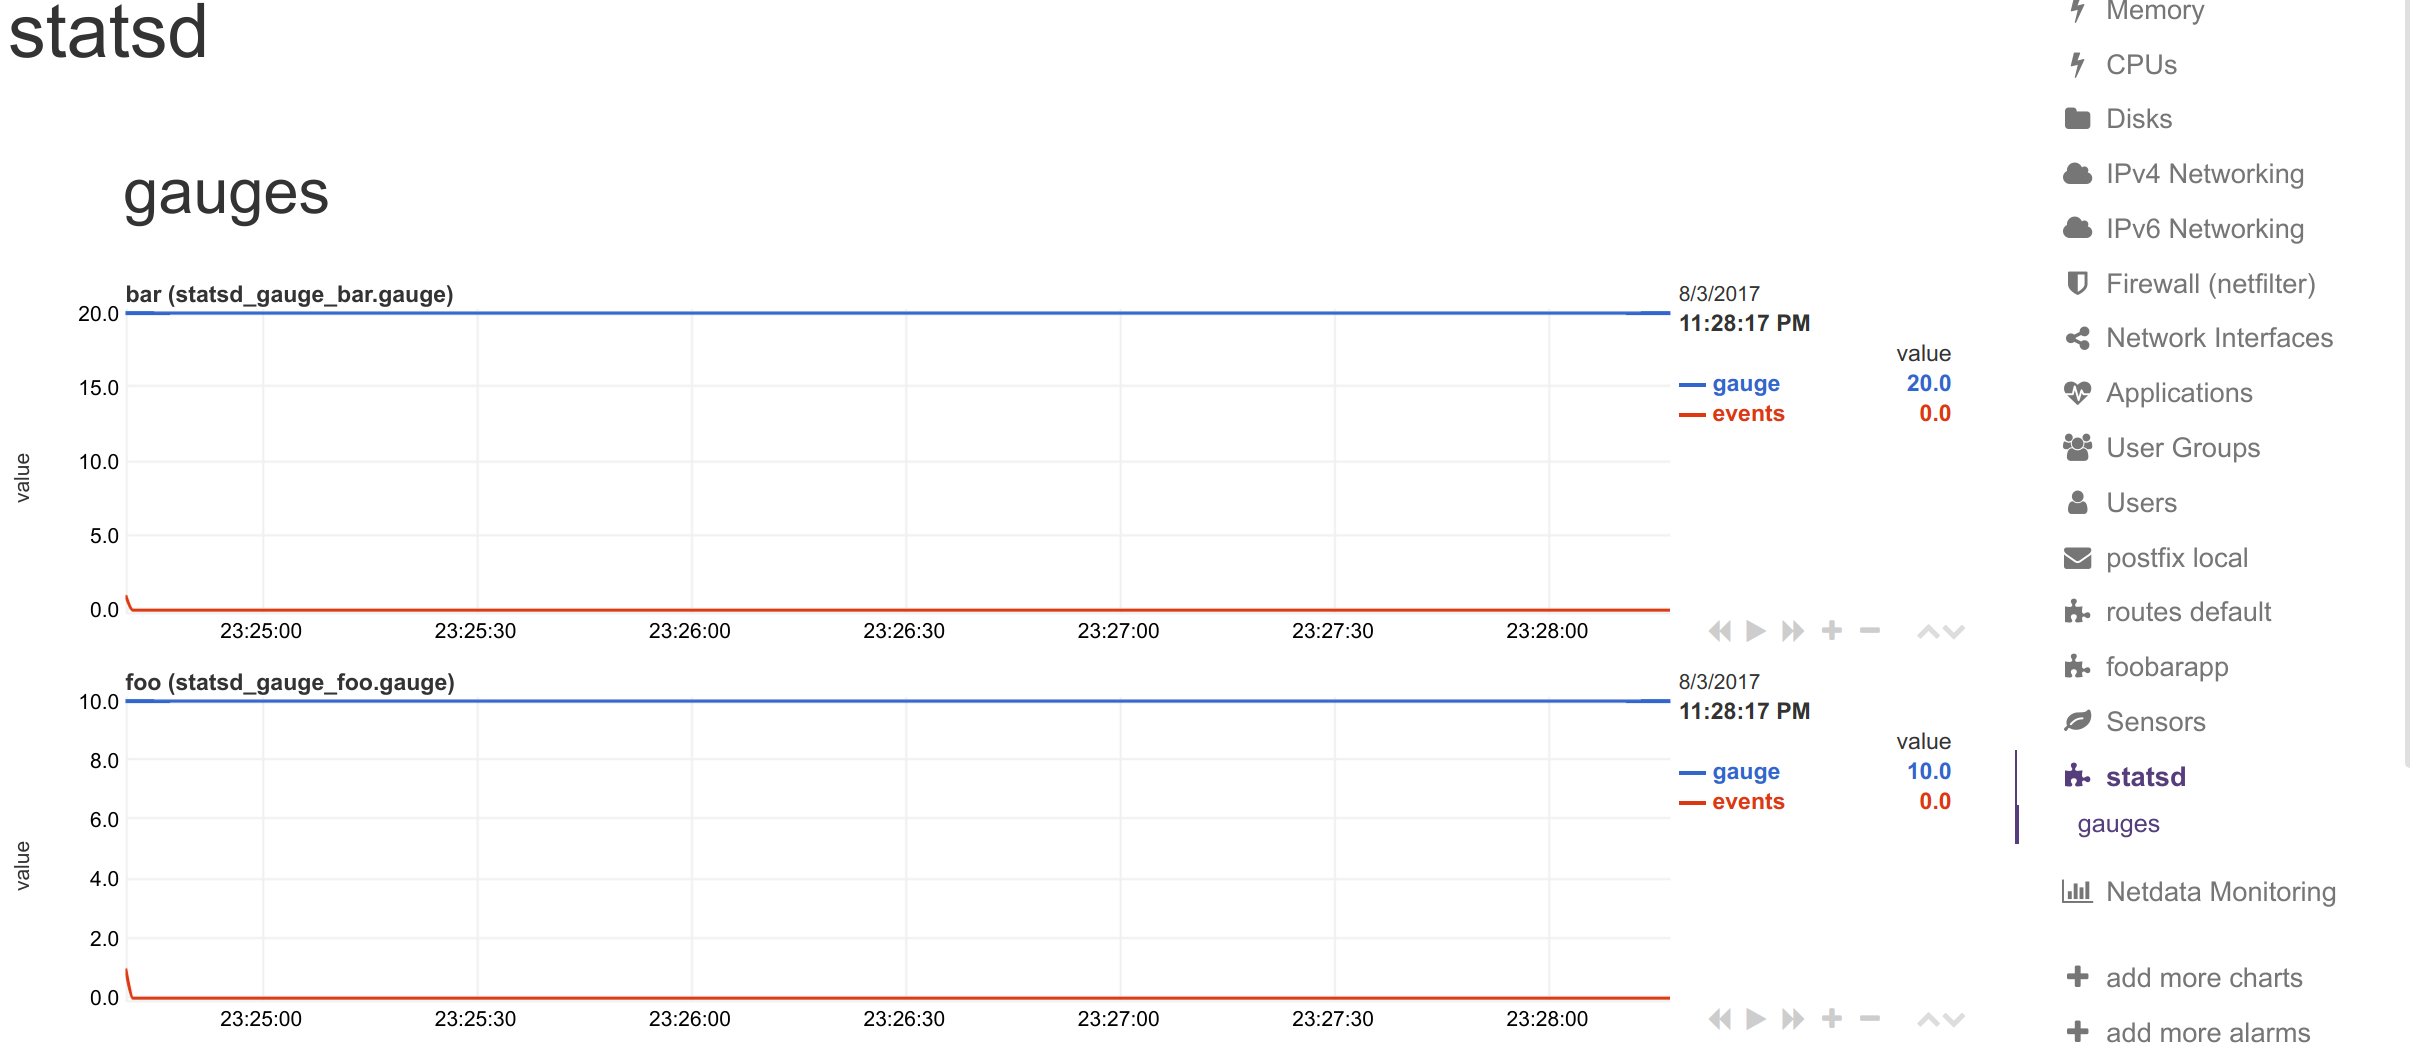 + +and this synthetic chart: + +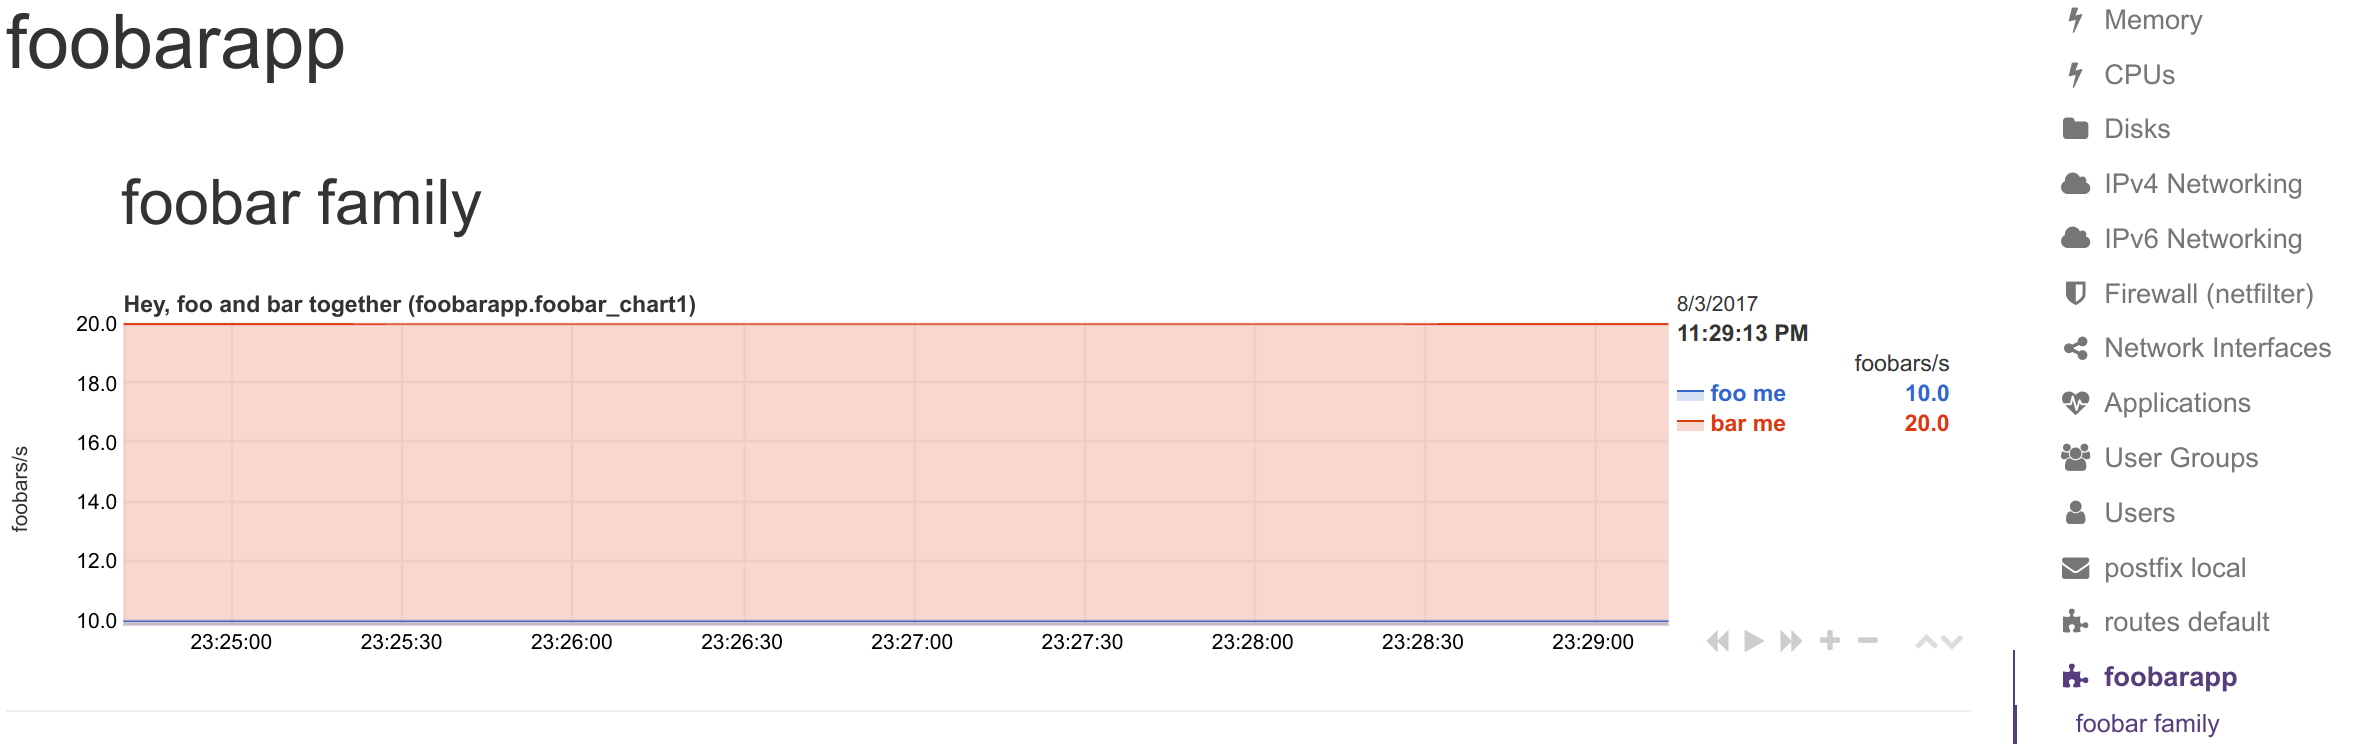 + +#### dictionary to name dimensions + +The `[dictionary]` section accepts any number of `name = value` pairs. + +netdata uses this dictionary as follows: + +1. When a `dimension` has a non-empty `NAME`, that name is looked up at the dictionary. + +2. If the above lookup gives nothing, or the `dimension` has an empty `NAME`, the original statsd metric name is looked up at the dictionary. + +3. If any of the above succeeds, netdata uses the `value` of the dictionary, to set the name of the dimension. The dimensions will have as ID the original statsd metric name, and as name, the dictionary value. + +So, you can use the dictionary in 2 ways: + +1. set `dimension = myapp.metric1 ''` and have at the dictionary `myapp.metric1 = metric1 name` +2. set `dimension = myapp.metric1 'm1'` and have at the dictionary `m1 = metric1 name` + +In both cases, the dimension will be added with ID `myapp.metric1` and will be named `metric1 name`. So, in alarms you can use either of the 2 as `${myapp.metric1}` or `${metric1 name}`. + +> keep in mind that if you add multiple times the same statsd metric to a chart, netdata will append `TYPE` to the dimension ID, so `myapp.metric1` will be added as `myapp.metric1_last` or `myapp.metric1_events`, etc. If you add multiple times the same metric with the same `TYPE` to a chart, netdata will also append an incremental counter to the dimension ID, i.e. `myapp.metric1_last1`, `myapp.metric1_last2`, etc. + +#### dimension patterns + +netdata allows adding multiple dimensions to a chart, by matching the statsd metrics with a netdata simple pattern. + +Assume we have an API that provides statsd metrics for each response code per method it supports, like these: + +``` +myapp.api.get.200 +myapp.api.get.400 +myapp.api.get.500 +myapp.api.del.200 +myapp.api.del.400 +myapp.api.del.500 +myapp.api.post.200 +myapp.api.post.400 +myapp.api.post.500 +myapp.api.all.200 +myapp.api.all.400 +myapp.api.all.500 +``` + +To add all response codes of `myapp.api.get` to a chart use this: + +``` +[api_get_responses] + ... + dimension = pattern 'myapp.api.get.* '' last 1 1 +``` + +The above will add dimension named `200`, `400` and `500` (yes, netdata extracts the wildcarded part of the metric name - so the dimensions will be named with whatever the `*` matched). You can rename the dimensions with this: + +``` +[dictionary] + get.200 = 200 ok + get.400 = 400 bad request + get.500 = 500 cannot connect to db + +[api_get_responses] + ... + dimension = pattern 'myapp.api.get.* 'get.' last 1 1 +``` + +Note that we added a `NAME` to the dimension line with `get.`. This is prefixed to the wildcarded part of the metric name, to compose the key for looking up the dictionary. So `500` became `get.500` which was looked up to the dictionary to find value `500 cannot connect to db`. This way we can have different dimension names, for each of the API methods (i.e. `get.500 = 500 cannot connect to db` while `post.500 = 500 cannot write to disk`). + +To add all API methods to a chart, do this: + +``` +[ok_by_method] + ... + dimension = pattern 'myapp.api.*.200 '' last 1 1 +``` + +The above will add `get`, `post`, `del` and `all` to the chart. + +If `all` is not wanted (a `stacked` chart does not need the `all` dimension, since the sum of the dimensions provides the total), the line should be: + +``` +[ok_by_method] + ... + dimension = pattern '!myapp.api.all.* myapp.api.*.200 '' last 1 1 +``` + +With the above, all methods except `all` will be added to the chart. + +To automatically rename the methods, use this: + +``` +[dictionary] + method.get = GET + method.post = ADD + method.del = DELETE + +[ok_by_method] + ... + dimension = pattern '!myapp.api.all.* myapp.api.*.200 'method.' last 1 1 +``` + +Using the above, the dimensions will be added as `GET`, `ADD` and `DELETE`. + + +## interpolation + +~~If you send just one value to statsd, you will notice that the chart is created but no value is shown. The reason is that netdata interpolates all values at second boundaries. For incremental values (`counters` and `meters` in statsd terminology), if you send 10 at 00:00:00.500, 20 at 00:00:01.500 and 30 at 00:00:02.500, netdata will show 15 at 00:00:01 and 25 at 00:00:02.~~ + +~~This interpolation is automatic and global in netdata for all charts, for incremental values. This means that for the chart to start showing values you need to send 2 values across 2 flush intervals.~~ + +~~(although this is required for incremental values, netdata allows mixing incremental and absolute values on the same charts, so this little limitation [i.e. 2 values to start visualization], is applied on all netdata dimensions).~~ + +(statsd metrics do not loose their first data collection due to interpolation anymore - fixed with [PR #2411](https://github.com/netdata/netdata/pull/2411)) + +## sending statsd metrics from shell scripts + +You can send/update statsd metrics from shell scripts. You can use this feature, to visualize in netdata automated jobs you run on your servers. + +The command you need to run is: + +```sh +echo "NAME:VALUE|TYPE" | nc -u --send-only localhost 8125 +``` + +Where: + +- `NAME` is the metric name +- `VALUE` is the value for that metric (**gauges** `|g`, **timers** `|ms` and **histograms** `|h` accept decimal/fractional numbers, **counters** `|c` and **meters** `|m` accept integers, **sets** `|s` accept anything) +- `TYPE` is one of `g`, `ms`, `h`, `c`, `m`, `s` to select the metric type. + +So, to set `metric1` as gauge to value `10`, use: + +```sh +echo "metric1:10|g" | nc -u --send-only localhost 8125 +``` + +To increment `metric2` by `10`, as a counter, use: + +```sh +echo "metric2:10|c" | nc -u --send-only localhost 8125 +``` + +You can send multiple metrics like this: + +```sh +# send multiple metrics via UDP +printf "metric1:10|g\nmetric2:10|c\n" | nc -u --send-only localhost 8125 +``` + +Remember, for UDP communication each packet should not exceed the MTU. So, if you plan to push too many metrics at once, prefer TCP communication: + +```sh +# send multiple metrics via TCP +printf "metric1:10|g\nmetric2:10|c\n" | nc --send-only localhost 8125 +``` + +You can also use this little function to take care of all the details: + +```sh +#!/usr/bin/env bash + +STATSD_HOST="localhost" +STATSD_PORT="8125" +statsd() { + local udp="-u" all="${*}" + + # if the string length of all parameters given is above 1000, use TCP + [ "${#all}" -gt 1000 ] && udp= + + while [ ! -z "${1}" ] + do + printf "${1}\n" + shift + done | nc ${udp} --send-only ${STATSD_HOST} ${STATSD_PORT} || return 1 + + return 0 +} +``` + +You can use it like this: + +```sh +# first, source it in your script +source statsd.sh + +# then, at any point: +statsd "metric1:10|g" "metric2:10|c" ... +``` + +The function is smart enough to call `nc` just once and pass all the metrics to it. It will also automatically switch to TCP if the metrics to send are above 1000 bytes. diff --git a/collectors/statsd.plugin/example.conf b/collectors/statsd.plugin/example.conf new file mode 100644 index 000000000..2c7de6c7b --- /dev/null +++ b/collectors/statsd.plugin/example.conf @@ -0,0 +1,64 @@ +# statsd synthetic charts configuration + +# You can add many .conf files in /etc/netdata/statsd.d/, +# one for each of your apps. + +# start a new app - you can add many apps in the same file +[app] + # give a name for this app + # this controls the main menu on the dashboard + # and will be the prefix for all charts of the app + name = myexampleapp + + # match all the metrics of the app + metrics = myexampleapp.* + + # shall private charts of these metrics be created? + private charts = no + + # shall gaps be shown when metrics are not collected? + gaps when not collected = no + + # the memory mode for the charts of this app: none|map|save + # the default is to use the global memory mode + #memory mode = ram + + # the history size for the charts of this app, in seconds + # the default is to use the global history + #history = 3600 + +# create a chart +# this is its id - the chart will be named myexampleapp.myexamplechart +[myexamplechart] + # a name for the chart, similar to the id (2 names for each chart) + name = myexamplechart + + # the chart title + title = my chart title + + # the submenu of the dashboard + family = my family + + # the context for alarm templates + context = chart.context + + # the units of the chart + units = tests/s + + # the sorting priority of the chart on the dashboard + priority = 91000 + + # the type of chart to create: line | area | stacked + type = area + + # one or more dimensions for the chart + # type = events | last | min | max | sum | average | percentile | median | stddev + # events = the number of events for this metric + # last = the last value collected + # all the others are only valid for histograms and timers + dimension = myexampleapp.metric1 avg average 1 1 + dimension = myexampleapp.metric1 lower min 1 1 + dimension = myexampleapp.metric1 upper max 1 1 + dimension = myexampleapp.metric2 other last 1 1 + +# You can add as many charts as needed diff --git a/collectors/statsd.plugin/statsd.c b/collectors/statsd.plugin/statsd.c new file mode 100644 index 000000000..c92bfd1c2 --- /dev/null +++ b/collectors/statsd.plugin/statsd.c @@ -0,0 +1,2556 @@ +// SPDX-License-Identifier: GPL-3.0-or-later + +#include "statsd.h" + +#define STATSD_CHART_PREFIX "statsd" + +#define PLUGIN_STATSD_NAME "statsd.plugin" + +// -------------------------------------------------------------------------------------- + +// #define STATSD_MULTITHREADED 1 + +#ifdef STATSD_MULTITHREADED +// DO NOT ENABLE MULTITHREADING - IT IS NOT WELL TESTED +#define STATSD_AVL_TREE avl_tree_lock +#define STATSD_AVL_INSERT avl_insert_lock +#define STATSD_AVL_SEARCH avl_search_lock +#define STATSD_AVL_INDEX_INIT { .avl_tree = { NULL, statsd_metric_compare }, .rwlock = AVL_LOCK_INITIALIZER } +#define STATSD_FIRST_PTR_MUTEX netdata_mutex_t first_mutex +#define STATSD_FIRST_PTR_MUTEX_INIT .first_mutex = NETDATA_MUTEX_INITIALIZER +#define STATSD_FIRST_PTR_MUTEX_LOCK(index) netdata_mutex_lock(&((index)->first_mutex)) +#define STATSD_FIRST_PTR_MUTEX_UNLOCK(index) netdata_mutex_unlock(&((index)->first_mutex)) +#define STATSD_DICTIONARY_OPTIONS DICTIONARY_FLAG_DEFAULT +#else +#define STATSD_AVL_TREE avl_tree +#define STATSD_AVL_INSERT avl_insert +#define STATSD_AVL_SEARCH avl_search +#define STATSD_AVL_INDEX_INIT { .root = NULL, .compar = statsd_metric_compare } +#define STATSD_FIRST_PTR_MUTEX +#define STATSD_FIRST_PTR_MUTEX_INIT +#define STATSD_FIRST_PTR_MUTEX_LOCK(index) +#define STATSD_FIRST_PTR_MUTEX_UNLOCK(index) +#define STATSD_DICTIONARY_OPTIONS DICTIONARY_FLAG_SINGLE_THREADED +#endif + +#define STATSD_DECIMAL_DETAIL 1000 // floating point values get multiplied by this, with the same divisor + +// -------------------------------------------------------------------------------------------------------------------- +// data specific to each metric type + +typedef struct statsd_metric_gauge { + LONG_DOUBLE value; +} STATSD_METRIC_GAUGE; + +typedef struct statsd_metric_counter { // counter and meter + long long value; +} STATSD_METRIC_COUNTER; + +typedef struct statsd_histogram_extensions { + netdata_mutex_t mutex; + + // average is stored in metric->last + collected_number last_min; + collected_number last_max; + collected_number last_percentile; + collected_number last_median; + collected_number last_stddev; + collected_number last_sum; + + int zeroed; + + RRDDIM *rd_min; + RRDDIM *rd_max; + RRDDIM *rd_percentile; + RRDDIM *rd_median; + RRDDIM *rd_stddev; + RRDDIM *rd_sum; + + size_t size; + size_t used; + LONG_DOUBLE *values; // dynamic array of values collected +} STATSD_METRIC_HISTOGRAM_EXTENSIONS; + +typedef struct statsd_metric_histogram { // histogram and timer + STATSD_METRIC_HISTOGRAM_EXTENSIONS *ext; +} STATSD_METRIC_HISTOGRAM; + +typedef struct statsd_metric_set { + DICTIONARY *dict; + size_t unique; +} STATSD_METRIC_SET; + + +// -------------------------------------------------------------------------------------------------------------------- +// this is a metric - for all types of metrics + +typedef enum statsd_metric_options { + STATSD_METRIC_OPTION_NONE = 0x00000000, // no options set + STATSD_METRIC_OPTION_SHOW_GAPS_WHEN_NOT_COLLECTED = 0x00000001, // do not update the chart dimension, when this metric is not collected + STATSD_METRIC_OPTION_PRIVATE_CHART_ENABLED = 0x00000002, // render a private chart for this metric + STATSD_METRIC_OPTION_PRIVATE_CHART_CHECKED = 0x00000004, // the metric has been checked if it should get private chart or not + STATSD_METRIC_OPTION_CHART_DIMENSION_COUNT = 0x00000008, // show the count of events for this private chart + STATSD_METRIC_OPTION_CHECKED_IN_APPS = 0x00000010, // set when this metric has been checked against apps + STATSD_METRIC_OPTION_USED_IN_APPS = 0x00000020, // set when this metric is used in apps + STATSD_METRIC_OPTION_CHECKED = 0x00000040, // set when the charting thread checks this metric for use in charts (its usefulness) + STATSD_METRIC_OPTION_USEFUL = 0x00000080, // set when the charting thread finds the metric useful (i.e. used in a chart) +} STATS_METRIC_OPTIONS; + +typedef enum statsd_metric_type { + STATSD_METRIC_TYPE_GAUGE, + STATSD_METRIC_TYPE_COUNTER, + STATSD_METRIC_TYPE_METER, + STATSD_METRIC_TYPE_TIMER, + STATSD_METRIC_TYPE_HISTOGRAM, + STATSD_METRIC_TYPE_SET +} STATSD_METRIC_TYPE; + + +typedef struct statsd_metric { + avl avl; // indexing - has to be first + + const char *name; // the name of the metric + uint32_t hash; // hash of the name + + STATSD_METRIC_TYPE type; + + // metadata about data collection + collected_number events; // the number of times this metric has been collected (never resets) + size_t count; // the number of times this metric has been collected since the last flush + + // the actual collected data + union { + STATSD_METRIC_GAUGE gauge; + STATSD_METRIC_COUNTER counter; + STATSD_METRIC_HISTOGRAM histogram; + STATSD_METRIC_SET set; + }; + + // chart related members + STATS_METRIC_OPTIONS options; // STATSD_METRIC_OPTION_* (bitfield) + char reset; // set to 1 by the charting thread to instruct the collector thread(s) to reset this metric + collected_number last; // the last value sent to netdata + RRDSET *st; // the private chart of this metric + RRDDIM *rd_value; // the dimension of this metric value + RRDDIM *rd_count; // the dimension for the number of events received + + // linking, used for walking through all metrics + struct statsd_metric *next; + struct statsd_metric *next_useful; +} STATSD_METRIC; + + +// -------------------------------------------------------------------------------------------------------------------- +// each type of metric has its own index + +typedef struct statsd_index { + char *name; // the name of the index of metrics + size_t events; // the number of events processed for this index + size_t metrics; // the number of metrics in this index + size_t useful; // the number of useful metrics in this index + + STATSD_AVL_TREE index; // the AVL tree + + STATSD_METRIC *first; // the linked list of metrics (new metrics are added in front) + STATSD_METRIC *first_useful; // the linked list of useful metrics (new metrics are added in front) + STATSD_FIRST_PTR_MUTEX; // when mutli-threading is enabled, a lock to protect the linked list + + STATS_METRIC_OPTIONS default_options; // default options for all metrics in this index +} STATSD_INDEX; + +static int statsd_metric_compare(void* a, void* b); + +// -------------------------------------------------------------------------------------------------------------------- +// synthetic charts + +typedef enum statsd_app_chart_dimension_value_type { + STATSD_APP_CHART_DIM_VALUE_TYPE_EVENTS, + STATSD_APP_CHART_DIM_VALUE_TYPE_LAST, + STATSD_APP_CHART_DIM_VALUE_TYPE_AVERAGE, + STATSD_APP_CHART_DIM_VALUE_TYPE_SUM, + STATSD_APP_CHART_DIM_VALUE_TYPE_MIN, + STATSD_APP_CHART_DIM_VALUE_TYPE_MAX, + STATSD_APP_CHART_DIM_VALUE_TYPE_PERCENTILE, + STATSD_APP_CHART_DIM_VALUE_TYPE_MEDIAN, + STATSD_APP_CHART_DIM_VALUE_TYPE_STDDEV +} STATSD_APP_CHART_DIM_VALUE_TYPE; + +typedef struct statsd_app_chart_dimension { + const char *name; // the name of this dimension + const char *metric; // the source metric name of this dimension + uint32_t metric_hash; // hash for fast string comparisons + + SIMPLE_PATTERN *metric_pattern; // set when the 'metric' is a simple pattern + + collected_number multiplier; // the multipler of the dimension + collected_number divisor; // the divisor of the dimension + RRDDIM_FLAGS flags; // the RRDDIM flags for this dimension + + STATSD_APP_CHART_DIM_VALUE_TYPE value_type; // which value to use of the source metric + + RRDDIM *rd; // a pointer to the RRDDIM that has been created for this dimension + collected_number *value_ptr; // a pointer to the source metric value + RRD_ALGORITHM algorithm; // the algorithm of this dimension + + struct statsd_app_chart_dimension *next; // the next dimension for this chart +} STATSD_APP_CHART_DIM; + +typedef struct statsd_app_chart { + const char *source; + const char *id; + const char *name; + const char *title; + const char *family; + const char *context; + const char *units; + long priority; + RRDSET_TYPE chart_type; + STATSD_APP_CHART_DIM *dimensions; + size_t dimensions_count; + size_t dimensions_linked_count; + + RRDSET *st; + struct statsd_app_chart *next; +} STATSD_APP_CHART; + +typedef struct statsd_app { + const char *name; + SIMPLE_PATTERN *metrics; + STATS_METRIC_OPTIONS default_options; + RRD_MEMORY_MODE rrd_memory_mode; + DICTIONARY *dict; + long rrd_history_entries; + + const char *source; + STATSD_APP_CHART *charts; + struct statsd_app *next; +} STATSD_APP; + +// -------------------------------------------------------------------------------------------------------------------- +// global statsd data + +struct collection_thread_status { + int status; + size_t max_sockets; + + netdata_thread_t thread; + struct rusage rusage; + RRDSET *st_cpu; + RRDDIM *rd_user; + RRDDIM *rd_system; +}; + +static struct statsd { + STATSD_INDEX gauges; + STATSD_INDEX counters; + STATSD_INDEX timers; + STATSD_INDEX histograms; + STATSD_INDEX meters; + STATSD_INDEX sets; + size_t unknown_types; + size_t socket_errors; + size_t tcp_socket_connects; + size_t tcp_socket_disconnects; + size_t tcp_socket_connected; + size_t tcp_socket_reads; + size_t tcp_packets_received; + size_t tcp_bytes_read; + size_t udp_socket_reads; + size_t udp_packets_received; + size_t udp_bytes_read; + + int enabled; + int update_every; + SIMPLE_PATTERN *charts_for; + + size_t tcp_idle_timeout; + collected_number decimal_detail; + size_t private_charts; + size_t max_private_charts; + size_t max_private_charts_hard; + RRD_MEMORY_MODE private_charts_memory_mode; + long private_charts_rrd_history_entries; + unsigned int private_charts_hidden:1; + + STATSD_APP *apps; + size_t recvmmsg_size; + size_t histogram_increase_step; + double histogram_percentile; + char *histogram_percentile_str; + + int threads; + struct collection_thread_status *collection_threads_status; + + LISTEN_SOCKETS sockets; +} statsd = { + .enabled = 1, + .max_private_charts = 200, + .max_private_charts_hard = 1000, + .private_charts_hidden = 0, + .recvmmsg_size = 10, + .decimal_detail = STATSD_DECIMAL_DETAIL, + + .gauges = { + .name = "gauge", + .events = 0, + .metrics = 0, + .index = STATSD_AVL_INDEX_INIT, + .default_options = STATSD_METRIC_OPTION_NONE, + .first = NULL, + STATSD_FIRST_PTR_MUTEX_INIT + }, + .counters = { + .name = "counter", + .events = 0, + .metrics = 0, + .index = STATSD_AVL_INDEX_INIT, + .default_options = STATSD_METRIC_OPTION_NONE, + .first = NULL, + STATSD_FIRST_PTR_MUTEX_INIT + }, + .timers = { + .name = "timer", + .events = 0, + .metrics = 0, + .index = STATSD_AVL_INDEX_INIT, + .default_options = STATSD_METRIC_OPTION_NONE, + .first = NULL, + STATSD_FIRST_PTR_MUTEX_INIT + }, + .histograms = { + .name = "histogram", + .events = 0, + .metrics = 0, + .index = STATSD_AVL_INDEX_INIT, + .default_options = STATSD_METRIC_OPTION_NONE, + .first = NULL, + STATSD_FIRST_PTR_MUTEX_INIT + }, + .meters = { + .name = "meter", + .events = 0, + .metrics = 0, + .index = STATSD_AVL_INDEX_INIT, + .default_options = STATSD_METRIC_OPTION_NONE, + .first = NULL, + STATSD_FIRST_PTR_MUTEX_INIT + }, + .sets = { + .name = "set", + .events = 0, + .metrics = 0, + .index = STATSD_AVL_INDEX_INIT, + .default_options = STATSD_METRIC_OPTION_NONE, + .first = NULL, + STATSD_FIRST_PTR_MUTEX_INIT + }, + + .tcp_idle_timeout = 600, + + .apps = NULL, + .histogram_percentile = 95.0, + .histogram_increase_step = 10, + .threads = 0, + .collection_threads_status = NULL, + .sockets = { + .config = &netdata_config, + .config_section = CONFIG_SECTION_STATSD, + .default_bind_to = "udp:localhost tcp:localhost", + .default_port = STATSD_LISTEN_PORT, + .backlog = STATSD_LISTEN_BACKLOG + }, +}; + + +// -------------------------------------------------------------------------------------------------------------------- +// statsd index management - add/find metrics + +static int statsd_metric_compare(void* a, void* b) { + if(((STATSD_METRIC *)a)->hash < ((STATSD_METRIC *)b)->hash) return -1; + else if(((STATSD_METRIC *)a)->hash > ((STATSD_METRIC *)b)->hash) return 1; + else return strcmp(((STATSD_METRIC *)a)->name, ((STATSD_METRIC *)b)->name); +} + +static inline STATSD_METRIC *statsd_metric_index_find(STATSD_INDEX *index, const char *name, uint32_t hash) { + STATSD_METRIC tmp; + tmp.name = name; + tmp.hash = (hash)?hash:simple_hash(tmp.name); + + return (STATSD_METRIC *)STATSD_AVL_SEARCH(&index->index, (avl *)&tmp); +} + +static inline STATSD_METRIC *statsd_find_or_add_metric(STATSD_INDEX *index, const char *name, STATSD_METRIC_TYPE type) { + debug(D_STATSD, "searching for metric '%s' under '%s'", name, index->name); + + uint32_t hash = simple_hash(name); + + STATSD_METRIC *m = statsd_metric_index_find(index, name, hash); + if(unlikely(!m)) { + debug(D_STATSD, "Creating new %s metric '%s'", index->name, name); + + m = (STATSD_METRIC *)callocz(sizeof(STATSD_METRIC), 1); + m->name = strdupz(name); + m->hash = hash; + m->type = type; + m->options = index->default_options; + + if(type == STATSD_METRIC_TYPE_HISTOGRAM || type == STATSD_METRIC_TYPE_TIMER) { + m->histogram.ext = callocz(sizeof(STATSD_METRIC_HISTOGRAM_EXTENSIONS), 1); + netdata_mutex_init(&m->histogram.ext->mutex); + } + STATSD_METRIC *n = (STATSD_METRIC *)STATSD_AVL_INSERT(&index->index, (avl *)m); + if(unlikely(n != m)) { + freez((void *)m->histogram.ext); + freez((void *)m->name); + freez((void *)m); + m = n; + } + else { + STATSD_FIRST_PTR_MUTEX_LOCK(index); + index->metrics++; + m->next = index->first; + index->first = m; + STATSD_FIRST_PTR_MUTEX_UNLOCK(index); + } + } + + index->events++; + return m; +} + + +// -------------------------------------------------------------------------------------------------------------------- +// statsd parsing numbers + +static inline LONG_DOUBLE statsd_parse_float(const char *v, LONG_DOUBLE def) { + LONG_DOUBLE value; + + if(likely(v && *v)) { + char *e = NULL; + value = str2ld(v, &e); + if(unlikely(e && *e)) + error("STATSD: excess data '%s' after value '%s'", e, v); + } + else + value = def; + + return value; +} + +static inline LONG_DOUBLE statsd_parse_sampling_rate(const char *v) { + LONG_DOUBLE sampling_rate = statsd_parse_float(v, 1.0); + if(unlikely(isless(sampling_rate, 0.001))) sampling_rate = 0.001; + if(unlikely(isgreater(sampling_rate, 1.0))) sampling_rate = 1.0; + return sampling_rate; +} + +static inline long long statsd_parse_int(const char *v, long long def) { + long long value; + + if(likely(v && *v)) { + char *e = NULL; + value = str2ll(v, &e); + if(unlikely(e && *e)) + error("STATSD: excess data '%s' after value '%s'", e, v); + } + else + value = def; + + return value; +} + + +// -------------------------------------------------------------------------------------------------------------------- +// statsd processors per metric type + +static inline void statsd_reset_metric(STATSD_METRIC *m) { + m->reset = 0; + m->count = 0; +} + +static inline int value_is_zinit(const char *value) { + return (value && *value == 'z' && *++value == 'i' && *++value == 'n' && *++value == 'i' && *++value == 't' && *++value == '\0'); +} + +#define is_metric_checked(m) ((m)->options & STATSD_METRIC_OPTION_CHECKED) +#define is_metric_useful_for_collection(m) (!is_metric_checked(m) || ((m)->options & STATSD_METRIC_OPTION_USEFUL)) + +static inline void statsd_process_gauge(STATSD_METRIC *m, const char *value, const char *sampling) { + if(!is_metric_useful_for_collection(m)) return; + + if(unlikely(!value || !*value)) { + error("STATSD: metric '%s' of type gauge, with empty value is ignored.", m->name); + return; + } + + if(unlikely(m->reset)) { + // no need to reset anything specific for gauges + statsd_reset_metric(m); + } + + if(unlikely(value_is_zinit(value))) { + // magic loading of metric, without affecting anything + } + else { + if (unlikely(*value == '+' || *value == '-')) + m->gauge.value += statsd_parse_float(value, 1.0) / statsd_parse_sampling_rate(sampling); + else + m->gauge.value = statsd_parse_float(value, 1.0); + + m->events++; + m->count++; + } +} + +static inline void statsd_process_counter_or_meter(STATSD_METRIC *m, const char *value, const char *sampling) { + if(!is_metric_useful_for_collection(m)) return; + + // we accept empty values for counters + + if(unlikely(m->reset)) statsd_reset_metric(m); + + if(unlikely(value_is_zinit(value))) { + // magic loading of metric, without affecting anything + } + else { + m->counter.value += llrintl((LONG_DOUBLE) statsd_parse_int(value, 1) / statsd_parse_sampling_rate(sampling)); + + m->events++; + m->count++; + } +} + +#define statsd_process_counter(m, value, sampling) statsd_process_counter_or_meter(m, value, sampling) +#define statsd_process_meter(m, value, sampling) statsd_process_counter_or_meter(m, value, sampling) + +static inline void statsd_process_histogram_or_timer(STATSD_METRIC *m, const char *value, const char *sampling, const char *type) { + if(!is_metric_useful_for_collection(m)) return; + + if(unlikely(!value || !*value)) { + error("STATSD: metric of type %s, with empty value is ignored.", type); + return; + } + + if(unlikely(m->reset)) { + m->histogram.ext->used = 0; + statsd_reset_metric(m); + } + + if(unlikely(value_is_zinit(value))) { + // magic loading of metric, without affecting anything + } + else { + LONG_DOUBLE v = statsd_parse_float(value, 1.0); + LONG_DOUBLE sampling_rate = statsd_parse_sampling_rate(sampling); + if(unlikely(isless(sampling_rate, 0.01))) sampling_rate = 0.01; + if(unlikely(isgreater(sampling_rate, 1.0))) sampling_rate = 1.0; + + long long samples = llrintl(1.0 / sampling_rate); + while(samples-- > 0) { + + if(unlikely(m->histogram.ext->used == m->histogram.ext->size)) { + netdata_mutex_lock(&m->histogram.ext->mutex); + m->histogram.ext->size += statsd.histogram_increase_step; + m->histogram.ext->values = reallocz(m->histogram.ext->values, sizeof(LONG_DOUBLE) * m->histogram.ext->size); + netdata_mutex_unlock(&m->histogram.ext->mutex); + } + + m->histogram.ext->values[m->histogram.ext->used++] = v; + } + + m->events++; + m->count++; + } +} + +#define statsd_process_timer(m, value, sampling) statsd_process_histogram_or_timer(m, value, sampling, "timer") +#define statsd_process_histogram(m, value, sampling) statsd_process_histogram_or_timer(m, value, sampling, "histogram") + +static inline void statsd_process_set(STATSD_METRIC *m, const char *value) { + if(!is_metric_useful_for_collection(m)) return; + + if(unlikely(!value || !*value)) { + error("STATSD: metric of type set, with empty value is ignored."); + return; + } + + if(unlikely(m->reset)) { + if(likely(m->set.dict)) { + dictionary_destroy(m->set.dict); + m->set.dict = NULL; + } + statsd_reset_metric(m); + } + + if (unlikely(!m->set.dict)) { + m->set.dict = dictionary_create(STATSD_DICTIONARY_OPTIONS | DICTIONARY_FLAG_VALUE_LINK_DONT_CLONE); + m->set.unique = 0; + } + + if(unlikely(value_is_zinit(value))) { + // magic loading of metric, without affecting anything + } + else { + void *t = dictionary_get(m->set.dict, value); + if (unlikely(!t)) { + dictionary_set(m->set.dict, value, NULL, 1); + m->set.unique++; + } + + m->events++; + m->count++; + } +} + + +// -------------------------------------------------------------------------------------------------------------------- +// statsd parsing + +static void statsd_process_metric(const char *name, const char *value, const char *type, const char *sampling, const char *tags) { + (void)tags; + + debug(D_STATSD, "STATSD: raw metric '%s', value '%s', type '%s', sampling '%s', tags '%s'", name?name:"(null)", value?value:"(null)", type?type:"(null)", sampling?sampling:"(null)", tags?tags:"(null)"); + + if(unlikely(!name || !*name)) return; + if(unlikely(!type || !*type)) type = "m"; + + char t0 = type[0], t1 = type[1]; + + if(unlikely(t0 == 'g' && t1 == '\0')) { + statsd_process_gauge( + statsd_find_or_add_metric(&statsd.gauges, name, STATSD_METRIC_TYPE_GAUGE), + value, sampling); + } + else if(unlikely((t0 == 'c' || t0 == 'C') && t1 == '\0')) { + // etsy/statsd uses 'c' + // brubeck uses 'C' + statsd_process_counter( + statsd_find_or_add_metric(&statsd.counters, name, STATSD_METRIC_TYPE_COUNTER), + value, sampling); + } + else if(unlikely(t0 == 'm' && t1 == '\0')) { + statsd_process_meter( + statsd_find_or_add_metric(&statsd.meters, name, STATSD_METRIC_TYPE_METER), + value, sampling); + } + else if(unlikely(t0 == 'h' && t1 == '\0')) { + statsd_process_histogram( + statsd_find_or_add_metric(&statsd.histograms, name, STATSD_METRIC_TYPE_HISTOGRAM), + value, sampling); + } + else if(unlikely(t0 == 's' && t1 == '\0')) { + statsd_process_set( + statsd_find_or_add_metric(&statsd.sets, name, STATSD_METRIC_TYPE_SET), + value); + } + else if(unlikely(t0 == 'm' && t1 == 's' && type[2] == '\0')) { + statsd_process_timer( + statsd_find_or_add_metric(&statsd.timers, name, STATSD_METRIC_TYPE_TIMER), + value, sampling); + } + else { + statsd.unknown_types++; + error("STATSD: metric '%s' with value '%s' is sent with unknown metric type '%s'", name, value?value:"", type); + } +} + +static inline const char *statsd_parse_skip_up_to(const char *s, char d1, char d2) { + char c; + + for(c = *s; c && c != d1 && c != d2 && c != '\r' && c != '\n'; c = *++s) ; + + return s; +} + +const char *statsd_parse_skip_spaces(const char *s) { + char c; + + for(c = *s; c && ( c == ' ' || c == '\t' || c == '\r' || c == '\n' ); c = *++s) ; + + return s; +} + +static inline const char *statsd_parse_field_trim(const char *start, char *end) { + if(unlikely(!start)) { + start = end; + return start; + } + + while(start <= end && (*start == ' ' || *start == '\t')) + start++; + + *end = '\0'; + end--; + while(end >= start && (*end == ' ' || *end == '\t')) + *end-- = '\0'; + + return start; +} + +static inline size_t statsd_process(char *buffer, size_t size, int require_newlines) { + buffer[size] = '\0'; + debug(D_STATSD, "RECEIVED: %zu bytes: '%s'", size, buffer); + + const char *s = buffer; + while(*s) { + const char *name = NULL, *value = NULL, *type = NULL, *sampling = NULL, *tags = NULL; + char *name_end = NULL, *value_end = NULL, *type_end = NULL, *sampling_end = NULL, *tags_end = NULL; + + s = name_end = (char *)statsd_parse_skip_up_to(name = s, ':', '|'); + if(name == name_end) { + s = statsd_parse_skip_spaces(s); + continue; + } + + if(likely(*s == ':')) + s = value_end = (char *) statsd_parse_skip_up_to(value = ++s, '|', '|'); + + if(likely(*s == '|')) + s = type_end = (char *) statsd_parse_skip_up_to(type = ++s, '|', '@'); + + if(likely(*s == '|' || *s == '@')) { + s = sampling_end = (char *) statsd_parse_skip_up_to(sampling = ++s, '|', '#'); + if(*sampling == '@') sampling++; + } + + if(likely(*s == '|' || *s == '#')) { + s = tags_end = (char *) statsd_parse_skip_up_to(tags = ++s, '|', '|'); + if(*tags == '#') tags++; + } + + // skip everything until the end of the line + while(*s && *s != '\n') s++; + + if(unlikely(require_newlines && *s != '\n' && s > buffer)) { + // move the remaining data to the beginning + size -= (name - buffer); + memmove(buffer, name, size); + return size; + } + else + s = statsd_parse_skip_spaces(s); + + statsd_process_metric( + statsd_parse_field_trim(name, name_end) + , statsd_parse_field_trim(value, value_end) + , statsd_parse_field_trim(type, type_end) + , statsd_parse_field_trim(sampling, sampling_end) + , statsd_parse_field_trim(tags, tags_end) + ); + } + + return 0; +} + + +// -------------------------------------------------------------------------------------------------------------------- +// statsd pollfd interface + +#define STATSD_TCP_BUFFER_SIZE 65536 // minimize tcp reads +#define STATSD_UDP_BUFFER_SIZE 9000 // this should be up to MTU + +typedef enum { + STATSD_SOCKET_DATA_TYPE_TCP, + STATSD_SOCKET_DATA_TYPE_UDP +} STATSD_SOCKET_DATA_TYPE; + +struct statsd_tcp { + STATSD_SOCKET_DATA_TYPE type; + size_t size; + size_t len; + char buffer[]; +}; + +#ifdef HAVE_RECVMMSG +struct statsd_udp { + int *running; + STATSD_SOCKET_DATA_TYPE type; + size_t size; + struct iovec *iovecs; + struct mmsghdr *msgs; +}; +#else +struct statsd_udp { + int *running; + STATSD_SOCKET_DATA_TYPE type; + char buffer[STATSD_UDP_BUFFER_SIZE]; +}; +#endif + +// new TCP client connected +static void *statsd_add_callback(POLLINFO *pi, short int *events, void *data) { + (void)pi; + (void)data; + + *events = POLLIN; + + struct statsd_tcp *t = (struct statsd_tcp *)callocz(sizeof(struct statsd_tcp) + STATSD_TCP_BUFFER_SIZE, 1); + t->type = STATSD_SOCKET_DATA_TYPE_TCP; + t->size = STATSD_TCP_BUFFER_SIZE - 1; + statsd.tcp_socket_connects++; + statsd.tcp_socket_connected++; + + return t; +} + +// TCP client disconnected +static void statsd_del_callback(POLLINFO *pi) { + struct statsd_tcp *t = pi->data; + + if(likely(t)) { + if(t->type == STATSD_SOCKET_DATA_TYPE_TCP) { + if(t->len != 0) { + statsd.socket_errors++; + error("STATSD: client is probably sending unterminated metrics. Closed socket left with '%s'. Trying to process it.", t->buffer); + statsd_process(t->buffer, t->len, 0); + } + statsd.tcp_socket_disconnects++; + statsd.tcp_socket_connected--; + } + else + error("STATSD: internal error: received socket data type is %d, but expected %d", (int)t->type, (int)STATSD_SOCKET_DATA_TYPE_TCP); + + freez(t); + } +} + +// Receive data +static int statsd_rcv_callback(POLLINFO *pi, short int *events) { + *events = POLLIN; + + int fd = pi->fd; + + switch(pi->socktype) { + case SOCK_STREAM: { + struct statsd_tcp *d = (struct statsd_tcp *)pi->data; + if(unlikely(!d)) { + error("STATSD: internal error: expected TCP data pointer is NULL"); + statsd.socket_errors++; + return -1; + } + +#ifdef NETDATA_INTERNAL_CHECKS + if(unlikely(d->type != STATSD_SOCKET_DATA_TYPE_TCP)) { + error("STATSD: internal error: socket data type should be %d, but it is %d", (int)STATSD_SOCKET_DATA_TYPE_TCP, (int)d->type); + statsd.socket_errors++; + return -1; + } +#endif + + int ret = 0; + ssize_t rc; + do { + rc = recv(fd, &d->buffer[d->len], d->size - d->len, MSG_DONTWAIT); + if (rc < 0) { + // read failed + if (errno != EWOULDBLOCK && errno != EAGAIN && errno != EINTR) { + error("STATSD: recv() on TCP socket %d failed.", fd); + statsd.socket_errors++; + ret = -1; + } + } + else if (!rc) { + // connection closed + debug(D_STATSD, "STATSD: client disconnected."); + ret = -1; + } + else { + // data received + d->len += rc; + statsd.tcp_socket_reads++; + statsd.tcp_bytes_read += rc; + } + + if(likely(d->len > 0)) { + statsd.tcp_packets_received++; + d->len = statsd_process(d->buffer, d->len, 1); + } + + if(unlikely(ret == -1)) + return -1; + + } while (rc != -1); + break; + } + + case SOCK_DGRAM: { + struct statsd_udp *d = (struct statsd_udp *)pi->data; + if(unlikely(!d)) { + error("STATSD: internal error: expected UDP data pointer is NULL"); + statsd.socket_errors++; + return -1; + } + +#ifdef NETDATA_INTERNAL_CHECKS + if(unlikely(d->type != STATSD_SOCKET_DATA_TYPE_UDP)) { + error("STATSD: internal error: socket data should be %d, but it is %d", (int)d->type, (int)STATSD_SOCKET_DATA_TYPE_UDP); + statsd.socket_errors++; + return -1; + } +#endif + +#ifdef HAVE_RECVMMSG + ssize_t rc; + do { + rc = recvmmsg(fd, d->msgs, (unsigned int)d->size, MSG_DONTWAIT, NULL); + if (rc < 0) { + // read failed + if (errno != EWOULDBLOCK && errno != EAGAIN && errno != EINTR) { + error("STATSD: recvmmsg() on UDP socket %d failed.", fd); + statsd.socket_errors++; + return -1; + } + } else if (rc) { + // data received + statsd.udp_socket_reads++; + statsd.udp_packets_received += rc; + + size_t i; + for (i = 0; i < (size_t)rc; ++i) { + size_t len = (size_t)d->msgs[i].msg_len; + statsd.udp_bytes_read += len; + statsd_process(d->msgs[i].msg_hdr.msg_iov->iov_base, len, 0); + } + } + } while (rc != -1); + +#else // !HAVE_RECVMMSG + ssize_t rc; + do { + rc = recv(fd, d->buffer, STATSD_UDP_BUFFER_SIZE - 1, MSG_DONTWAIT); + if (rc < 0) { + // read failed + if (errno != EWOULDBLOCK && errno != EAGAIN && errno != EINTR) { + error("STATSD: recv() on UDP socket %d failed.", fd); + statsd.socket_errors++; + return -1; + } + } else if (rc) { + // data received + statsd.udp_socket_reads++; + statsd.udp_packets_received++; + statsd.udp_bytes_read += rc; + statsd_process(d->buffer, (size_t) rc, 0); + } + } while (rc != -1); +#endif + + break; + } + + default: { + error("STATSD: internal error: unknown socktype %d on socket %d", pi->socktype, fd); + statsd.socket_errors++; + return -1; + } + } + + return 0; +} + +static int statsd_snd_callback(POLLINFO *pi, short int *events) { + (void)pi; + (void)events; + + error("STATSD: snd_callback() called, but we never requested to send data to statsd clients."); + return -1; +} + +static void statsd_timer_callback(void *timer_data) { + struct collection_thread_status *status = timer_data; + getrusage(RUSAGE_THREAD, &status->rusage); +} + +// -------------------------------------------------------------------------------------------------------------------- +// statsd child thread to collect metrics from network + +void statsd_collector_thread_cleanup(void *data) { + struct statsd_udp *d = data; + *d->running = 0; + + info("cleaning up..."); + +#ifdef HAVE_RECVMMSG + size_t i; + for (i = 0; i < d->size; i++) + freez(d->iovecs[i].iov_base); + + freez(d->iovecs); + freez(d->msgs); +#endif + + freez(d); +} + +void *statsd_collector_thread(void *ptr) { + struct collection_thread_status *status = ptr; + status->status = 1; + + info("STATSD collector thread started with taskid %d", gettid()); + + struct statsd_udp *d = callocz(sizeof(struct statsd_udp), 1); + d->running = &status->status; + + netdata_thread_cleanup_push(statsd_collector_thread_cleanup, d); + +#ifdef HAVE_RECVMMSG + d->type = STATSD_SOCKET_DATA_TYPE_UDP; + d->size = statsd.recvmmsg_size; + d->iovecs = callocz(sizeof(struct iovec), d->size); + d->msgs = callocz(sizeof(struct mmsghdr), d->size); + + size_t i; + for (i = 0; i < d->size; i++) { + d->iovecs[i].iov_base = mallocz(STATSD_UDP_BUFFER_SIZE); + d->iovecs[i].iov_len = STATSD_UDP_BUFFER_SIZE - 1; + d->msgs[i].msg_hdr.msg_iov = &d->iovecs[i]; + d->msgs[i].msg_hdr.msg_iovlen = 1; + } +#endif + + poll_events(&statsd.sockets + , statsd_add_callback + , statsd_del_callback + , statsd_rcv_callback + , statsd_snd_callback + , statsd_timer_callback + , NULL + , (void *)d + , 0 // tcp request timeout, 0 = disabled + , statsd.tcp_idle_timeout // tcp idle timeout, 0 = disabled + , statsd.update_every * 1000 + , ptr // timer_data + , status->max_sockets + ); + + netdata_thread_cleanup_pop(1); + return NULL; +} + + +// -------------------------------------------------------------------------------------------------------------------- +// statsd applications configuration files parsing + +#define STATSD_CONF_LINE_MAX 8192 + +static STATSD_APP_CHART_DIM_VALUE_TYPE string2valuetype(const char *type, size_t line, const char *filename) { + if(!type || !*type) type = "last"; + + if(!strcmp(type, "events")) return STATSD_APP_CHART_DIM_VALUE_TYPE_EVENTS; + else if(!strcmp(type, "last")) return STATSD_APP_CHART_DIM_VALUE_TYPE_LAST; + else if(!strcmp(type, "min")) return STATSD_APP_CHART_DIM_VALUE_TYPE_MIN; + else if(!strcmp(type, "max")) return STATSD_APP_CHART_DIM_VALUE_TYPE_MAX; + else if(!strcmp(type, "sum")) return STATSD_APP_CHART_DIM_VALUE_TYPE_SUM; + else if(!strcmp(type, "average")) return STATSD_APP_CHART_DIM_VALUE_TYPE_AVERAGE; + else if(!strcmp(type, "median")) return STATSD_APP_CHART_DIM_VALUE_TYPE_MEDIAN; + else if(!strcmp(type, "stddev")) return STATSD_APP_CHART_DIM_VALUE_TYPE_STDDEV; + else if(!strcmp(type, "percentile")) return STATSD_APP_CHART_DIM_VALUE_TYPE_PERCENTILE; + + error("STATSD: invalid type '%s' at line %zu of file '%s'. Using 'last'.", type, line, filename); + return STATSD_APP_CHART_DIM_VALUE_TYPE_LAST; +} + +static const char *valuetype2string(STATSD_APP_CHART_DIM_VALUE_TYPE type) { + switch(type) { + case STATSD_APP_CHART_DIM_VALUE_TYPE_EVENTS: return "events"; + case STATSD_APP_CHART_DIM_VALUE_TYPE_LAST: return "last"; + case STATSD_APP_CHART_DIM_VALUE_TYPE_MIN: return "min"; + case STATSD_APP_CHART_DIM_VALUE_TYPE_MAX: return "max"; + case STATSD_APP_CHART_DIM_VALUE_TYPE_SUM: return "sum"; + case STATSD_APP_CHART_DIM_VALUE_TYPE_AVERAGE: return "average"; + case STATSD_APP_CHART_DIM_VALUE_TYPE_MEDIAN: return "median"; + case STATSD_APP_CHART_DIM_VALUE_TYPE_STDDEV: return "stddev"; + case STATSD_APP_CHART_DIM_VALUE_TYPE_PERCENTILE: return "percentile"; + } + + return "unknown"; +} + +static STATSD_APP_CHART_DIM *add_dimension_to_app_chart( + STATSD_APP *app + , STATSD_APP_CHART *chart + , const char *metric_name + , const char *dim_name + , collected_number multiplier + , collected_number divisor + , RRDDIM_FLAGS flags + , STATSD_APP_CHART_DIM_VALUE_TYPE value_type +) { + STATSD_APP_CHART_DIM *dim = callocz(sizeof(STATSD_APP_CHART_DIM), 1); + + dim->metric = strdupz(metric_name); + dim->metric_hash = simple_hash(dim->metric); + + dim->name = strdupz((dim_name)?dim_name:""); + dim->multiplier = multiplier; + dim->divisor = divisor; + dim->value_type = value_type; + dim->flags = flags; + + if(!dim->multiplier) + dim->multiplier = 1; + + if(!dim->divisor) + dim->divisor = 1; + + // append it to the list of dimension + STATSD_APP_CHART_DIM *tdim; + for(tdim = chart->dimensions; tdim && tdim->next ; tdim = tdim->next) ; + if(!tdim) { + dim->next = chart->dimensions; + chart->dimensions = dim; + } + else { + dim->next = tdim->next; + tdim->next = dim; + } + chart->dimensions_count++; + + debug(D_STATSD, "Added dimension '%s' to chart '%s' of app '%s', for metric '%s', with type %u, multiplier " COLLECTED_NUMBER_FORMAT ", divisor " COLLECTED_NUMBER_FORMAT, + dim->name, chart->id, app->name, dim->metric, dim->value_type, dim->multiplier, dim->divisor); + + return dim; +} + +static int statsd_readfile(const char *filename, STATSD_APP *app, STATSD_APP_CHART *chart, DICTIONARY *dict) { + debug(D_STATSD, "STATSD configuration reading file '%s'", filename); + + char *buffer = mallocz(STATSD_CONF_LINE_MAX + 1); + + FILE *fp = fopen(filename, "r"); + if(!fp) { + error("STATSD: cannot open file '%s'.", filename); + freez(buffer); + return -1; + } + + size_t line = 0; + char *s; + while(fgets(buffer, STATSD_CONF_LINE_MAX, fp) != NULL) { + buffer[STATSD_CONF_LINE_MAX] = '\0'; + line++; + + s = trim(buffer); + if (!s || *s == '#') { + debug(D_STATSD, "STATSD: ignoring line %zu of file '%s', it is empty.", line, filename); + continue; + } + + debug(D_STATSD, "STATSD: processing line %zu of file '%s': %s", line, filename, buffer); + + if(*s == 'i' && strncmp(s, "include", 7) == 0) { + s = trim(&s[7]); + if(s && *s) { + char *tmp; + if(*s == '/') + tmp = strdupz(s); + else { + // the file to be included is relative to current file + // find the directory name from the file we already read + char *filename2 = strdupz(filename); // copy filename, since dirname() will change it + char *dir = dirname(filename2); // find the directory part of the filename + tmp = strdupz_path_subpath(dir, s); // compose the new filename to read; + freez(filename2); // free the filename we copied + } + statsd_readfile(tmp, app, chart, dict); + freez(tmp); + } + else + error("STATSD: ignoring line %zu of file '%s', include filename is empty", line, filename); + + continue; + } + + int len = (int) strlen(s); + if (*s == '[' && s[len - 1] == ']') { + // new section + s[len - 1] = '\0'; + s++; + + if (!strcmp(s, "app")) { + // a new app + app = callocz(sizeof(STATSD_APP), 1); + app->name = strdupz("unnamed"); + app->rrd_memory_mode = localhost->rrd_memory_mode; + app->rrd_history_entries = localhost->rrd_history_entries; + + app->next = statsd.apps; + statsd.apps = app; + chart = NULL; + dict = NULL; + + { + char lineandfile[FILENAME_MAX + 1]; + snprintfz(lineandfile, FILENAME_MAX, "%zu@%s", line, filename); + app->source = strdupz(lineandfile); + } + } + else if(app) { + if(!strcmp(s, "dictionary")) { + if(!app->dict) + app->dict = dictionary_create(DICTIONARY_FLAG_SINGLE_THREADED); + + dict = app->dict; + } + else { + dict = NULL; + + // a new chart + chart = callocz(sizeof(STATSD_APP_CHART), 1); + netdata_fix_chart_id(s); + chart->id = strdupz(s); + chart->name = strdupz(s); + chart->title = strdupz("Statsd chart"); + chart->context = strdupz(s); + chart->family = strdupz("overview"); + chart->units = strdupz("value"); + chart->priority = NETDATA_CHART_PRIO_STATSD_PRIVATE; + chart->chart_type = RRDSET_TYPE_LINE; + + chart->next = app->charts; + app->charts = chart; + + { + char lineandfile[FILENAME_MAX + 1]; + snprintfz(lineandfile, FILENAME_MAX, "%zu@%s", line, filename); + chart->source = strdupz(lineandfile); + } + } + } + else + error("STATSD: ignoring line %zu ('%s') of file '%s', [app] is not defined.", line, s, filename); + + continue; + } + + if(!app) { + error("STATSD: ignoring line %zu ('%s') of file '%s', it is outside all sections.", line, s, filename); + continue; + } + + char *name = s; + char *value = strchr(s, '='); + if(!value) { + error("STATSD: ignoring line %zu ('%s') of file '%s', there is no = in it.", line, s, filename); + continue; + } + *value = '\0'; + value++; + + name = trim(name); + value = trim(value); + + if(!name || *name == '#') { + error("STATSD: ignoring line %zu of file '%s', name is empty.", line, filename); + continue; + } + if(!value) { + debug(D_CONFIG, "STATSD: ignoring line %zu of file '%s', value is empty.", line, filename); + continue; + } + + if(unlikely(dict)) { + // parse [dictionary] members + + dictionary_set(dict, name, value, strlen(value) + 1); + } + else if(!chart) { + // parse [app] members + + if(!strcmp(name, "name")) { + freez((void *)app->name); + netdata_fix_chart_name(value); + app->name = strdupz(value); + } + else if (!strcmp(name, "metrics")) { + simple_pattern_free(app->metrics); + app->metrics = simple_pattern_create(value, NULL, SIMPLE_PATTERN_EXACT); + } + else if (!strcmp(name, "private charts")) { + if (!strcmp(value, "yes") || !strcmp(value, "on")) + app->default_options |= STATSD_METRIC_OPTION_PRIVATE_CHART_ENABLED; + else + app->default_options &= ~STATSD_METRIC_OPTION_PRIVATE_CHART_ENABLED; + } + else if (!strcmp(name, "gaps when not collected")) { + if (!strcmp(value, "yes") || !strcmp(value, "on")) + app->default_options |= STATSD_METRIC_OPTION_SHOW_GAPS_WHEN_NOT_COLLECTED; + } + else if (!strcmp(name, "memory mode")) { + app->rrd_memory_mode = rrd_memory_mode_id(value); + } + else if (!strcmp(name, "history")) { + app->rrd_history_entries = atol(value); + if (app->rrd_history_entries < 5) + app->rrd_history_entries = 5; + } + else { + error("STATSD: ignoring line %zu ('%s') of file '%s'. Unknown keyword for the [app] section.", line, name, filename); + continue; + } + } + else { + // parse [chart] members + + if(!strcmp(name, "name")) { + freez((void *)chart->name); + netdata_fix_chart_id(value); + chart->name = strdupz(value); + } + else if(!strcmp(name, "title")) { + freez((void *)chart->title); + chart->title = strdupz(value); + } + else if (!strcmp(name, "family")) { + freez((void *)chart->family); + chart->family = strdupz(value); + } + else if (!strcmp(name, "context")) { + freez((void *)chart->context); + netdata_fix_chart_id(value); + chart->context = strdupz(value); + } + else if (!strcmp(name, "units")) { + freez((void *)chart->units); + chart->units = strdupz(value); + } + else if (!strcmp(name, "priority")) { + chart->priority = atol(value); + } + else if (!strcmp(name, "type")) { + chart->chart_type = rrdset_type_id(value); + } + else if (!strcmp(name, "dimension")) { + // metric [name [type [multiplier [divisor]]]] + char *words[10]; + pluginsd_split_words(value, words, 10); + + int pattern = 0; + size_t i = 0; + char *metric_name = words[i++]; + + if(strcmp(metric_name, "pattern") == 0) { + metric_name = words[i++]; + pattern = 1; + } + + char *dim_name = words[i++]; + char *type = words[i++]; + char *multipler = words[i++]; + char *divisor = words[i++]; + char *options = words[i++]; + + RRDDIM_FLAGS flags = RRDDIM_FLAG_NONE; + if(options && *options) { + if(strstr(options, "hidden") != NULL) flags |= RRDDIM_FLAG_HIDDEN; + if(strstr(options, "noreset") != NULL) flags |= RRDDIM_FLAG_DONT_DETECT_RESETS_OR_OVERFLOWS; + if(strstr(options, "nooverflow") != NULL) flags |= RRDDIM_FLAG_DONT_DETECT_RESETS_OR_OVERFLOWS; + } + + if(!pattern) { + if(app->dict) { + if(dim_name && *dim_name) { + char *n = dictionary_get(app->dict, dim_name); + if(n) dim_name = n; + } + else { + dim_name = dictionary_get(app->dict, metric_name); + } + } + + if(!dim_name || !*dim_name) + dim_name = metric_name; + } + + STATSD_APP_CHART_DIM *dim = add_dimension_to_app_chart( + app + , chart + , metric_name + , dim_name + , (multipler && *multipler)?str2l(multipler):1 + , (divisor && *divisor)?str2l(divisor):1 + , flags + , string2valuetype(type, line, filename) + ); + + if(pattern) + dim->metric_pattern = simple_pattern_create(dim->metric, NULL, SIMPLE_PATTERN_EXACT); + } + else { + error("STATSD: ignoring line %zu ('%s') of file '%s'. Unknown keyword for the [%s] section.", line, name, filename, chart->id); + continue; + } + } + } + + freez(buffer); + fclose(fp); + return 0; +} + +static int statsd_file_callback(const char *filename, void *data) { + (void)data; + return statsd_readfile(filename, NULL, NULL, NULL); +} + +static inline void statsd_readdir(const char *user_path, const char *stock_path, const char *subpath) { + recursive_config_double_dir_load(user_path, stock_path, subpath, statsd_file_callback, NULL, 0); +} + +// -------------------------------------------------------------------------------------------------------------------- +// send metrics to netdata - in private charts - called from the main thread + +// extract chart type and chart id from metric name +static inline void statsd_get_metric_type_and_id(STATSD_METRIC *m, char *type, char *id, const char *defid, size_t len) { + char *s; + + snprintfz(type, len, "%s_%s_%s", STATSD_CHART_PREFIX, defid, m->name); + for(s = type; *s ;s++) + if(unlikely(*s == '.')) break; + + if(*s == '.') { + *s++ = '\0'; + strncpyz(id, s, len); + } + else { + strncpyz(id, defid, len); + } + + netdata_fix_chart_id(type); + netdata_fix_chart_id(id); +} + +static inline RRDSET *statsd_private_rrdset_create( + STATSD_METRIC *m + , const char *type + , const char *id + , const char *name + , const char *family + , const char *context + , const char *title + , const char *units + , long priority + , int update_every + , RRDSET_TYPE chart_type +) { + RRD_MEMORY_MODE memory_mode = statsd.private_charts_memory_mode; + long history = statsd.private_charts_rrd_history_entries; + + if(unlikely(statsd.private_charts >= statsd.max_private_charts)) { + debug(D_STATSD, "STATSD: metric '%s' will be charted with memory mode = none, because the maximum number of charts has been reached.", m->name); + info("STATSD: metric '%s' will be charted with memory mode = none, because the maximum number of charts (%zu) has been reached. Increase the number of charts by editing netdata.conf, [statsd] section.", m->name, statsd.max_private_charts); + memory_mode = RRD_MEMORY_MODE_NONE; + history = 5; + } + + statsd.private_charts++; + RRDSET *st = rrdset_create_custom( + localhost // host + , type // type + , id // id + , name // name + , family // family + , context // context + , title // title + , units // units + , PLUGIN_STATSD_NAME // plugin + , "private_chart" // module + , priority // priority + , update_every // update every + , chart_type // chart type + , memory_mode // memory mode + , history // history + ); + rrdset_flag_set(st, RRDSET_FLAG_STORE_FIRST); + + if(statsd.private_charts_hidden) + rrdset_flag_set(st, RRDSET_FLAG_HIDDEN); + + // rrdset_flag_set(st, RRDSET_FLAG_DEBUG); + return st; +} + +static inline void statsd_private_chart_gauge(STATSD_METRIC *m) { + debug(D_STATSD, "updating private chart for gauge metric '%s'", m->name); + + if(unlikely(!m->st)) { + char type[RRD_ID_LENGTH_MAX + 1], id[RRD_ID_LENGTH_MAX + 1]; + statsd_get_metric_type_and_id(m, type, id, "gauge", RRD_ID_LENGTH_MAX); + + char context[RRD_ID_LENGTH_MAX + 1]; + snprintfz(context, RRD_ID_LENGTH_MAX, "statsd_gauge.%s", m->name); + + char title[RRD_ID_LENGTH_MAX + 1]; + snprintfz(title, RRD_ID_LENGTH_MAX, "statsd private chart for gauge %s", m->name); + + m->st = statsd_private_rrdset_create( + m + , type + , id + , NULL // name + , "gauges" // family (submenu) + , context // context + , title // title + , "value" // units + , NETDATA_CHART_PRIO_STATSD_PRIVATE + , statsd.update_every + , RRDSET_TYPE_LINE + ); + + m->rd_value = rrddim_add(m->st, "gauge", NULL, 1, statsd.decimal_detail, RRD_ALGORITHM_ABSOLUTE); + + if(m->options & STATSD_METRIC_OPTION_CHART_DIMENSION_COUNT) + m->rd_count = rrddim_add(m->st, "events", NULL, 1, 1, RRD_ALGORITHM_INCREMENTAL); + } + else rrdset_next(m->st); + + rrddim_set_by_pointer(m->st, m->rd_value, m->last); + + if(m->rd_count) + rrddim_set_by_pointer(m->st, m->rd_count, m->events); + + rrdset_done(m->st); +} + +static inline void statsd_private_chart_counter_or_meter(STATSD_METRIC *m, const char *dim, const char *family) { + debug(D_STATSD, "updating private chart for %s metric '%s'", dim, m->name); + + if(unlikely(!m->st)) { + char type[RRD_ID_LENGTH_MAX + 1], id[RRD_ID_LENGTH_MAX + 1]; + statsd_get_metric_type_and_id(m, type, id, dim, RRD_ID_LENGTH_MAX); + + char context[RRD_ID_LENGTH_MAX + 1]; + snprintfz(context, RRD_ID_LENGTH_MAX, "statsd_%s.%s", dim, m->name); + + char title[RRD_ID_LENGTH_MAX + 1]; + snprintfz(title, RRD_ID_LENGTH_MAX, "statsd private chart for %s %s", dim, m->name); + + m->st = statsd_private_rrdset_create( + m + , type + , id + , NULL // name + , family // family (submenu) + , context // context + , title // title + , "events/s" // units + , NETDATA_CHART_PRIO_STATSD_PRIVATE + , statsd.update_every + , RRDSET_TYPE_AREA + ); + + m->rd_value = rrddim_add(m->st, dim, NULL, 1, 1, RRD_ALGORITHM_INCREMENTAL); + + if(m->options & STATSD_METRIC_OPTION_CHART_DIMENSION_COUNT) + m->rd_count = rrddim_add(m->st, "events", NULL, 1, 1, RRD_ALGORITHM_INCREMENTAL); + } + else rrdset_next(m->st); + + rrddim_set_by_pointer(m->st, m->rd_value, m->last); + + if(m->rd_count) + rrddim_set_by_pointer(m->st, m->rd_count, m->events); + + rrdset_done(m->st); +} + +static inline void statsd_private_chart_set(STATSD_METRIC *m) { + debug(D_STATSD, "updating private chart for set metric '%s'", m->name); + + if(unlikely(!m->st)) { + char type[RRD_ID_LENGTH_MAX + 1], id[RRD_ID_LENGTH_MAX + 1]; + statsd_get_metric_type_and_id(m, type, id, "set", RRD_ID_LENGTH_MAX); + + char context[RRD_ID_LENGTH_MAX + 1]; + snprintfz(context, RRD_ID_LENGTH_MAX, "statsd_set.%s", m->name); + + char title[RRD_ID_LENGTH_MAX + 1]; + snprintfz(title, RRD_ID_LENGTH_MAX, "statsd private chart for set %s", m->name); + + m->st = statsd_private_rrdset_create( + m + , type + , id + , NULL // name + , "sets" // family (submenu) + , context // context + , title // title + , "entries" // units + , NETDATA_CHART_PRIO_STATSD_PRIVATE + , statsd.update_every + , RRDSET_TYPE_LINE + ); + + m->rd_value = rrddim_add(m->st, "set", "set size", 1, 1, RRD_ALGORITHM_ABSOLUTE); + + if(m->options & STATSD_METRIC_OPTION_CHART_DIMENSION_COUNT) + m->rd_count = rrddim_add(m->st, "events", NULL, 1, 1, RRD_ALGORITHM_INCREMENTAL); + } + else rrdset_next(m->st); + + rrddim_set_by_pointer(m->st, m->rd_value, m->last); + + if(m->rd_count) + rrddim_set_by_pointer(m->st, m->rd_count, m->events); + + rrdset_done(m->st); +} + +static inline void statsd_private_chart_timer_or_histogram(STATSD_METRIC *m, const char *dim, const char *family, const char *units) { + debug(D_STATSD, "updating private chart for %s metric '%s'", dim, m->name); + + if(unlikely(!m->st)) { + char type[RRD_ID_LENGTH_MAX + 1], id[RRD_ID_LENGTH_MAX + 1]; + statsd_get_metric_type_and_id(m, type, id, dim, RRD_ID_LENGTH_MAX); + + char context[RRD_ID_LENGTH_MAX + 1]; + snprintfz(context, RRD_ID_LENGTH_MAX, "statsd_%s.%s", dim, m->name); + + char title[RRD_ID_LENGTH_MAX + 1]; + snprintfz(title, RRD_ID_LENGTH_MAX, "statsd private chart for %s %s", dim, m->name); + + m->st = statsd_private_rrdset_create( + m + , type + , id + , NULL // name + , family // family (submenu) + , context // context + , title // title + , units // units + , NETDATA_CHART_PRIO_STATSD_PRIVATE + , statsd.update_every + , RRDSET_TYPE_AREA + ); + + m->histogram.ext->rd_min = rrddim_add(m->st, "min", NULL, 1, statsd.decimal_detail, RRD_ALGORITHM_ABSOLUTE); + m->histogram.ext->rd_max = rrddim_add(m->st, "max", NULL, 1, statsd.decimal_detail, RRD_ALGORITHM_ABSOLUTE); + m->rd_value = rrddim_add(m->st, "average", NULL, 1, statsd.decimal_detail, RRD_ALGORITHM_ABSOLUTE); + m->histogram.ext->rd_percentile = rrddim_add(m->st, statsd.histogram_percentile_str, NULL, 1, statsd.decimal_detail, RRD_ALGORITHM_ABSOLUTE); + m->histogram.ext->rd_median = rrddim_add(m->st, "median", NULL, 1, statsd.decimal_detail, RRD_ALGORITHM_ABSOLUTE); + m->histogram.ext->rd_stddev = rrddim_add(m->st, "stddev", NULL, 1, statsd.decimal_detail, RRD_ALGORITHM_ABSOLUTE); + m->histogram.ext->rd_sum = rrddim_add(m->st, "sum", NULL, 1, statsd.decimal_detail, RRD_ALGORITHM_ABSOLUTE); + + if(m->options & STATSD_METRIC_OPTION_CHART_DIMENSION_COUNT) + m->rd_count = rrddim_add(m->st, "events", NULL, 1, 1, RRD_ALGORITHM_INCREMENTAL); + } + else rrdset_next(m->st); + + rrddim_set_by_pointer(m->st, m->histogram.ext->rd_min, m->histogram.ext->last_min); + rrddim_set_by_pointer(m->st, m->histogram.ext->rd_max, m->histogram.ext->last_max); + rrddim_set_by_pointer(m->st, m->histogram.ext->rd_percentile, m->histogram.ext->last_percentile); + rrddim_set_by_pointer(m->st, m->histogram.ext->rd_median, m->histogram.ext->last_median); + rrddim_set_by_pointer(m->st, m->histogram.ext->rd_stddev, m->histogram.ext->last_stddev); + rrddim_set_by_pointer(m->st, m->histogram.ext->rd_sum, m->histogram.ext->last_sum); + rrddim_set_by_pointer(m->st, m->rd_value, m->last); + + if(m->rd_count) + rrddim_set_by_pointer(m->st, m->rd_count, m->events); + + rrdset_done(m->st); +} + +// -------------------------------------------------------------------------------------------------------------------- +// statsd flush metrics + +static inline void statsd_flush_gauge(STATSD_METRIC *m) { + debug(D_STATSD, "flushing gauge metric '%s'", m->name); + + int updated = 0; + if(unlikely(!m->reset && m->count)) { + m->last = (collected_number) (m->gauge.value * statsd.decimal_detail); + + m->reset = 1; + updated = 1; + } + + if(unlikely(m->options & STATSD_METRIC_OPTION_PRIVATE_CHART_ENABLED && (updated || !(m->options & STATSD_METRIC_OPTION_SHOW_GAPS_WHEN_NOT_COLLECTED)))) + statsd_private_chart_gauge(m); +} + +static inline void statsd_flush_counter_or_meter(STATSD_METRIC *m, const char *dim, const char *family) { + debug(D_STATSD, "flushing %s metric '%s'", dim, m->name); + + int updated = 0; + if(unlikely(!m->reset && m->count)) { + m->last = m->counter.value; + + m->reset = 1; + updated = 1; + } + + if(unlikely(m->options & STATSD_METRIC_OPTION_PRIVATE_CHART_ENABLED && (updated || !(m->options & STATSD_METRIC_OPTION_SHOW_GAPS_WHEN_NOT_COLLECTED)))) + statsd_private_chart_counter_or_meter(m, dim, family); +} + +static inline void statsd_flush_counter(STATSD_METRIC *m) { + statsd_flush_counter_or_meter(m, "counter", "counters"); +} + +static inline void statsd_flush_meter(STATSD_METRIC *m) { + statsd_flush_counter_or_meter(m, "meter", "meters"); +} + +static inline void statsd_flush_set(STATSD_METRIC *m) { + debug(D_STATSD, "flushing set metric '%s'", m->name); + + int updated = 0; + if(unlikely(!m->reset && m->count)) { + m->last = (collected_number)m->set.unique; + + m->reset = 1; + updated = 1; + } + else { + m->last = 0; + } + + if(unlikely(m->options & STATSD_METRIC_OPTION_PRIVATE_CHART_ENABLED && (updated || !(m->options & STATSD_METRIC_OPTION_SHOW_GAPS_WHEN_NOT_COLLECTED)))) + statsd_private_chart_set(m); +} + +static inline void statsd_flush_timer_or_histogram(STATSD_METRIC *m, const char *dim, const char *family, const char *units) { + debug(D_STATSD, "flushing %s metric '%s'", dim, m->name); + + int updated = 0; + if(unlikely(!m->reset && m->count && m->histogram.ext->used > 0)) { + netdata_mutex_lock(&m->histogram.ext->mutex); + + size_t len = m->histogram.ext->used; + LONG_DOUBLE *series = m->histogram.ext->values; + sort_series(series, len); + + m->histogram.ext->last_min = (collected_number)roundl(series[0] * statsd.decimal_detail); + m->histogram.ext->last_max = (collected_number)roundl(series[len - 1] * statsd.decimal_detail); + m->last = (collected_number)roundl(average(series, len) * statsd.decimal_detail); + m->histogram.ext->last_median = (collected_number)roundl(median_on_sorted_series(series, len) * statsd.decimal_detail); + m->histogram.ext->last_stddev = (collected_number)roundl(standard_deviation(series, len) * statsd.decimal_detail); + m->histogram.ext->last_sum = (collected_number)roundl(sum(series, len) * statsd.decimal_detail); + + size_t pct_len = (size_t)floor((double)len * statsd.histogram_percentile / 100.0); + if(pct_len < 1) + m->histogram.ext->last_percentile = (collected_number)(series[0] * statsd.decimal_detail); + else + m->histogram.ext->last_percentile = (collected_number)roundl(series[pct_len - 1] * statsd.decimal_detail); + + netdata_mutex_unlock(&m->histogram.ext->mutex); + + debug(D_STATSD, "STATSD %s metric %s: min " COLLECTED_NUMBER_FORMAT ", max " COLLECTED_NUMBER_FORMAT ", last " COLLECTED_NUMBER_FORMAT ", pcent " COLLECTED_NUMBER_FORMAT ", median " COLLECTED_NUMBER_FORMAT ", stddev " COLLECTED_NUMBER_FORMAT ", sum " COLLECTED_NUMBER_FORMAT, + dim, m->name, m->histogram.ext->last_min, m->histogram.ext->last_max, m->last, m->histogram.ext->last_percentile, m->histogram.ext->last_median, m->histogram.ext->last_stddev, m->histogram.ext->last_sum); + + m->histogram.ext->zeroed = 0; + m->reset = 1; + updated = 1; + } + else if(unlikely(!m->histogram.ext->zeroed)) { + // reset the metrics + // if we collected anything, they will be updated below + // this ensures that we report zeros if nothing is collected + + m->histogram.ext->last_min = 0; + m->histogram.ext->last_max = 0; + m->last = 0; + m->histogram.ext->last_median = 0; + m->histogram.ext->last_stddev = 0; + m->histogram.ext->last_sum = 0; + m->histogram.ext->last_percentile = 0; + + m->histogram.ext->zeroed = 1; + } + + if(unlikely(m->options & STATSD_METRIC_OPTION_PRIVATE_CHART_ENABLED && (updated || !(m->options & STATSD_METRIC_OPTION_SHOW_GAPS_WHEN_NOT_COLLECTED)))) + statsd_private_chart_timer_or_histogram(m, dim, family, units); +} + +static inline void statsd_flush_timer(STATSD_METRIC *m) { + statsd_flush_timer_or_histogram(m, "timer", "timers", "milliseconds"); +} + +static inline void statsd_flush_histogram(STATSD_METRIC *m) { + statsd_flush_timer_or_histogram(m, "histogram", "histograms", "value"); +} + +static inline RRD_ALGORITHM statsd_algorithm_for_metric(STATSD_METRIC *m) { + switch(m->type) { + default: + case STATSD_METRIC_TYPE_GAUGE: + case STATSD_METRIC_TYPE_SET: + case STATSD_METRIC_TYPE_TIMER: + case STATSD_METRIC_TYPE_HISTOGRAM: + return RRD_ALGORITHM_ABSOLUTE; + + case STATSD_METRIC_TYPE_METER: + case STATSD_METRIC_TYPE_COUNTER: + return RRD_ALGORITHM_INCREMENTAL; + } +} + +static inline void link_metric_to_app_dimension(STATSD_APP *app, STATSD_METRIC *m, STATSD_APP_CHART *chart, STATSD_APP_CHART_DIM *dim) { + if(dim->value_type == STATSD_APP_CHART_DIM_VALUE_TYPE_EVENTS) { + dim->value_ptr = &m->events; + dim->algorithm = RRD_ALGORITHM_INCREMENTAL; + } + else if(m->type == STATSD_METRIC_TYPE_HISTOGRAM || m->type == STATSD_METRIC_TYPE_TIMER) { + dim->algorithm = RRD_ALGORITHM_ABSOLUTE; + dim->divisor *= statsd.decimal_detail; + + switch(dim->value_type) { + case STATSD_APP_CHART_DIM_VALUE_TYPE_EVENTS: + // will never match - added to avoid warning + break; + + case STATSD_APP_CHART_DIM_VALUE_TYPE_LAST: + case STATSD_APP_CHART_DIM_VALUE_TYPE_AVERAGE: + dim->value_ptr = &m->last; + break; + + case STATSD_APP_CHART_DIM_VALUE_TYPE_SUM: + dim->value_ptr = &m->histogram.ext->last_sum; + break; + + case STATSD_APP_CHART_DIM_VALUE_TYPE_MIN: + dim->value_ptr = &m->histogram.ext->last_min; + break; + + case STATSD_APP_CHART_DIM_VALUE_TYPE_MAX: + dim->value_ptr = &m->histogram.ext->last_max; + break; + + case STATSD_APP_CHART_DIM_VALUE_TYPE_MEDIAN: + dim->value_ptr = &m->histogram.ext->last_median; + break; + + case STATSD_APP_CHART_DIM_VALUE_TYPE_PERCENTILE: + dim->value_ptr = &m->histogram.ext->last_percentile; + break; + + case STATSD_APP_CHART_DIM_VALUE_TYPE_STDDEV: + dim->value_ptr = &m->histogram.ext->last_stddev; + break; + } + } + else { + if (dim->value_type != STATSD_APP_CHART_DIM_VALUE_TYPE_LAST) + error("STATSD: unsupported value type for dimension '%s' of chart '%s' of app '%s' on metric '%s'", dim->name, chart->id, app->name, m->name); + + dim->value_ptr = &m->last; + dim->algorithm = statsd_algorithm_for_metric(m); + + if(m->type == STATSD_METRIC_TYPE_GAUGE) + dim->divisor *= statsd.decimal_detail; + } + + if(unlikely(chart->st && dim->rd)) { + rrddim_set_algorithm(chart->st, dim->rd, dim->algorithm); + rrddim_set_multiplier(chart->st, dim->rd, dim->multiplier); + rrddim_set_divisor(chart->st, dim->rd, dim->divisor); + } + + chart->dimensions_linked_count++; + m->options |= STATSD_METRIC_OPTION_USED_IN_APPS; + debug(D_STATSD, "metric '%s' of type %u linked with app '%s', chart '%s', dimension '%s', algorithm '%s'", m->name, m->type, app->name, chart->id, dim->name, rrd_algorithm_name(dim->algorithm)); +} + +static inline void check_if_metric_is_for_app(STATSD_INDEX *index, STATSD_METRIC *m) { + (void)index; + + STATSD_APP *app; + for(app = statsd.apps; app ;app = app->next) { + if(unlikely(simple_pattern_matches(app->metrics, m->name))) { + debug(D_STATSD, "metric '%s' matches app '%s'", m->name, app->name); + + // the metric should get the options from the app + + if(app->default_options & STATSD_METRIC_OPTION_PRIVATE_CHART_ENABLED) + m->options |= STATSD_METRIC_OPTION_PRIVATE_CHART_ENABLED; + else + m->options &= ~STATSD_METRIC_OPTION_PRIVATE_CHART_ENABLED; + + if(app->default_options & STATSD_METRIC_OPTION_SHOW_GAPS_WHEN_NOT_COLLECTED) + m->options |= STATSD_METRIC_OPTION_SHOW_GAPS_WHEN_NOT_COLLECTED; + else + m->options &= ~STATSD_METRIC_OPTION_SHOW_GAPS_WHEN_NOT_COLLECTED; + + m->options |= STATSD_METRIC_OPTION_PRIVATE_CHART_CHECKED; + + // check if there is a chart in this app, willing to get this metric + STATSD_APP_CHART *chart; + for(chart = app->charts; chart; chart = chart->next) { + + STATSD_APP_CHART_DIM *dim; + for(dim = chart->dimensions; dim ; dim = dim->next) { + if(unlikely(dim->metric_pattern)) { + size_t dim_name_len = strlen(dim->name); + size_t wildcarded_len = dim_name_len + strlen(m->name) + 1; + char wildcarded[wildcarded_len]; + + strcpy(wildcarded, dim->name); + char *ws = &wildcarded[dim_name_len]; + + if(simple_pattern_matches_extract(dim->metric_pattern, m->name, ws, wildcarded_len - dim_name_len)) { + + char *final_name = NULL; + + if(app->dict) { + if(likely(*wildcarded)) { + // use the name of the wildcarded string + final_name = dictionary_get(app->dict, wildcarded); + } + + if(unlikely(!final_name)) { + // use the name of the metric + final_name = dictionary_get(app->dict, m->name); + } + } + + if(unlikely(!final_name)) + final_name = wildcarded; + + add_dimension_to_app_chart( + app + , chart + , m->name + , final_name + , dim->multiplier + , dim->divisor + , dim->flags + , dim->value_type + ); + + // the new dimension is appended to the list + // so, it will be matched and linked later too + } + } + else if(!dim->value_ptr && dim->metric_hash == m->hash && !strcmp(dim->metric, m->name)) { + // we have a match - this metric should be linked to this dimension + link_metric_to_app_dimension(app, m, chart, dim); + } + } + + } + } + } +} + +static inline RRDDIM *statsd_add_dim_to_app_chart(STATSD_APP *app, STATSD_APP_CHART *chart, STATSD_APP_CHART_DIM *dim) { + (void)app; + + // allow the same statsd metric to be added multiple times to the same chart + + STATSD_APP_CHART_DIM *tdim; + size_t count_same_metric = 0, count_same_metric_value_type = 0; + size_t pos_same_metric_value_type = 0; + + for (tdim = chart->dimensions; tdim && tdim->next; tdim = tdim->next) { + if (dim->metric_hash == tdim->metric_hash && !strcmp(dim->metric, tdim->metric)) { + count_same_metric++; + + if(dim->value_type == tdim->value_type) { + count_same_metric_value_type++; + if (tdim == dim) + pos_same_metric_value_type = count_same_metric_value_type; + } + } + } + + if(count_same_metric > 1) { + // the same metric is found multiple times + + size_t len = strlen(dim->metric) + 100; + char metric[ len + 1 ]; + + if(count_same_metric_value_type > 1) { + // the same metric, with the same value type, is added multiple times + snprintfz(metric, len, "%s_%s%zu", dim->metric, valuetype2string(dim->value_type), pos_same_metric_value_type); + } + else { + // the same metric, with different value type is added + snprintfz(metric, len, "%s_%s", dim->metric, valuetype2string(dim->value_type)); + } + + dim->rd = rrddim_add(chart->st, metric, dim->name, dim->multiplier, dim->divisor, dim->algorithm); + if(dim->flags != RRDDIM_FLAG_NONE) dim->rd->flags |= dim->flags; + return dim->rd; + } + + dim->rd = rrddim_add(chart->st, dim->metric, dim->name, dim->multiplier, dim->divisor, dim->algorithm); + if(dim->flags != RRDDIM_FLAG_NONE) dim->rd->flags |= dim->flags; + return dim->rd; +} + +static inline void statsd_update_app_chart(STATSD_APP *app, STATSD_APP_CHART *chart) { + debug(D_STATSD, "updating chart '%s' for app '%s'", chart->id, app->name); + + if(!chart->st) { + chart->st = rrdset_create_custom( + localhost // host + , app->name // type + , chart->id // id + , chart->name // name + , chart->family // family + , chart->context // context + , chart->title // title + , chart->units // units + , PLUGIN_STATSD_NAME // plugin + , chart->source // module + , chart->priority // priority + , statsd.update_every // update every + , chart->chart_type // chart type + , app->rrd_memory_mode // memory mode + , app->rrd_history_entries // history + ); + + rrdset_flag_set(chart->st, RRDSET_FLAG_STORE_FIRST); + // rrdset_flag_set(chart->st, RRDSET_FLAG_DEBUG); + } + else rrdset_next(chart->st); + + STATSD_APP_CHART_DIM *dim; + for(dim = chart->dimensions; dim ;dim = dim->next) { + if(likely(!dim->metric_pattern)) { + if (unlikely(!dim->rd)) + statsd_add_dim_to_app_chart(app, chart, dim); + + if (unlikely(dim->value_ptr)) { + debug(D_STATSD, "updating dimension '%s' (%s) of chart '%s' (%s) for app '%s' with value " COLLECTED_NUMBER_FORMAT, dim->name, dim->rd->id, chart->id, chart->st->id, app->name, *dim->value_ptr); + rrddim_set_by_pointer(chart->st, dim->rd, *dim->value_ptr); + } + } + } + + rrdset_done(chart->st); + debug(D_STATSD, "completed update of chart '%s' for app '%s'", chart->id, app->name); +} + +static inline void statsd_update_all_app_charts(void) { + // debug(D_STATSD, "updating app charts"); + + STATSD_APP *app; + for(app = statsd.apps; app ;app = app->next) { + // debug(D_STATSD, "updating charts for app '%s'", app->name); + + STATSD_APP_CHART *chart; + for(chart = app->charts; chart ;chart = chart->next) { + if(unlikely(chart->dimensions_linked_count)) { + statsd_update_app_chart(app, chart); + } + } + } + + // debug(D_STATSD, "completed update of app charts"); +} + +const char *statsd_metric_type_string(STATSD_METRIC_TYPE type) { + switch(type) { + case STATSD_METRIC_TYPE_COUNTER: return "counter"; + case STATSD_METRIC_TYPE_GAUGE: return "gauge"; + case STATSD_METRIC_TYPE_HISTOGRAM: return "histogram"; + case STATSD_METRIC_TYPE_METER: return "meter"; + case STATSD_METRIC_TYPE_SET: return "set"; + case STATSD_METRIC_TYPE_TIMER: return "timer"; + default: return "unknown"; + } +} + +static inline void statsd_flush_index_metrics(STATSD_INDEX *index, void (*flush_metric)(STATSD_METRIC *)) { + STATSD_METRIC *m; + + // find the useful metrics (incremental = each time we are called, we check the new metrics only) + for(m = index->first; m ; m = m->next) { + // since we add new metrics at the beginning + // check for useful charts, until the point we last checked + if(unlikely(is_metric_checked(m))) break; + + if(unlikely(!(m->options & STATSD_METRIC_OPTION_CHECKED_IN_APPS))) { + log_access("NEW STATSD METRIC '%s': '%s'", statsd_metric_type_string(m->type), m->name); + check_if_metric_is_for_app(index, m); + m->options |= STATSD_METRIC_OPTION_CHECKED_IN_APPS; + } + + if(unlikely(!(m->options & STATSD_METRIC_OPTION_PRIVATE_CHART_CHECKED))) { + if(unlikely(statsd.private_charts >= statsd.max_private_charts_hard)) { + debug(D_STATSD, "STATSD: metric '%s' will not be charted, because the hard limit of the maximum number of charts has been reached.", m->name); + info("STATSD: metric '%s' will not be charted, because the hard limit of the maximum number of charts (%zu) has been reached. Increase the number of charts by editing netdata.conf, [statsd] section.", m->name, statsd.max_private_charts); + m->options &= ~STATSD_METRIC_OPTION_PRIVATE_CHART_ENABLED; + } + else { + if (simple_pattern_matches(statsd.charts_for, m->name)) { + debug(D_STATSD, "STATSD: metric '%s' will be charted.", m->name); + m->options |= STATSD_METRIC_OPTION_PRIVATE_CHART_ENABLED; + } else { + debug(D_STATSD, "STATSD: metric '%s' will not be charted.", m->name); + m->options &= ~STATSD_METRIC_OPTION_PRIVATE_CHART_ENABLED; + } + } + + m->options |= STATSD_METRIC_OPTION_PRIVATE_CHART_CHECKED; + } + + // mark it as checked + m->options |= STATSD_METRIC_OPTION_CHECKED; + + // check if it is used in charts + if((m->options & (STATSD_METRIC_OPTION_PRIVATE_CHART_ENABLED|STATSD_METRIC_OPTION_USED_IN_APPS)) && !(m->options & STATSD_METRIC_OPTION_USEFUL)) { + m->options |= STATSD_METRIC_OPTION_USEFUL; + index->useful++; + m->next_useful = index->first_useful; + index->first_useful = m; + } + } + + // flush all the useful metrics + for(m = index->first_useful; m ; m = m->next_useful) { + flush_metric(m); + } +} + + +// -------------------------------------------------------------------------------------- +// statsd main thread + +static int statsd_listen_sockets_setup(void) { + return listen_sockets_setup(&statsd.sockets); +} + +static void statsd_main_cleanup(void *data) { + struct netdata_static_thread *static_thread = (struct netdata_static_thread *)data; + static_thread->enabled = NETDATA_MAIN_THREAD_EXITING; + info("cleaning up..."); + + if (statsd.collection_threads_status) { + int i; + for (i = 0; i < statsd.threads; i++) { + if(statsd.collection_threads_status[i].status) { + info("STATSD: stopping data collection thread %d...", i + 1); + netdata_thread_cancel(statsd.collection_threads_status[i].thread); + } + else { + info("STATSD: data collection thread %d found stopped.", i + 1); + } + } + } + + info("STATSD: closing sockets..."); + listen_sockets_close(&statsd.sockets); + + info("STATSD: cleanup completed."); + static_thread->enabled = NETDATA_MAIN_THREAD_EXITED; +} + +void *statsd_main(void *ptr) { + netdata_thread_cleanup_push(statsd_main_cleanup, ptr); + + // ---------------------------------------------------------------------------------------------------------------- + // statsd configuration + + statsd.enabled = config_get_boolean(CONFIG_SECTION_STATSD, "enabled", statsd.enabled); + + statsd.update_every = default_rrd_update_every; + statsd.update_every = (int)config_get_number(CONFIG_SECTION_STATSD, "update every (flushInterval)", statsd.update_every); + if(statsd.update_every < default_rrd_update_every) { + error("STATSD: minimum flush interval %d given, but the minimum is the update every of netdata. Using %d", statsd.update_every, default_rrd_update_every); + statsd.update_every = default_rrd_update_every; + } + +#ifdef HAVE_RECVMMSG + statsd.recvmmsg_size = (size_t)config_get_number(CONFIG_SECTION_STATSD, "udp messages to process at once", (long long)statsd.recvmmsg_size); +#endif + + statsd.charts_for = simple_pattern_create(config_get(CONFIG_SECTION_STATSD, "create private charts for metrics matching", "*"), NULL, SIMPLE_PATTERN_EXACT); + statsd.max_private_charts = (size_t)config_get_number(CONFIG_SECTION_STATSD, "max private charts allowed", (long long)statsd.max_private_charts); + statsd.max_private_charts_hard = (size_t)config_get_number(CONFIG_SECTION_STATSD, "max private charts hard limit", (long long)statsd.max_private_charts * 5); + statsd.private_charts_memory_mode = rrd_memory_mode_id(config_get(CONFIG_SECTION_STATSD, "private charts memory mode", rrd_memory_mode_name(default_rrd_memory_mode))); + statsd.private_charts_rrd_history_entries = (int)config_get_number(CONFIG_SECTION_STATSD, "private charts history", default_rrd_history_entries); + statsd.decimal_detail = (collected_number)config_get_number(CONFIG_SECTION_STATSD, "decimal detail", (long long int)statsd.decimal_detail); + statsd.tcp_idle_timeout = (size_t) config_get_number(CONFIG_SECTION_STATSD, "disconnect idle tcp clients after seconds", (long long int)statsd.tcp_idle_timeout); + statsd.private_charts_hidden = (unsigned int)config_get_boolean(CONFIG_SECTION_STATSD, "private charts hidden", statsd.private_charts_hidden); + + statsd.histogram_percentile = (double)config_get_float(CONFIG_SECTION_STATSD, "histograms and timers percentile (percentThreshold)", statsd.histogram_percentile); + if(isless(statsd.histogram_percentile, 0) || isgreater(statsd.histogram_percentile, 100)) { + error("STATSD: invalid histograms and timers percentile %0.5f given", statsd.histogram_percentile); + statsd.histogram_percentile = 95.0; + } + { + char buffer[100 + 1]; + snprintf(buffer, 100, "%0.1f%%", statsd.histogram_percentile); + statsd.histogram_percentile_str = strdupz(buffer); + } + + if(config_get_boolean(CONFIG_SECTION_STATSD, "add dimension for number of events received", 1)) { + statsd.gauges.default_options |= STATSD_METRIC_OPTION_CHART_DIMENSION_COUNT; + statsd.counters.default_options |= STATSD_METRIC_OPTION_CHART_DIMENSION_COUNT; + statsd.meters.default_options |= STATSD_METRIC_OPTION_CHART_DIMENSION_COUNT; + statsd.sets.default_options |= STATSD_METRIC_OPTION_CHART_DIMENSION_COUNT; + statsd.histograms.default_options |= STATSD_METRIC_OPTION_CHART_DIMENSION_COUNT; + statsd.timers.default_options |= STATSD_METRIC_OPTION_CHART_DIMENSION_COUNT; + } + + if(config_get_boolean(CONFIG_SECTION_STATSD, "gaps on gauges (deleteGauges)", 0)) + statsd.gauges.default_options |= STATSD_METRIC_OPTION_SHOW_GAPS_WHEN_NOT_COLLECTED; + + if(config_get_boolean(CONFIG_SECTION_STATSD, "gaps on counters (deleteCounters)", 0)) + statsd.counters.default_options |= STATSD_METRIC_OPTION_SHOW_GAPS_WHEN_NOT_COLLECTED; + + if(config_get_boolean(CONFIG_SECTION_STATSD, "gaps on meters (deleteMeters)", 0)) + statsd.meters.default_options |= STATSD_METRIC_OPTION_SHOW_GAPS_WHEN_NOT_COLLECTED; + + if(config_get_boolean(CONFIG_SECTION_STATSD, "gaps on sets (deleteSets)", 0)) + statsd.sets.default_options |= STATSD_METRIC_OPTION_SHOW_GAPS_WHEN_NOT_COLLECTED; + + if(config_get_boolean(CONFIG_SECTION_STATSD, "gaps on histograms (deleteHistograms)", 0)) + statsd.histograms.default_options |= STATSD_METRIC_OPTION_SHOW_GAPS_WHEN_NOT_COLLECTED; + + if(config_get_boolean(CONFIG_SECTION_STATSD, "gaps on timers (deleteTimers)", 0)) + statsd.timers.default_options |= STATSD_METRIC_OPTION_SHOW_GAPS_WHEN_NOT_COLLECTED; + + size_t max_sockets = (size_t)config_get_number(CONFIG_SECTION_STATSD, "statsd server max TCP sockets", (long long int)(rlimit_nofile.rlim_cur / 4)); + +#ifdef STATSD_MULTITHREADED + statsd.threads = (int)config_get_number(CONFIG_SECTION_STATSD, "threads", processors); + if(statsd.threads < 1) { + error("STATSD: Invalid number of threads %d, using %d", statsd.threads, processors); + statsd.threads = processors; + config_set_number(CONFIG_SECTION_STATSD, "collector threads", statsd.threads); + } +#else + statsd.threads = 1; +#endif + + // read custom application definitions + statsd_readdir(netdata_configured_user_config_dir, netdata_configured_stock_config_dir, "statsd.d"); + + // ---------------------------------------------------------------------------------------------------------------- + // statsd setup + + if(!statsd.enabled) return NULL; + + statsd_listen_sockets_setup(); + if(!statsd.sockets.opened) { + error("STATSD: No statsd sockets to listen to. statsd will be disabled."); + goto cleanup; + } + + statsd.collection_threads_status = callocz((size_t)statsd.threads, sizeof(struct collection_thread_status)); + + int i; + for(i = 0; i < statsd.threads ;i++) { + statsd.collection_threads_status[i].max_sockets = max_sockets / statsd.threads; + char tag[NETDATA_THREAD_TAG_MAX + 1]; + snprintfz(tag, NETDATA_THREAD_TAG_MAX, "STATSD_COLLECTOR[%d]", i + 1); + netdata_thread_create(&statsd.collection_threads_status[i].thread, tag, NETDATA_THREAD_OPTION_DEFAULT, statsd_collector_thread, &statsd.collection_threads_status[i]); + } + + // ---------------------------------------------------------------------------------------------------------------- + // statsd monitoring charts + + RRDSET *st_metrics = rrdset_create_localhost( + "netdata" + , "statsd_metrics" + , NULL + , "statsd" + , NULL + , "Metrics in the netdata statsd database" + , "metrics" + , PLUGIN_STATSD_NAME + , "stats" + , 132010 + , statsd.update_every + , RRDSET_TYPE_STACKED + ); + RRDDIM *rd_metrics_gauge = rrddim_add(st_metrics, "gauges", NULL, 1, 1, RRD_ALGORITHM_ABSOLUTE); + RRDDIM *rd_metrics_counter = rrddim_add(st_metrics, "counters", NULL, 1, 1, RRD_ALGORITHM_ABSOLUTE); + RRDDIM *rd_metrics_timer = rrddim_add(st_metrics, "timers", NULL, 1, 1, RRD_ALGORITHM_ABSOLUTE); + RRDDIM *rd_metrics_meter = rrddim_add(st_metrics, "meters", NULL, 1, 1, RRD_ALGORITHM_ABSOLUTE); + RRDDIM *rd_metrics_histogram = rrddim_add(st_metrics, "histograms", NULL, 1, 1, RRD_ALGORITHM_ABSOLUTE); + RRDDIM *rd_metrics_set = rrddim_add(st_metrics, "sets", NULL, 1, 1, RRD_ALGORITHM_ABSOLUTE); + + RRDSET *st_useful_metrics = rrdset_create_localhost( + "netdata" + , "statsd_useful_metrics" + , NULL + , "statsd" + , NULL + , "Useful metrics in the netdata statsd database" + , "metrics" + , PLUGIN_STATSD_NAME + , "stats" + , 132010 + , statsd.update_every + , RRDSET_TYPE_STACKED + ); + RRDDIM *rd_useful_metrics_gauge = rrddim_add(st_useful_metrics, "gauges", NULL, 1, 1, RRD_ALGORITHM_ABSOLUTE); + RRDDIM *rd_useful_metrics_counter = rrddim_add(st_useful_metrics, "counters", NULL, 1, 1, RRD_ALGORITHM_ABSOLUTE); + RRDDIM *rd_useful_metrics_timer = rrddim_add(st_useful_metrics, "timers", NULL, 1, 1, RRD_ALGORITHM_ABSOLUTE); + RRDDIM *rd_useful_metrics_meter = rrddim_add(st_useful_metrics, "meters", NULL, 1, 1, RRD_ALGORITHM_ABSOLUTE); + RRDDIM *rd_useful_metrics_histogram = rrddim_add(st_useful_metrics, "histograms", NULL, 1, 1, RRD_ALGORITHM_ABSOLUTE); + RRDDIM *rd_useful_metrics_set = rrddim_add(st_useful_metrics, "sets", NULL, 1, 1, RRD_ALGORITHM_ABSOLUTE); + + RRDSET *st_events = rrdset_create_localhost( + "netdata" + , "statsd_events" + , NULL + , "statsd" + , NULL + , "Events processed by the netdata statsd server" + , "events/s" + , PLUGIN_STATSD_NAME + , "stats" + , 132011 + , statsd.update_every + , RRDSET_TYPE_STACKED + ); + RRDDIM *rd_events_gauge = rrddim_add(st_events, "gauges", NULL, 1, 1, RRD_ALGORITHM_INCREMENTAL); + RRDDIM *rd_events_counter = rrddim_add(st_events, "counters", NULL, 1, 1, RRD_ALGORITHM_INCREMENTAL); + RRDDIM *rd_events_timer = rrddim_add(st_events, "timers", NULL, 1, 1, RRD_ALGORITHM_INCREMENTAL); + RRDDIM *rd_events_meter = rrddim_add(st_events, "meters", NULL, 1, 1, RRD_ALGORITHM_INCREMENTAL); + RRDDIM *rd_events_histogram = rrddim_add(st_events, "histograms", NULL, 1, 1, RRD_ALGORITHM_INCREMENTAL); + RRDDIM *rd_events_set = rrddim_add(st_events, "sets", NULL, 1, 1, RRD_ALGORITHM_INCREMENTAL); + RRDDIM *rd_events_unknown = rrddim_add(st_events, "unknown", NULL, 1, 1, RRD_ALGORITHM_INCREMENTAL); + RRDDIM *rd_events_errors = rrddim_add(st_events, "errors", NULL, 1, 1, RRD_ALGORITHM_INCREMENTAL); + + RRDSET *st_reads = rrdset_create_localhost( + "netdata" + , "statsd_reads" + , NULL + , "statsd" + , NULL + , "Read operations made by the netdata statsd server" + , "reads/s" + , PLUGIN_STATSD_NAME + , "stats" + , 132012 + , statsd.update_every + , RRDSET_TYPE_STACKED + ); + RRDDIM *rd_reads_tcp = rrddim_add(st_reads, "tcp", NULL, 1, 1, RRD_ALGORITHM_INCREMENTAL); + RRDDIM *rd_reads_udp = rrddim_add(st_reads, "udp", NULL, 1, 1, RRD_ALGORITHM_INCREMENTAL); + + RRDSET *st_bytes = rrdset_create_localhost( + "netdata" + , "statsd_bytes" + , NULL + , "statsd" + , NULL + , "Bytes read by the netdata statsd server" + , "kilobits/s" + , PLUGIN_STATSD_NAME + , "stats" + , 132013 + , statsd.update_every + , RRDSET_TYPE_STACKED + ); + RRDDIM *rd_bytes_tcp = rrddim_add(st_bytes, "tcp", NULL, 8, BITS_IN_A_KILOBIT, RRD_ALGORITHM_INCREMENTAL); + RRDDIM *rd_bytes_udp = rrddim_add(st_bytes, "udp", NULL, 8, BITS_IN_A_KILOBIT, RRD_ALGORITHM_INCREMENTAL); + + RRDSET *st_packets = rrdset_create_localhost( + "netdata" + , "statsd_packets" + , NULL + , "statsd" + , NULL + , "Network packets processed by the netdata statsd server" + , "packets/s" + , PLUGIN_STATSD_NAME + , "stats" + , 132014 + , statsd.update_every + , RRDSET_TYPE_STACKED + ); + RRDDIM *rd_packets_tcp = rrddim_add(st_packets, "tcp", NULL, 1, 1, RRD_ALGORITHM_INCREMENTAL); + RRDDIM *rd_packets_udp = rrddim_add(st_packets, "udp", NULL, 1, 1, RRD_ALGORITHM_INCREMENTAL); + + RRDSET *st_tcp_connects = rrdset_create_localhost( + "netdata" + , "tcp_connects" + , NULL + , "statsd" + , NULL + , "statsd server TCP connects and disconnects" + , "events" + , PLUGIN_STATSD_NAME + , "stats" + , 132015 + , statsd.update_every + , RRDSET_TYPE_LINE + ); + RRDDIM *rd_tcp_connects = rrddim_add(st_tcp_connects, "connects", NULL, 1, 1, RRD_ALGORITHM_INCREMENTAL); + RRDDIM *rd_tcp_disconnects = rrddim_add(st_tcp_connects, "disconnects", NULL, -1, 1, RRD_ALGORITHM_INCREMENTAL); + + RRDSET *st_tcp_connected = rrdset_create_localhost( + "netdata" + , "tcp_connected" + , NULL + , "statsd" + , NULL + , "statsd server TCP connected sockets" + , "connected" + , PLUGIN_STATSD_NAME + , "stats" + , 132016 + , statsd.update_every + , RRDSET_TYPE_LINE + ); + RRDDIM *rd_tcp_connected = rrddim_add(st_tcp_connected, "connected", NULL, 1, 1, RRD_ALGORITHM_ABSOLUTE); + + RRDSET *st_pcharts = rrdset_create_localhost( + "netdata" + , "private_charts" + , NULL + , "statsd" + , NULL + , "Private metric charts created by the netdata statsd server" + , "charts" + , PLUGIN_STATSD_NAME + , "stats" + , 132020 + , statsd.update_every + , RRDSET_TYPE_AREA + ); + RRDDIM *rd_pcharts = rrddim_add(st_pcharts, "charts", NULL, 1, 1, RRD_ALGORITHM_ABSOLUTE); + + RRDSET *stcpu_thread = rrdset_create_localhost( + "netdata" + , "plugin_statsd_charting_cpu" + , NULL + , "statsd" + , "netdata.statsd_cpu" + , "NetData statsd charting thread CPU usage" + , "milliseconds/s" + , PLUGIN_STATSD_NAME + , "stats" + , 132001 + , statsd.update_every + , RRDSET_TYPE_STACKED + ); + + RRDDIM *rd_user = rrddim_add(stcpu_thread, "user", NULL, 1, 1000, RRD_ALGORITHM_INCREMENTAL); + RRDDIM *rd_system = rrddim_add(stcpu_thread, "system", NULL, 1, 1000, RRD_ALGORITHM_INCREMENTAL); + struct rusage thread; + + for(i = 0; i < statsd.threads ;i++) { + char id[100 + 1]; + char title[100 + 1]; + + snprintfz(id, 100, "plugin_statsd_collector%d_cpu", i + 1); + snprintfz(title, 100, "NetData statsd collector thread No %d CPU usage", i + 1); + + statsd.collection_threads_status[i].st_cpu = rrdset_create_localhost( + "netdata" + , id + , NULL + , "statsd" + , "netdata.statsd_cpu" + , title + , "milliseconds/s" + , PLUGIN_STATSD_NAME + , "stats" + , 132002 + i + , statsd.update_every + , RRDSET_TYPE_STACKED + ); + + statsd.collection_threads_status[i].rd_user = rrddim_add(statsd.collection_threads_status[i].st_cpu, "user", NULL, 1, 1000, RRD_ALGORITHM_INCREMENTAL); + statsd.collection_threads_status[i].rd_system = rrddim_add(statsd.collection_threads_status[i].st_cpu, "system", NULL, 1, 1000, RRD_ALGORITHM_INCREMENTAL); + } + + // ---------------------------------------------------------------------------------------------------------------- + // statsd thread to turn metrics into charts + + usec_t step = statsd.update_every * USEC_PER_SEC; + heartbeat_t hb; + heartbeat_init(&hb); + while(!netdata_exit) { + usec_t hb_dt = heartbeat_next(&hb, step); + + statsd_flush_index_metrics(&statsd.gauges, statsd_flush_gauge); + statsd_flush_index_metrics(&statsd.counters, statsd_flush_counter); + statsd_flush_index_metrics(&statsd.meters, statsd_flush_meter); + statsd_flush_index_metrics(&statsd.timers, statsd_flush_timer); + statsd_flush_index_metrics(&statsd.histograms, statsd_flush_histogram); + statsd_flush_index_metrics(&statsd.sets, statsd_flush_set); + + statsd_update_all_app_charts(); + + getrusage(RUSAGE_THREAD, &thread); + + if(unlikely(netdata_exit)) + break; + + if(likely(hb_dt)) { + rrdset_next(st_metrics); + rrdset_next(st_useful_metrics); + rrdset_next(st_events); + rrdset_next(st_reads); + rrdset_next(st_bytes); + rrdset_next(st_packets); + rrdset_next(st_tcp_connects); + rrdset_next(st_tcp_connected); + rrdset_next(st_pcharts); + rrdset_next(stcpu_thread); + for(i = 0; i < statsd.threads ;i++) + rrdset_next(statsd.collection_threads_status[i].st_cpu); + } + + rrddim_set_by_pointer(st_metrics, rd_metrics_gauge, (collected_number)statsd.gauges.metrics); + rrddim_set_by_pointer(st_metrics, rd_metrics_counter, (collected_number)statsd.counters.metrics); + rrddim_set_by_pointer(st_metrics, rd_metrics_timer, (collected_number)statsd.timers.metrics); + rrddim_set_by_pointer(st_metrics, rd_metrics_meter, (collected_number)statsd.meters.metrics); + rrddim_set_by_pointer(st_metrics, rd_metrics_histogram, (collected_number)statsd.histograms.metrics); + rrddim_set_by_pointer(st_metrics, rd_metrics_set, (collected_number)statsd.sets.metrics); + rrdset_done(st_metrics); + + rrddim_set_by_pointer(st_useful_metrics, rd_useful_metrics_gauge, (collected_number)statsd.gauges.useful); + rrddim_set_by_pointer(st_useful_metrics, rd_useful_metrics_counter, (collected_number)statsd.counters.useful); + rrddim_set_by_pointer(st_useful_metrics, rd_useful_metrics_timer, (collected_number)statsd.timers.useful); + rrddim_set_by_pointer(st_useful_metrics, rd_useful_metrics_meter, (collected_number)statsd.meters.useful); + rrddim_set_by_pointer(st_useful_metrics, rd_useful_metrics_histogram, (collected_number)statsd.histograms.useful); + rrddim_set_by_pointer(st_useful_metrics, rd_useful_metrics_set, (collected_number)statsd.sets.useful); + rrdset_done(st_useful_metrics); + + rrddim_set_by_pointer(st_events, rd_events_gauge, (collected_number)statsd.gauges.events); + rrddim_set_by_pointer(st_events, rd_events_counter, (collected_number)statsd.counters.events); + rrddim_set_by_pointer(st_events, rd_events_timer, (collected_number)statsd.timers.events); + rrddim_set_by_pointer(st_events, rd_events_meter, (collected_number)statsd.meters.events); + rrddim_set_by_pointer(st_events, rd_events_histogram, (collected_number)statsd.histograms.events); + rrddim_set_by_pointer(st_events, rd_events_set, (collected_number)statsd.sets.events); + rrddim_set_by_pointer(st_events, rd_events_unknown, (collected_number)statsd.unknown_types); + rrddim_set_by_pointer(st_events, rd_events_errors, (collected_number)statsd.socket_errors); + rrdset_done(st_events); + + rrddim_set_by_pointer(st_reads, rd_reads_tcp, (collected_number)statsd.tcp_socket_reads); + rrddim_set_by_pointer(st_reads, rd_reads_udp, (collected_number)statsd.udp_socket_reads); + rrdset_done(st_reads); + + rrddim_set_by_pointer(st_bytes, rd_bytes_tcp, (collected_number)statsd.tcp_bytes_read); + rrddim_set_by_pointer(st_bytes, rd_bytes_udp, (collected_number)statsd.udp_bytes_read); + rrdset_done(st_bytes); + + rrddim_set_by_pointer(st_packets, rd_packets_tcp, (collected_number)statsd.tcp_packets_received); + rrddim_set_by_pointer(st_packets, rd_packets_udp, (collected_number)statsd.udp_packets_received); + rrdset_done(st_packets); + + rrddim_set_by_pointer(st_tcp_connects, rd_tcp_connects, (collected_number)statsd.tcp_socket_connects); + rrddim_set_by_pointer(st_tcp_connects, rd_tcp_disconnects, (collected_number)statsd.tcp_socket_disconnects); + rrdset_done(st_tcp_connects); + + rrddim_set_by_pointer(st_tcp_connected, rd_tcp_connected, (collected_number)statsd.tcp_socket_connected); + rrdset_done(st_tcp_connected); + + rrddim_set_by_pointer(st_pcharts, rd_pcharts, (collected_number)statsd.private_charts); + rrdset_done(st_pcharts); + + rrddim_set_by_pointer(stcpu_thread, rd_user, thread.ru_utime.tv_sec * 1000000ULL + thread.ru_utime.tv_usec); + rrddim_set_by_pointer(stcpu_thread, rd_system, thread.ru_stime.tv_sec * 1000000ULL + thread.ru_stime.tv_usec); + rrdset_done(stcpu_thread); + + for(i = 0; i < statsd.threads ;i++) { + rrddim_set_by_pointer(statsd.collection_threads_status[i].st_cpu, statsd.collection_threads_status[i].rd_user, statsd.collection_threads_status[i].rusage.ru_utime.tv_sec * 1000000ULL + statsd.collection_threads_status[i].rusage.ru_utime.tv_usec); + rrddim_set_by_pointer(statsd.collection_threads_status[i].st_cpu, statsd.collection_threads_status[i].rd_system, statsd.collection_threads_status[i].rusage.ru_stime.tv_sec * 1000000ULL + statsd.collection_threads_status[i].rusage.ru_stime.tv_usec); + rrdset_done(statsd.collection_threads_status[i].st_cpu); + } + } + +cleanup: ; // added semi-colon to prevent older gcc error: label at end of compound statement + netdata_thread_cleanup_pop(1); + return NULL; +} diff --git a/collectors/statsd.plugin/statsd.h b/collectors/statsd.plugin/statsd.h new file mode 100644 index 000000000..b741be76d --- /dev/null +++ b/collectors/statsd.plugin/statsd.h @@ -0,0 +1,25 @@ +// SPDX-License-Identifier: GPL-3.0-or-later + +#ifndef NETDATA_STATSD_H +#define NETDATA_STATSD_H 1 + +#include "../../daemon/common.h" + +#define STATSD_LISTEN_PORT 8125 +#define STATSD_LISTEN_BACKLOG 4096 + +#define NETDATA_PLUGIN_HOOK_STATSD \ + { \ + .name = "STATSD", \ + .config_section = NULL, \ + .config_name = NULL, \ + .enabled = 1, \ + .thread = NULL, \ + .init_routine = NULL, \ + .start_routine = statsd_main \ + }, + + +extern void *statsd_main(void *ptr); + +#endif //NETDATA_STATSD_H |