
diff options
Diffstat (limited to 'collectors/statsd.plugin')
| -rw-r--r-- | collectors/statsd.plugin/README.md | 11 | ||||
| -rw-r--r-- | collectors/statsd.plugin/k6.conf | 38 | ||||
| -rw-r--r-- | collectors/statsd.plugin/k6.md | 76 | ||||
| -rw-r--r-- | collectors/statsd.plugin/statsd.c | 10 |
4 files changed, 114 insertions, 21 deletions
diff --git a/collectors/statsd.plugin/README.md b/collectors/statsd.plugin/README.md index 0e9c954fc..f3050cebb 100644 --- a/collectors/statsd.plugin/README.md +++ b/collectors/statsd.plugin/README.md @@ -19,6 +19,17 @@ Since statsd is embedded in Netdata, it means you now have a statsd server embed Netdata statsd is fast. It can collect more than **1.200.000 metrics per second** on modern hardware, more than **200Mbps of sustained statsd traffic**, using 1 CPU core. The implementation uses two threads: one thread collects metrics, another one updates the charts from the collected data. +# Available StatsD collectors + +Netdata ships with collectors implemented using the StatsD collector. They are configuration files (as you will read bellow), but they function as a collector, in the sense that configuration file organize the metrics of a data source into pre-defined charts. + +On these charts, we can have alarms as with any metric and chart. + +- [K6 load testing tool](https://k6.io) + - **Description:** k6 is a developer-centric, free and open-source load testing tool built for making performance testing a productive and enjoyable experience. + - [Documentation](/collectors/statsd.plugin/k6.md) + - [Configuration](https://github.com/netdata/netdata/blob/master/collectors/statsd.plugin/k6.conf) + ## Metrics supported by Netdata Netdata fully supports the StatsD protocol. All StatsD client libraries can be used with Netdata too. diff --git a/collectors/statsd.plugin/k6.conf b/collectors/statsd.plugin/k6.conf index 775f53060..3bef00ca1 100644 --- a/collectors/statsd.plugin/k6.conf +++ b/collectors/statsd.plugin/k6.conf @@ -6,6 +6,7 @@ [dictionary] http_reqs = HTTP Requests + http_reqs_failed = Failed HTTP Requests vus = Virtual active users vus_max = max Virtual active users iteration_duration = iteration duration @@ -19,7 +20,7 @@ http_req_receiving = Receiving HTTP requests http_req_waiting = Waiting HTTP requests http_req_duration_median = Median HTTP req duration - http_req_duration_average = AVG HTTP req duration + http_req_duration_average = Avg HTTP req duration http_req_duration = HTTP req duration http_req_duration_max = max HTTP req duration http_req_duration_min = min HTTP req duration @@ -30,13 +31,22 @@ [http_reqs] name = http_reqs - title = HTTP Requests + title = HTTP Requests rate family = http requests context = k6.http_requests dimension = k6.http_reqs http_reqs last 1 1 sum type = line units = requests/s +[http_reqs] + name = http_reqs_failed + title = Failed HTTP Requests rate + family = http requests + context = k6.http_requests + dimension = k6.http_reqs_failed http_reqs_failed last 1 1 sum + type = line + units = requests/s + [vus] name = vus title = Virtual Active Users @@ -53,7 +63,7 @@ dimension = k6.iteration_duration iteration_duration last 1 1 dimension = k6.iteration_duration iteration_duration_max max 1 1 dimension = k6.iteration_duration iteration_duration_min min 1 1 - dimension = k6.iteration_duration iteration_duration_avg avg 1 1 + dimension = k6.iteration_duration iteration_duration_avg average 1 1 type = line units = s @@ -74,31 +84,27 @@ units = kb/s type = area -[http_req_status] - name = http_req_status - title = Time spent on HTTP - family = http requests - dimension = k6.http_req_blocked http_req_blocked last 1 1 - dimension = k6.http_req_connecting http_req_connecting last 1 1 - units = ms - type = line - [http_req_duration_types] name = http_req_duration_types - title = Time spent on HTTP connection states + title = HTTP Requests total duration family = http requests dimension = k6.http_req_sending http_req_sending last 1 1 dimension = k6.http_req_waiting http_req_waiting last 1 1 dimension = k6.http_req_receiving http_req_receiving last 1 1 + dimension = k6.http_req_blocked http_req_blocked last 1 1 + dimension = k6.http_req_connecting http_req_connecting last 1 1 units = ms type = stacked [http_req_duration] name = http_req_duration - title = Total time for HTTP request + title = HTTP duration metrics family = http requests dimension = k6.http_req_duration http_req_duration_median median 1 1 dimension = k6.http_req_duration http_req_duration_max max 1 1 - dimension = k6.http_req_duration http_req_duration_average avg 1 1 + dimension = k6.http_req_duration http_req_duration_average average 1 1 dimension = k6.http_req_duration http_req_duration_min min 1 1 - dimension = k6.http_req_duration httP_req_duration_p95 percentile 1 1 + dimension = k6.http_req_duration http_req_duration_p95 percentile 1 1 + dimension = k6.http_req_duration http_req_duration last 1 1 + units = ms + type = line diff --git a/collectors/statsd.plugin/k6.md b/collectors/statsd.plugin/k6.md new file mode 100644 index 000000000..4f8c70133 --- /dev/null +++ b/collectors/statsd.plugin/k6.md @@ -0,0 +1,76 @@ +<!-- +title: "K6 load test monitoring with Netdata" +custom_edit_url: https://github.com/netdata/netdata/edit/master/collectors/statsd.plugin/k6.md + +sidebar_label: "K6 Load Testing" +--> + +# K6 Load Testing monitoring with Netdata + +Monitors the impact of load testing experiments performed with [K6](https://k6.io/). + +You can read more about the metrics that K6 sends in the [K6 documentation](https://k6.io/docs/using-k6/metrics/). + +## Requirements + +- When running the k6 experiment, specify a [StatsD output](https://k6.io/docs/results-visualization/statsd/). + - Tip: K6 currently supports tags only with [datadog output](https://k6.io/docs/results-visualization/datadog/), which is in essence StatsD. Netdata can be used with both. + +## Metrics + +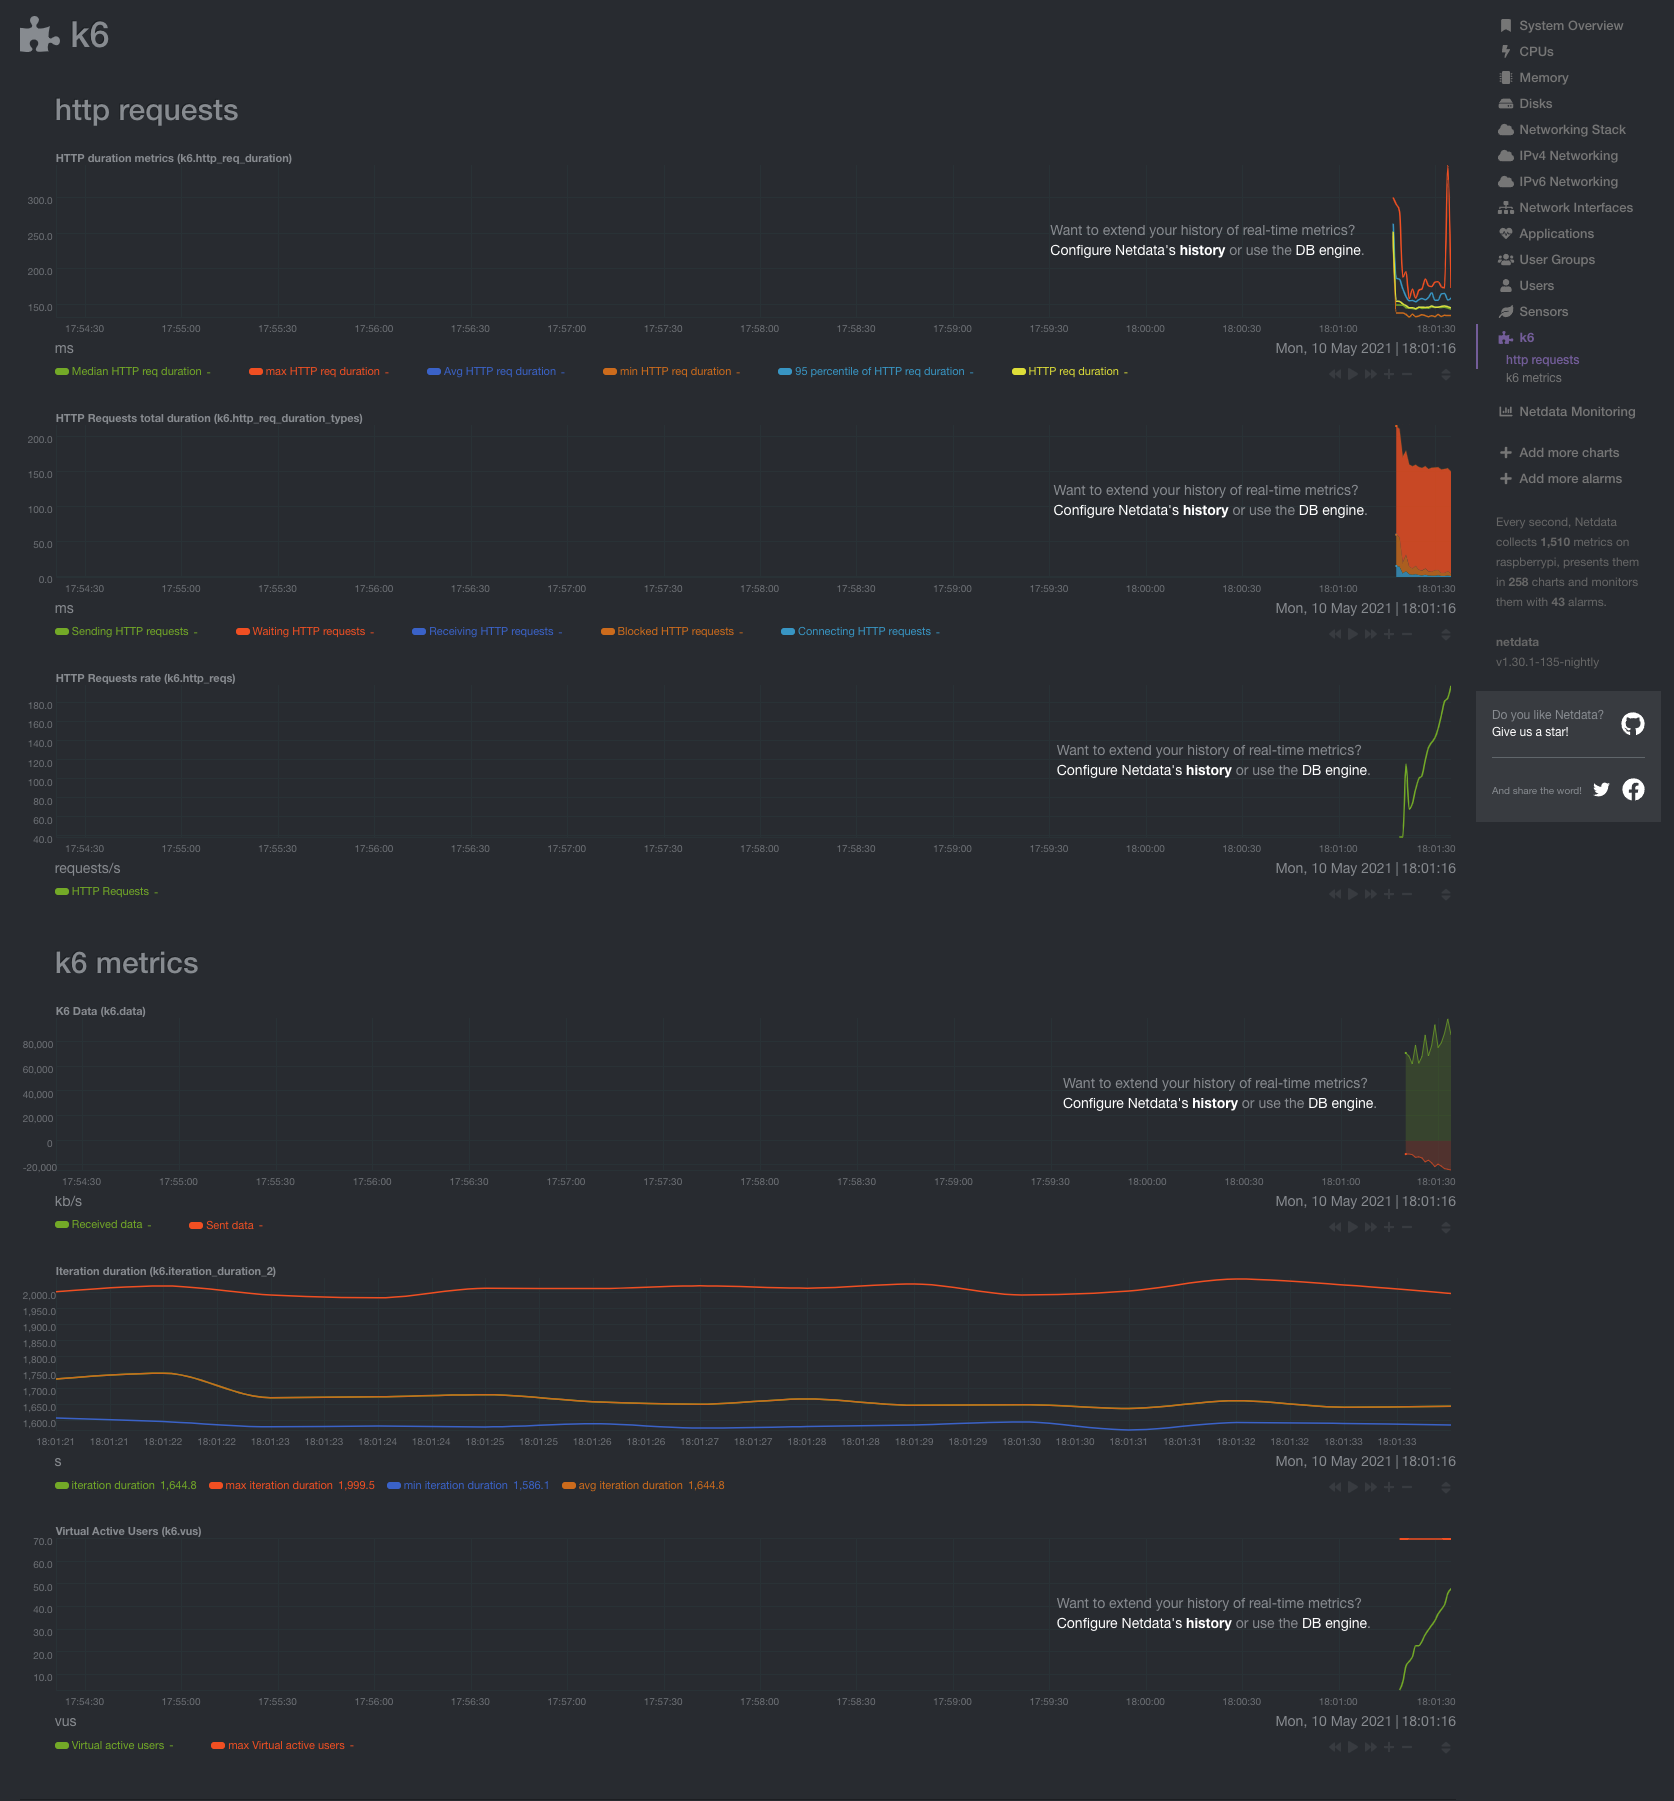 + + +### HTTP Requests + +Number of HTTP requests that K6 generates, per second. + +### Failed HTTP Requests + +Number of failed HTTP requests that K6 generates, per second. + +### Virtual Active Users +Current number of active virtual users. + +### Iteration Duration + +The time it took K6 to complete one full iteration of the main function. + +### Dropped Iterations + +The number of iterations that could not be started either due to lack of Virtual Users or lack of time. + +### Data + +The amount of data received and sent. + +### TTP Requests total duration + +The total duration it took for a round-trip of an HTTP request. It includes: +- Blocked HTTP requests: time spent blocked before initiating the request +- Connecting HTTP requests: time spent establishing TCP connection to the remote host +- Sending HTTP requests: time spent sending data to the remote host +- Receiving HTTP requests: time spent receiving data from the remote host +- Waiting HTTP requests: time spent waiting for response from the remote host + +### HTTP duration metrics + +Different metrics on the HTTP request as defined by K6. The HTTP request duration is defined by K6 as: `HTTP sending request` + `HTTP receiving request` + `HTTP waiting request`. + +Metrics: +- Median +- Average +- Max +- Min +- 95th percentile +- absolute (the value as it is, without any computation) + +## Configuration + +The collector is preconfigured and defined in `statsd.plugin/k6.conf`. + +Due to being a StatsD collector, you only need to define the configuration file and then send data to Netdata using the StatsD protocol. + +If Netdata is running on the same machine as K6, no further configuration is required. Otherwise, you will have to [point K6](https://k6.io/docs/results-visualization/statsd/) to your node and make sure that the K6 process can reach Netdata. + +The default namespace that is used in the configuration is `k6`. If you change it in K6, you will have to change it as well in the configuration file `k6.conf`. diff --git a/collectors/statsd.plugin/statsd.c b/collectors/statsd.plugin/statsd.c index e89585719..e30cc6e2b 100644 --- a/collectors/statsd.plugin/statsd.c +++ b/collectors/statsd.plugin/statsd.c @@ -153,7 +153,7 @@ typedef struct statsd_index { STATSD_METRIC *first; // the linked list of metrics (new metrics are added in front) STATSD_METRIC *first_useful; // the linked list of useful metrics (new metrics are added in front) - STATSD_FIRST_PTR_MUTEX; // when mutli-threading is enabled, a lock to protect the linked list + STATSD_FIRST_PTR_MUTEX; // when multi-threading is enabled, a lock to protect the linked list STATS_METRIC_OPTIONS default_options; // default options for all metrics in this index } STATSD_INDEX; @@ -182,7 +182,7 @@ typedef struct statsd_app_chart_dimension { SIMPLE_PATTERN *metric_pattern; // set when the 'metric' is a simple pattern - collected_number multiplier; // the multipler of the dimension + collected_number multiplier; // the multiplier of the dimension collected_number divisor; // the divisor of the dimension RRDDIM_FLAGS flags; // the RRDDIM flags for this dimension @@ -1340,7 +1340,7 @@ static int statsd_readfile(const char *filename, STATSD_APP *app, STATSD_APP_CHA char *dim_name = words[i++]; char *type = words[i++]; - char *multipler = words[i++]; + char *multiplier = words[i++]; char *divisor = words[i++]; char *options = words[i++]; @@ -1371,7 +1371,7 @@ static int statsd_readfile(const char *filename, STATSD_APP *app, STATSD_APP_CHA , chart , metric_name , dim_name - , (multipler && *multipler)?str2l(multipler):1 + , (multiplier && *multiplier)?str2l(multiplier):1 , (divisor && *divisor)?str2l(divisor):1 , flags , string2valuetype(type, line, filename) @@ -2418,7 +2418,7 @@ void *statsd_main(void *ptr) { , NULL , "statsd" , "netdata.statsd_cpu" - , "NetData statsd charting thread CPU usage" + , "Netdata statsd charting thread CPU usage" , "milliseconds/s" , PLUGIN_STATSD_NAME , "stats" |