
diff options
Diffstat (limited to 'docs/cloud/alerts-notifications/notifications.md')
| -rw-r--r-- | docs/cloud/alerts-notifications/notifications.md | 26 |
1 files changed, 13 insertions, 13 deletions
diff --git a/docs/cloud/alerts-notifications/notifications.md b/docs/cloud/alerts-notifications/notifications.md index ad115d43f..cde30a2b4 100644 --- a/docs/cloud/alerts-notifications/notifications.md +++ b/docs/cloud/alerts-notifications/notifications.md @@ -8,7 +8,7 @@ you or your team. Having this information centralized helps you: * Have a clear view of the health across your infrastructure, seeing all alerts in one place. -* Easily [setup your alert notification process](https://github.com/netdata/netdata/blob/master/docs/cloud/alerts-notifications/manage-notification-methods.md): +* Easily [set up your alert notification process](https://github.com/netdata/netdata/blob/master/docs/cloud/alerts-notifications/manage-notification-methods.md): methods to use and where to use them, filtering rules, etc. * Quickly troubleshoot using [Metric Correlations](https://github.com/netdata/netdata/blob/master/docs/cloud/insights/metric-correlations.md) or [Anomaly Advisor](https://github.com/netdata/netdata/blob/master/docs/cloud/insights/anomaly-advisor.md) @@ -104,8 +104,8 @@ if the node should be silenced for the entire space or just for specific rooms ( ### Scope definition for Alerts * **Alert name:** silencing a specific alert name silences all alert state transitions for that specific alert. -* **Alert context:** silencing a specific alert context will silence all alert state transitions for alerts targeting that chart context, for more details check [alert configuration docs](https://github.com/netdata/netdata/blob/master/health/REFERENCE.md#alarm-line-on). -* **Alert role:** silencing a specific alert role will silence all the alert state transitions for alerts that are configured to be specific role recipients, for more details check [alert configuration docs](https://github.com/netdata/netdata/blob/master/health/REFERENCE.md#alarm-line-to). +* **Alert context:** silencing a specific alert context will silence all alert state transitions for alerts targeting that chart context, for more details check [alert configuration docs](https://github.com/netdata/netdata/blob/master/health/REFERENCE.md#alert-line-on). +* **Alert role:** silencing a specific alert role will silence all the alert state transitions for alerts that are configured to be specific role recipients, for more details check [alert configuration docs](https://github.com/netdata/netdata/blob/master/health/REFERENCE.md#alert-line-to). Beside the above two main entities there are another two important settings that you can define on a silencing rule: * Who does the rule affect? **All user** in the space or **Myself** @@ -124,24 +124,24 @@ the local Agent dashboard at `http://NODE:19999`. ## Anatomy of an alert notification -Email alarm notifications show the following information: +Email alert notifications show the following information: - The Space's name - The node's name -- Alarm status: critical, warning, cleared -- Previous alarm status -- Time at which the alarm triggered -- Chart context that triggered the alarm -- Name and information about the triggered alarm -- Alarm value +- Alert status: critical, warning, cleared +- Previous alert status +- Time at which the alert triggered +- Chart context that triggered the alert +- Name and information about the triggered alert +- Alert value - Total number of warning and critical alerts on that node -- Threshold for triggering the given alarm state +- Threshold for triggering the given alert state - Calculation or database lookups that Netdata uses to compute the value -- Source of the alarm, including which file you can edit to configure this alarm on an individual node +- Source of the alert, including which file you can edit to configure this alert on an individual node Email notifications also feature a **Go to Node** button, which takes you directly to the offending chart for that node within Cloud's embedded dashboards. Here's an example email notification for the `ram_available` chart, which is in a critical state: -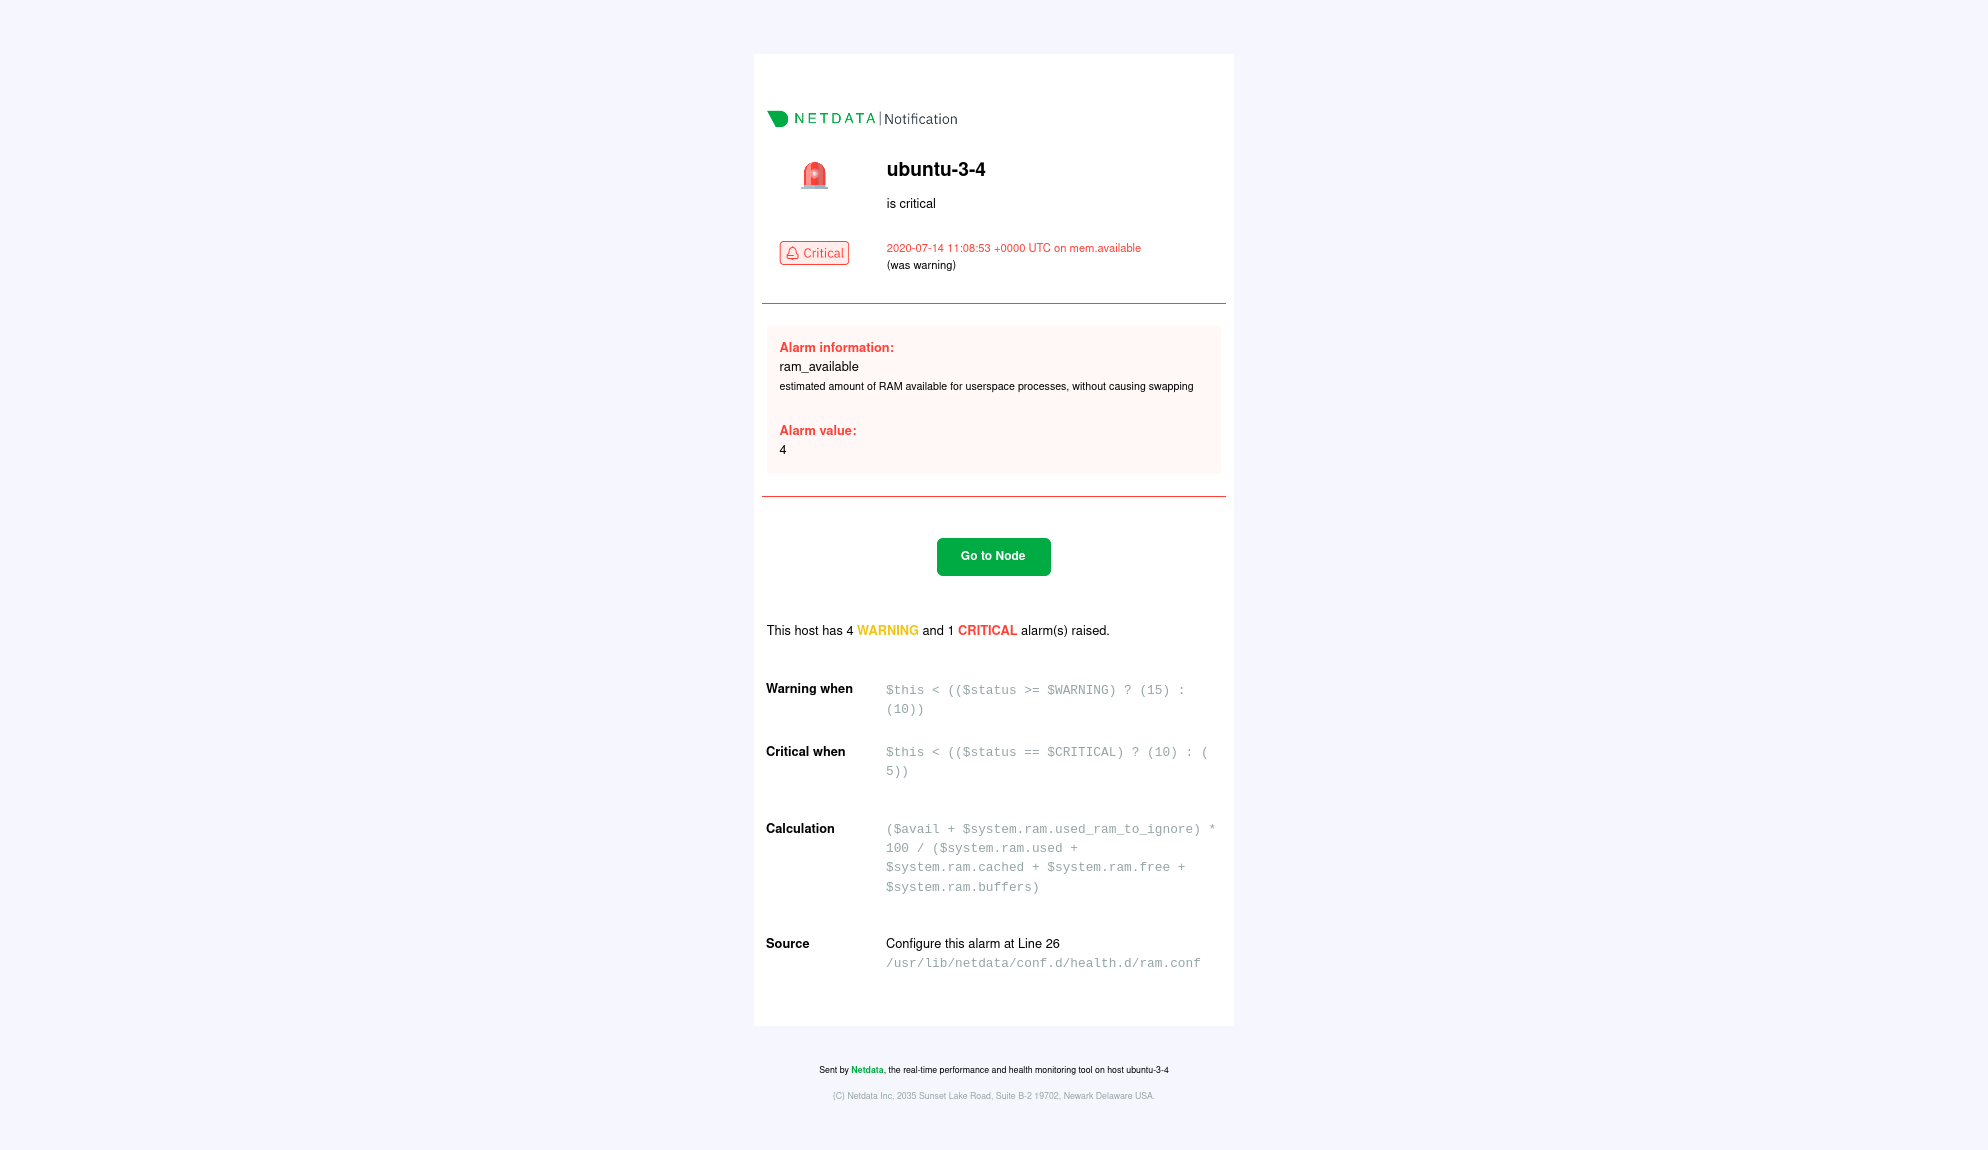 + |