
diff options
Diffstat (limited to '')
| -rw-r--r-- | docs/cloud/insights/anomaly-advisor.md (renamed from docs/cloud/insights/anomaly-advisor.mdx) | 19 |
1 files changed, 10 insertions, 9 deletions
diff --git a/docs/cloud/insights/anomaly-advisor.mdx b/docs/cloud/insights/anomaly-advisor.md index 98a28d92c..4804dbc16 100644 --- a/docs/cloud/insights/anomaly-advisor.mdx +++ b/docs/cloud/insights/anomaly-advisor.md @@ -1,12 +1,14 @@ ---- +<!-- title: "Anomaly Advisor" description: "Quickly find anomalous metrics anywhere in your infrastructure." -custom_edit_url: "https://github.com/netdata/netdata/blob/master/docs/cloud/insights/anomaly-advisor.mdx" +custom_edit_url: "https://github.com/netdata/netdata/blob/master/docs/cloud/insights/anomaly-advisor.md" sidebar_label: "Anomaly Advisor" learn_status: "Published" learn_topic_type: "Tasks" learn_rel_path: "Operations" ---- +--> + +# Anomaly Advisor import ReactPlayer from 'react-player' @@ -19,7 +21,7 @@ interest. If you are running a Netdata version higher than `v1.35.0-29-nightly` you will be able to use the Anomaly Advisor out of the box with zero configuration. If you are on an earlier Netdata version you will need to first enable ML on your nodes by following the steps below. -To enable the Anomaly Advisor you must first enable ML on your nodes via a small config change in `netdata.conf`. Once the anomaly detection models have trained on the Agent (with default settings this takes a couple of hours until enough data has been seen to train the models) you will then be able to enable the Anomaly Advisor feature in Netdata Cloud. +To enable the Anomaly Advisor you must first enable ML on your nodes via a small config change in `netdata.conf`. Once the anomaly detection models have trained on the Agent (with default settings this takes a couple of hours until enough data has been seen to train the models) you will then be able to enable the Anomaly Advisor feature in Netdata Cloud. ### Enable ML on Netdata Agent @@ -30,9 +32,7 @@ To enable ML on your Netdata Agent, you need to edit the `[ml]` section in your enabled = yes ``` -At a minimum you just need to set `enabled = yes` to enable ML with default params. More details about configuration can be found in the [Netdata Agent ML docs](https://learn.netdata.cloud/docs/agent/ml#configuration). - -**Note**: Follow [this guide](https://github.com/netdata/netdata/blob/master/docs/guides/step-by-step/step-04.md) if you are unfamiliar with making configuration changes in Netdata. +At a minimum you just need to set `enabled = yes` to enable ML with default params. More details about configuration can be found in the [Netdata Agent ML docs](https://github.com/netdata/netdata/blob/master/ml/README.md#configuration). When you have finished your configuration, restart Netdata with a command like `sudo systemctl restart netdata` for the config changes to take effect. You can find more info on restarting Netdata [here](https://github.com/netdata/netdata/blob/master/docs/configure/start-stop-restart.md). @@ -44,7 +44,7 @@ Once this line flattens out all configured metrics should have models trained an ## Using Anomaly Advisor -To use the Anomaly Advisor, go to the "anomalies" tab. Once you highlight a particular timeframe of interest, a selection of the most anomalous dimensions will appear below. +To use the Anomaly Advisor, go to the "anomalies" tab. Once you highlight a particular timeframe of interest, a selection of the most anomalous dimensions will appear below. The aim here is to surface the most anomalous metrics in the space or room for the highlighted window to try and cut down on the amount of manual searching required to get to the root cause of your issues. @@ -68,7 +68,7 @@ You can expand any sparkline chart to see the underlying raw data to see how it 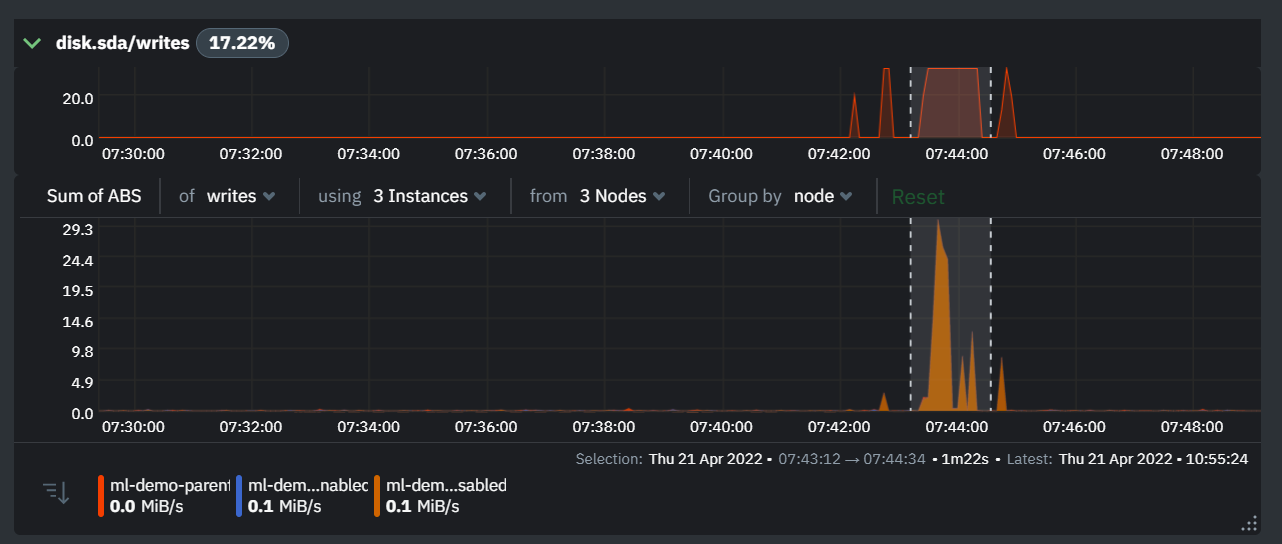 -On the upper right hand side of the page you can select which nodes to filter on if you wish to do so. The ML training status of each node is also displayed. +On the upper right hand side of the page you can select which nodes to filter on if you wish to do so. The ML training status of each node is also displayed. On the lower right hand side of the page an index of anomaly rates is displayed for the highlighted timeline of interest. The index is sorted from most anomalous metric (highest anomaly rate) to least (lowest anomaly rate). Clicking on an entry in the index will scroll the rest of the page to the corresponding anomaly rate sparkline for that metric. @@ -80,6 +80,7 @@ On the lower right hand side of the page an index of anomaly rates is displayed You can read more detail on how anomaly detection in the Netdata Agent works in our [Agent docs](https://github.com/netdata/netdata/blob/master/ml/README.md). 🚧 **Note**: This functionality is still **under active development** and considered experimental. We dogfood it internally and among early adopters within the Netdata community to build the feature. If you would like to get involved and help us with feedback, you can reach us through any of the following channels: + - Email us at analytics-ml-team@netdata.cloud - Comment on the [beta launch post](https://community.netdata.cloud/t/anomaly-advisor-beta-launch/2717) in the Netdata community - Join us in the [🤖-ml-powered-monitoring](https://discord.gg/4eRSEUpJnc) channel of the Netdata discord. |