
diff options
Diffstat (limited to 'docs/cloud')
27 files changed, 2647 insertions, 0 deletions
diff --git a/docs/cloud/alerts-notifications/add-discord-notification.md b/docs/cloud/alerts-notifications/add-discord-notification.md new file mode 100644 index 000000000..386e6035e --- /dev/null +++ b/docs/cloud/alerts-notifications/add-discord-notification.md @@ -0,0 +1,59 @@ +<!-- +title: "Add Discord notification configuration" +sidebar_label: "Add Discord notification configuration" +custom_edit_url: "https://github.com/netdata/netdata/blob/master/docs/cloud/alerts-notifications/add-discord-notification-configuration.md" +sidebar_position: "1" +learn_status: "Published" +learn_topic_type: "Tasks" +learn_rel_path: "Operations/Alerts" +learn_docs_purpose: "Instructions on how to add notification configuration for Discord" +--> + +From the Netdata Cloud UI, you can manage your space's notification settings and enable the configuration to deliver notifications on Discord. + +#### Prerequisites + +To enable Discord notifications you need: + +- A Netdata Cloud account +- Access to the space as an **administrator** +- Have a Discord server able to receive webhook integrations. For mode details check [how to configure this on Discord](#settings-on-discord) + +#### Steps + +1. Click on the **Space settings** cog (located above your profile icon) +1. Click on the **Notification** tab +1. Click on the **+ Add configuration** button (near the top-right corner of your screen) +1. On the **Discord** card click on **+ Add** +1. A modal will be presented to you to enter the required details to enable the configuration: + 1. **Notification settings** are Netdata specific settings + - Configuration name - you can optionally provide a name for your configuration you can easily refer to it + - Rooms - by specifying a list of Rooms you are select to which nodes or areas of your infrastructure you want to be notified using this configuration + - Notification - you specify which notifications you want to be notified using this configuration: All Alerts and unreachable, All Alerts, Critical only + 1. **Integration configuration** are the specific notification integration required settings, which vary by notification method. For Discord: + - Define the type channel you want to send notifications to: **Text channel** or **Forum channel** + - Webhook URL - URL provided on Discord for the channel you want to receive your notifications. For more details check [how to configure this on Discord](#settings-on-discord) + - Thread name - if the Discord channel is a **Forum channel** you will need to provide the thread name as well + +#### Settings on Discord + +#### Enable webhook integrations on Discord server + +To enable the webhook integrations on Discord you need: +1. Go to *Integrations** under your **Server Settings + + 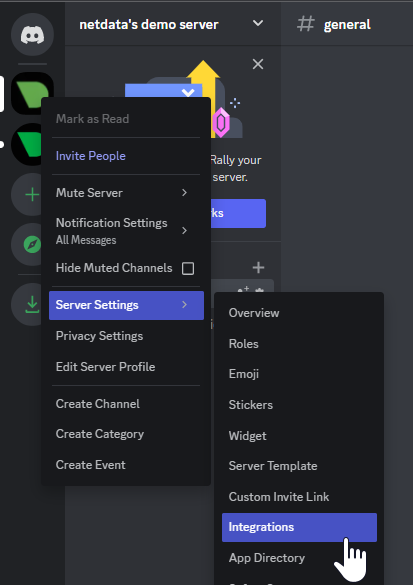 + +1. **Create Webhook** or **View Webhooks** if you already have some defined +1. When you create a new webhook you specify: Name and Channel +1. Once you have this configured you will need the Webhook URL to add your notification configuration on Netdata UI + + 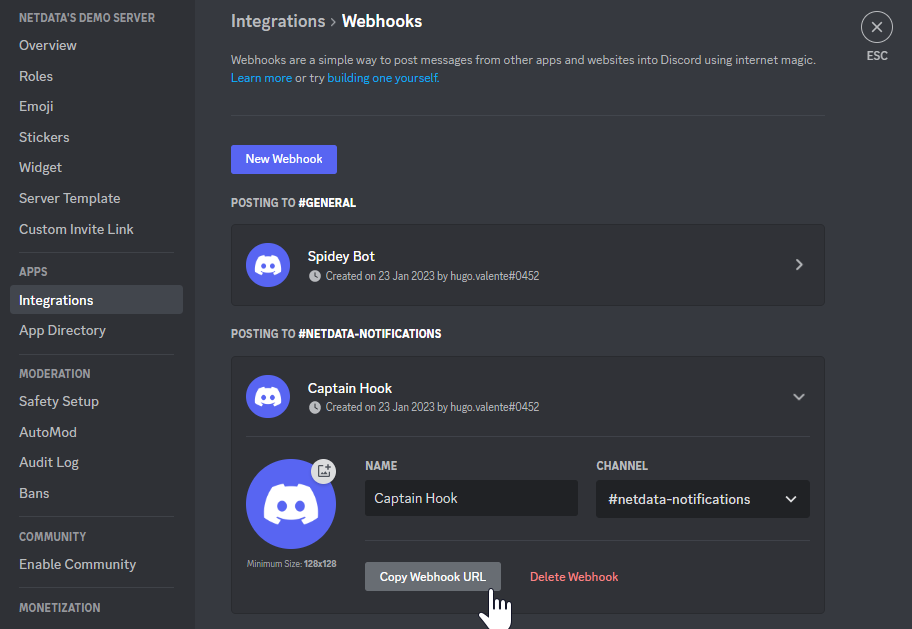 + +For more details please read this article from Discord: [Intro to Webhooks](https://support.discord.com/hc/en-us/articles/228383668). + +#### Related topics + +- [Alerts Configuration](https://github.com/netdata/netdata/blob/master/health/README.md) +- [Alert Notifications](https://github.com/netdata/netdata/blob/master/docs/cloud/alerts-notifications/notifications.mdx) +- [Manage notification methods](https://github.com/netdata/netdata/blob/master/docs/cloud/alerts-notifications/manage-notification-methods.md)
\ No newline at end of file diff --git a/docs/cloud/alerts-notifications/add-pagerduty-notification-configuration.md b/docs/cloud/alerts-notifications/add-pagerduty-notification-configuration.md new file mode 100644 index 000000000..6e47cfd9c --- /dev/null +++ b/docs/cloud/alerts-notifications/add-pagerduty-notification-configuration.md @@ -0,0 +1,60 @@ +<!-- +title: "Add PagerDuty notification configuration" +sidebar_label: "Add PagerDuty notification configuration" +custom_edit_url: "https://github.com/netdata/netdata/blob/master/docs/cloud/alerts-notifications/add-pagerduty-notification-configuration.md" +sidebar_position: "1" +learn_status: "Published" +learn_topic_type: "Tasks" +learn_rel_path: "Operations/Alerts" +learn_docs_purpose: "Instructions on how to add notification configuration for PagerDuty" +--> + +From the Cloud interface, you can manage your space's notification settings and from these you can add specific configuration to get notifications delivered on PagerDuty. + +#### Prerequisites + +To add PagerDuty notification configurations you need + +- A Cloud account +- Access to the space as and **administrator** +- Space will needs to be on **Business** plan or higher +- Have a PagerDuty service to receive events, for mode details check [how to configure this on PagerDuty](#settings-on-pagerduty) + +#### Steps + +1. Click on the **Space settings** cog (located above your profile icon) +1. Click on the **Notification** tab +1. Click on the **+ Add configuration** button (near the top-right corner of your screen) +1. On the **PagerDuty** card click on **+ Add** +1. A modal will be presented to you to enter the required details to enable the configuration: + 1. **Notification settings** are Netdata specific settings + - Configuration name - you can optionally provide a name for your configuration you can easily refer to it + - Rooms - by specifying a list of Rooms you are select to which nodes or areas of your infrastructure you want to be notified using this configuration + - Notification - you specify which notifications you want to be notified using this configuration: All Alerts and unreachable, All Alerts, Critical only + 1. **Integration configuration** are the specific notification integration required settings, which vary by notification method. For PagerDuty: + - Integration Key - is a 32 character key provided by PagerDuty to receive events on your service. For more details check [how to configure this on PagerDuty](#settings-on-pagerduty) + +#### Settings on PagerDuty + +#### Enable webhook integrations on PagerDuty + +To enable the webhook integrations on PagerDuty you need: +1. Create a service to receive events from your services directory page: + + 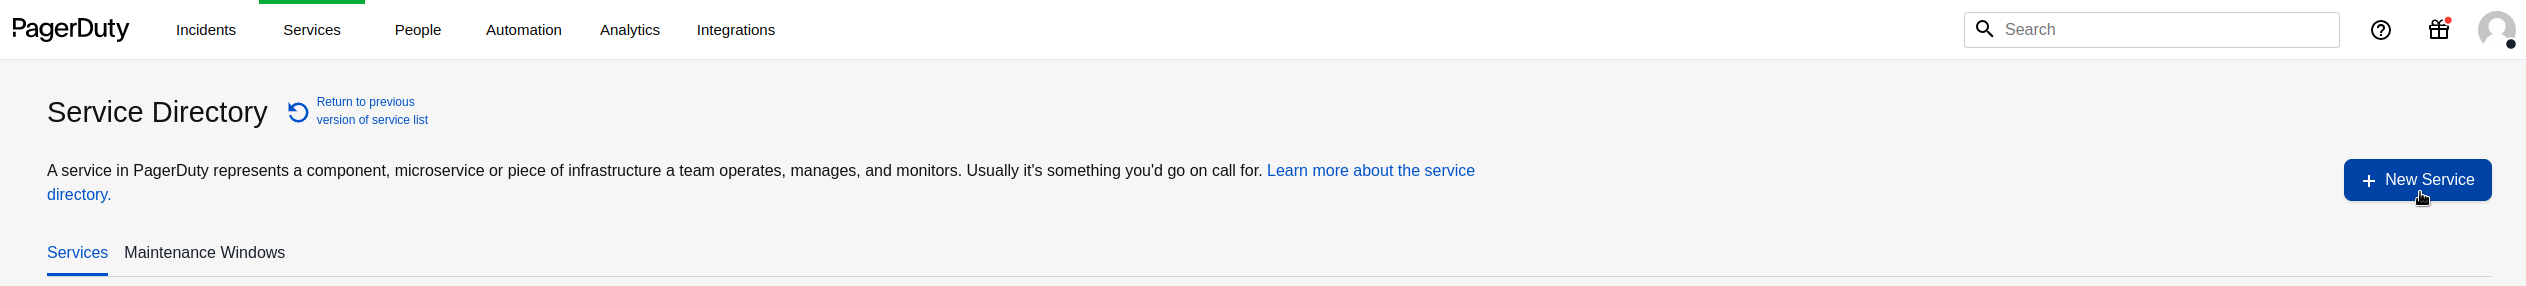 + +1. At step 3, select `Events API V2` Integration:or **View Webhooks** if you already have some defined + + 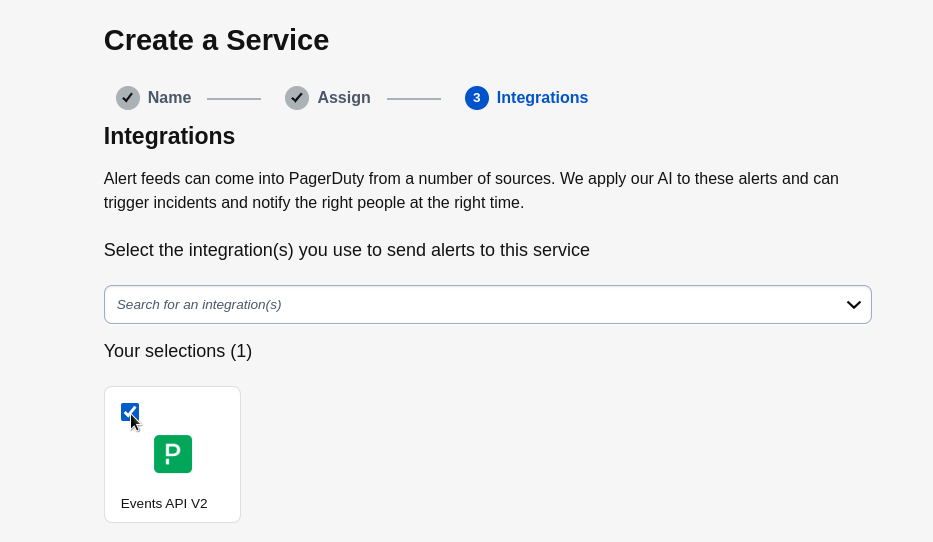 + +1. Once the service is created you will be redirected to its configuration page, where you can copy the **integration key**, that you will need need to add to your notification configuration on Netdata UI: + + + 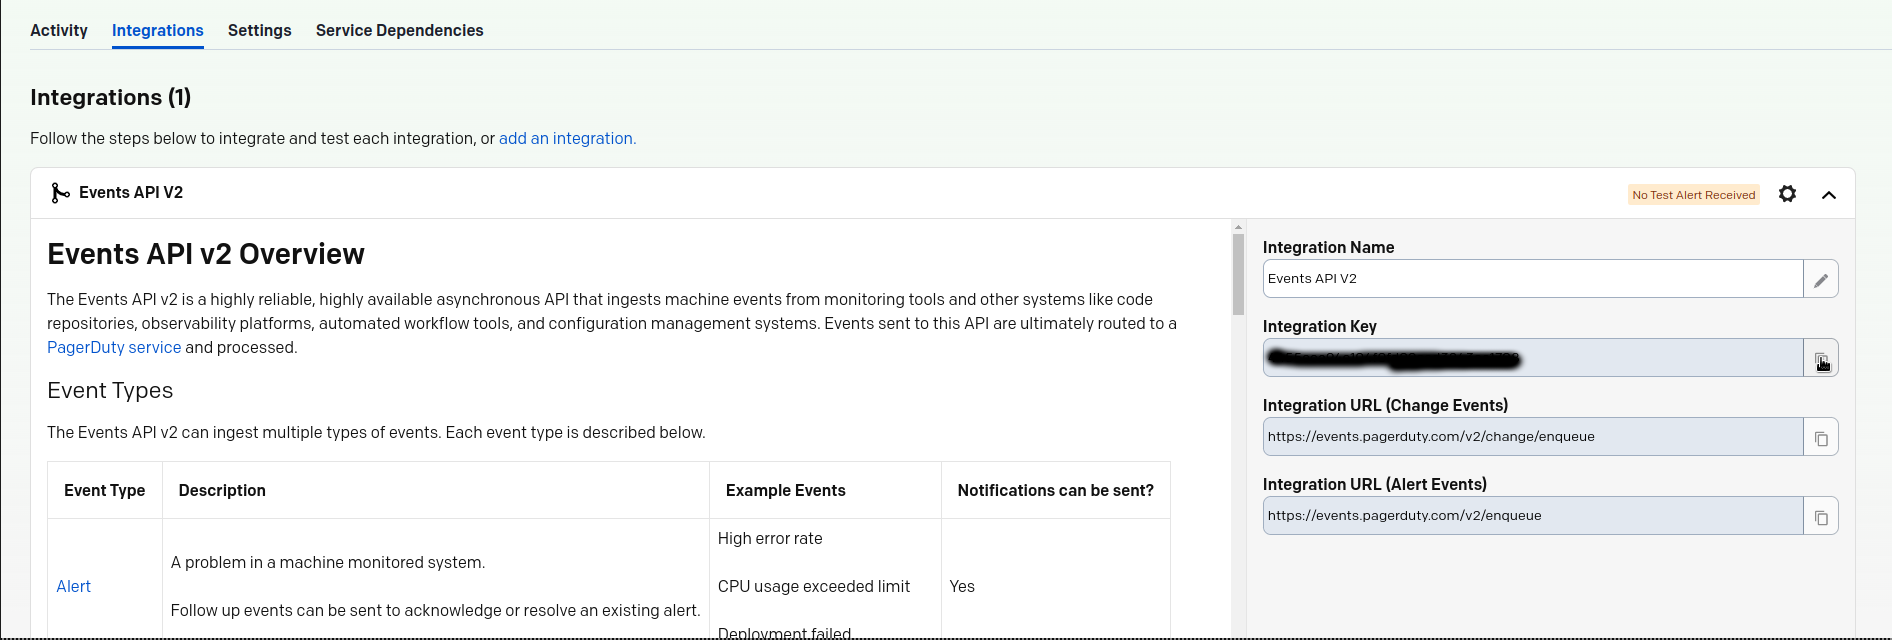 + + +#### Related topics + +- [Alerts Configuration](https://github.com/netdata/netdata/blob/master/health/README.md) +- [Alert Notifications](https://github.com/netdata/netdata/blob/master/docs/cloud/alerts-notifications/notifications.mdx) +- [Manage notification methods](https://github.com/netdata/netdata/blob/master/docs/cloud/alerts-notifications/manage-notification-methods.md)
\ No newline at end of file diff --git a/docs/cloud/alerts-notifications/add-slack-notification-configuration.md b/docs/cloud/alerts-notifications/add-slack-notification-configuration.md new file mode 100644 index 000000000..d8d6185fe --- /dev/null +++ b/docs/cloud/alerts-notifications/add-slack-notification-configuration.md @@ -0,0 +1,63 @@ +<!-- +title: "Add Slack notification configuration" +sidebar_label: "Add Slack notification configuration" +custom_edit_url: "https://github.com/netdata/netdata/blob/master/docs/cloud/alerts-notifications/add-slack-notification-configuration.md" +sidebar_position: "1" +learn_status: "Published" +learn_topic_type: "Tasks" +learn_rel_path: "Operations/Alerts" +learn_docs_purpose: "Instructions on how to add notification configuration for Slack" +--> + +From the Cloud interface, you can manage your space's notification settings and from these you can add specific configuration to get notifications delivered on Slack. + +#### Prerequisites + +To add discord notification configurations you need + +- A Netdata Cloud account +- Access to the space as an **administrator** +- Space will needs to be on **Business** plan or higher +- Have a Slack app on your workspace to receive the webhooks, for mode details check [how to configure this on Slack](#settings-on-slack) + +#### Steps + +1. Click on the **Space settings** cog (located above your profile icon) +1. Click on the **Notification** tab +1. Click on the **+ Add configuration** button (near the top-right corner of your screen) +1. On the **Slack** card click on **+ Add** +1. A modal will be presented to you to enter the required details to enable the configuration: + 1. **Notification settings** are Netdata specific settings + - Configuration name - you can optionally provide a name for your configuration you can easily refer to it + - Rooms - by specifying a list of Rooms you are select to which nodes or areas of your infrastructure you want to be notified using this configuration + - Notification - you specify which notifications you want to be notified using this configuration: All Alerts and unreachable, All Alerts, Critical only + 1. **Integration configuration** are the specific notification integration required settings, which vary by notification method. For Slack: + - Webhook URL - URL provided on Slack for the channel you want to receive your notifications. For more details check [how to configure this on Slack](#settings-on-slack) + +#### Settings on Slack + +To enable the webhook integrations on Slack you need: +1. Create an app to receive webhook integrations. Check [Create an app](https://api.slack.com/apps?new_app=1) from Slack documentation for further details +1. Install the app on your workspace +1. Configure Webhook URLs for your workspace + - On your app go to **Incoming Webhooks** and click on **activate incoming webhooks** + + 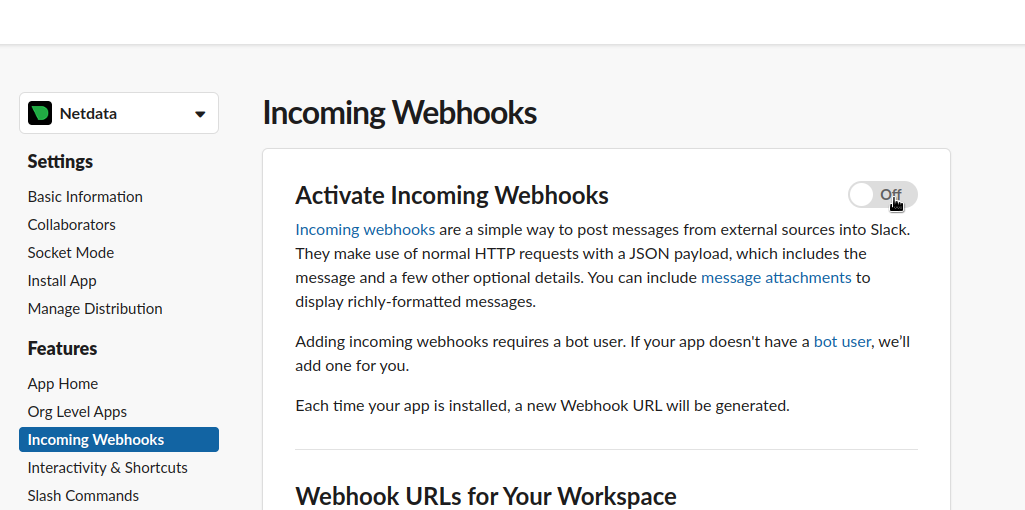 + + - At the bottom of **Webhook URLs for Your Workspace** section you have **Add New Webhook to Workspace** + - After pressing that specify the channel where you want your notifications to be delivered + + 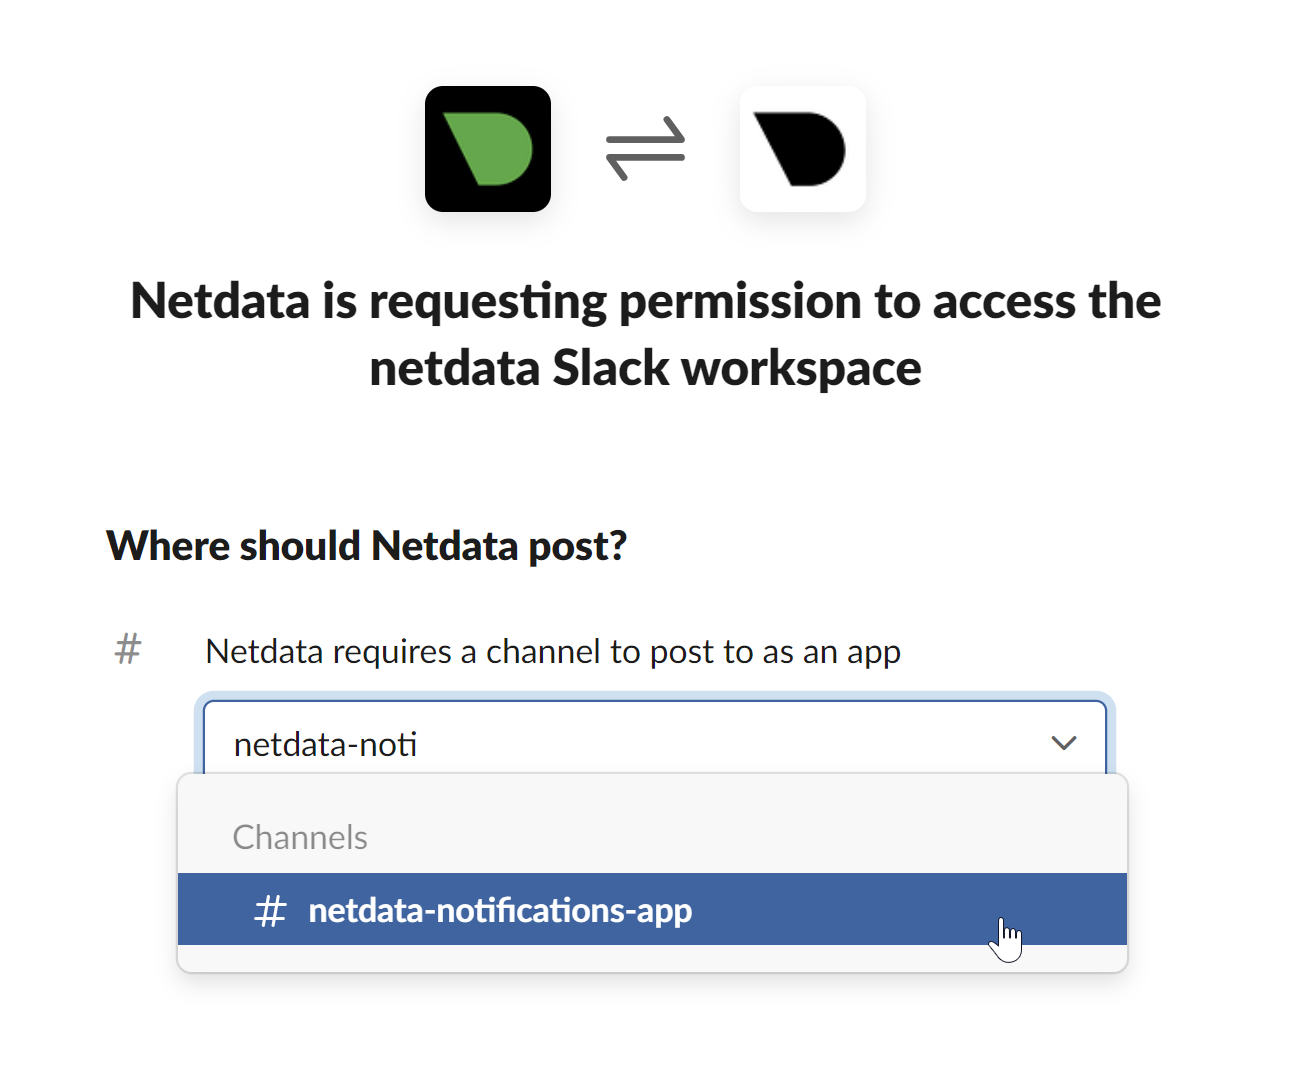 + + - Once completed copy the Webhook URL that you will need to add to your notification configuration on Netdata UI + + 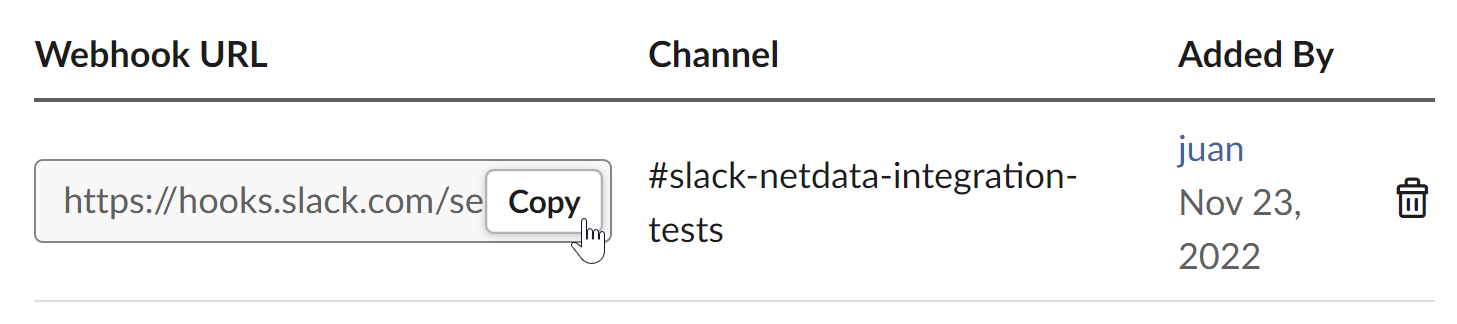 + +For more details please check Slacks's article [Incoming webhooks for Slack](https://slack.com/help/articles/115005265063-Incoming-webhooks-for-Slack). + + +#### Related topics + +- [Alerts Configuration](https://github.com/netdata/netdata/blob/master/health/README.md) +- [Alert Notifications](https://github.com/netdata/netdata/blob/master/docs/cloud/alerts-notifications/notifications.mdx) +- [Manage notification methods](https://github.com/netdata/netdata/blob/master/docs/cloud/alerts-notifications/manage-notification-methods.md)
\ No newline at end of file diff --git a/docs/cloud/alerts-notifications/add-webhook-notification-configuration.md b/docs/cloud/alerts-notifications/add-webhook-notification-configuration.md new file mode 100644 index 000000000..e6d042339 --- /dev/null +++ b/docs/cloud/alerts-notifications/add-webhook-notification-configuration.md @@ -0,0 +1,105 @@ +<!-- +title: "Add webhook notification configuration" +sidebar_label: "Add webhook notification configuration" +custom_edit_url: "https://github.com/netdata/netdata/blob/master/docs/cloud/alerts-notifications/add-webhook-notification-configuration.md" +sidebar_position: "1" +learn_status: "Published" +learn_topic_type: "Tasks" +learn_rel_path: "Operations/Alerts" +learn_docs_purpose: "Instructions on how to add notification configuration for webhook" +--> + +From the Cloud interface, you can manage your space's notification settings and from these you can add specific configuration to get notifications delivered on a webhook using a predefined schema. + +#### Prerequisites + +To add discord notification configurations you need + +- A Netdata Cloud account +- Access to the space as an **administrator** +- Space needs to be on **Pro** plan or higher +- Have an app that allows you to receive webhooks following a predefined schema, for mode details check [how to create the webhook service](#webhook-service) + +#### Steps + +1. Click on the **Space settings** cog (located above your profile icon) +1. Click on the **Notification** tab +1. Click on the **+ Add configuration** button (near the top-right corner of your screen) +1. On the **webhook** card click on **+ Add** +1. A modal will be presented to you to enter the required details to enable the configuration: + 1. **Notification settings** are Netdata specific settings + - Configuration name - you can optionally provide a name for your configuration you can easily refer to it + - Rooms - by specifying a list of Rooms you are select to which nodes or areas of your infrastructure you want to be notified using this configuration + - Notification - you specify which notifications you want to be notified using this configuration: All Alerts and unreachable, All Alerts, Critical only + 1. **Integration configuration** are the specific notification integration required settings, which vary by notification method. For webhook: + - Webhook URL - webhook URL is the url of the service that Netdata will send notifications to. In order to keep the communication secured, we only accept HTTPS urls. Check [how to create the webhook service](#webhook-service). + - Extra headers - these are optional key-value pairs that you can set to be included in the HTTP requests sent to the webhook URL. For mode details check [Extra headers](#extra-headers) + - Authorization Mechanism - Netdata webhook integration supports 3 different authorization mechanisms. For mode details check [Authorization mechanism](#authorization-mechanism): + - Mutual TLS (recommended) - default authentication mechanism used if no other method is selected. + - Basic - the client sends a request with an Authorization header that includes a base64-encoded string in the format **username:password**. These will settings will be required inputs. + - Bearer - the client sends a request with an Authorization header that includes a **bearer token**. This setting will be a required input. + +#### Webhook service + +A webhook integration allows your application to receive real-time alerts from Netdata by sending HTTP requests to a specified URL. In this document, we'll go over the steps to set up a generic webhook integration, including adding headers, and implementing different types of authorization mechanisms. + +##### Netdata webhook integration + +A webhook integration is a way for one service to notify another service about events that occur within it. This is done by sending an HTTP POST request to a specified URL (known as the "webhook URL") when an event occurs. + +Netdata webhook integration service will send alert notifications to the destination service as soon as they are detected. + +The notification content sent to the destination service will be a JSON object having these properties: + +| field | type | description | +| :-- | :-- | :-- | +| message | string | A summary message of the alert. | +| alarm | string | The alarm the notification is about. | +| info | string | Additional info related with the alert. | +| chart | string | The chart associated with the alert. | +| context | string | The chart context. | +| space | string | The space where the node that raised the alert is assigned. | +| family | string | Context family. | +| class | string | Classification of the alert, e.g. "Error". | +| severity | string | Alert severity, can be one of "warning", "critical" or "clear". | +| date | string | Date of the alert in ISO8601 format. | +| duration | string | Duration the alert has been raised. | +| critical_count | integer | umber of critical alerts currently existing on the same node. | +| warning_count | integer | Number of warning alerts currently existing on the same node. | +| alarm_url | string | Netdata Cloud URL for this alarm. | + +##### Extra headers + +When setting up a webhook integration, the user can specify a set of headers to be included in the HTTP requests sent to the webhook URL. + +By default, the following headers will be sent in the HTTP request + +| **Header** | **Value** | +|:-------------------------------:|-----------------------------| +| Content-Type | application/json | + +##### Authorization mechanism + +Netdata webhook integration supports 3 different authorization mechanisms: + +1. Mutual TLS (recommended) + +In mutual Transport Layer Security (mTLS) authorization, the client and the server authenticate each other using X.509 certificates. This ensures that the client is connecting to the intended server, and that the server is only accepting connections from authorized clients. + +To take advantage of mutual TLS, you can configure your server to verify Netdata's client certificate. To do that you need to download our [CA certificate file](http://localhost) and configure your server to use it as the + +This is the default authentication mechanism used if no other method is selected. + +2. Basic + +In basic authorization, the client sends a request with an Authorization header that includes a base64-encoded string in the format username:password. The server then uses this information to authenticate the client. If this authentication method is selected, the user can set the user and password that will be used when connecting to the destination service. + +3. Bearer + +In bearer token authorization, the client sends a request with an Authorization header that includes a bearer token. The server then uses this token to authenticate the client. Bearer tokens are typically generated by an authentication service, and are passed to the client after a successful authentication. If this method is selected, the user can set the token to be used for connecting to the destination service. + +#### Related topics + +- [Alerts Configuration](https://github.com/netdata/netdata/blob/master/health/README.md) +- [Alert Notifications](https://github.com/netdata/netdata/blob/master/docs/cloud/alerts-notifications/notifications.mdx) +- [Manage notification methods](https://github.com/netdata/netdata/blob/master/docs/cloud/alerts-notifications/manage-notification-methods.md) diff --git a/docs/cloud/alerts-notifications/manage-notification-methods.md b/docs/cloud/alerts-notifications/manage-notification-methods.md new file mode 100644 index 000000000..115aaae73 --- /dev/null +++ b/docs/cloud/alerts-notifications/manage-notification-methods.md @@ -0,0 +1,88 @@ +<!-- +title: "Manage notification methods" +sidebar_label: "Manage notification methods" +custom_edit_url: "https://github.com/netdata/netdata/blob/master/docs/cloud/alerts-notifications/manage-notification-methods.md" +learn_status: "Published" +learn_topic_type: "Tasks" +learn_rel_path: "Operations/Alerts" +learn_docs_purpose: "Instructions on how to manage notification methods" +--> + +From the Cloud interface, you can manage your space's notification settings as well as allow users to personalize their notifications setting + +### Manage space notification settings + +#### Prerequisites + +To manage space notification settings, you will need the following: + +- A Netdata Cloud account +- Access to the space as an **administrator** + +#### Available actions per notification methods based on service level + +| **Action** | **Personal service level** | **System service level** | +| :- | :-: | :-: | +| Enable / Disable | X | X | +| Edit | | X | | +| Delete | X | X | +| Add multiple configurations for same method | | X | + +Notes: +* For Netadata provided ones you can't delete the existing notification method configuration. +* Enable, Edit and Add actions over specific notification methods will only be allowed if your plan has access to those ([service classification](https://github.com/netdata/netdata/blob/master/docs/cloud/alerts-notifications/notifications.mdx#service-classification)) + +#### Steps + +1. Click on the **Space settings** cog (located above your profile icon) +1. Click on the **Notification** tab +1. You will be presented with a table of the configured notification methods for the space. You will be able to: + 1. **Add a new** notification method configuration. + - Choose the service from the list of the available ones, you'll may see a list of unavailable options if your plan doesn't allow some of them (you will see on the + card the plan level that allows a specific service) + - You can optionally provide a name for the configuration so you can easily refer to what it + - Define filtering criteria. To which Rooms will this apply? What notifications I want to receive? (All Alerts and unreachable, All Alerts, Critical only) + - Depending on the service different inputs will be present, please note that there are mandatory and optional inputs + - If you doubts on how to configure the service you can find a link at the top of the modal that takes you to the specific documentation page to help you + 1. **Edit an existing** notification method configuration. Personal level ones can't be edited here, see [Manage user notification settings](#manage-user-notification-settings). You will be able to change: + - The name provided for it + - Filtering criteria + - Service specific inputs + 1. **Enable/Disable** a given notification method configuration. + - Use the toggle to enable or disable the notification method configuration + 1. **Delete an existing** notification method configuartion. Netdata provided ones can't be deleted, e.g. Email + - Use the trash icon to delete your configuration + +### Manage user notification settings + +#### Prerequisites + +To manage user specific notification settings, you will need the following: + +- A Cloud account +- Have access to, at least, a space + +Note: If an administrator has disabled a Personal [service level](https://github.com/netdata/netdata/blob/master/docs/cloud/alerts-notifications/notifications.md#service-level) notification method this will override any user specific setting. + +#### Steps + +1. Click on the **User notification settings** shortcut on top of the help button +1. You are presented with: + - The Personal [service level](https://github.com/netdata/netdata/blob/master/docs/cloud/alerts-notifications/notifications.md#service-level) notification methods you can manage + - The list spaces and rooms inside those where you have access to + - If you're an administrator, Manager or Troubleshooter you'll also see the Rooms from a space you don't have access to on **All Rooms** tab and you can activate notifications for them by joining the room +1. On this modal you will be able to: + 1. **Enable/Disable** the notification method for you, this applies accross all spaces and rooms + - Use the the toggle enable or disable the notification method + 1. **Define what notifications you want** to per space/room: All Alerts and unreachable, All Alerts, Critical only or No notifications + 1. **Activate notifications** for a room you aren't a member of + - From the **All Rooms** tab click on the Join button for the room(s) you want + +#### Related topics + +- [Alert Notifications](https://github.com/netdata/netdata/blob/master/docs/cloud/alerts-notifications/notifications.mdx) +- [Alerts Configuration](https://github.com/netdata/netdata/blob/master/health/README.md) +- [Add webhook notification configuration](https://github.com/netdata/netdata/blob/master/docs/cloud/alerts-notifications/add-webhook-notification-configuration.md) +- [Add Discord notification configuration](https://github.com/netdata/netdata/blob/master/docs/cloud/alerts-notifications/add-discord-notification-configuration.md) +- [Add Slack notification configuration](https://github.com/netdata/netdata/blob/master/docs/cloud/alerts-notifications/add-slack-notification-configuration.md) +- [Add PagerDuty notification configuration](https://github.com/netdata/netdata/blob/master/docs/cloud/alerts-notifications/add-pagerduty-notification-configuration.md) diff --git a/docs/cloud/alerts-notifications/notifications.mdx b/docs/cloud/alerts-notifications/notifications.mdx new file mode 100644 index 000000000..e594606eb --- /dev/null +++ b/docs/cloud/alerts-notifications/notifications.mdx @@ -0,0 +1,155 @@ +--- +title: "Alert notifications" +description: >- + "Configure Netdata Cloud to send notifications to your team whenever any node on your infrastructure + triggers a pre-configured or custom alert threshold." +custom_edit_url: "https://github.com/netdata/netdata/blob/master/docs/cloud/alerts-notifications/notifications.mdx" +sidebar_label: "Alert notifications" +learn_status: "Published" +learn_topic_type: "Tasks" +learn_rel_path: "Operations/Alerts" +--- + +import Callout from '@site/src/components/Callout' + +Netdata Cloud can send centralized alert notifications to your team whenever a node enters a warning, critical, or +unreachable state. By enabling notifications, you ensure no alert, on any node in your infrastructure, goes unnoticed by +you or your team. + +Having this information centralized helps you: +* Have a clear view of the health across your infrastructure, [seeing all a alerts in one place](https://github.com/netdata/netdata/blob/master/docs/cloud/alerts-notifications/view-active-alerts.mdx) +* Easily [setup your alert notification process](https://github.com/netdata/netdata/blob/master/docs/cloud/alerts-notifications/manage-notification-methods.md): +methods to use and where to use them, filtering rules, etc. +* Quickly troubleshoot using [Metric Correlations](https://github.com/netdata/netdata/blob/master/docs/cloud/insights/metrics-correlations.md) +or [Anomaly Advisor](https://github.com/netdata/netdata/blob/master/docs/cloud/insights/anomaly-advisor.mdx) + +If a node is getting disconnected often or has many alerts, we protect you and your team from alert fatigue by sending +you a flood protection notification. Getting one of these notifications is a good signal of health or performance issues +on that node. + +Admins must enable alert notifications for their [Space(s)](https://github.com/netdata/netdata/blob/master/docs/cloud/alerts-notifications/manage-notification-methods.md#manage-space-notification-settings). All users in a +Space can then personalize their notifications settings from within their [account +menu](https://github.com/netdata/netdata/blob/master/docs/cloud/alerts-notifications/#manage-user-notification-settings). + +<Callout type="notice"> + +Centralized alert notifications from Netdata Cloud is a independent process from [notifications from +Netdata](https://github.com/netdata/netdata/blob/master/docs/monitor/enable-notifications.md). You can enable one or the other, or both, based on your needs. However, +the alerts you see in Netdata Cloud are based on those streamed from your Netdata-monitoring nodes. If you want to tweak +or add new alert that you see in Netdata Cloud, and receive via centralized alert notifications, you must +[configure](https://github.com/netdata/netdata/blob/master/docs/monitor/configure-alarms.md) each node's alert watchdog. + +</Callout> + +### Alert notifications + +Netdata Cloud can send centralized alert notifications to your team whenever a node enters a warning, critical, or unreachable state. By enabling notifications, +you ensure no alert, on any node in your infrastructure, goes unnoticed by you or your team. + +If a node is getting disconnected often or has many alerts, we protect you and your team from alert fatigue by sending you a flood protection notification. +Getting one of these notifications is a good signal of health or performance issues on that node. + +Alert notifications can be delivered through different methods, these can go from an Email sent from Netdata to the use of a 3rd party tool like PagerDuty. + +Notification methods are classified on two main attributes: +* Service level: Personal or System +* Service classification: Community or Business + +Only administrators are able to manage the space's alert notification settings. +All users in a Space can personalize their notifications settings, for Personal service level notification methods, from within their profile menu. + +> ⚠️ Netdata Cloud supports different notification methods and their availability will depend on the plan you are at. +> For more details check [Service classification](#service-classification) or [netdata.cloud/pricing](https://www.netdata.cloud/pricing). + +#### Service level + +##### Personal + +The notifications methods classified as **Personal** are what we consider generic, meaning that these can't have specific rules for them set by the administrators. + +These notifications are sent to the destination of the channel which is a user-specific attribute, e.g. user's e-mail, and the users are the ones that will then be able to +manage what specific configurations they want for the Space / Room(s) and the desired Notification level, they can achieve this from their User Profile page under +**Notifications**. + +One example of such a notification method is the E-mail. + +##### System + +For **System** notification methods, the destination of the channel will be a target that usually isn't specific to a single user, e.g. slack channel. + +These notification methods allow for fine-grain rule settings to be done by administrators and more than one configuration can exist for them since. You can specify +different targets depending on Rooms or Notification level settings. + +Some examples of such notification methods are: Webhook, PagerDuty, slack. + +#### Service classification + +##### Community + +Notification methods classified as Community can be used by everyone independent on the plan your space is at. +These are: Email and discord + +##### Pro + +Notification methods classified as Pro are only available for **Pro** and **Business** plans +These are: webhook + +##### Business + +Notification methods classified as Business are only available for **Business** plans +These are: PagerDuty, slack + +## Flood protection + +If a node has too many state changes like firing too many alerts or going from reachable to unreachable, Netdata Cloud +enables flood protection. As long as a node is in flood protection mode, Netdata Cloud does not send notifications about +this node. Even with flood protection active, it is possible to access the node directly, either via Netdata Cloud or +the local Agent dashboard at `http://NODE:19999`. + +## Anatomy of an alert notification + +Email alarm notifications show the following information: + +- The Space's name +- The node's name +- Alarm status: critical, warning, cleared +- Previous alarm status +- Time at which the alarm triggered +- Chart context that triggered the alarm +- Name and information about the triggered alarm +- Alarm value +- Total number of warning and critical alerts on that node +- Threshold for triggering the given alarm state +- Calculation or database lookups that Netdata uses to compute the value +- Source of the alarm, including which file you can edit to configure this alarm on an individual node + +Email notifications also feature a **Go to Node** button, which takes you directly to the offending chart for that node +within Cloud's embedded dashboards. + +Here's an example email notification for the `ram_available` chart, which is in a critical state: + +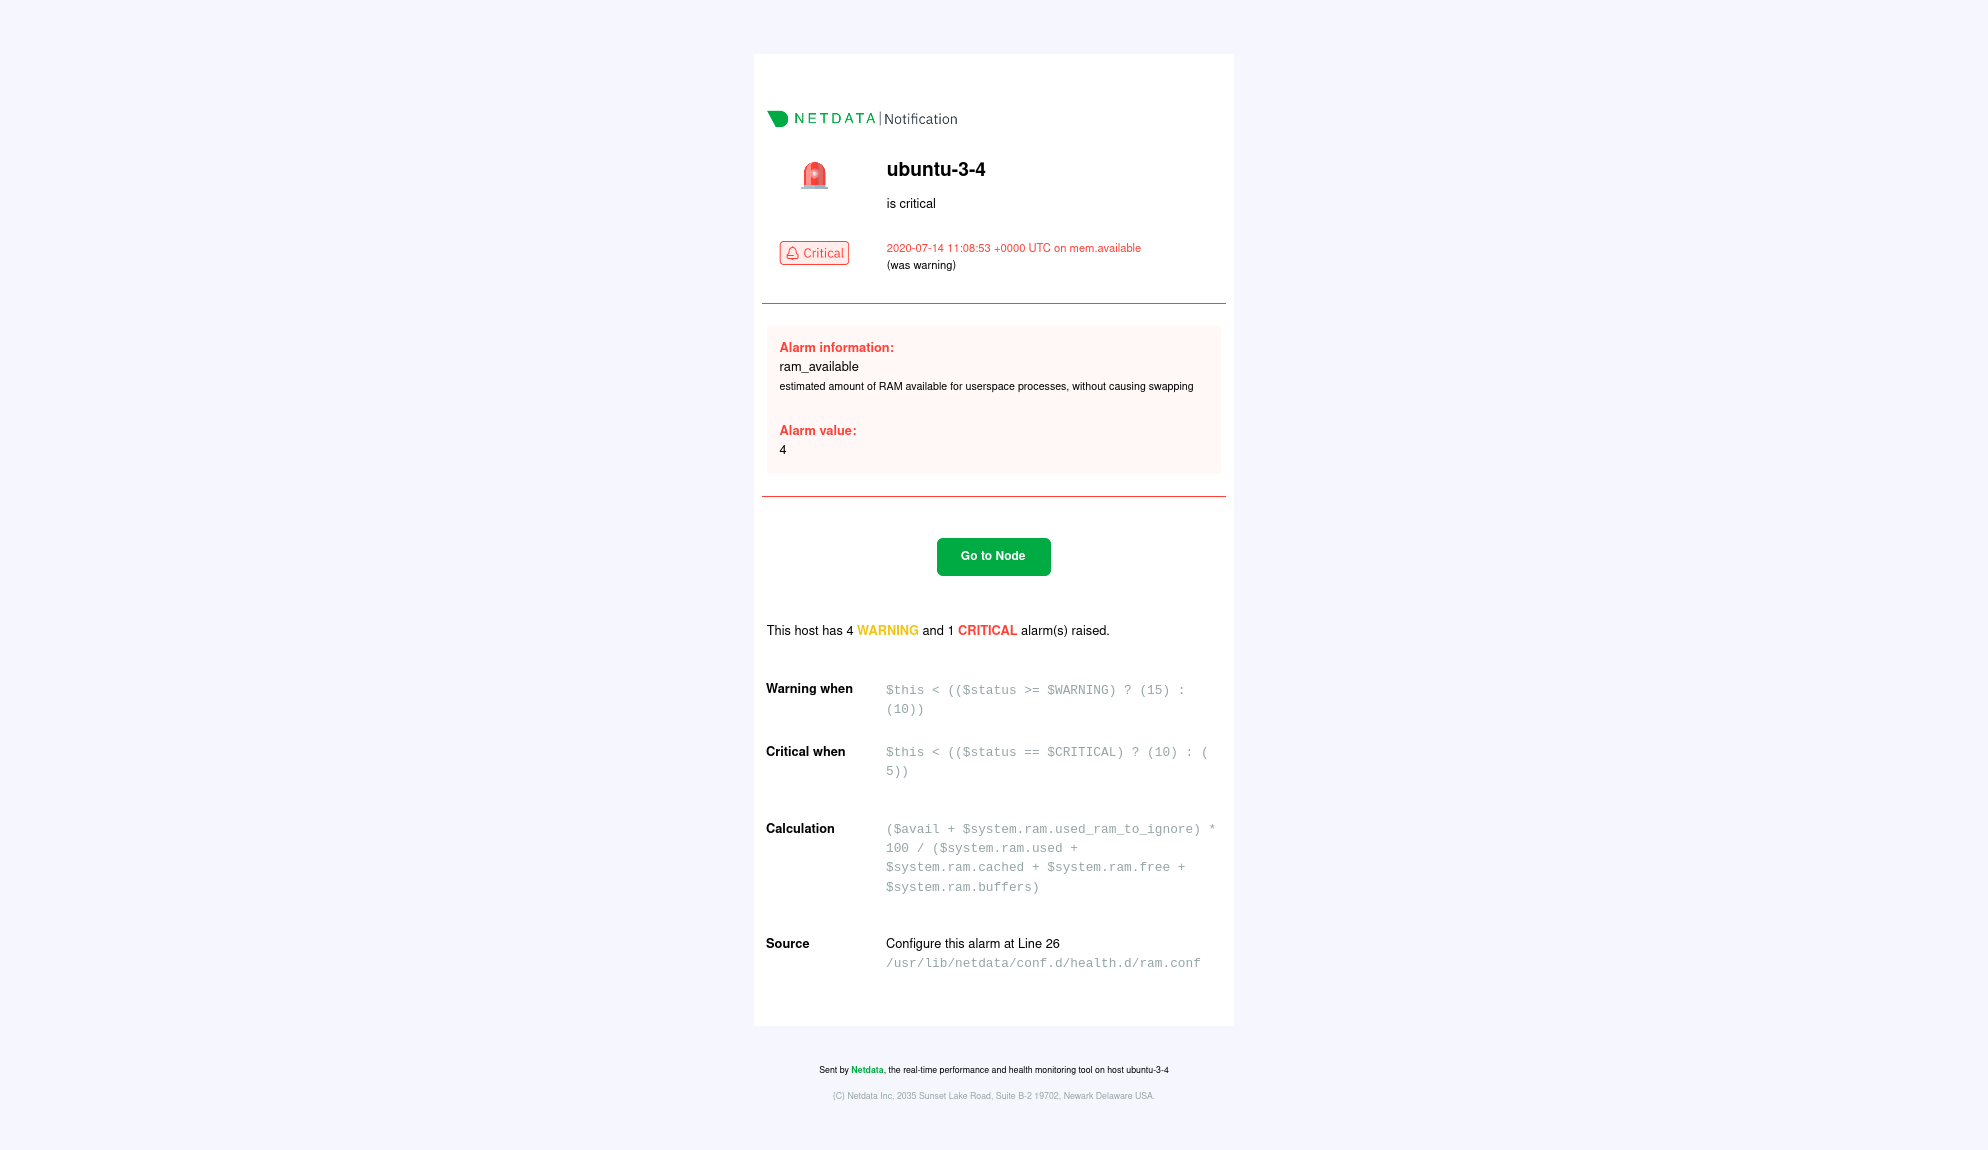 + +## What's next? + +Netdata Cloud's alarm notifications feature leverages the alarms configuration on each node in your infrastructure. If +you'd like to tweak any of these alarms, or even add new ones based on your needs, read our [health +quickstart](https://github.com/netdata/netdata/blob/master/docs/monitor/configure-alarms.md). + +You can also [view active alarms](https://github.com/netdata/netdata/blob/master/docs/cloud/alerts-notifications/view-active-alerts.mdx) in Netdata Cloud for an instant +visualization of the health of your infrastructure. + +### Related Topics + +#### **Related Concepts** +- [Rooms](https://github.com/netdata/netdata/blob/master/docs/cloud/war-rooms.md) +- [Metric Correlations](https://github.com/netdata/netdata/blob/master/docs/cloud/insights/metrics-correlations.md) +- [Anomaly Advisor](https://github.com/netdata/netdata/blob/master/docs/cloud/insights/anomaly-advisor.mdx) + +#### Related Tasks +- [View Active alarms](https://github.com/netdata/netdata/blob/master/docs/cloud/alerts-notifications/view-active-alerts.mdx) +- [Manage notification methods](https://github.com/netdata/netdata/blob/master/docs/cloud/alerts-notifications/manage-notification-methods.md) +- [Add webhook notification configuration](https://github.com/netdata/netdata/blob/master/docs/cloud/alerts-notifications/add-webhook-notification-configuration.md) +- [Add Discord notification configuration](https://github.com/netdata/netdata/blob/master/docs/cloud/alerts-notifications/add-discord-notification-configuration.md) +- [Add Slack notification configuration](https://github.com/netdata/netdata/blob/master/docs/cloud/alerts-notifications/add-slack-notification-configuration.md) +- [Add PagerDuty notification configuration](https://github.com/netdata/netdata/blob/master/docs/cloud/alerts-notifications/add-pagerduty-notification-configuration.md) diff --git a/docs/cloud/alerts-notifications/smartboard.mdx b/docs/cloud/alerts-notifications/smartboard.mdx new file mode 100644 index 000000000..b9240ce49 --- /dev/null +++ b/docs/cloud/alerts-notifications/smartboard.mdx @@ -0,0 +1,46 @@ +--- +title: "Alerts smartboard" +description: "" +type: "reference" +custom_edit_url: "https://github.com/netdata/netdata/blob/master/docs/cloud/alerts-notifications/smartboard.mdx" +sidebar_label: "Alerts smartboard" +learn_status: "Published" +learn_topic_type: "Tasks" +learn_rel_path: "Operations/Alerts" +--- + +The Alerts view gives you a high level of availability and performance information for every node you're +monitoring with Netdata Cloud. We expect it to become the "home base" for many Netdata Cloud users who want to instantly +understand what's going on with their infrastructure and exactly where issues might be. + +The Alerts view is available entirely for free to all users and for any number of nodes. + +## Alerts table and filtering + +The Alerts view shows all active alerts in your War Room, including the alert's name, the most recent value, a +timestamp of when it became active, and the relevant node. + +You can use the checkboxes in the filter pane on the right side of the screen to filter the alerts displayed in the +table +by Status, Class, Type & Componenet, Role, Operating System, or Node. + +Click on any of the alert names to see the alert. + +## View active alerts + +In the `Active` subtab, you can see exactly how many **critical** and **warning** alerts are active across your nodes. + +## View configured alerts + +You can view all the configured alerts on all the agents that belong to a War Room in the `Alert Configurations` subtab. +From within the Alerts view, you can click the `Alert Configurations` subtab to see a high level view of the states of +the alerts on the nodes within this War Room and drill down to the node level where each alert is configured with their +latest status. + + + + + + + + diff --git a/docs/cloud/alerts-notifications/view-active-alerts.mdx b/docs/cloud/alerts-notifications/view-active-alerts.mdx new file mode 100644 index 000000000..1035b682e --- /dev/null +++ b/docs/cloud/alerts-notifications/view-active-alerts.mdx @@ -0,0 +1,76 @@ +--- +title: "View active alerts" +description: >- + "Track the health of your infrastructure in one place by taking advantage of the powerful health monitoring + watchdog running on every node." +type: "how-to" +custom_edit_url: "https://github.com/netdata/netdata/blob/master/docs/cloud/alerts-notifications/view-active-alerts.mdx" +sidebar_label: "View active alerts" +learn_status: "Published" +learn_topic_type: "Tasks" +learn_rel_path: "Operations/Alerts" +--- + +Netdata Cloud receives information about active alerts on individual nodes in your infrastructure and updates the +interface based on those status changes. + +Netdata Cloud doesn't produce alerts itself but rather receives and aggregates alerts from each node in your +infrastructure based on their configuration. Every node comes with hundreds of pre-configured alerts that have been +tested by Netdata's community of DevOps engineers and SREs, but you may want to customize existing alerts or create new +ones entirely. + +Read our doc on [health alerts](https://github.com/netdata/netdata/blob/master/docs/monitor/configure-alarms.md) to +learn how to tweak existing alerts or create new +health entities based on the specific needs of your infrastructure. By taking charge of alert configuration, you'll +ensure Netdata Cloud always delivers the most relevant alerts about the well-being of your nodes. + +## View all active alerts + +The [Alerts Smartboard](https://github.com/netdata/netdata/blob/master/docs/cloud/alerts-notifications/smartboard.mdx) +provides a high-level interface for viewing the number of critical or warning alerts and where they are in your +infrastructure. + +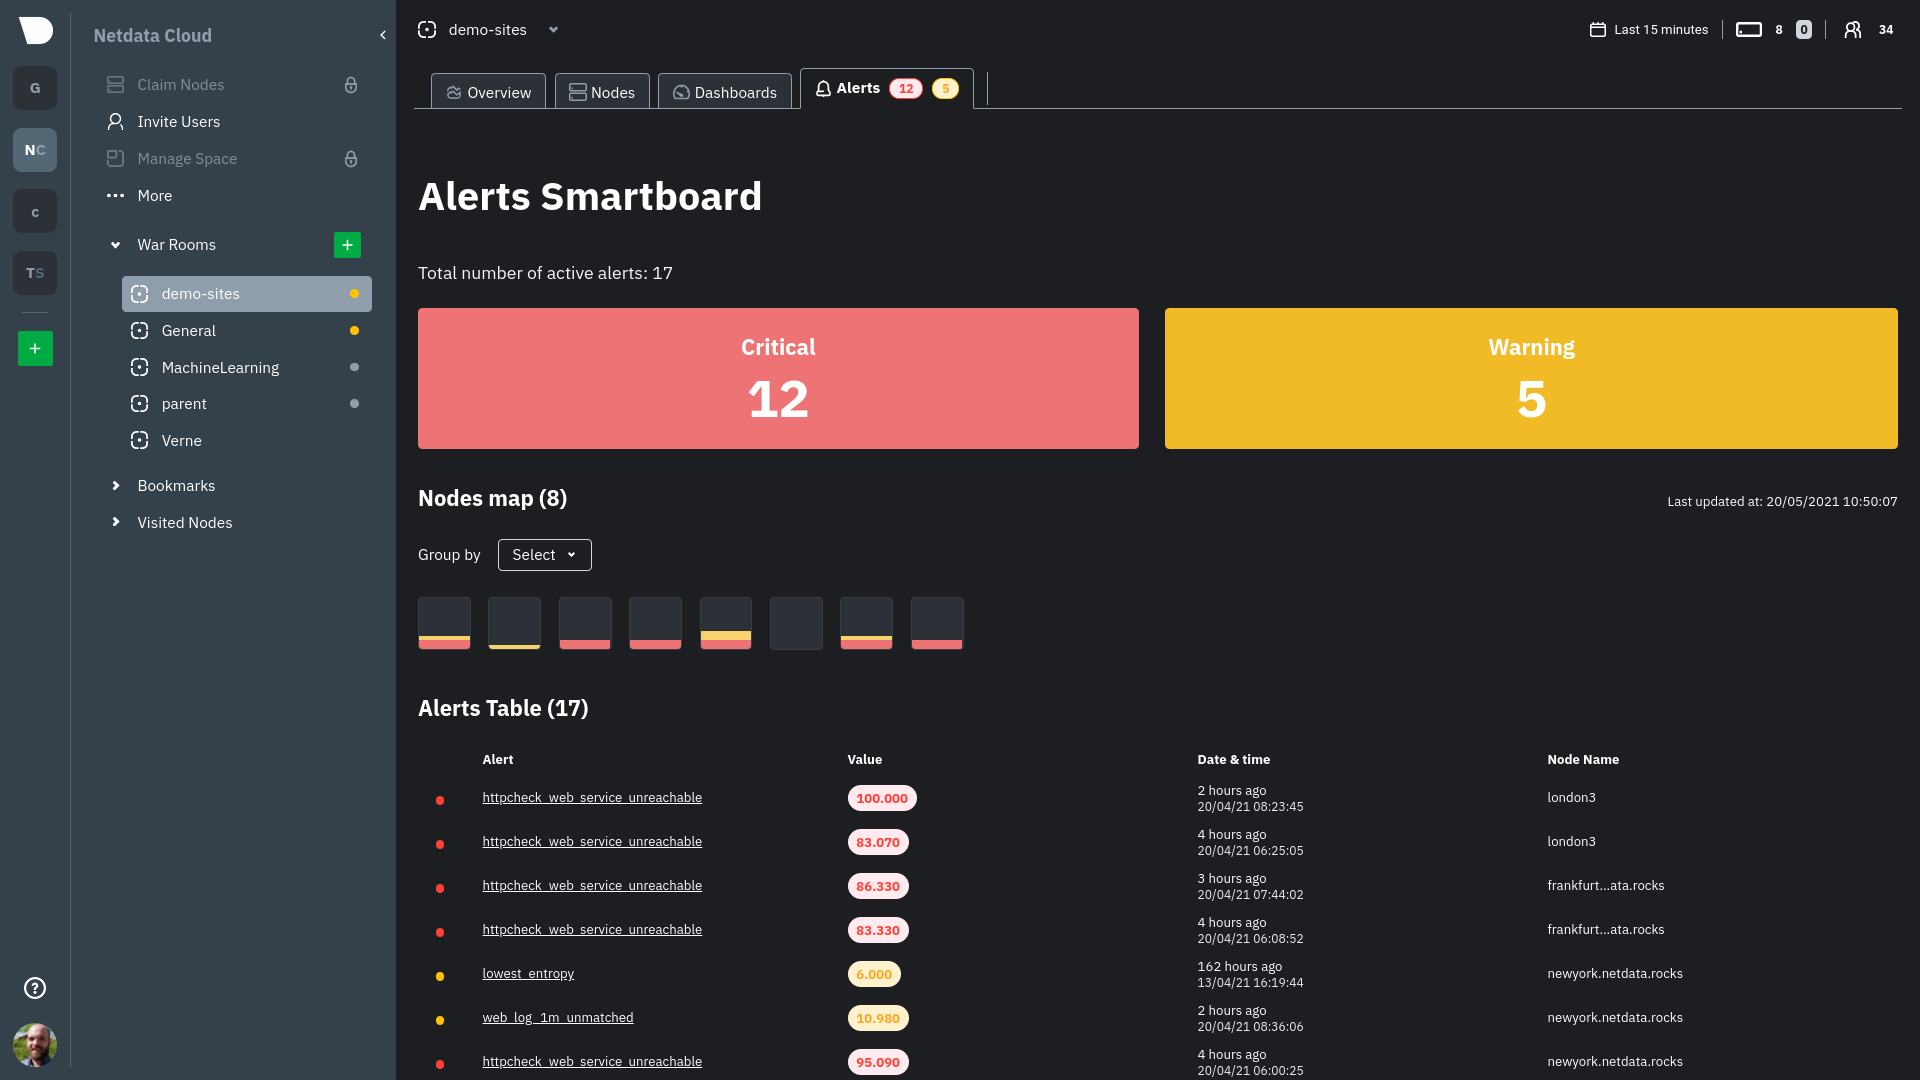 + +Click on the **Alerts** tab in any War Room to open the Smartboard. Alternatively, click on any of the alert badges in +the [Nodes view](https://github.com/netdata/netdata/blob/master/docs/cloud/visualize/nodes.md) to jump to the Alerts +Smartboard. + +From here, filter active alerts using the **critical** or **warning** boxes, or hover over a box in +the [nodes map](https://github.com/netdata/netdata/blob/master/docs/cloud/alerts-notifications/smartboard.mdx#nodes-map) +to see a +popup node-specific alert information. + +## View alerts in context with charts + +If you click on any of the alerts, either in a nodes map popup or the alerts table, Netdata Cloud navigates you to the +single-node dashboard and scrolls to the relevant chart. Netdata Cloud also draws a highlight and the value at the +moment your node triggered this alert. + +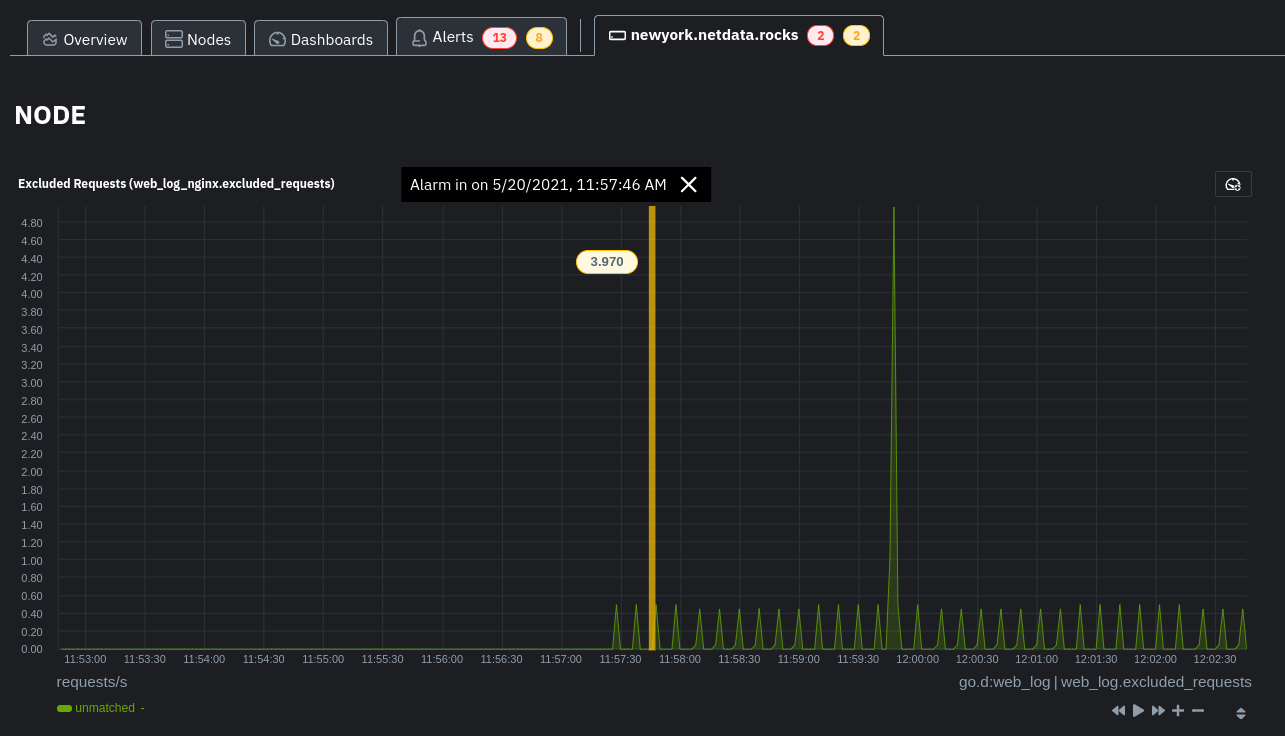 + +You can +then [select this area](https://github.com/netdata/netdata/blob/master/docs/dashboard/interact-charts.mdx#select) +with `Alt/⌘ + mouse selection` to highlight the alerted timeframe while you explore other charts for root cause +analysis. + +Or, select the area and +run [Metric Correlations](https://github.com/netdata/netdata/blob/master/docs/cloud/insights/metric-correlations.md) to +filter the single-node +dashboard to only those charts most likely to be connected to the alert. + +## What's next? + +Learn more about the features of the Smartboard in +its [reference](https://github.com/netdata/netdata/blob/master/docs/cloud/alerts-notifications/smartboard.mdx) +doc. To stay notified of active alerts, +enable [centralized alert notifications](https://github.com/netdata/netdata/blob/master/docs/cloud/alerts-notifications/notifications.mdx) +from Netdata Cloud. + +If you're through with setting up alerts, it might be time +to [invite your team](https://github.com/netdata/netdata/blob/master/docs/cloud/manage/invite-your-team.md). + +Check out our recommendations on organizing and +using [Spaces](https://github.com/netdata/netdata/blob/master/docs/cloud/spaces.md) and +[War Rooms](https://github.com/netdata/netdata/blob/master/docs/cloud/war-rooms.md) to streamline your processes once +you find an alert in Netdata Cloud. diff --git a/docs/cloud/beta-architecture/new-architecture.md b/docs/cloud/beta-architecture/new-architecture.md new file mode 100644 index 000000000..c51f08fb1 --- /dev/null +++ b/docs/cloud/beta-architecture/new-architecture.md @@ -0,0 +1,36 @@ +--- +title: "Test the New Cloud Architecture" +description: "Would you like to be the first to try our new architecture and provide feedback? If so, this guide will help you sign up for our beta testing group." +custom_edit_url: "https://github.com/netdata/netdata/blob/master/docs/cloud/beta-architecture/new-architecture.md" +--- + +To enhance the stability and reliability of Netdata Cloud, we did extensive work on our backend, and we would like to give you the opportunity +to be among the first users to try these changes to our Cloud architecture and provide feedback. + +The backend architecture changes should offer notable improvements in reliability and stability in Netdata Cloud, +but more importantly, it allows us to develop new features and enhanced functionality, including features and enhancements +that you have specifically requested. Features that will be developed on the new architecture include: + +- Parent/Child Cloud relationships +- Alert logs +- Alert management +- Much more + +## Enabling the new architecture + +To enable the new architecture, first ensure that you have installed the latest Netdata version following +[our guide](https://github.com/netdata/netdata/blob/master/docs/get-started.mdx). Then, you or your administrator will need to retrieve the Space IDs +within Netdata Cloud by clicking `Manage Space` in the left pane, selecting the `Space` tab, and copying the value in the `Space Id` field. +You can then send an email to [beta@Netdata.cloud](mailto:beta@netdata.cloud) requesting to be included in our beta testers, and include +in the body of the email a list of Space IDs for any space you would like to have whitelisted for the update. If you received an email +invitation, you can also just reply to the invitation with your Space IDs in the body of the reply. + +Feel free to send the Space IDs for multiple spaces to test the new infrastructure on each of them. + +## Reporting issues + +After you are set up with the new architecture changes, we ask that you report any issues you encounter in our +[designated Discord channel](https://discord.gg/dGzdemHwHh). This feedback +will help us ensure the highest performance of the new architecture and expedite the development and release +of the aforementioned enhancements and features. + diff --git a/docs/cloud/cheatsheet.mdx b/docs/cloud/cheatsheet.mdx new file mode 100644 index 000000000..c1d0a471d --- /dev/null +++ b/docs/cloud/cheatsheet.mdx @@ -0,0 +1,231 @@ +--- +title: "'Netdata management and configuration cheatsheet'" +description: "'Connecting an Agent to the Cloud allows a Netdata Agent, running on a distributed node, to securely connect to Netdata Cloud via the encrypted Agent-Cloud link (ACLK).'" +image: "/cheatsheet/cheatsheet-meta.png" +sidebar_label: "Cheatsheet" +custom_edit_url: "https://github.com/netdata/netdata/blob/master/docs/cloud/cheatsheet.mdx" +part_of_learn: "True" +learn_status: "Published" +learn_topic_type: "Getting started" +learn_rel_path: "Getting started" +--- + +import { + OneLineInstallWget, + OneLineInstallCurl, +} from '@site/src/components/OneLineInstall/'; + +Use our management & configuration cheatsheet to simplify your interactions with Netdata, including configuration, +using charts, managing the daemon, and more. + +## Install Netdata + +#### Install Netdata + +<OneLineInstallWget /> + +Or, if you have cURL but not wget (such as on macOS): + +<OneLineInstallCurl /> + +#### Claim a node to Netdata Cloud + +To do so, sign in to Netdata Cloud, click the `Claim Nodes` button, choose the `War Rooms` to add nodes to, then click `Copy` to copy the full script to your clipboard. Paste that into your node’s terminal and run it. + +## Metrics collection & retention + +You can tweak your settings in the netdata.conf file. +📄 [Find your netdata.conf file](https://learn.netdata.cloud/guides/step-by-step/step-04#find-your-netdataconf-file) + +Open a new terminal and navigate to the netdata.conf file. Use the edit-config script to make changes: `sudo ./edit-config netdata.conf` + +The most popular settings to change are: + +#### Increase metrics retention (4GiB) + +``` +sudo ./edit-config netdata.conf +``` + +``` +[global] + dbengine multihost disk space = 4096 +``` + +#### Reduce the collection frequency (every 5 seconds) + +``` +sudo ./edit-config netdata.conf +``` + +``` +[global] + update every = 5 +``` + +#### Enable/disable plugins (groups of collectors) + +``` +sudo ./edit-config netdata.conf +``` + +``` +[plugins] + go.d = yes # enabled + node.d = no # disabled +``` + +#### Enable/disable specific collectors + +``` +sudo ./edit-config go.d.conf +``` + +> `Or python.d.conf, node.d.conf, edbpf.conf, and so on`. + +``` +modules: + activemq: no # disabled + bind: no # disabled + cockroachdb: yes # enabled +``` + +#### Edit a collector's config (example) + +``` +$ sudo ./edit-config go.d/mysql.conf +$ sudo ./edit-config ebpf.conf +$ sudo ./edit-config python.d/anomalies.conf +``` + +## Configuration + +#### The Netdata config directory: `/etc/netdata` + +> If you don't have such a directory: +> 📄 [Find your netdata.conf file](https://learn.netdata.cloud/guides/step-by-step/step-04#find-your-netdataconf-file) +> The cheatsheet assumes you’re running all commands from within the Netdata config directory! + +#### Edit Netdata's main config file: `$ sudo ./edit-config netdata.conf` + +#### Edit Netdata's other config files (examples): + +- `$ sudo ./edit-config apps_groups.conf` +- `$ sudo ./edit-config ebpf.conf` +- `$ sudo ./edit-config health.d/load.conf` +- `$ sudo ./edit-config go.d/prometheus.conf` + +#### View the running Netdata configuration: `http://NODE:19999/netdata.conf` + +> Replace `NODE` with the IP address or hostname of your node. Often `localhost`. + +## Alarms & notifications + +#### Add a new alarm + +``` +sudo touch health.d/example-alarm.conf +sudo ./edit-config health.d/example-alarm.conf +``` + +#### Configure a specific alarm + +``` +sudo ./edit-config health.d/example-alarm.conf +``` + +#### Silence a specific alarm + +``` +sudo ./edit-config health.d/example-alarm.conf + to: silent +``` + +#### Disable alarms and notifications + +``` +[health] + enabled = no +``` + +> After any change, reload the Netdata health configuration + +``` +netdatacli reload-health +``` + +or if that command doesn't work on your installation, use: + +``` +killall -USR2 netdata +``` + +## Manage the daemon + +| Intent | Action | +| :-------------------------- | --------------------------------------------------------------------: | +| Start Netdata | `$ sudo systemctl start netdata` | +| Stop Netdata | `$ sudo systemctl stop netdata` | +| Restart Netdata | `$ sudo systemctl restart netdata` | +| Reload health configuration | `$ sudo netdatacli reload-health` <br></br> `$ killall -USR2 netdata` | +| View error logs | `less /var/log/netdata/error.log` | + +## See metrics and dashboards + +#### Netdata Cloud: `https://app.netdata.cloud` + +#### Local dashboard: `https://NODE:19999` + +> Replace `NODE` with the IP address or hostname of your node. Often `localhost`. + +#### Access the Netdata API: `http://NODE:19999/api/v1/info` + +## Interact with charts + +| Intent | Action | +| -------------------------------------- | ------------------------------------------------------------------------------------------------------------------------------------------------------------------------------------------------------------------------------------------------------------------------------: | +| Stop a chart from updating | `click` | +| Zoom | **Cloud** <br/> use the `zoom in` and `zoom out` buttons on any chart (upper right corner) <br/><br/> **Agent**<br/>`SHIFT` or `ALT` + `mouse scrollwheel` <br/> `SHIFT` or `ALT` + `two-finger pinch` (touchscreen) <br/> `SHIFT` or `ALT` + `two-finger scroll` (touchscreen) | +| Zoom to a specific timeframe | **Cloud**<br/>use the `select and zoom` button on any chart and then do a `mouse selection` <br/><br/> **Agent**<br/>`SHIFT` + `mouse selection` | +| Pan forward or back in time | `click` & `drag` <br/> `touch` & `drag` (touchpad/touchscreen) | +| Select a certain timeframe | `ALT` + `mouse selection` <br/> WIP need to evaluate this `command?` + `mouse selection` (macOS) | +| Reset to default auto refreshing state | `double click` | + +## Dashboards + +#### Disable the local dashboard + +Use the `edit-config` script to edit the `netdata.conf` file. + +``` +[web] +mode = none +``` + +#### Change the port Netdata listens to (port 39999) + +``` +[web] +default port = 39999 +``` + +#### Opt out from anonymous statistics + +``` +sudo touch .opt-out-from-anonymous-statistics +``` + +## Understanding the dashboard + +**Charts**: A visualization displaying one or more collected/calculated metrics in a time series. Charts are generated +by collectors. + +**Dimensions**: Any value shown on a chart, which can be raw or calculated values, such as percentages, averages, +minimums, maximums, and more. + +**Families**: One instance of a monitored hardware or software resource that needs to be monitored and displayed +separately from similar instances. Example, disks named +**sda**, **sdb**, **sdc**, and so on. + +**Contexts**: A grouping of charts based on the types of metrics collected and visualized. +**disk.io**, **disk.ops**, and **disk.backlog** are all contexts. diff --git a/docs/cloud/cloud.mdx b/docs/cloud/cloud.mdx new file mode 100644 index 000000000..764ba0e89 --- /dev/null +++ b/docs/cloud/cloud.mdx @@ -0,0 +1,74 @@ +--- +title: "Netdata Cloud docs" +description: "Netdata Cloud is real-time visibility for entire infrastructures. View key metrics, insightful charts, and active alarms from all your nodes." +custom_edit_url: "https://github.com/netdata/learn/blob/master/docs/cloud.mdx" +--- + +import { Grid, Box, BoxList, BoxListItem } from '@site/src/components/Grid/' +import { RiExternalLinkLine } from 'react-icons/ri' + +This is the documentation for the Netdata Cloud web application, which works in parallel with the open-source Netdata +monitoring agent to help you monitor your entire infrastructure [for free <RiExternalLinkLine className="inline-block" +/>](https://netdata.cloud/pricing/) in real time and troubleshoot problems that threaten the health of your +nodes before they occur. + +Netdata Cloud requires the open-source [Netdata](/docs/) monitoring agent, which is the basis for the metrics, +visualizations, and alarms that you'll find in Netdata Cloud. Every time you view a node in Netdata Cloud, its metrics +and metadata are streamed to Netdata Cloud, then proxied to your browser, with an infrastructure that ensures [data +privacy <RiExternalLinkLine className="inline-block" />](https://netdata.cloud/privacy/). + + +Read [_What is Netdata?_](https://github.com/netdata/netdata/blob/master/docs/overview/what-is-netdata.md) for details about how Netdata and Netdata Cloud work together +and how they're different from other monitoring solutions, or the +[FAQ <RiExternalLinkLine className="inline-block" />](https://community.netdata.cloud/tags/c/general/29/faq) for answers to common questions. + +<Grid columns="1" className="mb-16"> + <Box + to="/docs/cloud/get-started" + title="Get started with Netdata Cloud" + cta="Go" + image={true}> + Ready to get real-time visibility into your entire infrastructure? This guide will help you get started on Netdata Cloud, from signing in for a free account to connecting your nodes. + </Box> +</Grid> + +## Learn about Netdata Cloud's features + +<Grid columns="2"> + <Box + title="Spaces and War Rooms"> + <BoxList> + <BoxListItem to="/docs/cloud/spaces" title="Spaces" /> + <BoxListItem to="/docs/cloud/war-rooms" title="War Rooms" /> + </BoxList> + </Box> + <Box + title="Dashboards"> + <BoxList> + <BoxListItem to="/docs/cloud/visualize/overview" title="Overview" /> + <BoxListItem to="/docs/cloud/visualize/nodes" title="Nodes view" /> + <BoxListItem to="/docs/cloud/visualize/kubernetes" title="Kubernetes" /> + <BoxListItem to="/docs/cloud/visualize/dashboards" title="Create new dashboards" /> + </BoxList> + </Box> + <Box + title="Alerts and notifications"> + <BoxList> + <BoxListItem to="/docs/cloud/alerts-notifications/view-active-alerts" title="View active alerts" /> + <BoxListItem to="/docs/cloud/alerts-notifications/smartboard" title="Alerts Smartboard" /> + <BoxListItem to="/docs/cloud/alerts-notifications/notifications" title="Alert notifications" /> + </BoxList> + </Box> + <Box + title="Troubleshooting with Netdata Cloud"> + <BoxListItem to="/docs/cloud/insights/metric-correlations" title="Metric Correlations" /> + </Box> + <Box + title="Management and settings"> + <BoxList> + <BoxListItem to="/docs/cloud/manage/sign-in" title="Sign in with email, Google, or GitHub" /> + <BoxListItem to="/docs/cloud/manage/invite-your-team" title="Invite your team" /> + <BoxListItem to="/docs/cloud/manage/themes" title="Choose your Netdata Cloud theme" /> + </BoxList> + </Box> +</Grid> diff --git a/docs/cloud/data-privacy.mdx b/docs/cloud/data-privacy.mdx new file mode 100644 index 000000000..c99cff946 --- /dev/null +++ b/docs/cloud/data-privacy.mdx @@ -0,0 +1,39 @@ +--- +title: "Data privacy in the Netdata Cloud" +description: "Keeping your data safe and secure is our priority.Netdata never stores your personal information in the Netdata Cloud." +custom_edit_url: "https://github.com/netdata/netdata/blob/master/docs/cloud/data-privacy.mdx" +sidebar_label: "Data privacy in the Netdata Cloud" +learn_status: "Published" +learn_topic_type: "Concepts" +learn_rel_path: "Concepts" +--- + +[Data privacy](https://netdata.cloud/privacy/) is very important to us. We firmly believe that your data belongs to +you. This is why **we don't store any metric data in Netdata Cloud**. + +Your local installations of the Netdata Agent form the basis for the Netdata Cloud. All the data that you see in the web browser when using Netdata Cloud, is actually streamed directly from the Netdata Agent to the Netdata Cloud dashboard. +The data passes through our systems, but it isn't stored. You can learn more about [the Agent's security design](https://github.com/netdata/netdata/blob/master/docs/netdata-security.md) in the Agent documentation. + +However, to be able to offer the stunning visualizations and advanced functionality of Netdata Cloud, it does store a limited number of _metadata_. + +## Metadata + +Let's look at the metadata Netdata Cloud stores using the publicly available demo server `frankfurt.my-netdata.io`: + +- The email address you used to sign up/or sign in +- For each node connected to your Spaces in Netdata Cloud: + - Hostname (as it appears in Netdata Cloud) + - Information shown in `/api/v1/info`. For example: [https://frankfurt.my-netdata.io/api/v1/info](https://frankfurt.my-netdata.io/api/v1/info). + - The chart metadata shown in `/api/v1/charts`. For example: [https://frankfurt.my-netdata.io/api/v1/info](https://frankfurt.my-netdata.io/api/v1/info). + - Alarm configurations shown in `/api/v1/alarms?all`. For example: [https://frankfurt.my-netdata.io/api/v1/alarms?all](https://frankfurt.my-netdata.io/api/v1/alarms?all). + - Active alarms shown in `/api/v1/alarms`. For example: [https://frankfurt.my-netdata.io/api/v1/alarms](https://frankfurt.my-netdata.io/api/v1/alarms). + +How we use them: + +- The data is stored in our production database on AWS. Some of it is also used in Google BigQuery, our data lake, for analytics purposes. These analytics are crucial for our product development process. +- Email is used to identify users in regards to product use and to enrich our tools with product use, such as our CRM. +- This data is only available to Netdata and never to a 3rd party. + +## Delete all personal data + +To remove all personal info we have about you (email and activities) you need to delete your cloud account by logging into https://app.netdata.cloud and accessing your profile, at the bottom left of your screen. diff --git a/docs/cloud/get-started.mdx b/docs/cloud/get-started.mdx new file mode 100644 index 000000000..b9f83af8f --- /dev/null +++ b/docs/cloud/get-started.mdx @@ -0,0 +1,133 @@ +--- +title: "Get started with Netdata Cloud" +description: >- + "Ready to get real-time visibility into your entire infrastructure? This guide will help you get started on + Netdata Cloud." +image: "/img/seo/cloud_get-started.png" +custom_edit_url: "https://github.com/netdata/learn/blob/master/docs/cloud/get-started.mdx" +--- + +import Link from '@docusaurus/Link' +import Callout from '@site/src/components/Callout' + +Ready to get real-time visibility into your entire infrastructure with Netdata Cloud? This guide will walk you through +the onboarding process, such as setting up your Space and War Room and connecting your first nodes. + +## Before you start + +Before you get started with Netdata Cloud, you should have the open-source Netdata monitoring agent installed. See our +[installation guide](https://github.com/netdata/netdata/blob/master/docs/get-started.mdx) for details. + +If you already have the Netdata agent running on your node(s), make sure to update it to v1.32 or higher. Read the +[updating documentation](https://github.com/netdata/netdata/blob/master/packaging/installer/UPDATE.md) for information +on how to update based on the method you used to install Netdata on that node. + +## Begin the onboarding process + +Get started by signing in to Netdata. Read +the [sign in](https://github.com/netdata/netdata/blob/master/docs/cloud/manage/sign-in.mdx) doc for details on the +authentication methods we use. + +<Link to="https://app.netdata.cloud" className="group"> + <button className="relative text-text bg-gray-200 px-4 py-2 rounded"> + <span className="z-10 relative font-semibold group-hover:text-gray-100">Sign in to Netdata</span> + <div className="opacity-0 group-hover:opacity-100 transition absolute z-0 inset-0 bg-gradient-to-r from-green to-green-lighter rounded"></div> + </button> +</Link> + +Once signed in with your preferred method, a +General [War Room](https://github.com/netdata/netdata/blob/master/docs/cloud/war-rooms.md) and +a [Space](https://github.com/netdata/netdata/blob/master/docs/cloud/spaces.md) +named for your login email are automatically created. You can configure more Spaces and War Rooms to help you you +organize your team +and the many systems that make up your infrastructure. For example, you can put product and infrastructure SRE teams in +separate +Spaces, and then use War Rooms to group nodes by their service (`nginx`), purpose (`webservers`), or physical +location (`IAD`). + +Don't worry! You can always add more Spaces and War Rooms later if you decide to reorganize how you use Netdata Cloud. + +## Connect your nodes + +From within the created War Rooms, Netdata Cloud prompts you +to [connect](https://github.com/netdata/netdata/blob/master/claim/README.md) your nodes to Netdata Cloud. Non-admin +users can users can select from existing nodes already connected to the space or select an admin from a provided list to +connect node. +You can connect any node running Netdata, whether it's a physical or virtual machine, a Docker container, IoT device, +and more. + +The connection process securely connects any node to Netdata Cloud using +the [Agent-Cloud link](https://github.com/netdata/netdata/blob/master/aclk/README.md). By +connecting a node, you prove you have write and administrative access to that node. Connecting to Cloud also prevents +any third party +from connecting a node that you control. Keep in mind: + +- _You can only connect any given node in a single Space_. You can, however, add that connected node to multiple War + Rooms + within that one Space. +- You must repeat the connection process on every node you want to add to Netdata Cloud. + +<Callout type="notice"> + +**Netdata Cloud ensures your data privacy by not storing metrics data from your nodes**. See our statement on Netdata +Cloud [data privacy](https://github.com/netdata/netdata/blob/master/aclk/README.md/#data-privacy) for details on the +data that's streamed from your nodes and the +[connecting to cloud](https://github.com/netdata/netdata/blob/master/claim/README.md) doc for details about why we +implemented the connection process and the encryption methods we use to secure your data in transit. + +</Callout> + +To connect a node, select which War Rooms you want to add this node to with the dropdown, then copy the script given by +Netdata Cloud into your node's terminal. + +Hit **Enter**. The script should return `Agent was successfully claimed.`. If the claiming script returns errors, or if +you don't see the node in your Space after 60 seconds, see +the [troubleshooting information](https://github.com/netdata/netdata/blob/master/claim/README.md#troubleshooting). + +Repeat this process with every node you want to add to Netdata Cloud during onboarding. You can also add more nodes once +you've finished onboarding by clicking the **Connect Nodes** button in +the [Space management area](https://github.com/netdata/netdata/blob/master/docs/cloud/spaces.md/#manage-spaces). + +### Alternatives and other operating systems + +**Docker**: You can execute the claiming script Netdata running as a Docker container, or attach the claiming script +when creating the container for the first time, such as when you're spinning up ephemeral containers. See +the [connect an agent running in Docker](https://github.com/netdata/netdata/blob/master/claim/README.md#connect-an-agent-running-in-docker) +documentation for details. + +**Without root privileges**: If you want to connect an agent without using root privileges, see our [connect +documentation](https://github.com/netdata/netdata/blob/master/claim/README.md#connect-an-agent-without-root-privileges). + +**With a proxy**: If your node uses a proxy to connect to the internet, you need to configure the node's proxy settings. +See +our [connect through a proxy](https://github.com/netdata/netdata/blob/master/claim/README.md#connect-through-a-proxy) +doc for details. + +## Add bookmarks to essential resources + +When an anomaly or outage strikes, your team needs to access other essential resources quickly. You can use Netdata +Cloud's bookmarks to put these tools in one accessible place. Bookmarks are shared between all War Rooms in a Space, so +any users in your Space will be able to see and use them. + +Bookmarks can link to both internal and external resources. You can bookmark your app's status page for quick updates +during an outage, a messaging system on your organization's intranet, or other tools your team uses to respond to +changes in your infrastructure. + +To add a new bookmark, click on the **Add bookmark** link. In the panel, name the bookmark, include its URL, and write a +short description for your team's reference. + +## What's next? + +You finish onboarding +by [inviting members of your team](https://github.com/netdata/netdata/blob/master/docs/cloud/manage/invite-your-team.md) +to your Space. You +can also invite them later. At this point, you're ready to use Cloud. + +Next, learn about the organization and interfaces +behind [Spaces](https://github.com/netdata/netdata/blob/master/docs/cloud/spaces.md) +and [War +Rooms](https://github.com/netdata/netdata/blob/master/docs/cloud/war-rooms.md). + +If you're ready to explore, check out how to use +the [Overview dashboard](https://github.com/netdata/netdata/blob/master/docs/cloud/visualize/overview.md), which is the +default view for each new War Room you create. diff --git a/docs/cloud/insights/anomaly-advisor.mdx b/docs/cloud/insights/anomaly-advisor.mdx new file mode 100644 index 000000000..98a28d92c --- /dev/null +++ b/docs/cloud/insights/anomaly-advisor.mdx @@ -0,0 +1,86 @@ +--- +title: "Anomaly Advisor" +description: "Quickly find anomalous metrics anywhere in your infrastructure." +custom_edit_url: "https://github.com/netdata/netdata/blob/master/docs/cloud/insights/anomaly-advisor.mdx" +sidebar_label: "Anomaly Advisor" +learn_status: "Published" +learn_topic_type: "Tasks" +learn_rel_path: "Operations" +--- + +import ReactPlayer from 'react-player' + +The Anomaly Advisor feature lets you quickly surface potentially anomalous metrics and charts related to a particular highlight window of +interest. + +<ReactPlayer playing true controls true url='https://user-images.githubusercontent.com/24860547/165943403-1acb9759-7446-4704-8955-c566d04ad7ab.mp4' /> + +## Getting Started + +If you are running a Netdata version higher than `v1.35.0-29-nightly` you will be able to use the Anomaly Advisor out of the box with zero configuration. If you are on an earlier Netdata version you will need to first enable ML on your nodes by following the steps below. + +To enable the Anomaly Advisor you must first enable ML on your nodes via a small config change in `netdata.conf`. Once the anomaly detection models have trained on the Agent (with default settings this takes a couple of hours until enough data has been seen to train the models) you will then be able to enable the Anomaly Advisor feature in Netdata Cloud. + +### Enable ML on Netdata Agent + +To enable ML on your Netdata Agent, you need to edit the `[ml]` section in your `netdata.conf` to look something like the following example. + +```bash +[ml] + enabled = yes +``` + +At a minimum you just need to set `enabled = yes` to enable ML with default params. More details about configuration can be found in the [Netdata Agent ML docs](https://learn.netdata.cloud/docs/agent/ml#configuration). + +**Note**: Follow [this guide](https://github.com/netdata/netdata/blob/master/docs/guides/step-by-step/step-04.md) if you are unfamiliar with making configuration changes in Netdata. + +When you have finished your configuration, restart Netdata with a command like `sudo systemctl restart netdata` for the config changes to take effect. You can find more info on restarting Netdata [here](https://github.com/netdata/netdata/blob/master/docs/configure/start-stop-restart.md). + +After a brief delay, you should see the number of `trained` dimensions start to increase on the "dimensions" chart of the "Anomaly Detection" menu on the Overview page. By default the `minimum num samples to train = 3600` parameter means at least 1 hour of data is required to train initial models, but you could set this to `900` if you want to train initial models quicker but on less data. Over time, they will retrain on up to `maximum num samples to train = 14400` (4 hours by default), but you could increase this is you wanted to train on more data. + +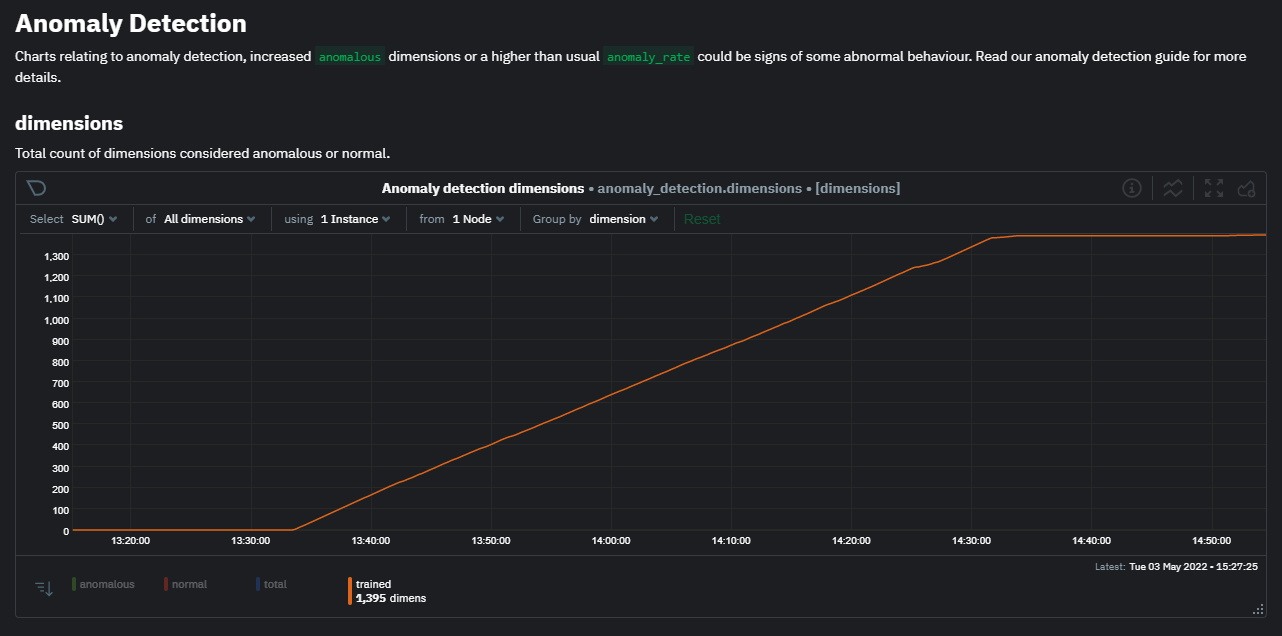 + +Once this line flattens out all configured metrics should have models trained and predicting anomaly scores each second, ready to be used by the new "anomalies" tab of the Anomaly Advisor. + +## Using Anomaly Advisor + +To use the Anomaly Advisor, go to the "anomalies" tab. Once you highlight a particular timeframe of interest, a selection of the most anomalous dimensions will appear below. + +The aim here is to surface the most anomalous metrics in the space or room for the highlighted window to try and cut down on the amount of manual searching required to get to the root cause of your issues. + +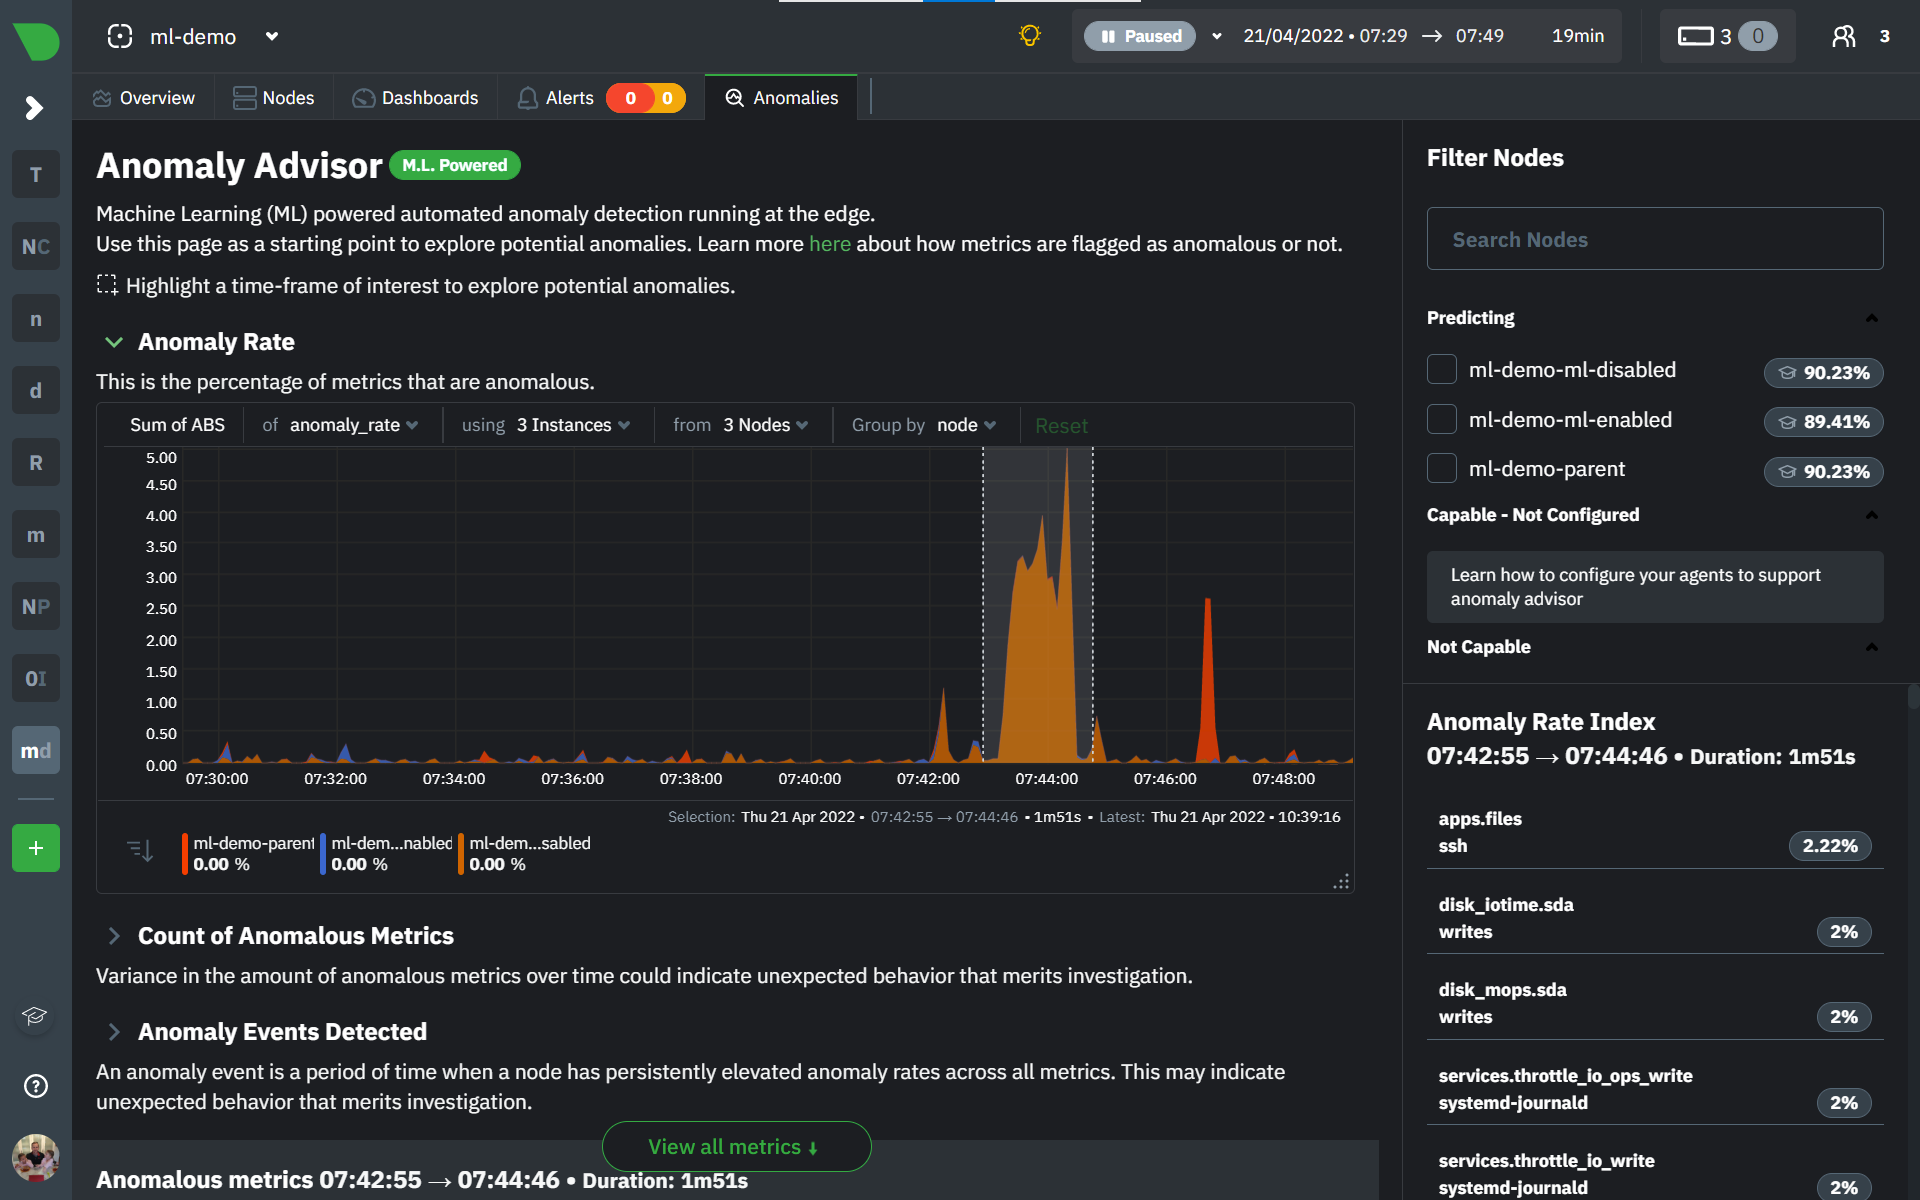 + +The "Anomaly Rate" chart shows the percentage of anomalous metrics over time per node. For example, in the following image, 3.21% of the metrics on the "ml-demo-ml-disabled" node were considered anomalous. This elevated anomaly rate could be a sign of something worth investigating. + +**Note**: in this example the anomaly rates for this node are actually being calculated on the parent it streams to, you can run ml on the Agent itselt or on a parent the Agent stream to. Read more about the various configuration options in the [Agent docs](https://github.com/netdata/netdata/blob/master/ml/README.md). + +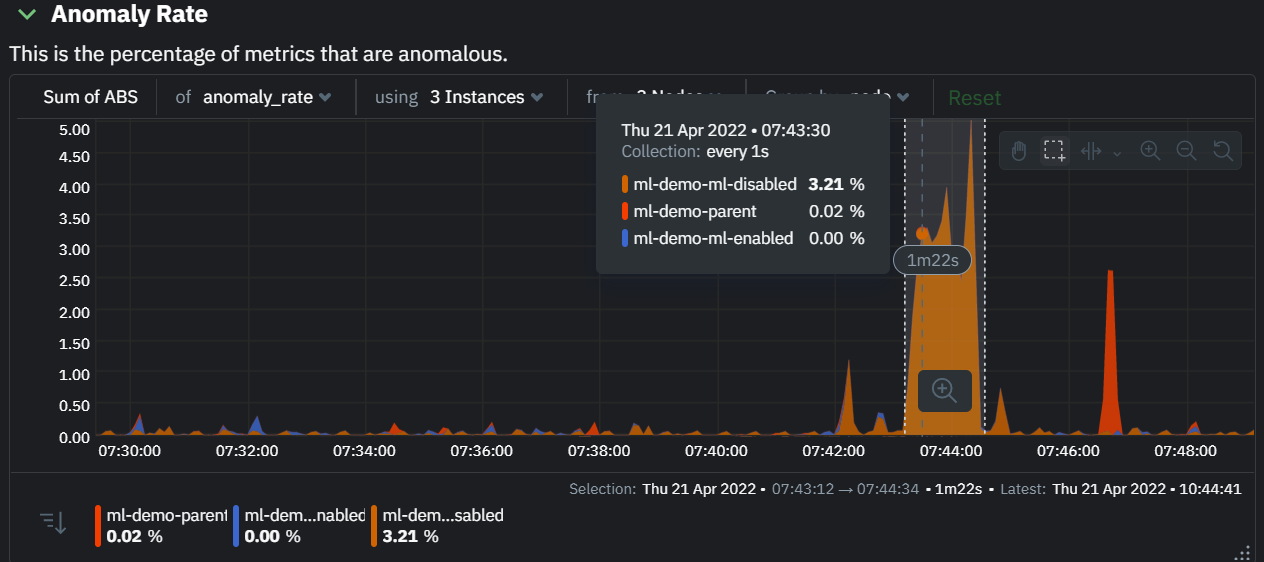 + +The "Count of Anomalous Metrics" chart (collapsed by default) shows raw counts of anomalous metrics per node so may often be similar to the anomaly rate chart, apart from where nodes may have different numbers of metrics. + +The "Anomaly Events Detected" chart (collapsed by default) shows if the anomaly rate per node was sufficiently elevated to trigger a node level anomaly. Anomaly events will appear slightly after the anomaly rate starts to increase in the timeline, this is because a significant number of metrics in the node need to be anomalous before an anomaly event is triggered. + +Once you have highlighted a window of interest, you should see an ordered list of anomaly rate sparklines in the "Anomalous metrics" section like below. + +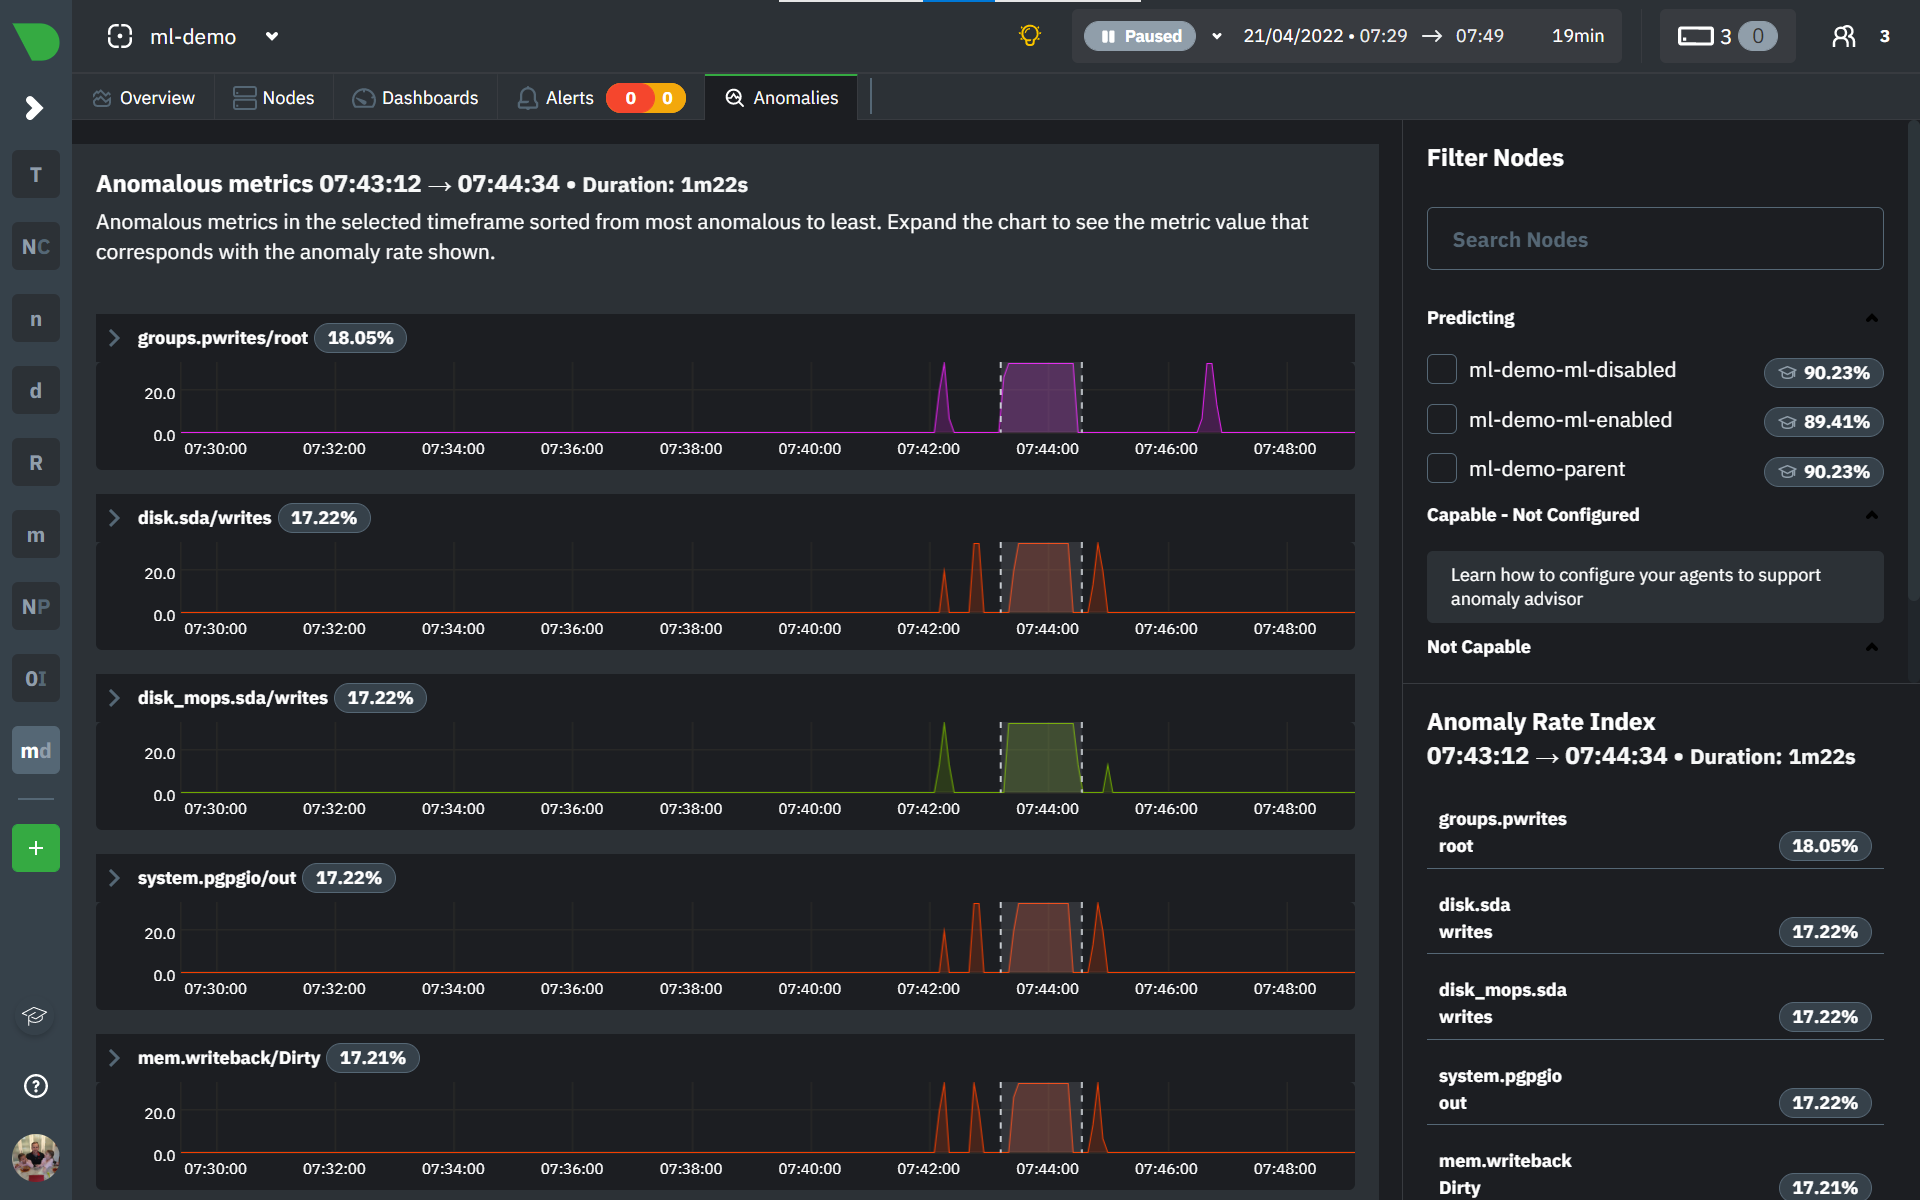 + +You can expand any sparkline chart to see the underlying raw data to see how it relates to the corresponding anomaly rate. + +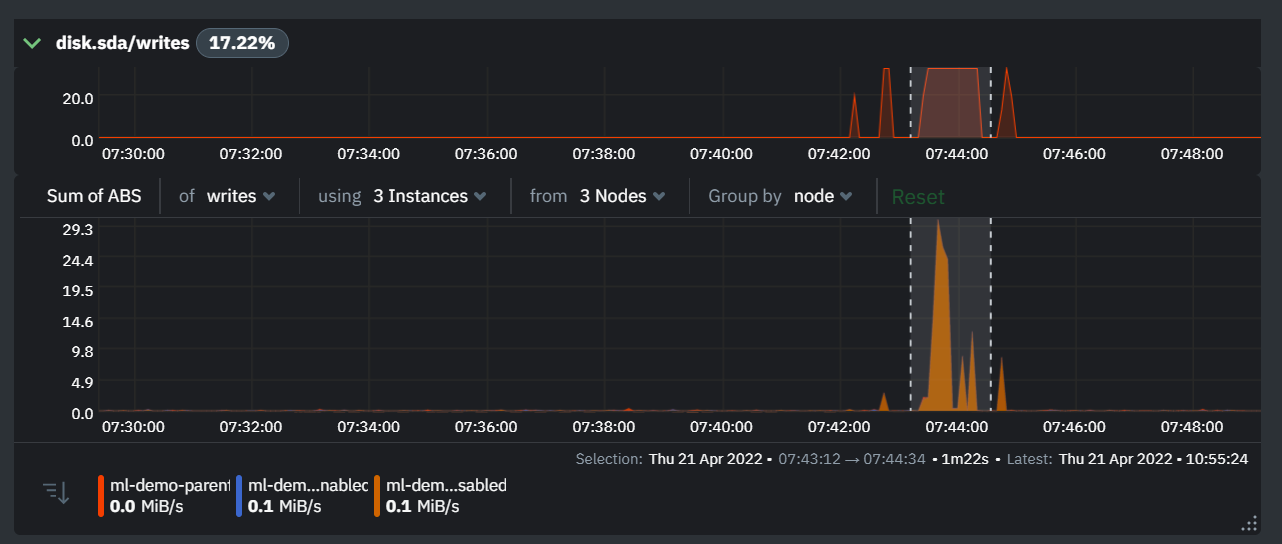 + +On the upper right hand side of the page you can select which nodes to filter on if you wish to do so. The ML training status of each node is also displayed. + +On the lower right hand side of the page an index of anomaly rates is displayed for the highlighted timeline of interest. The index is sorted from most anomalous metric (highest anomaly rate) to least (lowest anomaly rate). Clicking on an entry in the index will scroll the rest of the page to the corresponding anomaly rate sparkline for that metric. + +### Usage Tips + +- If you are interested in a subset of specific nodes then filtering to just those nodes before highlighting tends to give better results. This is because when you highlight a region, Netdata Cloud will ask the Agents for a ranking over all metrics so if you can filter this early to just the subset of nodes you are interested in, less 'averaging' will occur and so you might be a less noisy ranking. +- Ideally try and highlight close to a spike or window of interest so that the resulting ranking can narrow in more easily on the timeline you are interested in. + +You can read more detail on how anomaly detection in the Netdata Agent works in our [Agent docs](https://github.com/netdata/netdata/blob/master/ml/README.md). + +🚧 **Note**: This functionality is still **under active development** and considered experimental. We dogfood it internally and among early adopters within the Netdata community to build the feature. If you would like to get involved and help us with feedback, you can reach us through any of the following channels: +- Email us at analytics-ml-team@netdata.cloud +- Comment on the [beta launch post](https://community.netdata.cloud/t/anomaly-advisor-beta-launch/2717) in the Netdata community +- Join us in the [🤖-ml-powered-monitoring](https://discord.gg/4eRSEUpJnc) channel of the Netdata discord. +- Or open a discussion in GitHub if that's more your thing diff --git a/docs/cloud/insights/metric-correlations.md b/docs/cloud/insights/metric-correlations.md new file mode 100644 index 000000000..ce8835d34 --- /dev/null +++ b/docs/cloud/insights/metric-correlations.md @@ -0,0 +1,87 @@ +--- +title: "Metric Correlations" +description: "Quickly find metrics and charts closely related to a particular timeframe of interest anywhere in your infrastructure to discover the root cause faster." +custom_edit_url: "https://github.com/netdata/netdata/blob/master/docs/cloud/insights/metric-correlations.md" +sidebar_label: "Metric Correlations" +learn_status: "Published" +learn_topic_type: "Tasks" +learn_rel_path: "Operations" +--- + +The Metric Correlations (MC) feature lets you quickly find metrics and charts related to a particular window of interest that you want to explore further. By displaying the standard Netdata dashboard, filtered to show only charts that are relevant to the window of interest, you can get to the root cause sooner. + +Because Metric Correlations uses every available metric from your infrastructure, with as high as 1-second granularity, you get the most accurate insights using every possible metric. + +## Using Metric Correlations + +When viewing the overview or a single-node dashboard, the **Metric Correlations** button appears in the top right corner of the page. + +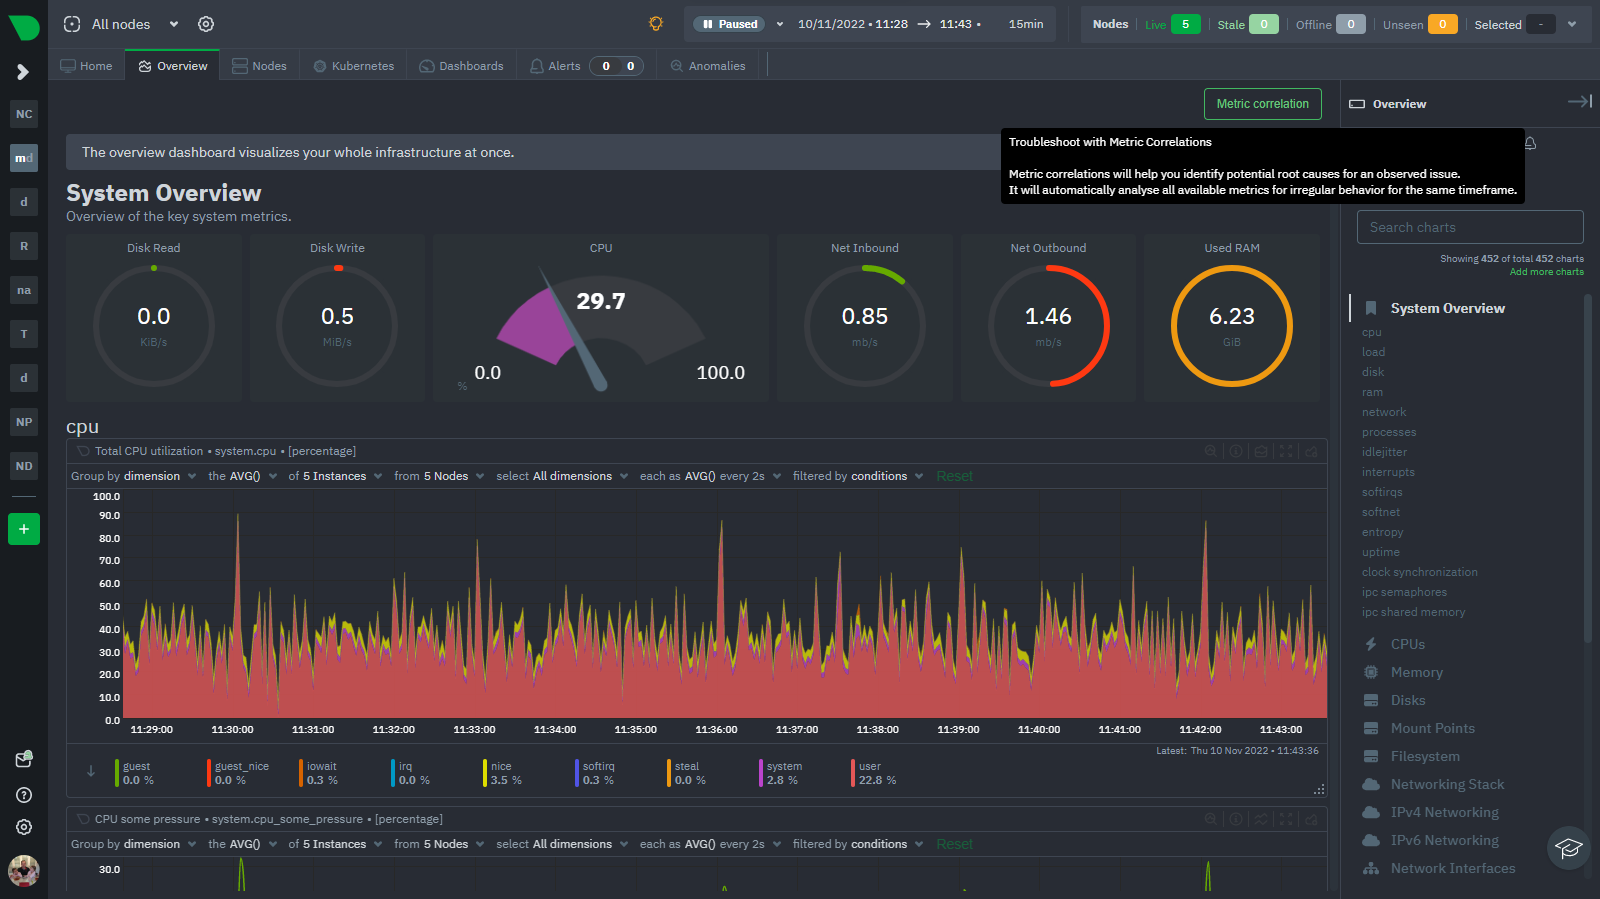 + +To start correlating metrics, click the **Metric Correlations** button, then hold the `Alt` key (or `⌘` on macOS) and click-and-drag a selection of metrics on a single chart. The selected timeframe needs to be at least 15 seconds for Metric Correlation to work. + +The menu then displays information about the selected area and reference baseline. Metric Correlations uses the reference baseline to discover which additional metrics are most closely connected to the selected metrics. The reference baseline is based upon the period immediately preceding the highlighted window and is the length of 4 times the highlighted window. This is to ensure that the reference baseline is always immediately before the highlighted window of interest and a bit longer so as to ensure it's a more representative short term baseline. + +Press the **Find Correlations** button to start up the correlations process, the button is only enabled when a valid timeframe is selected (at least 15 seconds). Once pressed, the process will score all available metrics on your nodes and return a filtered version of the Netdata dashboard. Now, you'll see only those metrics that have changed the most between a baseline window and the highlighted window you have selected. + +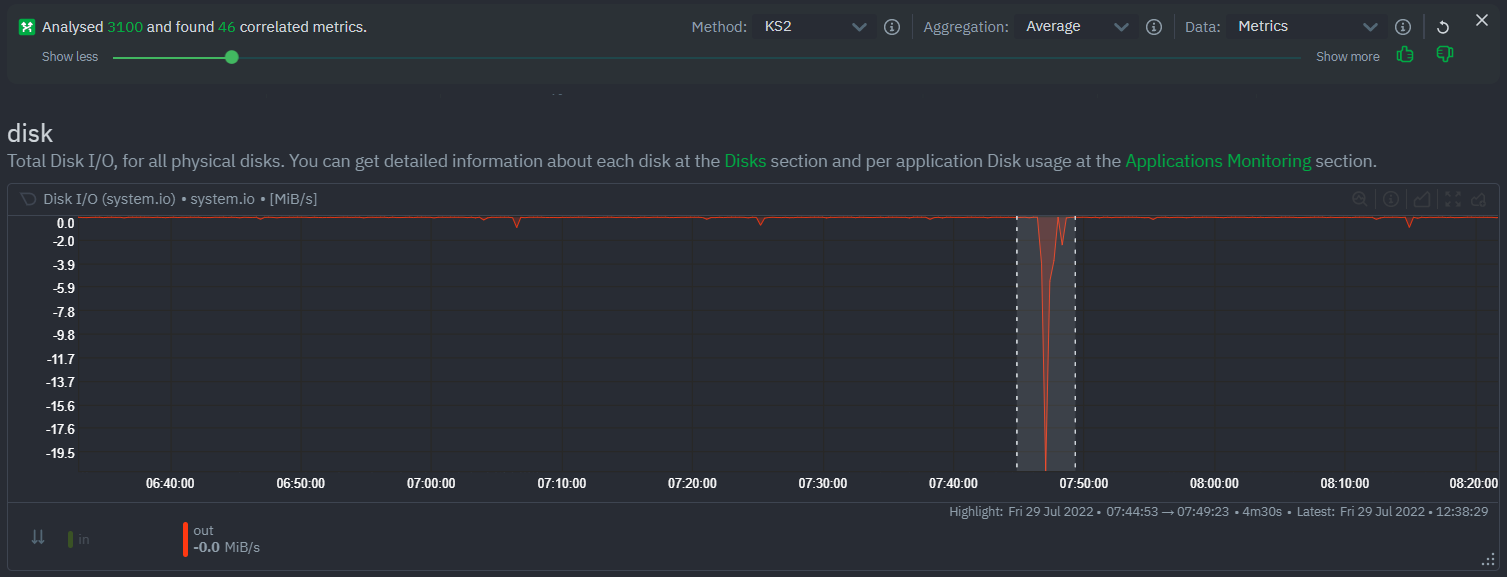 + +These charts are fully interactive, and whenever possible, will only show the _dimensions_ related to the timeline you selected. + +You can interact with all the scored metrics via the slider. Slide toward **show less** for more nuanced and significant results, or toward **show more** to "loosen" the threshold to explore other charts that may have changed too, but in a less significant manner. + +If you find something else interesting in the results, you can select another window and press **Find Correlations** again to kick the process off again. + +## Metric Correlations options + +MC enables a few input parameters that users can define to iteratively explore their data in different ways. As is usually the case in Machine Learning (ML), there is no "one size fits all" algorithm, what approach works best will typically depend on the type of data (which can be very different from one metric to the next) and even the nature of the event or incident you might be exploring in Netdata. + +So when you first run MC it will use the most sensible and general defaults. But you can also then vary any of the below options to explore further. + +### Method + +There are two algorithms available that aim to score metrics based on how much they have changed between the baseline and highlight windows. + +- `KS2` - A statistical test ([Two-sample Kolmogorov Smirnov](https://en.wikipedia.org/wiki/Kolmogorov%E2%80%93Smirnov_test#Two-sample_Kolmogorov%E2%80%93Smirnov_test)) comparing the distribution of the highlighted window to the baseline to try and quantify which metrics have most evidence of a significant change. You can explore our implementation [here](https://github.com/netdata/netdata/blob/d917f9831c0a1638ef4a56580f321eb6c9a88037/database/metric_correlations.c#L212). +- `Volume` - A heuristic measure based on the percentage change in averages between highlighted window and baseline, with various edge cases sensibly controlled for. You can explore our implementation [here](https://github.com/netdata/netdata/blob/d917f9831c0a1638ef4a56580f321eb6c9a88037/database/metric_correlations.c#L516). + +### Aggregation + +Behind the scenes, Netdata will aggregate the raw data as needed such that arbitrary window lengths can be selected for MC. By default, Netdata will just `Average` raw data when needed as part of pre-processing. However other aggregations like `Median`, `Min`, `Max`, `Stddev` are also possible. + +### Data + +Netdata is different from typical observability agents since, in addition to just collecting raw metric values, it will by default also assign an "[Anomaly Bit](/docs/agent/ml#anomaly-bit)" related to each collected metric each second. This bit will be 0 for "normal" and 1 for "anomalous". This means that each metric also natively has an "[Anomaly Rate](/docs/agent/ml#anomaly-rate)" associated with it and, as such, MC can be run against the raw metric values or their corresponding anomaly rates. + +**Note**: Read more [here](https://github.com/netdata/netdata/blob/master/docs/guides/monitor/anomaly-detection.md) to learn more about the native anomaly detection features within netdata. + +- `Metrics` - Run MC on the raw metric values. +- `Anomaly Rate` - Run MC on the corresponding anomaly rate for each metric. + +## Metric Correlations on the agent + +As of `v1.35.0` Netdata is able to run the Metric Correlations algorithm ([Two Sample Kolmogorov-Smirnov test](https://en.wikipedia.org/wiki/Kolmogorov%E2%80%93Smirnov_test#Two-sample_Kolmogorov%E2%80%93Smirnov_test)) on the agent itself. This avoids sending the underlying raw data to the original Netdata Cloud based microservice and so typically will be much much faster as no data moves around and the computation happens instead on the agent. + +When a Metric Correlations request is made to Netdata Cloud, if any node instances have MC enabled then the request will be routed to the node instance with the highest hops (e.g. a parent node if one is found or the node itself if not). If no node instances have MC enabled then the request will be routed to the original Netdata Cloud based service which will request input data from the nodes and run the computation within the Netdata Cloud backend. + +#### Enabling/Disabling Metric Correlations on the agent + +As of `v1.35.0-22-nightly` Metric Correlation has been enabled by default on all agents. After further optimizations to the implementation, the impact of running the metric correlations algorithm on the agent was less than the impact of preparing all the data to send to cloud for MC to run in the cloud, as such running MC on the agent is less impactful on local resources than running via cloud. + +Should you still want to, disabling nodes for Metric Correlation on the agent is a simple one line config change. Just set `enable metric correlations = no` in the `[global]` section of `netdata.conf` + +## Usage tips! + +- When running Metric Correlations from the [Overview tab](https://learn.netdata.cloud/docs/cloud/visualize/overview#overview) across multiple nodes, you might find better results if you iterate on the initial results by grouping by node to then filter to nodes of interest and run the Metric Correlations again. So a typical workflow in this case would be to: + - If unsure which nodes you are interested in then run MC on all nodes. + - Within the initial results returned group the most interesting chart by node to see if the changes are across all nodes or a subset of nodes. + - If you see a subset of nodes clearly jump out when you group by node, then filter for just those nodes of interest and run the MC again. This will result in less aggregation needing to be done by Netdata and so should help give clearer results as you interact with the slider. +- Use the `Volume` algorithm for metrics with a lot of gaps (e.g. request latency when there are few requests), otherwise stick with `KS2` + - By default, Netdata uses the `KS2` algorithm which is a tried and tested method for change detection in a lot of domains. The [Wikipedia](https://en.wikipedia.org/wiki/Kolmogorov%E2%80%93Smirnov_test) article gives a good overview of how this works. Basically, it is comparing, for each metric, its cumulative distribution in the highlight window with its cumulative distribution in the baseline window. The statistical test then seeks to quantify the extent to which we can say these two distributions look similar enough to be considered the same or not. The `Volume` algorithm is a bit more simple than `KS2` in that it basically compares (with some edge cases sensibly handled) the average value of the metric across baseline and highlight and looks at the percentage change. Often both `KS2` and `Volume` will have significant agreement and return similar metrics. + - `Volume` might favour picking up more sparse metrics that were relatively flat and then came to life with some spikes (or vice versa). This is because for such metrics that just don't have that many different values in them, it is impossible to construct a cumulative distribution that can then be compared. So `Volume` might be useful in spotting examples of metrics turning on or off. 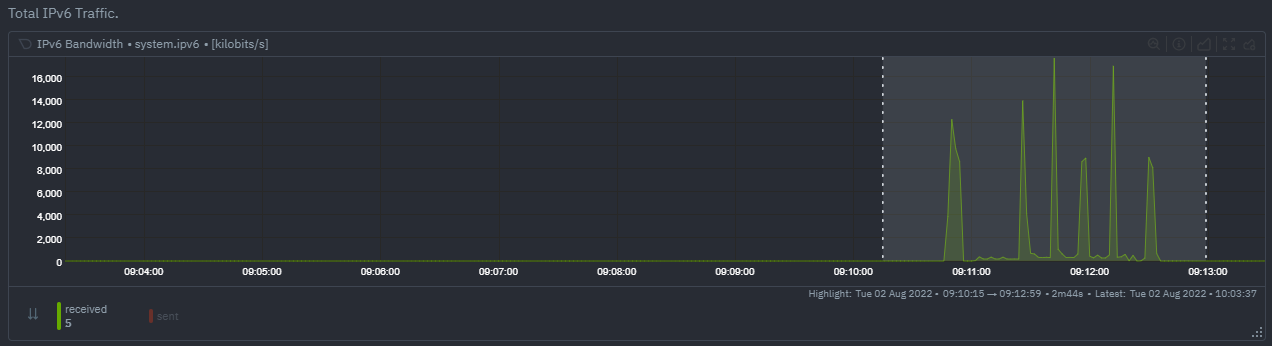 + - `KS2` since it relies on the full distribution might be better at highlighting more complex changes that `Volume` is unable to capture. For example a change in the variation of a metric might be picked up easily by `KS2` but missed (or just much lower scored) by `Volume` since the averages might remain not all that different between baseline and highlight even if their variance has changed a lot. 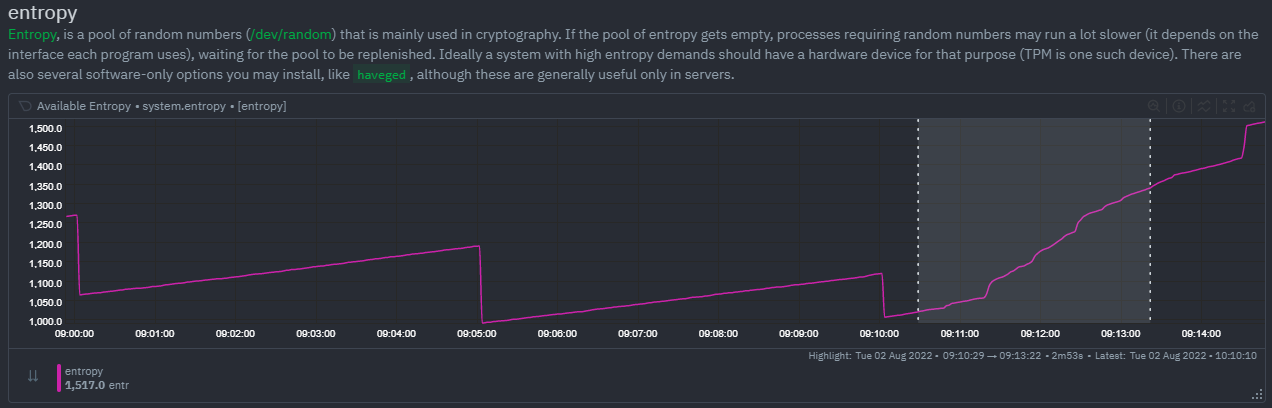 +- Use `Volume` and `Anomaly Rate` together to ask what metrics have turned most anomalous from baseline to highlighted window. You can expand the embedded anomaly rate chart once you have results to see this more clearly. 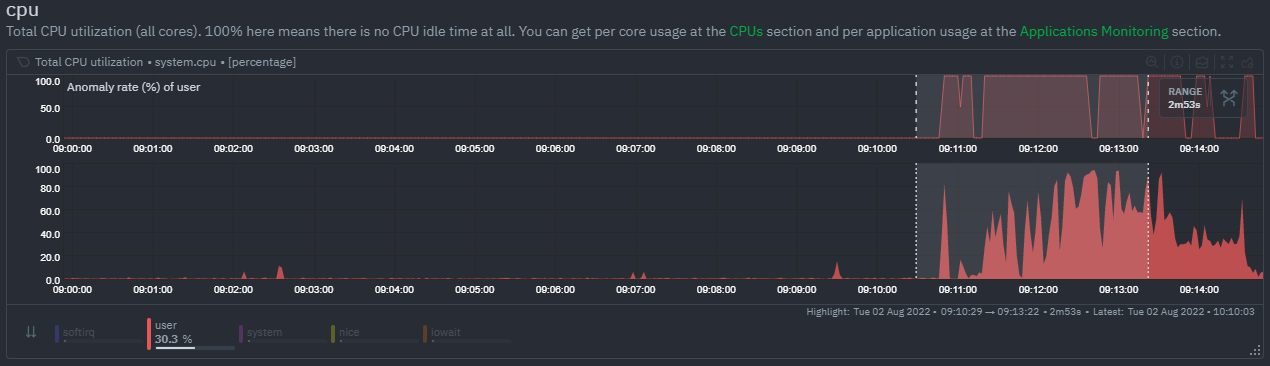 + +## What's next? + +You can read more about all the ML powered capabilities of Netdata [here](https://github.com/netdata/netdata/blob/master/docs/guides/monitor/anomaly-detection.md). If you aren't yet familiar with the power of Netdata Cloud's visualization features, check out the [Nodes view](https://github.com/netdata/netdata/blob/master/docs/cloud/visualize/nodes.md) and learn how to [build new dashboards](https://github.com/netdata/netdata/blob/master/docs/cloud/visualize/dashboards.md). diff --git a/docs/cloud/manage/invite-your-team.md b/docs/cloud/manage/invite-your-team.md new file mode 100644 index 000000000..f294a627d --- /dev/null +++ b/docs/cloud/manage/invite-your-team.md @@ -0,0 +1,37 @@ +--- +title: "Invite your team" +description: >- + "Invite your entire SRE, DevOPs, or ITOps team to Netdata Cloud to give everyone insights into your + infrastructure from a single pane of glass." +custom_edit_url: "https://github.com/netdata/netdata/blob/master/docs/cloud/manage/invite-your-team.md" +sidebar_label: "Invite your team" +learn_status: "Published" +learn_topic_type: "Tasks" +learn_rel_path: "Operations" +--- + +Invite new users to your Space by clicking on **Invite Users** in +the [Space](https://github.com/netdata/netdata/blob/master/docs/cloud/spaces.md) management area. + +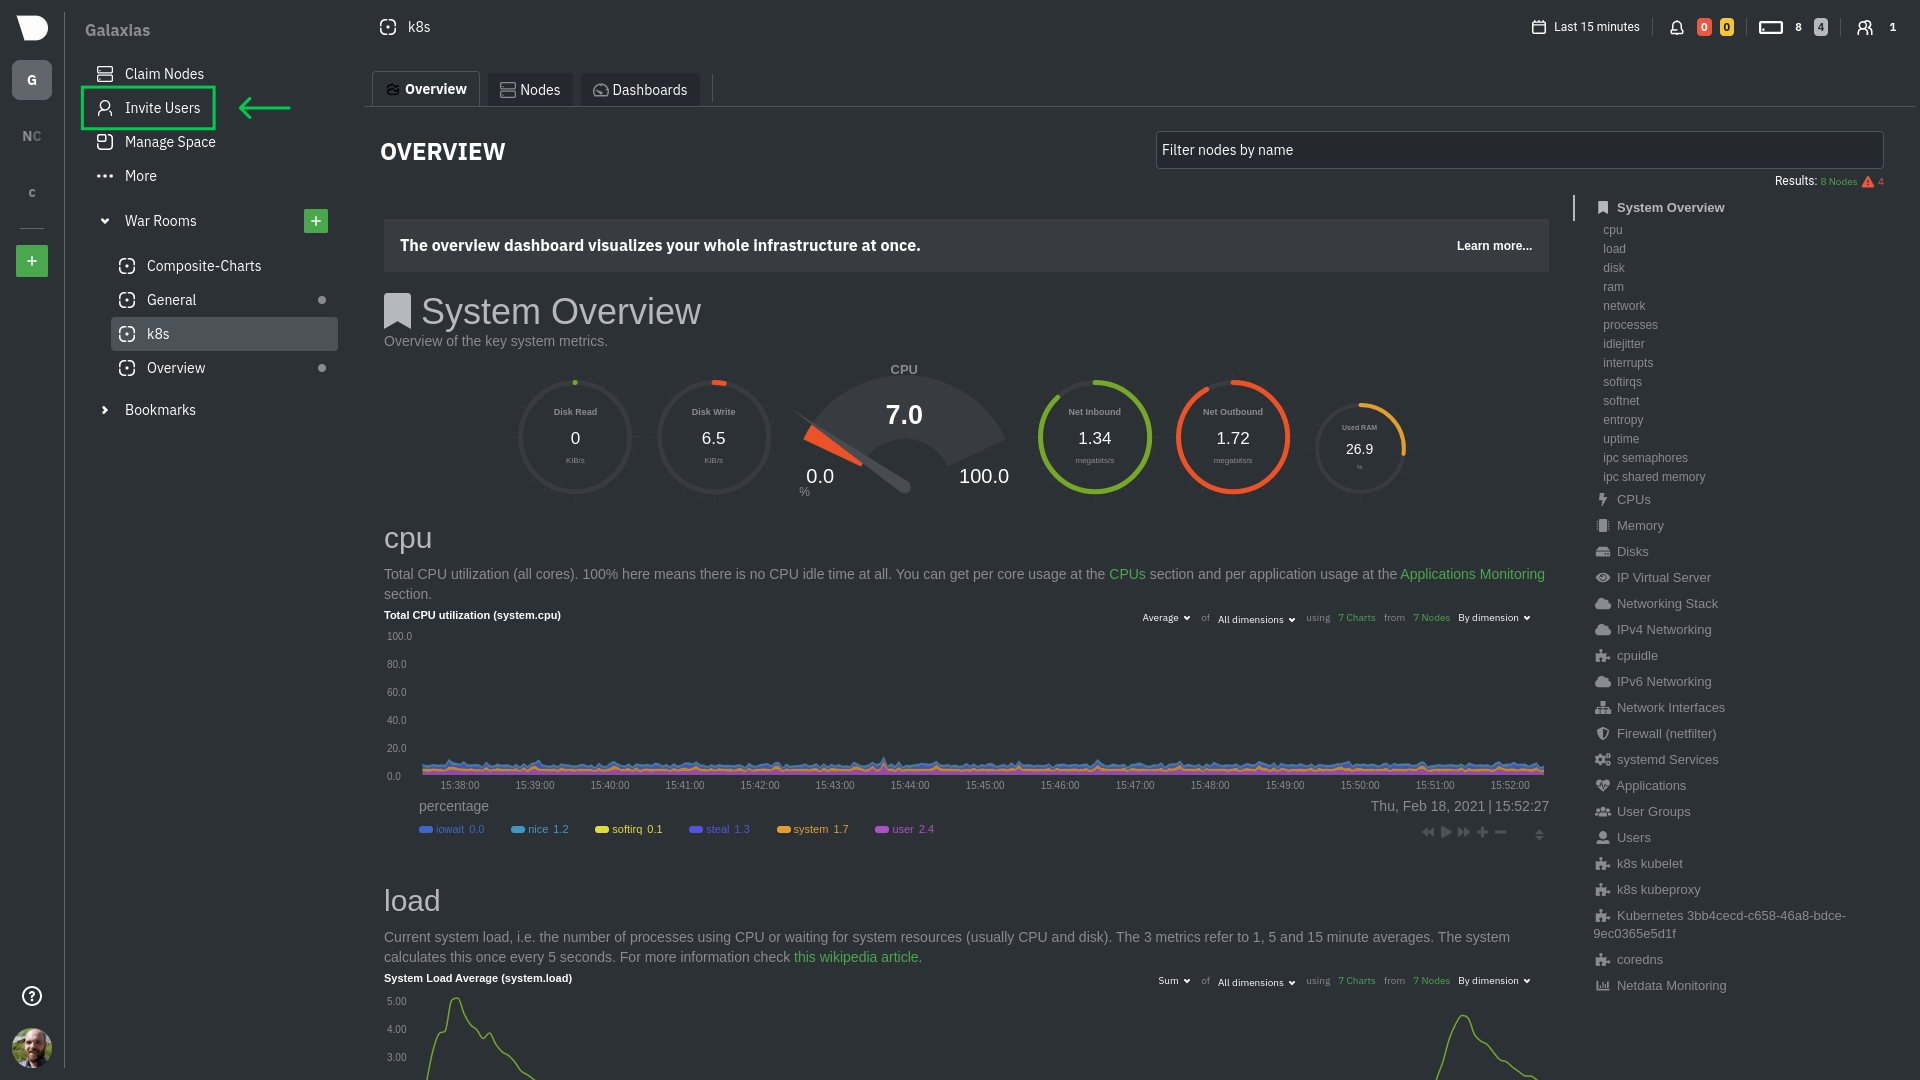 + +Enter the email addresses for the users you want to invite to your Space. You can enter any number of email addresses, +separated by a comma, to send multiple invitations at once. + +Next, choose the War Rooms you want to invite these users to. Once logged in, these users are not restricted only to +these War Rooms. They can be invited to others, or join any that are public. + +Click the **Send** button to send an email invitation, which will prompt them +to [sign up](https://github.com/netdata/netdata/blob/master/docs/cloud/manage/sign-in.mdx) and join your Space. + +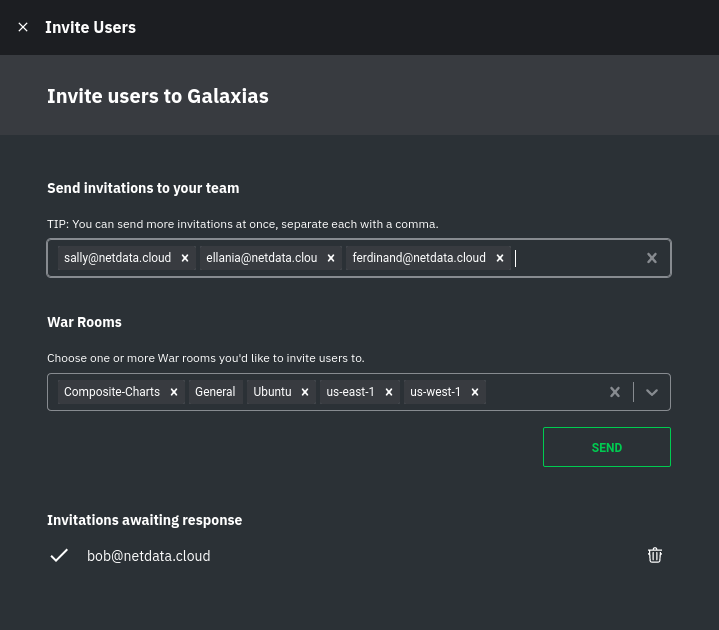 + +Any unaccepted invitations remain under **Invitations awaiting response**. These invitations can be rescinded at any +time by clicking the trash can icon. + +## What's next? + +If your team members have trouble signing in, direct them to +the [sign in guide](https://github.com/netdata/netdata/blob/master/docs/cloud/manage/sign-in.mdx). Once your +team is onboarded to Netdata Cloud, they can view shared assets, such +as [new dashboards](https://github.com/netdata/netdata/blob/master/docs/cloud/visualize/dashboards.md). diff --git a/docs/cloud/manage/sign-in.mdx b/docs/cloud/manage/sign-in.mdx new file mode 100644 index 000000000..32fcb22e7 --- /dev/null +++ b/docs/cloud/manage/sign-in.mdx @@ -0,0 +1,88 @@ +--- +title: "Sign in with email, Google, or GitHub" +description: "Learn how signing in to Cloud works via one of our three authentication methods, plus some tips if you're having trouble signing in." +custom_edit_url: "https://github.com/netdata/netdata/blob/master/docs/cloud/manage/sign-in.mdx" +sidebar_label: "Sign in with email, Google, or GitHub" +learn_status: "Published" +learn_topic_type: "Tasks" +learn_rel_path: "Operations" +--- + +You can [sign in to Netdata](https://app.netdata.cloud/sign-in?cloudRoute=spaces?utm_source=docs&utm_content=sign_in_button_first_section) through one of three methods: email, Google, or GitHub. Email uses a +time-sensitive link that authenticates your browser, and Google/GitHub both use OAuth to associate your email address +with a Netdata Cloud account. + +No matter the method, your Netdata Cloud account is based around your email address. Netdata Cloud does not store +passwords. + + +## Email + +To sign in with email, visit [Netdata Cloud](https://app.netdata.cloud/sign-in?cloudRoute=spaces?utm_source=docs&utm_content=sign_in_button_email_section), enter your email address, and click +the **Sign in by email** button. + +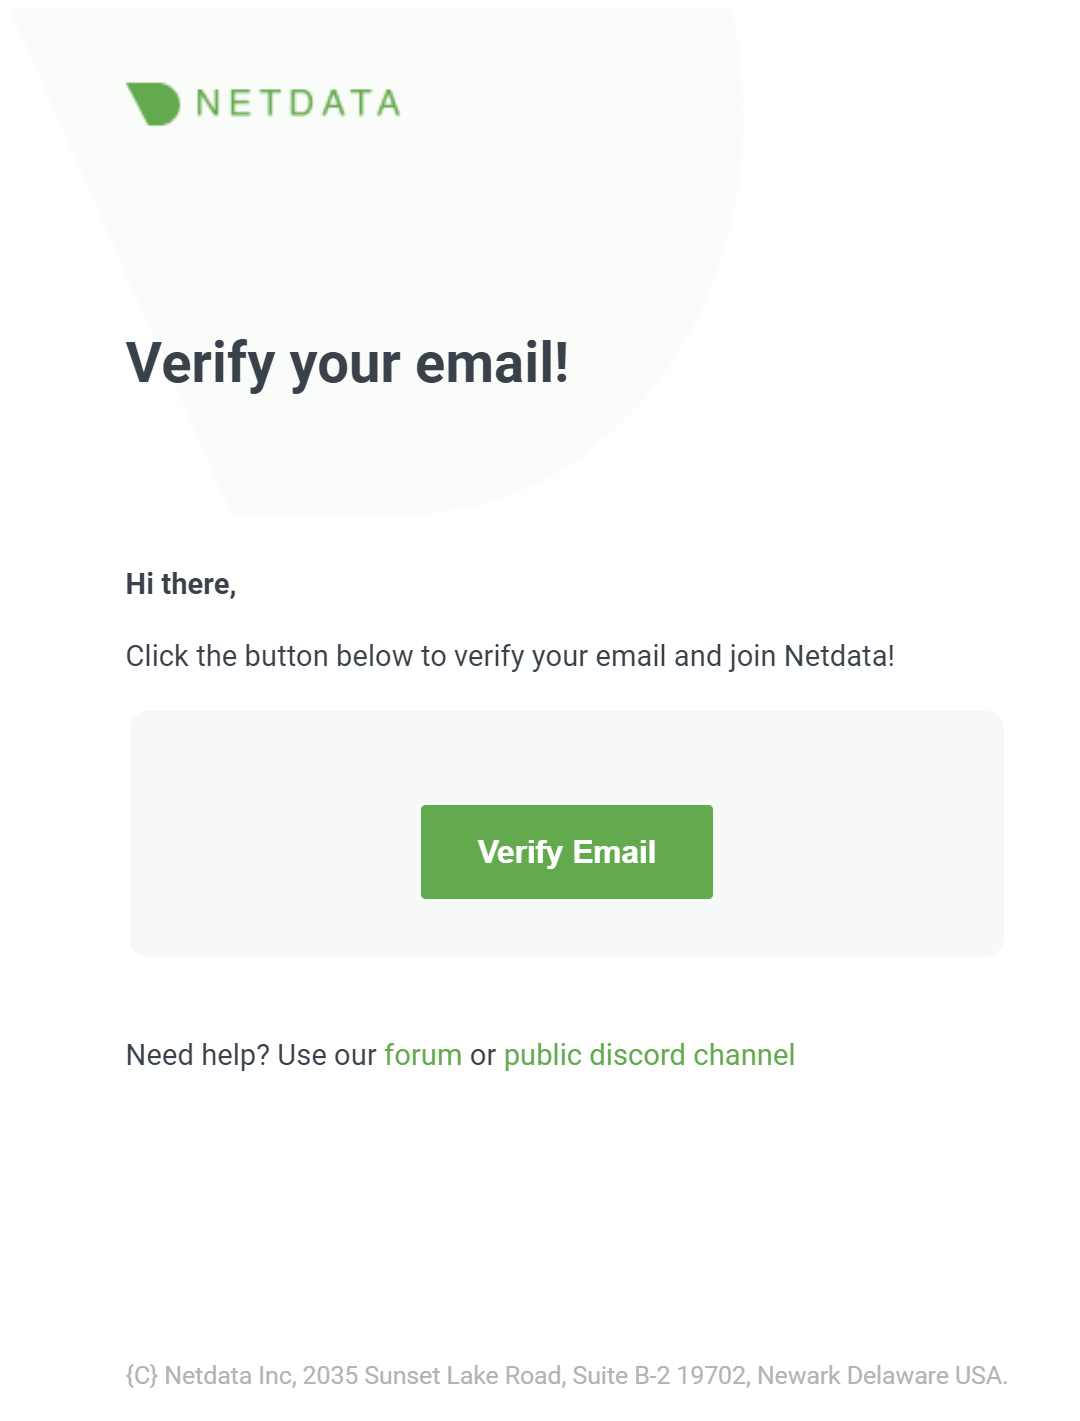 + +Click the **Verify** button in the email to begin using Netdata Cloud. + +To use this same Netdata Cloud account on additional devices, request another sign in email, open the email on that +device, and sign in. + +### Don't have a Netdata Cloud account yet? + +If you don't have a Netdata Cloud account yet you won't need to worry about it. During the sign in process we will create one for you and make the process seamless to you. + +After your account is created and you sign in to Netdata, you first are asked to agree to Netdata Cloud's [Privacy +Policy](https://www.netdata.cloud/privacy/) and [Terms of Use](https://www.netdata.cloud/terms/). Once you agree with these you are directed +through the Netdata Cloud onboarding process, which is explained in the [Netdata Cloud +quickstart](https://github.com/netdata/netdata/blob/master/docs/cloud/get-started.mdx). + +### Troubleshooting + +You should receive your sign in email in less than a minute. The subject is **Verify your email!** and the sender is `no-reply@app.netdata.cloud` via `sendgrid.net`. + +If you don't see the email, try the following: + +- Check [Netdata Cloud status](https://status.netdata.cloud) for ongoing issues with our infrastructure. +- Request another sign in email via the [sign in page](https://app.netdata.cloud/sign-in?cloudRoute=spaces?utm_source=docs&utm_content=sign_in_button_troubleshooting_section). +- Check your spam folder. +- In Gmail, check the **Updates** category. + +You may also want to add `no-reply@app.netdata.cloud` to your address book or contacts list, especially if you're using +a public email service, such as Gmail. You may also want to whitelist/allowlist either the specific email or the entire +`app.netdata.cloud` domain. + +## Google and GitHub OAuth + +When you use Google/GitHub OAuth, your Netdata Cloud account is associated with the email address that Netdata Cloud +receives via OAuth. + +To sign in with Google or GitHub OAuth, visit [Netdata Cloud](https://app.netdata.cloud/sign-in?cloudRoute=spaces?utm_source=docs&utm_content=sign_in_button_google_github_section) and click the +**Continue with Google/GitHub** or button. Enter your Google/GitHub username and your password. Complete two-factor +authentication if you or your organization has it enabled. + +You are then signed in to Netdata Cloud or directed to the new-user onboarding if you have not signed up previously. + +## Reset a password + +Netdata Cloud does not store passwords and does not support password resets. All of our sign in methods do not +require passwords, and use either links in emails or Google/GitHub OAuth for authentication. + +## Switch between sign in methods + +You can switch between sign in methods if the email account associated with each method is the same. + +For example, you first sign in via your email account, `user@example.com`, and later sign out. You later attempt to sign +in via a GitHub account associated with `user@example.com`. Netdata Cloud recognizes that the two are the same and signs +you in to your original account. + +However, if you first sign in via your `user@example.com` email account and then sign in via a Google account associated +with `user2@example.com`, Netdata Cloud creates a new account and begins the onboarding process. + +It is not currently possible to link an account created with `user@example.com` to a Google account associated with +`user2@example.com`. + +## What's next? + +If you haven't already onboarded to Netdata Cloud and connected your first nodes, visit +the [get started guide](https://github.com/netdata/netdata/blob/master/docs/cloud/get-started.mdx). diff --git a/docs/cloud/manage/themes.md b/docs/cloud/manage/themes.md new file mode 100644 index 000000000..11d5cb32f --- /dev/null +++ b/docs/cloud/manage/themes.md @@ -0,0 +1,22 @@ +--- +title: "Choose your Netdata Cloud theme" +description: "Switch between Light and Dark themes in Netdata Cloud to match your personal visualization preferences." +custom_edit_url: "https://github.com/netdata/netdata/blob/master/docs/cloud/manage/themes.md" +sidebar_label: "Choose your Netdata Cloud theme" +learn_status: "Published" +learn_topic_type: "Tasks" +learn_rel_path: "Operations" +--- + +The Dark theme is the default for all new Netdata Cloud accounts. + +To change your theme across Netdata Cloud, click on your profile picture, then **Profile**. Click on the **Settings** +tab, then choose your preferred theme: Light or Dark. + +**Light**: + +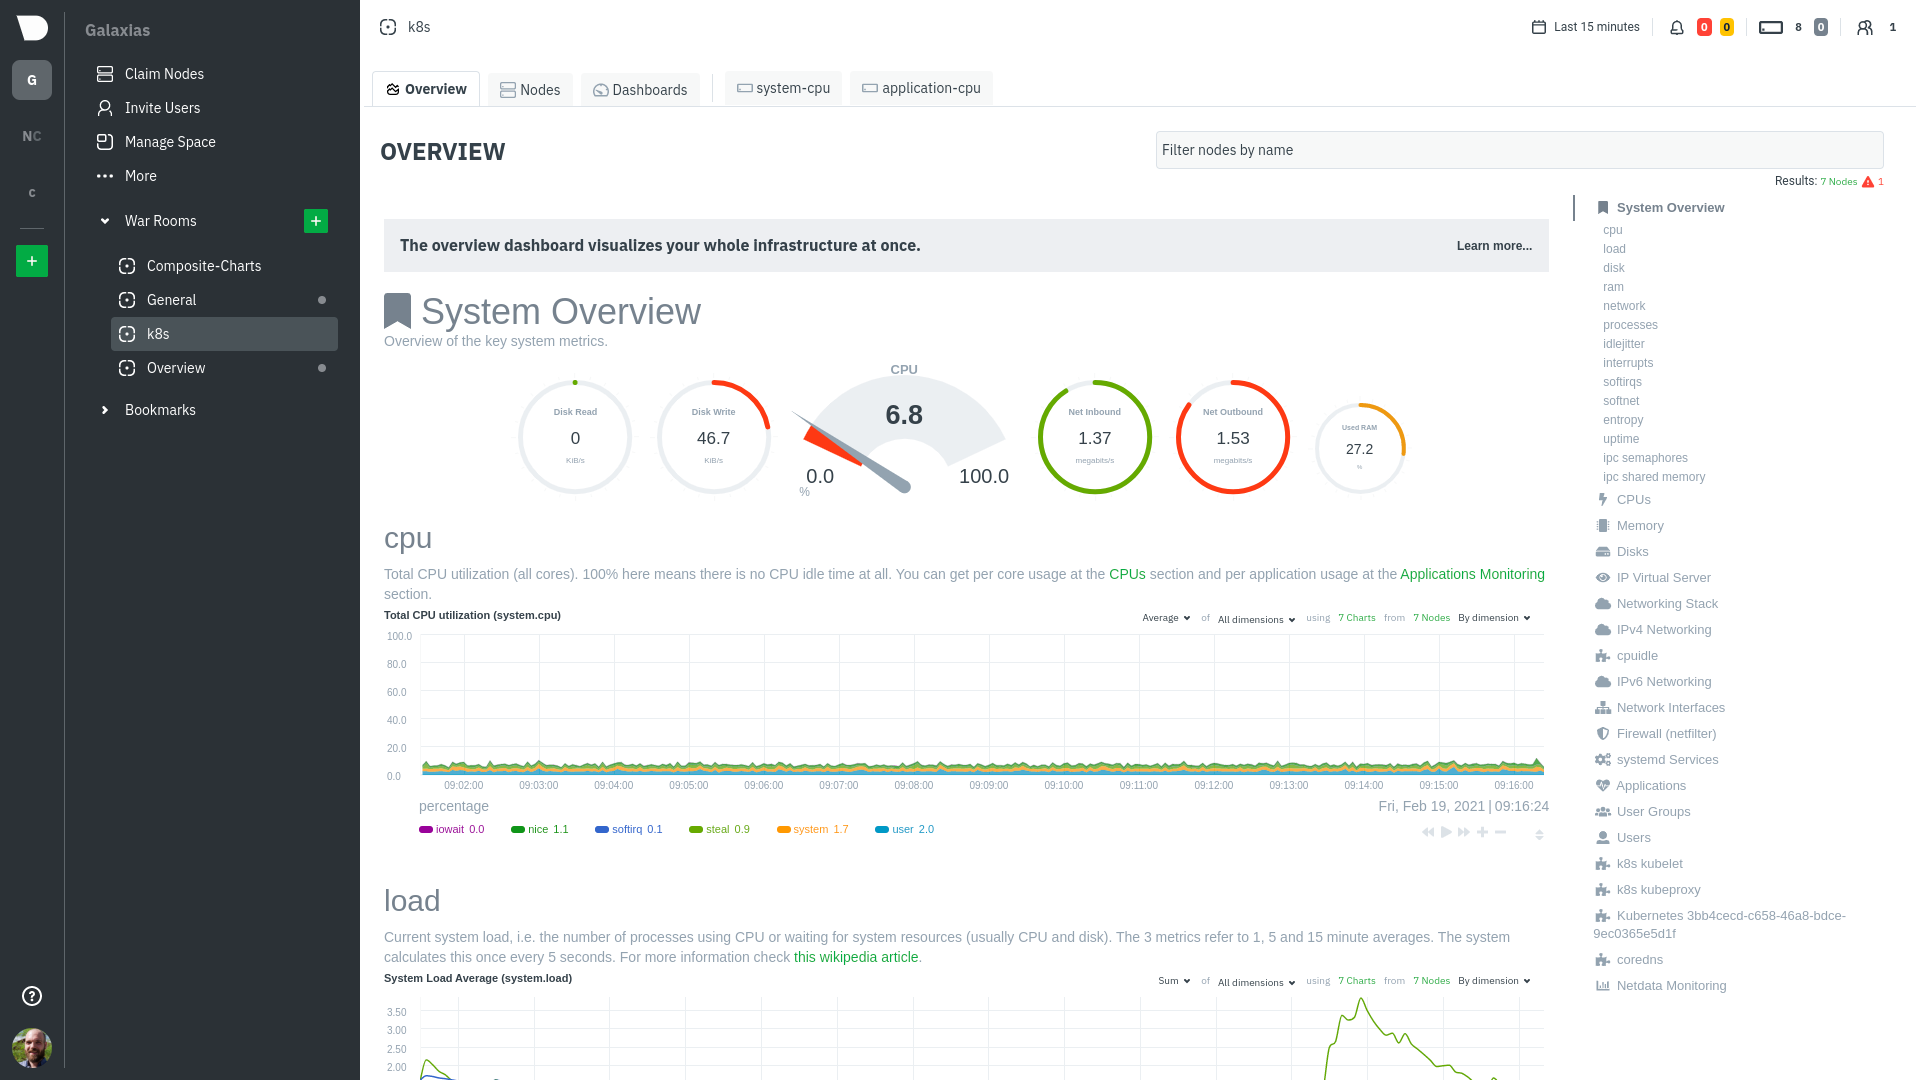 + +**Dark (default)**: + +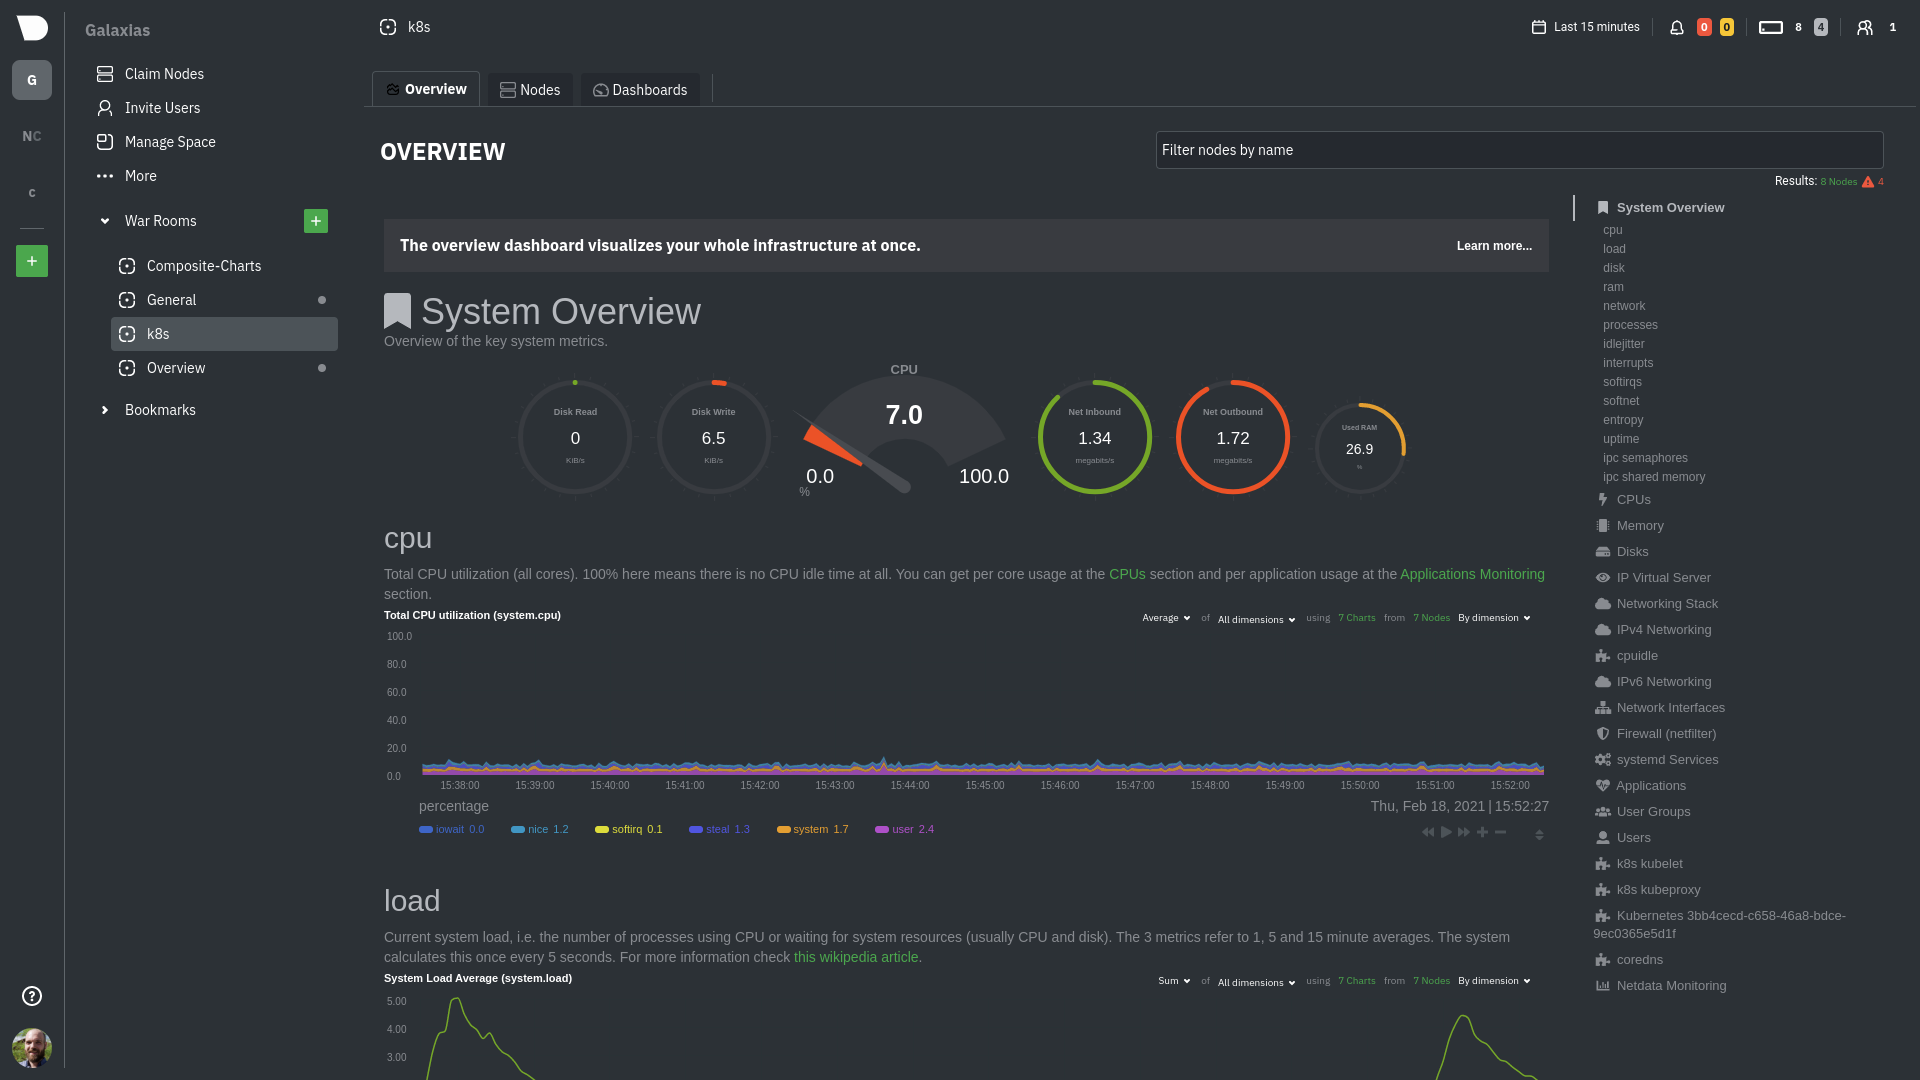 diff --git a/docs/cloud/netdata-functions.md b/docs/cloud/netdata-functions.md new file mode 100644 index 000000000..e1b9dd0b1 --- /dev/null +++ b/docs/cloud/netdata-functions.md @@ -0,0 +1,65 @@ +<!-- +title: "Netdata Functions" +sidebar_label: "Netdata Functions" +custom_edit_url: "https://github.com/netdata/netdata/blob/master/docs/cloud/netdata-functions.md" +sidebar_position: "2800" +learn_status: "Published" +learn_topic_type: "Concepts" +learn_rel_path: "Concepts" +learn_docs_purpose: "Present the Netdata Functions what these are and why they should be used." +--> + +Netdata Agent collectors are able to expose functions that can be executed in run-time and on-demand. These will be +executed on the node - host where the function is made +available. + +#### What is a function? + +Collectors besides the metric collection, storing, and/or streaming work are capable of executing specific routines on +request. These routines will bring additional information +to help you troubleshoot or even trigger some action to happen on the node itself. + +A function is a `key` - `value` pair. The `key` uniquely identifies the function within a node. The `value` is a +function (i.e. code) to be run by a data collector when +the function is invoked. + +For more details please check out documentation on how we use our internal collector to get this from the first collector that exposes +functions - [plugins.d](https://github.com/netdata/netdata/blob/master/collectors/plugins.d/README.md#function). + +#### What functions are currently available? + +| Function | Description | plugin - module | +| :-- | :-- | :-- | +| processes | Detailed information on the currently running processes on the node. | [apps.plugin](https://github.com/netdata/netdata/blob/master/collectors/apps.plugin/README.md) | + +If you have ideas or requests for other functions: +* open a [Feature request](https://github.com/netdata/netdata-cloud/issues/new?assignees=&labels=feature+request%2Cneeds+triage&template=FEAT_REQUEST.yml&title=%5BFeat%5D%3A+) on Netdata Cloud repo +* engage with our community on the [Netdata Discord server](https://discord.com/invite/mPZ6WZKKG2). +#### How do functions work with streaming? + +Via streaming, the definitions of functions are transmitted to a parent node so it knows all the functions available on +any children connected to it. + +If the parent node is the one connected to Netdata Cloud it is capable of triggering the call to the respective children +node to run the function. + +#### Why are they available only on Netdata Cloud? + +Since these functions are able to execute routines on the node and due the potential use cases that they can cover, our +concern is to ensure no sensitive +information or disruptive actions are exposed through the Agent's API. + +With the communication between the Netdata Agent and Netdata Cloud being +through [ACLK](https://github.com/netdata/netdata/blob/master/aclk/README.md) this +concern is addressed. + +## Related Topics + +### **Related Concepts** + +- [ACLK](https://github.com/netdata/netdata/blob/master/aclk/README.md) +- [plugins.d](https://github.com/netdata/netdata/blob/master/collectors/plugins.d/README.md) + +### Related Tasks + +- [Run-time troubleshooting with Functions](https://github.com/netdata/netdata/blob/master/docs/cloud/runtime-troubleshooting-with-functions.md) diff --git a/docs/cloud/runtime-troubleshooting-with-functions.md b/docs/cloud/runtime-troubleshooting-with-functions.md new file mode 100644 index 000000000..3800ea20d --- /dev/null +++ b/docs/cloud/runtime-troubleshooting-with-functions.md @@ -0,0 +1,43 @@ +<!-- +title: "Run-time troubleshooting with Functions" +sidebar_label: "Run-time troubleshooting with Functions" +custom_edit_url: "https://github.com/netdata/netdata/blob/master/docs/cloud/runtime-troubleshooting-with-functions.md" +learn_status: "Published" +sidebar_position: "4" +learn_topic_type: "Tasks" +learn_rel_path: "Operations" +learn_docs_purpose: "Instructions on how to use Functions" +--> + +Netdata Functions feature allows you to execute on-demand a pre-defined routine on a node where a Netdata Agent is running. These routines are exposed by a given collector. +These routines can be used to retrieve additional information to help you troubleshoot or to trigger some action to happen on the node itself. + + +### Prerequisites + +The following is required to be able to run Functions from Netdata Cloud. +* At least one of the nodes claimed to your Space should be on a Netdata agent version higher than `v1.37.1` +* Ensure that the node has the collector that exposes the function you want enabled ([see current available functions](https://github.com/netdata/netdata/blob/master/docs/cloud/netdata-functions.md#what-functions-are-currently-available)) + +### Execute a function (from functions view) + +1. From the right-hand bar select the **Function** you want to run +2. Still on the right-hand bar select the **Node** where you want to run it +3. Results will be displayed in the central area for you to interact with +4. Additional filtering capabilities, depending on the function, should be available on right-hand bar + +### Execute a function (from Nodes view) + +1. Click on the functions icon for a node that has this active +2. You are directed to the **Functions** tab +3. Follow the above instructions from step 3. + +> ⚠️ If you get an error saying that your node can't execute Functions please check the [prerequisites](#prerequisites). + +## Related Topics + +### **Related Concepts** +- [Netdata Functions](https://github.com/netdata/netdata/blob/master/docs/cloud/netdata-functions.md) + +#### Related References documentation +- [External plugins overview](https://github.com/netdata/netdata/blob/master/collectors/plugins.d/README.md#function) diff --git a/docs/cloud/spaces.md b/docs/cloud/spaces.md new file mode 100644 index 000000000..31d8a47ae --- /dev/null +++ b/docs/cloud/spaces.md @@ -0,0 +1,91 @@ +--- +title: "Spaces" +description: >- + "Organize your infrastructure monitoring on Netdata Cloud by creating Spaces, then groupingyour + Agent-monitored nodes." +custom_edit_url: "https://github.com/netdata/netdata/blob/master/docs/cloud/spaces.md" +sidebar_label: "Spaces" +learn_status: "Published" +learn_topic_type: "Tasks" +learn_rel_path: "Operations" +--- + +A Space is a high-level container. It's a collaboration space where you can organize team members, access levels and the +nodes you want to monitor. + +Let's talk through some strategies for creating the most intuitive Cloud experience for your team. + +## How to organize your Netdata Cloud + +You can use any number of Spaces you want, but as you organize your Cloud experience, keep in mind that _you can only +add any given node to a single Space_. This 1:1 relationship between node and Space may dictate whether you use one +encompassing Space for your entire team and separate them by War Rooms, or use different Spaces for teams monitoring +discrete parts of your infrastructure. + +If you have been invited to Netdata Cloud by another user by default you will able to see this space. If you are a new +user the first space is already created. + +The other consideration for the number of Spaces you use to organize your Netdata Cloud experience is the size and +complexity of your organization. + +For small team and infrastructures we recommend sticking to a single Space so that you can keep all your nodes and their +respective metrics in one place. You can then use +multiple [War Rooms](https://github.com/netdata/netdata/blob/master/docs/cloud/war-rooms.md) +to further organize your infrastructure monitoring. + +Enterprises may want to create multiple Spaces for each of their larger teams, particularly if those teams have +different responsibilities or parts of the overall infrastructure to monitor. For example, you might have one SRE team +for your user-facing SaaS application and a second team for infrastructure tooling. If they don't need to monitor the +same nodes, you can create separate Spaces for each team. + +## Navigate between spaces + +Click on any of the boxes to switch between available Spaces. + +Netdata Cloud abbreviates each Space to the first letter of the name, or the first two letters if the name is two words +or more. Hover over each icon to see the full name in a tooltip. + +To add a new Space click on the green **+** button . Enter the name of the Space and click **Save**. + + + +## Manage Spaces + +Manage your spaces by selecting in a particular space and clicking in the small gear icon in the lower left corner. This +will open a side tab in which you can: + +1. _Configure this Space*_, in the first tab (**Space**) you can change the name, description or/and some privilege + options of this space + +2. _Edit the War Rooms*_, click on the **War rooms** tab to add or remove War Rooms. + +3. _Connect nodes*_, click on **Nodes** tab. Copy the claiming script to your node and run it. See the + [connect to Cloud doc](https://github.com/netdata/netdata/blob/master/claim/README.md) for details. + +4. _Manage the users*_, click on **Users**. + The [invitation doc](https://github.com/netdata/netdata/blob/master/docs/cloud/manage/invite-your-team.md) + details the invitation process. + +5. _Manage notification setting*_, click on **Notifications** tab to turn off/on notification methods. + +6. _Manage your bookmarks*_, click on the **Bookmarks** tab to add or remove bookmarks that you need. + +:::note \* This action requires admin rights for this space +::: + +## Obsoleting offline nodes from a Space + +Netdata admin users now have the ability to remove obsolete nodes from a space. + +- Only admin users have the ability to obsolete nodes +- Only offline nodes can be marked obsolete (Live nodes and stale nodes cannot be obsoleted) +- Node obsoletion works across the entire space, so the obsoleted node will be removed from all rooms belonging to the + space +- If the obsoleted nodes eventually become live or online once more they will be automatically re-added to the space + + + +## What's next? + +Once you configured your Spaces, it's time to set up +your [War Rooms](https://github.com/netdata/netdata/blob/master/docs/cloud/war-rooms.md). diff --git a/docs/cloud/visualize/dashboards.md b/docs/cloud/visualize/dashboards.md new file mode 100644 index 000000000..3c6d7ffd5 --- /dev/null +++ b/docs/cloud/visualize/dashboards.md @@ -0,0 +1,122 @@ +--- +title: "Build new dashboards" +description: >- + "Design new dashboards that target your infrastructure's unique needs and share them with your team for + targeted visual anomaly detection or incident response." +custom_edit_url: "https://github.com/netdata/netdata/blob/master/docs/cloud/visualize/dashboards.md" +sidebar_label: "Build new dashboards" +learn_status: "Published" +learn_topic_type: "Tasks" +learn_rel_path: "Operations/Visualizations" +--- + +With Netdata Cloud, you can build new dashboards that target your infrastructure's unique needs. Put key metrics from +any number of distributed systems in one place for a bird's eye view of your infrastructure. + +Click on the **Dashboards** tab in any War Room to get started. + +## Create your first dashboard + +From the Dashboards tab, click on the **+** button. + +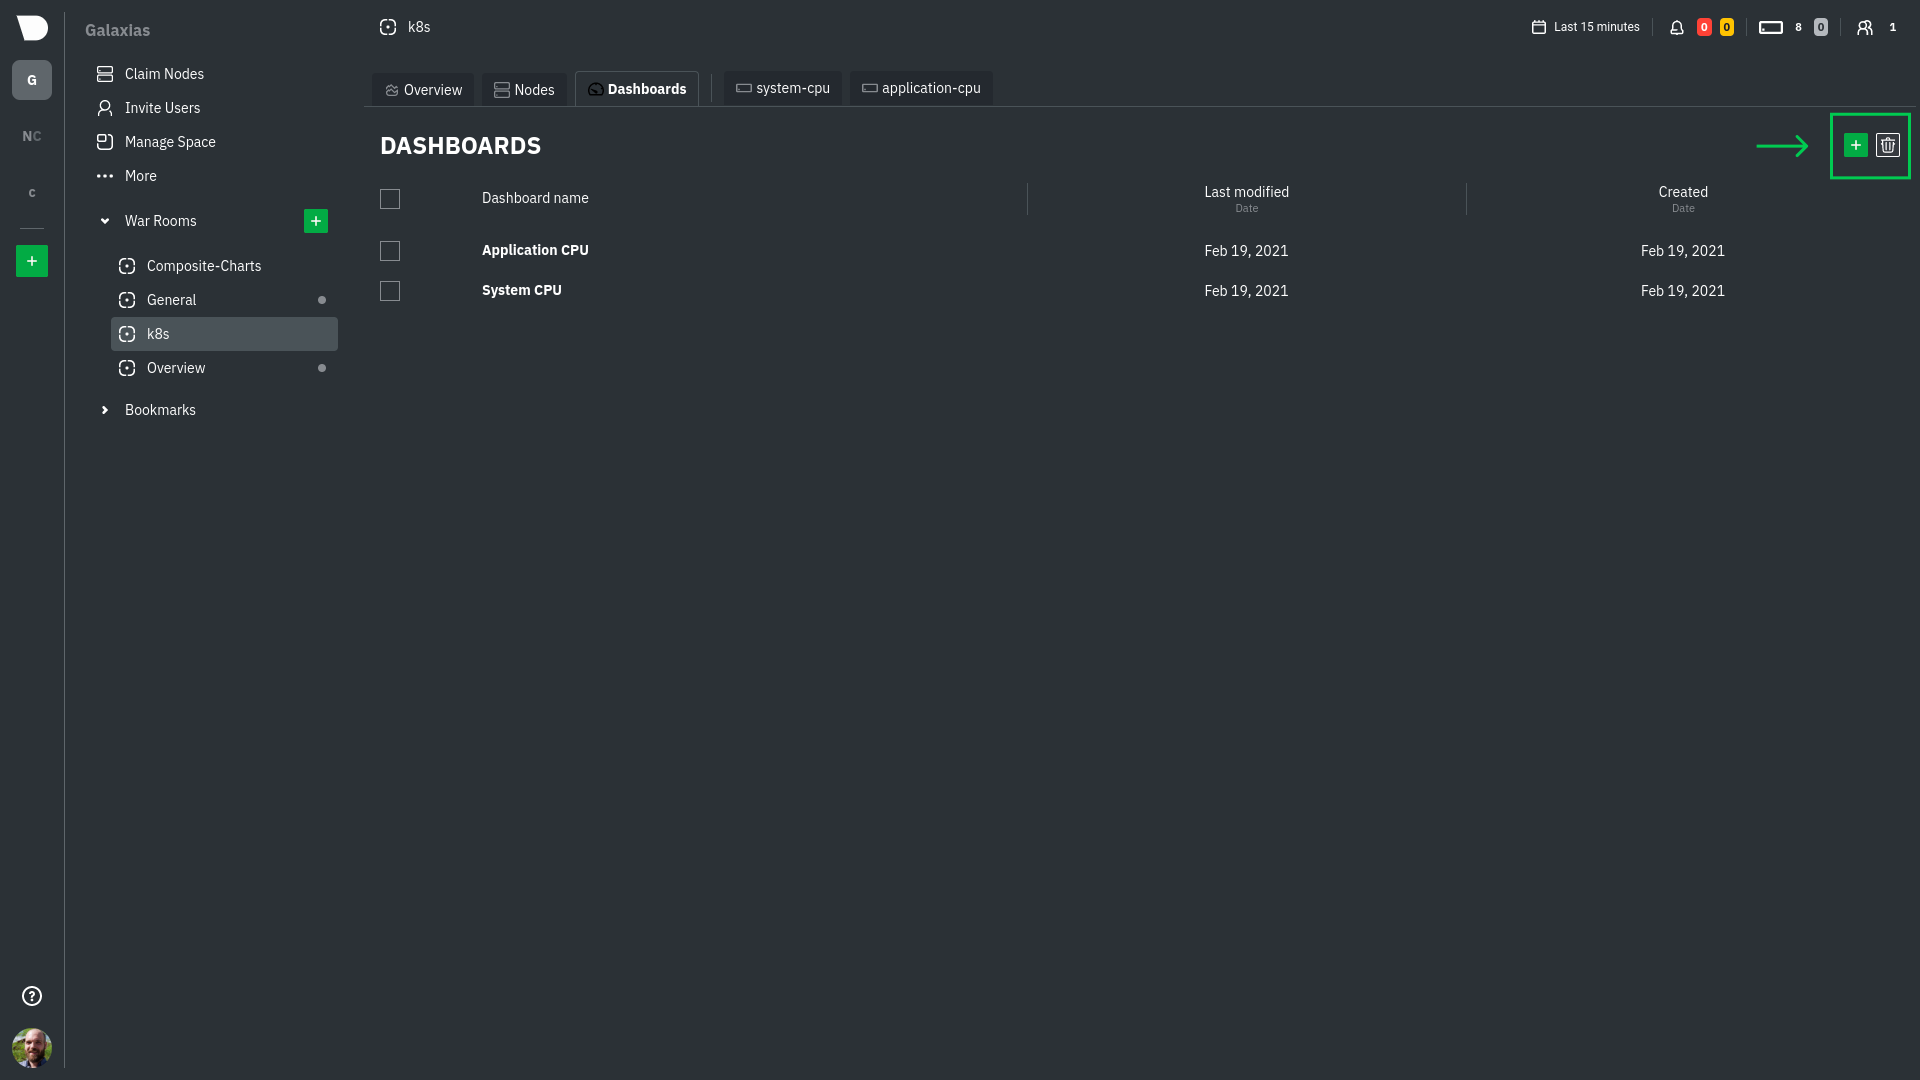 + +In the modal, give your new dashboard a name, and click **+ Add**. + +Click the **Add Chart** button to add your first chart card. From the dropdown, select either *All Nodes** or a specific +node. If you select **All Nodes**, you will add a [composite chart](/docs/cloud/visualize/overview#composite-charts) to +your new dashboard. Next, select the context. You'll see a preview of the chart before you finish adding it. + +The **Add Text** button creates a new card with user-defined text, which you can use to describe or document a +particular dashboard's meaning and purpose. + +Be sure to click the **Save** button any time you make changes to your dashboard. + + + +## Using your dashboard + +Dashboards are designed to be interactive and flexible so you can design them to your exact needs. Dashboards are made +of any number of **cards**, which can contain charts or text. + +### Chart cards + +Click the **Add Chart** button to add your first chart card. From the dropdown, select either *All Nodes** or a specific +node. If you select **All Nodes**, you will add a [composite chart](/docs/cloud/visualize/overview#composite-charts) to +your new dashboard. Next, select the context. You'll see a preview of the chart before you finish adding it. + +The charts you add to any dashboard are fully interactive, just like the charts in an Agent dashboard or a single node's +dashboard in Cloud. Zoom in and out, highlight timeframes, and more. See our +[Agent dashboard docs](https://learn.netdata.cloud/docs/agent/web#using-charts) for all the shortcuts. + +Charts also synchronize as you interact with them, even across contexts _or_ nodes. + +### Text cards + +The **Add Text** button creates a new card with user-defined text. When you create a new text card or edit an existing +one, select/highlight characters or words to open a modal to make them **bold**, _italic_, or <ins>underlined</ins>. You +can also create a link. + +### Move cards + +To move any card, click and hold on the top of the card, then drag it to a new location. A red placeholder indicates the +new location. Once you release your mouse, other charts re-sort to the grid system automatically. + +### Resize cards + +To resize any card on a dashboard, click on the bottom-right corner and drag to the card's new size. Other cards re-sort +to the grid system automatically. + +## Jump to single-node dashboards + +Quickly jump to any node's dashboard by clicking the 3-dot icon in the corner of any card to open a menu. Hit the **Go +to Chart** item. + +You'll land directly on that chart of interest, but you can now scroll up and down to correlate your findings with other +charts. Of course, you can continue to zoom, highlight, and pan through time just as you're used to with Agent +dashboards. + +## Pin dashboards + +Click on the **Pin** button in any dashboard to put those charts into a separate panel at the bottom of the screen. You +can now navigate through Netdata Cloud freely, individual Cloud dashboards, the Nodes view, different War Rooms, or even +different Spaces, and have those valuable metrics follow you. + +Pinning dashboards helps you correlate potentially related charts across your infrastructure, no matter how you +organized your Spaces and War Rooms, and helps you discover root causes faster. + +## Manage your dashboards + +To see dashboards associated with the current War Room, click **Dashboards** tab in any War Room. You can select +dashboards and delete them using the 🗑️ icon. + +### Update/save a dashboard + +If you've made changes to a dashboard, such as adding or moving cards, the **Save** button is enabled. Click it to save +your most recent changes. Any other members of the War Room will be able to see these changes the next time they load +this dashboard. + +If multiple users attempt to make concurrent changes to the same dashboard, the second user who hits Save will be +prompted to either overwrite the dashboard or reload to see the most recent changes. + +### Remove an individual card + +Click on the 3-dot icon in the corner of any card to open a menu. Click the **Remove Card** item to remove the card. + +### Delete a dashboard + +Delete any dashboard by navigating to it and clicking the **Delete** button. This will remove this entry from the +dropdown for every member of this War Room. + +### Minimum browser viewport + +Because of the visual complexity of individual charts, dashboards require a minimum browser viewport of 800px. + +## What's next? + +Once you've designed a dashboard or two, make sure +to [invite your team](https://github.com/netdata/netdata/blob/master/docs/cloud/manage/invite-your-team.md) if +you haven't already. You can add these new users to the same War Room to let them see the same dashboards without any +effort. diff --git a/docs/cloud/visualize/interact-new-charts.md b/docs/cloud/visualize/interact-new-charts.md new file mode 100644 index 000000000..4b33fe85f --- /dev/null +++ b/docs/cloud/visualize/interact-new-charts.md @@ -0,0 +1,222 @@ +--- +title: "Interact with charts" +description: >- + "Learn how to get the most out of Netdata's charts. These charts will help you make sense of all the + metrics at your disposal, helping you troubleshoot with real-time, per-second metric data" +type: "how-to" +custom_edit_url: "https://github.com/netdata/netdata/blob/master/docs/cloud/visualize/interact-new-charts.md" +sidebar_label: "Interact with charts" +learn_status: "Published" +learn_topic_type: "Concepts" +learn_rel_path: "Operations/Visualizations" +--- + +> ⚠️ This new version of charts is currently **only** available on Netdata Cloud. We didn't want to keep this valuable +> feature from you, so after we get this into your hands on the Cloud, we will collect and implement your feedback. +> Together, we will be able to provide the best possible version of charts on the Netdata Agent dashboard, as quickly as +> possible. + +Netdata excels in collecting, storing, and organizing metrics in out-of-the-box dashboards. +To make sense of all the metrics, Netdata offers an enhanced version of charts that update every second. + +These charts provide a lot of useful information, so that you can: + +- Enjoy the high-resolution, granular metrics collected by Netdata +- Explore visualization with more options such as _line_, _stacked_ and _area_ types (other types like _bar_, _pie_ and + _gauges_ are to be added shortly) +- Examine all the metrics by hovering over them with your cursor +- Use intuitive tooling and shortcuts to pan, zoom or highlight your charts +- On highlight, ease access + to [Metric Correlations](https://github.com/netdata/netdata/blob/master/docs/cloud/insights/metric-correlations.md) to + see other metrics with similar patterns +- Have the dimensions sorted based on name or value +- View information about the chart, its plugin, context, and type +- Get the chart status and possible errors. On top, reload functionality + +These charts will available +on [Overview tab](https://github.com/netdata/netdata/blob/master/docs/cloud/visualize/overview.md), Single Node view and +on your [Custom Dashboards](https://github.com/netdata/netdata/blob/master/docs/cloud/visualize/dashboards.md). + +## Overview + +Have a look at the can see the overall look and feel of the charts for both with a composite chart from +the [Overview tab](https://github.com/netdata/netdata/blob/master/docs/cloud/visualize/overview.md) and a simple chart +from the single node view: + + + +With a quick glance you have immediate information available at your disposal: + +- Chart title and units +- Action bars +- Chart area +- Legend with dimensions + +## Play, Pause and Reset + +Your charts are controlled using the +available [Time controls](https://github.com/netdata/netdata/blob/master/docs/dashboard/visualization-date-and-time-controls.mdx#time-controls). +Besides these, when interacting with the chart you can also activate these controls by: + +- hovering over any chart to temporarily pause it - this momentarily switches time control to Pause, so that you can + hover over a specific timeframe. When moving out of the chart time control will go back to Play (if it was it's + previous state) +- clicking on the chart to lock it - this enables the Pause option on the time controls, to the current timeframe. This + is if you want to jump to a different chart to look for possible correlations. +- double clicking to release a previously locked chart - move the time control back to Play + +  + +| Interaction | Keyboard/mouse | Touchpad/touchscreen | Time control | +|:------------------|:---------------|:---------------------|:----------------------| +| **Pause** a chart | `hover` | `n/a` | Temporarily **Pause** | +| **Stop** a chart | `click` | `tap` | **Pause** | +| **Reset** a chart | `double click` | `n/a` | **Play** | + +Note: These interactions are available when the default "Pan" action is used. Other actions are accessible via +the [Exploration action bar](#exploration-action-bar). + +## Title and chart action bar + +When you start interacting with a chart, you'll notice valuable information on the top bar. You will see information +from the chart title to a chart action bar. + +The elements that you can find on this top bar are: + +- Netdata icon: this indicates that data is continuously being updated, this happens + if [Time controls](https://github.com/netdata/netdata/blob/master/docs/dashboard/visualization-date-and-time-controls.mdx#time-controls) + are in Play or Force Play mode +- Chart status icon: indicates the status of the chart. Possible values are: Loading, Timeout, Error or No data +- Chart title: on the chart title you can see the title together with the metric being displayed, as well as the unit of + measurement +- Chart action bar: here you'll have access to chart info, change chart types, enables fullscreen mode, and the ability + to add the chart to a custom dashboard + + + +### Chart action bar + +On this bar you have access to immediate actions over the chart, the available actions are: + +- Chart info: you will be able to get more information relevant to the chart you are interacting with +- Chart type: change the chart type from _line_, _stacked_ or _area_ +- Enter fullscreen mode: allows you expand the current chart to the full size of your screen +- Add chart to dashboard: This allows you to add the chart to an existing custom dashboard or directly create a new one + that includes the chart. + +<img src="https://images.zenhubusercontent.com/60b4ebb03f4163193ec31819/65ac4fc8-3d8d-4617-8234-dbb9b31b4264" width="40%" height="40%" /> + +## Exploration action bar + +When exploring the chart you will see a second action bar. This action bar is there to support you on this task. The +available actions that you can see are: + +- Pan +- Highlight +- Horizontal and Vertical zooms +- In-context zoom in and out + +<img src="https://images.zenhubusercontent.com/60b4ebb03f4163193ec31819/0417ad66-fcf6-42d5-9a24-e9392ec51f87" width="40%" height="40%" /> + +### Pan + +Drag your mouse/finger to the right to pan backward through time, or drag to the left to pan forward in time. Think of +it like pushing the current timeframe off the screen to see what came before or after. + +| Interaction | Keyboard | Mouse | Touchpad/touchscreen | +|:------------|:---------|:---------------|:---------------------| +| **Pan** | `n/a` | `click + drag` | `touch drag` | + +### Highlight + +Selecting timeframes is useful when you see an interesting spike or change in a chart and want to investigate further, +from looking at the same period of time on other charts/sections or triggering actions to help you troubleshoot with an +in-context action bar to help you troubleshoot (currently only available on +Single Node view). The available actions: + +- + +run [Metric Correlations](https://github.com/netdata/netdata/blob/master/docs/cloud/insights/metric-correlations.md) + +- zoom in on the selected timeframe + +[Metric Correlations](https://github.com/netdata/netdata/blob/master/docs/cloud/insights/metric-correlations.md) +will only be available if you respect the timeframe selection limitations. The selected duration pill together with the +button state helps visualize this. + +<img src="https://images.zenhubusercontent.com/60b4ebb03f4163193ec31819/2ffc157d-0f0f-402e-80bb-5ffa8a2091d5" width="50%" height="50%" /> + +<p/> + +| Interaction | Keyboard/mouse | Touchpad/touchscreen | +|:-----------------------------------|:---------------------------------------------------------|:---------------------| +| **Highlight** a specific timeframe | `Alt + mouse selection` or `⌘ + mouse selection` (macOS) | `n/a` | + +### Zoom + +Zooming in helps you see metrics with maximum granularity, which is useful when you're trying to diagnose the root cause +of an anomaly or outage. Zooming out lets you see metrics within the larger context, such as the last hour, day, or +week, which is useful in understanding what "normal" looks like, or to identify long-term trends, like a slow creep in +memory usage. + +The actions above are _normal_ vertical zoom actions. We also provide an horizontal zoom action that helps you focus on +a +specific Y-axis area to further investigate a spike or dive on your charts. + + + +| Interaction | Keyboard/mouse | Touchpad/touchscreen | +|:-------------------------------------------|:-------------------------------------|:-----------------------------------------------------| +| **Zoom** in or out | `Shift + mouse scrollwheel` | `two-finger pinch` <br />`Shift + two-finger scroll` | +| **Zoom** to a specific timeframe | `Shift + mouse vertical selection` | `n/a` | +| **Horizontal Zoom** a specific Y-axis area | `Shift + mouse horizontal selection` | `n/a` | + +You also have two direct action buttons on the exploration action bar for in-context `Zoom in` and `Zoom out`. + +## Other interactions + +### Order dimensions legend + +The bottom legend of the chart where you can see the dimensions of the chart can now be ordered by: + +- Dimension name (Ascending or Descending) +- Dimension value (Ascending or Descending) + +<img src="https://images.zenhubusercontent.com/60b4ebb03f4163193ec31819/d3031c35-37bc-46c1-bcf9-be29dea0b476" width="50%" height="50%" /> + +### Show and hide dimensions + +Hiding dimensions simplifies the chart and can help you better discover exactly which aspect of your system might be +behaving strangely. + +| Interaction | Keyboard/mouse | Touchpad/touchscreen | +|:---------------------------------------|:----------------|:---------------------| +| **Show one** dimension and hide others | `click` | `tap` | +| **Toggle (show/hide)** one dimension | `Shift + click` | `n/a` | + +### Resize + +To resize the chart, click-and-drag the icon on the bottom-right corner of any chart. To restore the chart to its +original height, +double-click the same icon. + + + +## What's next? + +We recommend you read up on the differences +between [chart dimensions, contexts, and families](https://github.com/netdata/netdata/blob/master/docs/dashboard/dimensions-contexts-families.mdx) +to strengthen your understanding of how Netdata organizes its dashboards. Another valuable way to interact with charts +is to use +the [date and time controls](https://github.com/netdata/netdata/blob/master/docs/dashboard/visualization-date-and-time-controls.mdx), +which helps you visualize specific moments of historical metrics. + +### Further reading & related information + +- Dashboard + - [How the dashboard works](https://github.com/netdata/netdata/blob/master/docs/dashboard/how-dashboard-works.mdx) + - [Chart dimensions, contexts, and families](https://github.com/netdata/netdata/blob/master/docs/dashboard/dimensions-contexts-families.mdx) + - [Date and Time controls](https://github.com/netdata/netdata/blob/master/docs/dashboard/visualization-date-and-time-controls.mdx) + - [Customize the standard dashboard](https://github.com/netdata/netdata/blob/master/docs/dashboard/customize.mdx) + - [Metric Correlations](https://github.com/netdata/netdata/blob/master/docs/cloud/insights/metric-correlations.md) + - [Netdata Agent - Interact with charts](https://github.com/netdata/netdata/blob/master/docs/dashboard/interact-charts.mdx) diff --git a/docs/cloud/visualize/kubernetes.md b/docs/cloud/visualize/kubernetes.md new file mode 100644 index 000000000..0ff839703 --- /dev/null +++ b/docs/cloud/visualize/kubernetes.md @@ -0,0 +1,154 @@ +--- +title: "Kubernetes visualizations" +description: "Netdata Cloud features rich, zero-configuration Kubernetes monitoring for the resource utilization and application metrics of Kubernetes (k8s) clusters." +custom_edit_url: "https://github.com/netdata/netdata/blob/master/docs/cloud/visualize/kubernetes.md" +sidebar_label: "Kubernetes visualizations" +learn_status: "Published" +learn_topic_type: "Concepts" +learn_rel_path: "Operations/Visualizations" +--- + +Netdata Cloud features enhanced visualizations for the resource utilization of Kubernetes (k8s) clusters, embedded in +the default [Overview](/docs/cloud/visualize/overview/) dashboard. + +These visualizations include a health map for viewing the status of k8s pods/containers, in addition to composite charts +for viewing per-second CPU, memory, disk, and networking metrics from k8s nodes. + +## Before you begin + +In order to use the Kubernetes visualizations in Netdata Cloud, you need: + +- A Kubernetes cluster running Kubernetes v1.9 or newer. +- A Netdata deployment using the latest version of the [Helm chart](https://github.com/netdata/helmchart), which + installs [v1.29.2](https://github.com/netdata/netdata/releases) or newer of the Netdata Agent. +- To connect your Kubernetes cluster to Netdata Cloud. +- To enable the feature flag described below. + +See our [Kubernetes deployment instructions](/docs/agent/packaging/installer/methods/kubernetes/) for details on +installation and connecting to Netdata Cloud. + +## Available Kubernetes metrics + +Netdata Cloud organizes and visualizes the following metrics from your Kubernetes cluster from every container: + +- `cpu_limit`: CPU utilization as a percentage of the limit defined by the [pod specification + `spec.containers[].resources.limits.cpu`](https://kubernetes.io/docs/concepts/configuration/manage-resources-containers/#resource-requests-and-limits-of-pod-and-container) + or a [`LimitRange` + object](https://kubernetes.io/docs/tasks/administer-cluster/manage-resources/cpu-default-namespace/#create-a-limitrange-and-a-pod). +- `cpu`: CPU utilization of the pod/container. 100% usage equals 1 fully-utilized core, 200% equals 2 fully-utilized + cores, and so on. +- `cpu_per_core`: CPU utilization averaged across available cores. +- `mem_usage_limit`: Memory utilization, without cache, as a percentage of the limit defined by the [pod specification + `spec.containers[].resources.limits.memory`](https://kubernetes.io/docs/concepts/configuration/manage-resources-containers/#resource-requests-and-limits-of-pod-and-container) + or a [`LimitRange` + object](https://kubernetes.io/docs/tasks/administer-cluster/manage-resources/cpu-default-namespace/#create-a-limitrange-and-a-pod). +- `mem_usage`: Used memory, without cache. +- `mem`: The sum of `cache` and `rss` (resident set size) memory usage. +- `writeback`: The size of `dirty` and `writeback` cache. +- `mem_activity`: Sum of `in` and `out` bandwidth. +- `pgfaults`: Sum of page fault bandwidth, which are raised when the Kubernetes cluster tries accessing a memory page + that is mapped into the virtual address space, but not actually loaded into main memory. +- `throttle_io`: Sum of `read` and `write` per second across all PVs/PVCs attached to the container. +- `throttle_serviced_ops`: Sum of the `read` and `write` operations per second across all PVs/PVCs attached to the + container. +- `net.net`: Sum of `received` and `sent` bandwidth per second. +- `net.packets`: Sum of `multicast`, `received`, and `sent` packets. + +When viewing the [health map](#health-map), Netdata Cloud shows the above metrics per container, or aggregated based on +their associated pods. + +When viewing the [composite charts](#composite-charts), Netdata Cloud aggregates metrics from multiple nodes, pods, or +containers, depending on the grouping chosen. For example, if you group the `cpu_limit` composite chart by +`k8s_namespace`, the metrics shown will be the average of `cpu_limit` metrics from all nodes/pods/containers that are +part of that namespace. + +## Health map + +The health map places each container or pod as a single box, then varies the intensity of its color to visualize the +resource utilization of specific k8s pods/containers. + +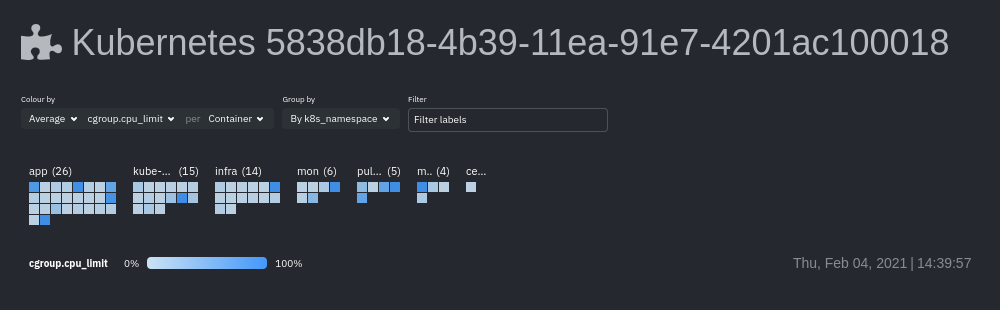 + +Change the health map's coloring, grouping, and displayed nodes to customize your experience and learn more about the +status of your k8s cluster. + +### Color by + +Color the health map by choosing an aggregate function to apply to an [available Kubernetes +metric](#available-kubernetes-metrics), then whether you to display boxes for individual pods or containers. + +The default is the _average, of CPU within the configured limit, organized by container_. + +### Group by + +Group the health map by the `k8s_cluster_id`, `k8s_controller_kind`, `k8s_controller_name`, `k8s_kind`, `k8s_namespace`, +and `k8s_node_name`. The default is `k8s_controller_name`. + +### Filtering + +Filtering behaves identically to the [node filter in War Rooms](/docs/cloud/war-rooms#node-filter), with the ability to +filter pods/containers by `container_id` and `namespace`. + +### Detailed information + +Hover over any of the pods/containers in the map to display a modal window, which contains contextual information +and real-time metrics from that resource. + +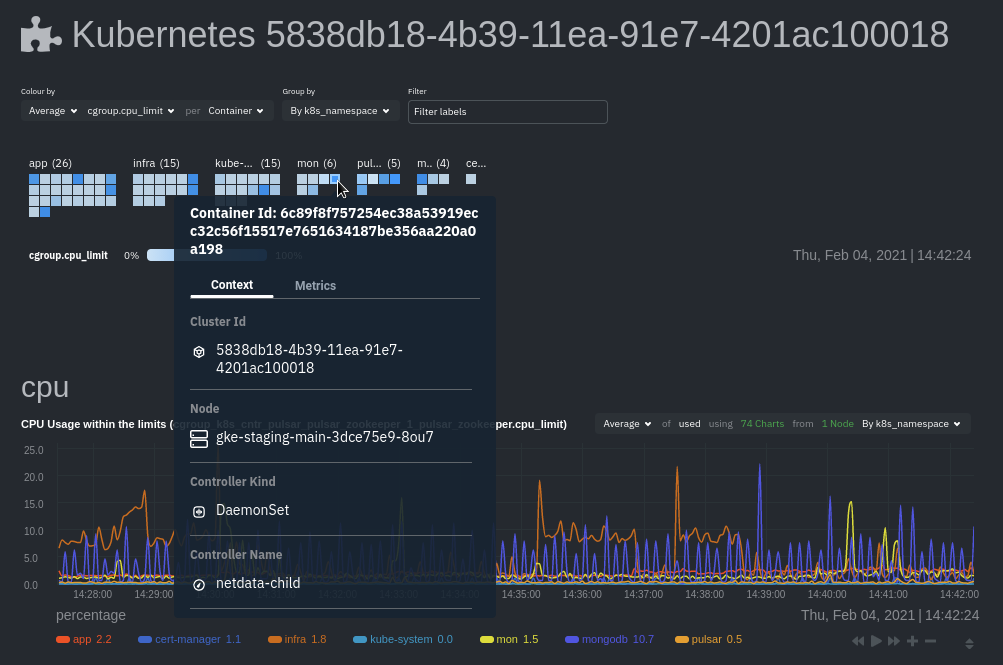 + +The **context** tab provides the following details about a container or pod: + +- Cluster ID +- Node +- Controller Kind +- Controller Name +- Pod Name +- Container +- Kind +- Pod UID + +This information helps orient you as to where the container/pod operates inside your cluster. + +The **Metrics** tab contains charts visualizing the last 15 minutes of the same metrics available in the [color by +option](#color-by). Use these metrics along with the context, to identify which containers or pods are experiencing +problematic behavior to investigate further, troubleshoot, and remediate with `kubectl` or another tool. + +## Composite charts + +The Kubernetes composite charts show real-time and historical resource utilization metrics from nodes, pods, or +containers within your Kubernetes deployment. + +See the [Overview](/docs/cloud/visualize/overview#definition-bar) doc for details on how composite charts work. These +work similarly, but in addition to visualizing _by dimension_ and _by node_, Kubernetes composite charts can also be +grouped by the following labels: + +- `k8s_cluster_id` +- `k8s_container_id` +- `k8s_container_name` +- `k8s_controller_kind` +- `k8s_kind` +- `k8s_namespace` +- `k8s_node_name` +- `k8s_pod_name` +- `k8s_pod_uid` + +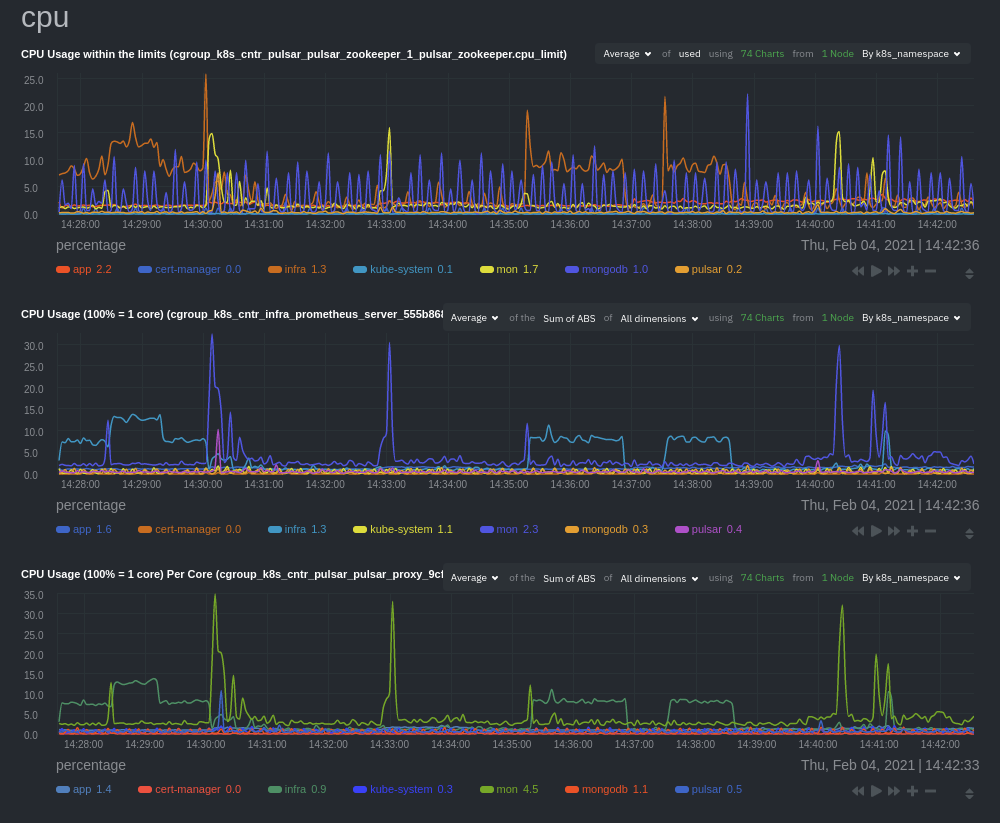 + +In addition, when you hover over a composite chart, the colors in the heat map changes as well, so you can see how +certain pod/container-level metrics change over time. + +## Caveats + +There are some caveats and known issues with Kubernetes monitoring with Netdata Cloud. + +- **No way to remove any nodes** you might have + [drained](https://kubernetes.io/docs/tasks/administer-cluster/safely-drain-node/) from your Kubernetes cluster. These + drained nodes will be marked "unreachable" and will show up in War Room management screens/dropdowns. The same applies + for any ephemeral nodes created and destroyed during horizontal scaling. + +## What's next? + +For more information about monitoring a k8s cluster with Netdata, see our guide: [_Kubernetes monitoring with Netdata: Overview and visualizations_](/guides/monitor/kubernetes-k8s-netdata/). diff --git a/docs/cloud/visualize/nodes.md b/docs/cloud/visualize/nodes.md new file mode 100644 index 000000000..9878b6b10 --- /dev/null +++ b/docs/cloud/visualize/nodes.md @@ -0,0 +1,53 @@ +--- +title: "Nodes view" +description: "See charts from all your nodes in one pane of glass, then dive in to embedded dashboards for granular troubleshooting of ongoing issues." +custom_edit_url: "https://github.com/netdata/netdata/blob/master/docs/cloud/visualize/nodes.md" +sidebar_label: "Nodes view" +learn_status: "Published" +learn_topic_type: "Concepts" +learn_rel_path: "Operations/Visualizations" +--- + +The Nodes view lets you see and customize key metrics from any number of Agent-monitored nodes and seamlessly navigate +to any node's dashboard for troubleshooting performance issues or anomalies using Netdata's highly-granular metrics. + +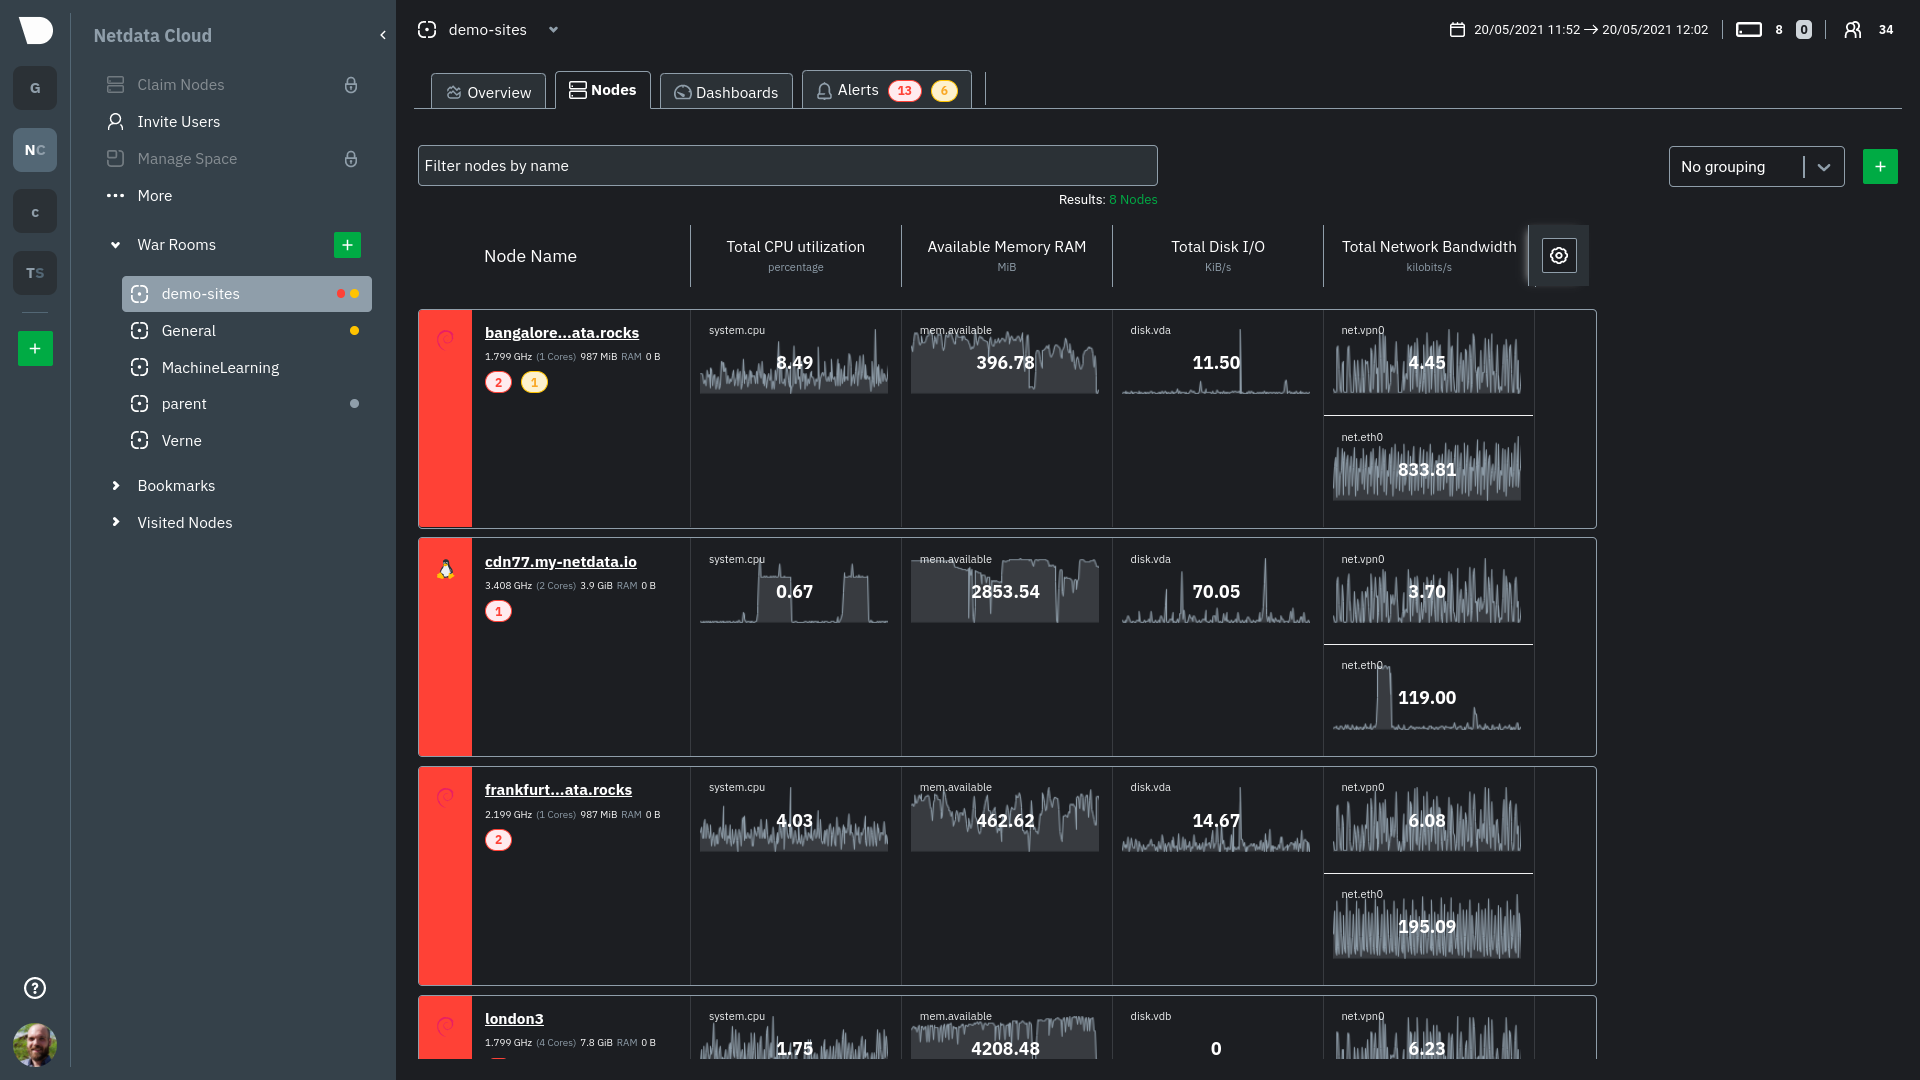 + +Each War Room's Nodes view is populated based on the nodes you added to that specific War Room. Each node occupies a +single row, first featuring that node's alarm status (yellow for warnings, red for critical alarms) and operating +system, some essential information about the node, followed by columns of user-defined key metrics represented in +real-time charts. + +Use the [Overview](https://github.com/netdata/netdata/blob/master/docs/cloud/visualize/overview.md) for monitoring an infrastructure in real time using +composite charts and Netdata's familiar dashboard UI. + +Check the [War Room docs](https://github.com/netdata/netdata/blob/master/docs/cloud/war-rooms.md) for details on the utility bar, which contains the [node +filter](https://github.com/netdata/netdata/blob/master/docs/cloud/war-rooms.md#node-filter) and the [timeframe +selector](https://github.com/netdata/netdata/blob/master/docs/cloud/war-rooms.md#play-pause-force-play-and-timeframe-selector). + +## Add and customize metrics columns + +Add more metrics columns by clicking the gear icon. Choose the context you'd like to add, give it a relevant name, and +select whether you want to see all dimensions (the default), or only the specific dimensions your team is interested in. + +Click the gear icon and hover over any existing charts, then click the pencil icon. This opens a panel to +edit that chart. Edit the context, its title, add or remove dimensions, or delete the chart altogether. + +These customizations appear for anyone else with access to that War Room. + +## See more metrics in Netdata Cloud + +If you want to add more metrics to your War Rooms and they don't show up when you add new metrics to Nodes, you likely +need to configure those nodes to collect from additional data sources. See our [collectors doc](https://github.com/netdata/netdata/blob/master/docs/collect/enable-configure.md) +to learn how to use dozens of pre-installed collectors that can instantly collect from your favorite services and applications. + +If you want to see up to 30 days of historical metrics in Cloud (and more on individual node dashboards), read our guide +on [long-term storage of historical metrics](https://github.com/netdata/netdata/blob/master/docs/guides/longer-metrics-storage.md). Also, see our +[calculator](/docs/store/change-metrics-storage#calculate-the-system-resources-RAM-disk-space-needed-to-store-metrics) +for finding the disk and RAM you need to store metrics for a certain period of time. + +## What's next? + +Now that you know how to view your nodes at a glance, learn how to [track active +alarms](https://github.com/netdata/netdata/blob/master/docs/cloud/alerts-notifications/view-active-alerts.mdx) with the Alerts Smartboard. diff --git a/docs/cloud/visualize/overview.md b/docs/cloud/visualize/overview.md new file mode 100644 index 000000000..35c07656a --- /dev/null +++ b/docs/cloud/visualize/overview.md @@ -0,0 +1,250 @@ +--- +title: "Home, Overview and Single Node view" +description: >- + "The Home tab automatically presents relevant information of your War Room, the Overview uses composite + charts from all the nodes in a given War Room and Single Node view provides a look at a specific Node" +custom_edit_url: "https://github.com/netdata/netdata/blob/master/docs/cloud/visualize/overview.md" +sidebar_label: "Home, Overview and Single Node view" +learn_status: "Published" +learn_topic_type: "Concepts" +learn_rel_path: "Operations/Visualizations" +--- + +## Home + +The Home tab provides a predefined dashboard of relevant information about entities in the War Room. + +This tab will +automatically present summarized information in an easily digestible display. You can see information about your +nodes, data collection and retention stats, alerts, users and dashboards. + +## Overview + +The Overview tab is another great way to monitor infrastructure using Netdata Cloud. While the interface might look +similar to local +dashboards served by an Agent Overview uses **composite charts**. +These charts display real-time aggregated metrics from all the nodes (or a filtered selection) in a given War Room. + +With Overview's composite charts, you can see your infrastructure from a single pane of glass, discover trends or +anomalies, then drill down by grouping metrics by node and jumping to single-node dashboards for root cause analysis. + +## Single Node view + +The Single Node view dashboard engine is the same as the Overview, meaning that it also uses **composite charts**, and +displays real-time aggregated metrics from a specific node. + +As mentioned above, the interface is similar to local dashboards served by an Agent but this dashboard also uses * +*composite charts** which, in the case of a single node, will aggregate +multiple chart _instances_ belonging to a context into a single chart. For example, on `disk.io` context it will get +into a single chart an aggregated view of each disk the node has. + +Further tools provided in composite chart [definiton bar](/docs/cloud/visualize/overview#definition-bar) will allow you +to explore in more detail what is happening on each _instance_. + +## Before you get started + +Only nodes with v1.25.0-127 or later of the the [open-source Netdata](https://github.com/netdata/netdata) monitoring +agent can contribute to composite charts. If your node(s) use an earlier version of Netdata, you will see them marked as +**needs upgrade** in various dropdowns. + +See our [update docs](https://github.com/netdata/netdata/blob/master/packaging/installer/UPDATE.md) for the preferred +update method based on how you installed +Netdata. + +## Composite charts + +The Overview uses composite charts, which aggregate metrics from all the nodes (or a filtered selection) in a given War +Room. + +## Definition bar + +Each composite chart has a definition bar to provide information about the following: + +* Grouping option +* Aggregate function to be applied in case multiple data sources exist +* Instances +* Nodes +* Dimensions, and +* Aggregate function over time to be applied if one point in the chart consists of multiple data points aggregated + +### Group by dimension, node, or chart + +Click on the **dimension** dropdown to change how a composite chart groups metrics. + +The default option is by _dimension_, so that each line/area in the visualization is the aggregation of a single +dimension. +This provides a per dimension view of the data from all the nodes in the War Room, taking into account filtering +criteria if defined. + +A composite chart grouped by _node_ visualizes a single metric across contributing nodes. If the composite chart has +five +contributing nodes, there will be five lines/areas. This is typically an absolute value of the sum of the dimensions +over each node but there +are some opinionated-but-valuable exceptions where a specific dimension is selected. +Grouping by nodes allows you to quickly understand which nodes in your infrastructure are experiencing anomalous +behavior. + +A composite chart grouped by _instance_ visualizes each instance of one software or hardware on a node and displays +these as a separate dimension. By grouping the +`disk.io` chart by _instance_, you can visualize the activity of each disk on each node that contributes to the +composite +chart. + +Another very pertinent example is composite charts over contexts related to cgroups (VMs and containers). You have the +means to change the default group by or apply filtering to +get a better view into what data your are trying to analyze. For example, if you change the group by to _instance_ you +get a view with the data of all the instances (cgroups) that +contribute to that chart. Then you can use further filtering tools to focus the data that is important to you and even +save the result to your own dashboards. + + + +### Aggregate functions over data sources + +Each chart uses an opinionated-but-valuable default aggregate function over the data sources. For example, +the `system.cpu` chart shows the +average for each dimension from every contributing chart, while the `net.net` chart shows the sum for each dimension +from every contributing chart, which can also come from multiple networking interfaces. + +The following aggregate functions are available for each selected dimension: + +- **Average**: Displays the average value from contributing nodes. If a composite chart has 5 nodes with the following + values for the `out` dimension—`-2.1`, `-5.5`, `-10.2`, `-15`, `-0.1`—the composite chart displays a + value of `−6.58`. +- **Sum**: Displays the sum of contributed values. Using the same nodes, dimension, and values as above, the composite + chart displays a metric value of `-32.9`. +- **Min**: Displays a minimum value. For dimensions with positive values, the min is the value closest to zero. For + charts with negative values, the min is the value with the largest magnitude. +- **Max**: Displays a maximum value. For dimensions with positive values, the max is the value with the largest + magnitude. For charts with negative values, the max is the value closet to zero. + +### Dimensions + +Select which dimensions to display on the composite chart. You can choose **All dimensions**, a single dimension, or any +number of dimensions available on that context. + +### Instances + +Click on **X Instances** to display a dropdown of instances and nodes contributing to that composite chart. Each line in +the +dropdown displays an instance name and the associated node's hostname. + +### Nodes + +Click on **X Nodes** to display a dropdown of nodes contributing to that composite chart. Each line displays a hostname +to help you identify which nodes contribute to a chart. You can also use this component to filter nodes directly on the +chart. + +If one or more nodes can't contribute to a given chart, the definition bar shows a warning symbol plus the number of +affected nodes, then lists them in the dropdown along with the associated error. Nodes might return errors because of +networking issues, a stopped `netdata` service, or because that node does not have any metrics for that context. + +### Aggregate functions over time + +When the granularity of the data collected is higher than the plotted points on the chart an aggregation function over +time +is applied. By default the aggregation applied is _average_ but the user can choose different options from the +following: + +* Min +* Max +* Average +* Sum +* Incremental sum (Delta) +* Standard deviation +* Median +* Single exponential smoothing +* Double exponential smoothing +* Coefficient variation +* Trimmed Median `*` +* Trimmed Mean `*` +* Percentile `**` + +:::info + +- `*` For **Trimmed Median and Mean** you can choose the percentage of data tha you want to focus on: 1%, 2%, 3%, 5%, + 10%, 15%, 20% and 25%. +- `**` For **Percentile** you can specify the percentile you want to focus on: 25th, 50th, 75th, 80th, 90th, 95th, 97th, + 98th and 99th. + +::: + +For more details on each, you can refer to our Agent's HTTP API details +on [Data Queries - Data Grouping](/docs/agent/web/api/queries#data-grouping). + +### Reset to defaults + +Click on the 3-dot icon (**⋮**) on any chart, then **Reset to Defaults**, to reset the definition bar to its initial +state. + +## Jump to single-node dashboards + +Click on **X Charts**/**X Nodes** to display one of the two dropdowns that list the charts and nodes contributing to a +given composite chart. For example, the nodes dropdown. + +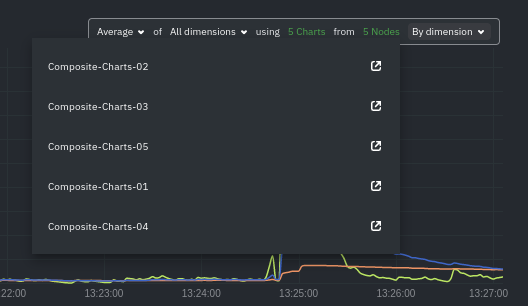 + +To jump to a single-node dashboard, click on the link icon <img class="img__inline img__inline--link" +src="https://user-images.githubusercontent.com/1153921/95762109-1d219300-0c62-11eb-8daa-9ba509a8e71c.png" /> next to the +node you're interested in. + +The single-node dashboard opens in a new tab. From there, you can continue to troubleshoot or run [Metric +Correlations](https://github.com/netdata/netdata/blob/master/docs/cloud/insights/metric-correlations.md) for faster root +cause analysis. + +## Add composite charts to a dashboard + +Click on the 3-dot icon (**⋮**) on any chart, then click on **Add to Dashboard**. Click the **+** button for any +dashboard you'd like to add this composite chart to, or create a new dashboard an initiate it with your chosen chart by +entering the name and clicking **New Dashboard**. + +## Interacting with composite charts: pan, zoom, and resize + +You can interact with composite charts as you would with other Netdata charts. You can use the controls beneath each +chart to pan, zoom, or resize the chart, or use various combinations of the keyboard and mouse. See +the [chart interaction doc](https://github.com/netdata/netdata/blob/master/docs/dashboard/interact-charts.mdx) for +details. + +## Menu + +The Overview uses a similar menu to local Agent dashboards and single-node dashboards in Netdata Cloud, with sections +and sub-menus aggregated from every contributing node. For example, even if only two nodes actively collect from and +monitor an Apache web server, the **Apache** section still appears and displays composite charts from those two nodes. + +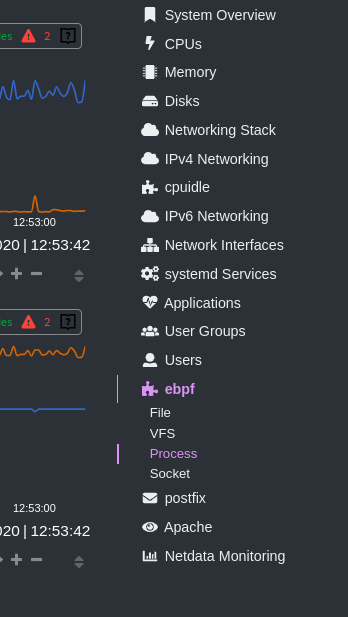 + +One difference between the Overview's menu and those found in single-node dashboards or local Agent dashboards is that +the Overview condenses multiple services, families, or instances into single sections, sub-menus, and associated charts. + +For services, let's say you have two concurrent jobs with the [web_log +collector](https://github.com/netdata/go.d.plugin/blob/master/modules/weblog/README.md), one for Apache and another for +Nginx. A single-node or +local dashboard shows two section, **web_log apache** and **web_log nginx**, whereas the Overview condenses these into a +single **web_log** section containing composite charts from both jobs. + +The Overview also consdenses multiple families or multiple instances into a single **all** sub-menu and associated +charts. For example, if Node A has 5 disks, and Node B has 3, each disk contributes to a single `disk.io` composite +chart. The utility bar should show that there are 8 charts from 2 nodes contributing to that chart. + +This action applies to disks, network devices, and other metric types that involve multiple instances of a piece of +hardware or software. The Overview currently does not display metrics from filesystems. Read more about [families and +instances](https://github.com/netdata/netdata/blob/master/docs/dashboard/dimensions-contexts-families.mdx) + +## Persistence of composite chart settings + +When you change a composite chart via its definition bar, Netdata Cloud persists these settings in a query string +attached to the URL in your browser. You can "save" these settings by bookmarking this particular URL, or share it with +colleagues by having them copy-paste it into their browser. + +## What's next? + +For another way to view an infrastructure from a high level, see +the [Nodes view](https://github.com/netdata/netdata/blob/master/docs/cloud/visualize/nodes.md). + +If you need a refresher on how Netdata's charts work, see our doc +on [interacting with charts](https://github.com/netdata/netdata/blob/master/docs/dashboard/interact-charts.mdx). + +Or, get more granular with configuring how you monitor your infrastructure +by [building new dashboards](https://github.com/netdata/netdata/blob/master/docs/cloud/visualize/dashboards.md). diff --git a/docs/cloud/war-rooms.md b/docs/cloud/war-rooms.md new file mode 100644 index 000000000..99f9e3680 --- /dev/null +++ b/docs/cloud/war-rooms.md @@ -0,0 +1,162 @@ +--- +title: "War Rooms" +description: >- + "Netdata Cloud uses War Rooms to group related nodes and create insightful compositedashboards based on + their aggregate health and performance." +custom_edit_url: "https://github.com/netdata/netdata/blob/master/docs/cloud/war-rooms.md" +sidebar_label: "War Rooms" +learn_status: "Published" +learn_topic_type: "Tasks" +learn_rel_path: "Operations" +--- + +War Rooms organize your connected nodes and provide infrastructure-wide dashboards using real-time metrics and +visualizations. + +Once you add nodes to a Space, all of your nodes will be visible in the _All nodes_ War Room. This is a special War Room +which gives you an overview of all of your nodes in this particular space. Then you can create functional separations of +your nodes into more War Rooms. Every War Room has its own dashboards, navigation, indicators, and management tools. + + + +## Navigation + +### Switching between views - static tabs + +Every War Rooms provides multiple views. Each view focus on a particular area/subject of the nodes which you monitor in +this War Rooms. Let's explore what view you have available: + +- The default view for any War Room is + the [Home tab](https://github.com/netdata/netdata/blob/master/docs/cloud/visualize/overview.md#home), which give you + an overview + of this space. Here you can see the number of Nodes claimed, data retention statics, user particate, alerts and more + +- The second and most important view is + the [Overview tab](https://github.com/netdata/netdata/blob/master/docs/cloud/visualize/overview.md#overview) which + uses composite + charts to display real-time metrics from every available node in a given War Room. + +- The [Nodes tab](https://github.com/netdata/netdata/blob/master/docs/cloud/visualize/nodes.md) gives you the ability to + see the status (offline or online), host details + , alarm status and also a short overview of some key metrics from all your nodes at a glance. + +- [Kubernetes tab](https://github.com/netdata/netdata/blob/master/docs/cloud/visualize/kubernetes.md) is a logical + grouping of charts regards to your Kubernetes clusters. + It contains a subset of the charts available in the _Overview tab_ + +- + +The [Dashboards tab](https://github.com/netdata/netdata/blob/master/docs/cloud/visualize/dashboards.md) +gives you the ability to have tailored made views of +specific/targeted interfaces for your infrastructure using any number of charts from any number of nodes. + +- The **Alerts tab** provides you with an overview for all the active alerts you receive for the nodes in this War Room, + you can also see alla the alerts that are configured to be triggered in any given moment. + +- The **Anomalies tab** is dedicated to + the [Anomaly Advisor](https://github.com/netdata/netdata/blob/master/docs/cloud/insights/anomaly-advisor.mdx) tool + +### Non static tabs + +If you open +a [new dashboard](https://github.com/netdata/netdata/blob/master/docs/cloud/visualize/dashboards.md), +jump to a single-node dashboard, or navigate to a dedicated alert page they will open in a new War Room tab. + +Tabs can be rearranged with drag-and-drop or closed with the **X** button. Open tabs persist between sessions, so you +can always come right back to your preferred setup. + +### Play, pause, force play, and timeframe selector + +A War Room has three different states: playing, paused, and force playing. The default playing state refreshes charts +every second as long as the browser tab is in +focus. [Interacting with a chart](https://github.com/netdata/netdata/blob/master/docs/dashboard/interact-charts.mdx) +pauses +the War Room. Once the tab loses focus, charts pause automatically. + +The top navigation bar features a play/pause button to quickly change the state, and a dropdown to select **Force Play** +, which keeps charts refreshing, potentially at the expense of system performance. + +Next to the play/pause button is the timeframe selector, which helps you select a precise window of metrics data to +visualize. By default, all visualizations in Netdata Cloud show the last 15 minutes of metrics data. + +Use the **Quick Selector** to visualize metrics from predefined timeframes, or use the input field below to enter a +number and an appropriate unit of time. The calendar allows you to select multiple days of metrics data. + +Click **Apply** to re-render all visualizations with new metrics data streamed to your browser from each distributed +node. Click **Clear** to remove any changes and apply the default 15-minute timeframe. + +The fields beneath the calendar display the beginning and ending timestamps your selected timeframe. + +### Node filter + +The node filter allows you to quickly filter the nodes visualized in a War Room's views. It appears on all views, but +not on single-node dashboards. + +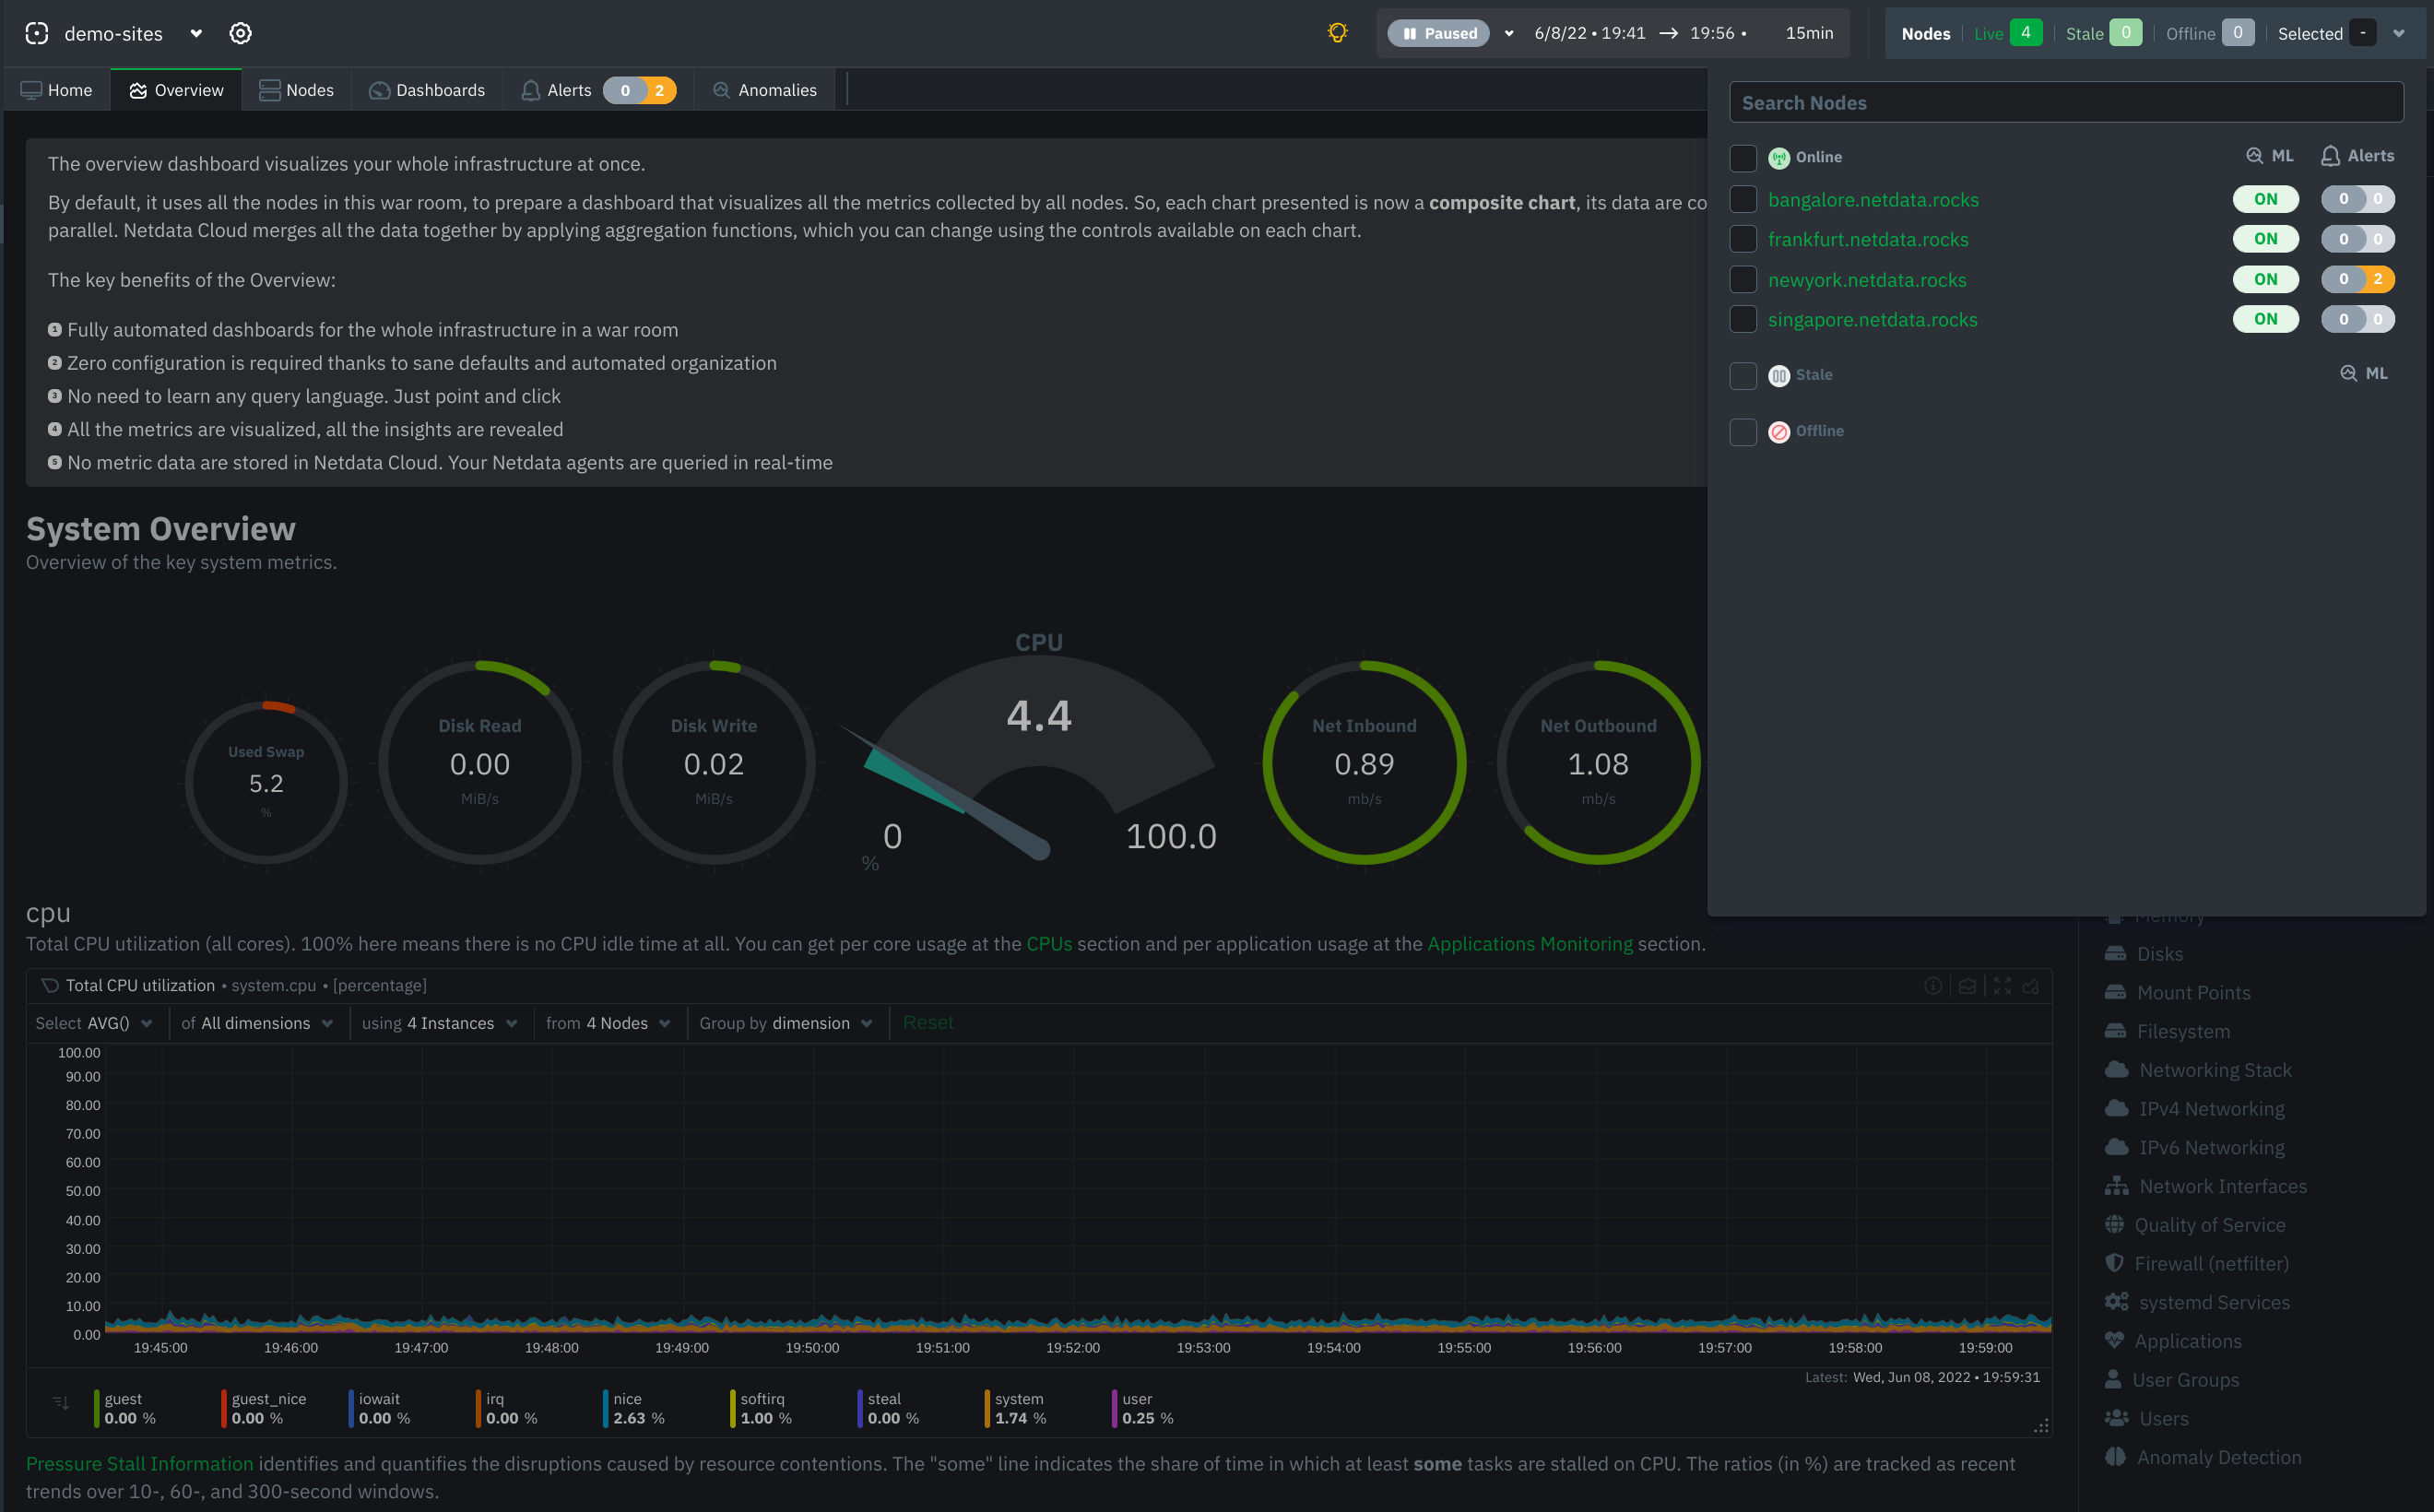 + +## War Room organization + +We recommend a few strategies for organizing your War Rooms. + +**Service, purpose, location, etc.**: You can group War Rooms by a service (think Nginx, MySQL, Pulsar, and so on), +their purpose (webserver, database, application), their physical location, whether they're baremetal or a Docker +container, the PaaS/cloud provider it runs on, and much more. This allows you to see entire slices of your +infrastructure by moving from one War Room to another. + +**End-to-end apps/services**: If you have a user-facing SaaS product, or an internal service that said product relies +on, you may want to monitor that entire stack in a single War Room. This might include Kubernetes clusters, Docker +containers, proxies, databases, web servers, brokers, and more. End-to-end War Rooms are valuable tools for ensuring the +health and performance of your organization's essential services. + +**Incident response**: You can also create new War Rooms as one of the first steps in your incident response process. +For example, you have a user-facing web app that relies on Apache Pulsar for a message queue, and one of your nodes +using the [Pulsar collector](https://github.com/netdata/go.d.plugin/blob/master/modules/pulsar/README.md) begins +reporting a suspiciously low messages rate. You can create a War Room called `$year-$month-$day-pulsar-rate`, add all +your Pulsar nodes in addition to nodes they connect to, and begin diagnosing the root cause in a War Room optimized for +getting to resolution as fast as possible. + +## Add War Rooms + +To add new War Rooms to any Space, click on the green plus icon **+** next the **War Rooms** heading. on the left ( +space's) sidebar. + +In the panel, give the War Room a name and description, and choose whether it's public or private. Anyone in your Space +can join public War Rooms, but can only join private War Rooms with an invitation. + +## Manage War Rooms + +All the users and nodes involved in a particular space can potential be part of a War Room. + +Any user can change simple settings of a War room, like the name or the users participating in it. Click on the gear +icon of the War Room's name in the top of the page to do that. A sidebar will open with options for this War Room: + +1. To _change a War Room's name, description, or public/private status_, click on **War Room** tab of the sidebar. + +2. To _include an existing node_ to a War Room or _connect a new node*_ click on **Nodes** tab of the sidebar. Choose + any + connected node you want to add to this War Room by clicking on the checkbox next to its hostname, then click **+ Add + ** + at the top of the panel. + +3. To _add existing users to a War Room_, click on **Add Users**. See + our [invite doc](https://github.com/netdata/netdata/blob/master/docs/cloud/manage/invite-your-team.md) + for details on inviting new users to your Space in Netdata Cloud. + +:::note +\* This action requires admin rights for this space +::: + +### More actions + +To _view or remove nodes_ in a War Room, click on **Nodes view**. To remove a node from the current War Room, click on +the **🗑** icon. + +:::info +Removing a node from a War Room does not remove it from your Space. +::: + +## What's next? + +Once you've figured out an organizational structure that works for your team, learn more about how you can use Netdata +Cloud to monitor distributed nodes +using [real-time composite charts](https://github.com/netdata/netdata/blob/master/docs/cloud/visualize/overview.md). |