
diff options
Diffstat (limited to 'docs/cloud')
14 files changed, 480 insertions, 221 deletions
diff --git a/docs/cloud/alerts-notifications/add-discord-notification.md b/docs/cloud/alerts-notifications/add-discord-notification.md index d1769f0e2..3edf5002b 100644 --- a/docs/cloud/alerts-notifications/add-discord-notification.md +++ b/docs/cloud/alerts-notifications/add-discord-notification.md @@ -8,7 +8,7 @@ To enable Discord notifications you need: - A Netdata Cloud account - Access to the space as an **administrator** -- Have a Discord server able to receive webhook integrations. For mode details check [how to configure this on Discord](#settings-on-discord) +- Have a Discord server able to receive webhook integrations. For more details check [how to configure this on Discord](#settings-on-discord) ## Steps diff --git a/docs/cloud/alerts-notifications/add-mattermost-notification-configuration.md b/docs/cloud/alerts-notifications/add-mattermost-notification-configuration.md new file mode 100644 index 000000000..79bc98619 --- /dev/null +++ b/docs/cloud/alerts-notifications/add-mattermost-notification-configuration.md @@ -0,0 +1,51 @@ +# Add Mattermost notification configuration + +From the Cloud interface, you can manage your space's notification settings and from these you can add a specific configuration to get notifications delivered on Mattermost. + +## Prerequisites + +To add Mattermost notification configurations you need: + +- A Netdata Cloud account +- Access to the space as an **administrator** +- Space needs to be on **Business** plan or higher +- Have a Mattermost app on your workspace to receive the webhooks, for more details check [how to configure this on Mattermost](#settings-on-mattermost) + +## Steps + +1. Click on the **Space settings** cog (located above your profile icon) +1. Click on the **Notification** tab +1. Click on the **+ Add configuration** button (near the top-right corner of your screen) +1. On the **Mattermost** card click on **+ Add** +1. A modal will be presented to you to enter the required details to enable the configuration: + 1. **Notification settings** are Netdata specific settings + - Configuration name - you can optionally provide a name for your configuration you can easily refer to it + - Rooms - by specifying a list of Rooms you are select to which nodes or areas of your infrastructure you want to be notified using this configuration + - Notification - you specify which notifications you want to be notified using this configuration: All Alerts and unreachable, All Alerts, Critical only + 1. **Integration configuration** are the specific notification integration required settings, which vary by notification method. For Mattermost: + - Webhook URL - URL provided on Mattermost for the channel you want to receive your notifications. For more details check [how to configure this on Mattermost](#settings-on-mattermost) + +## Settings on Mattermost + +To enable the webhook integrations on Mattermost you need: +1. In Mattermost, go to Product menu > Integrations > Incoming Webhook. + +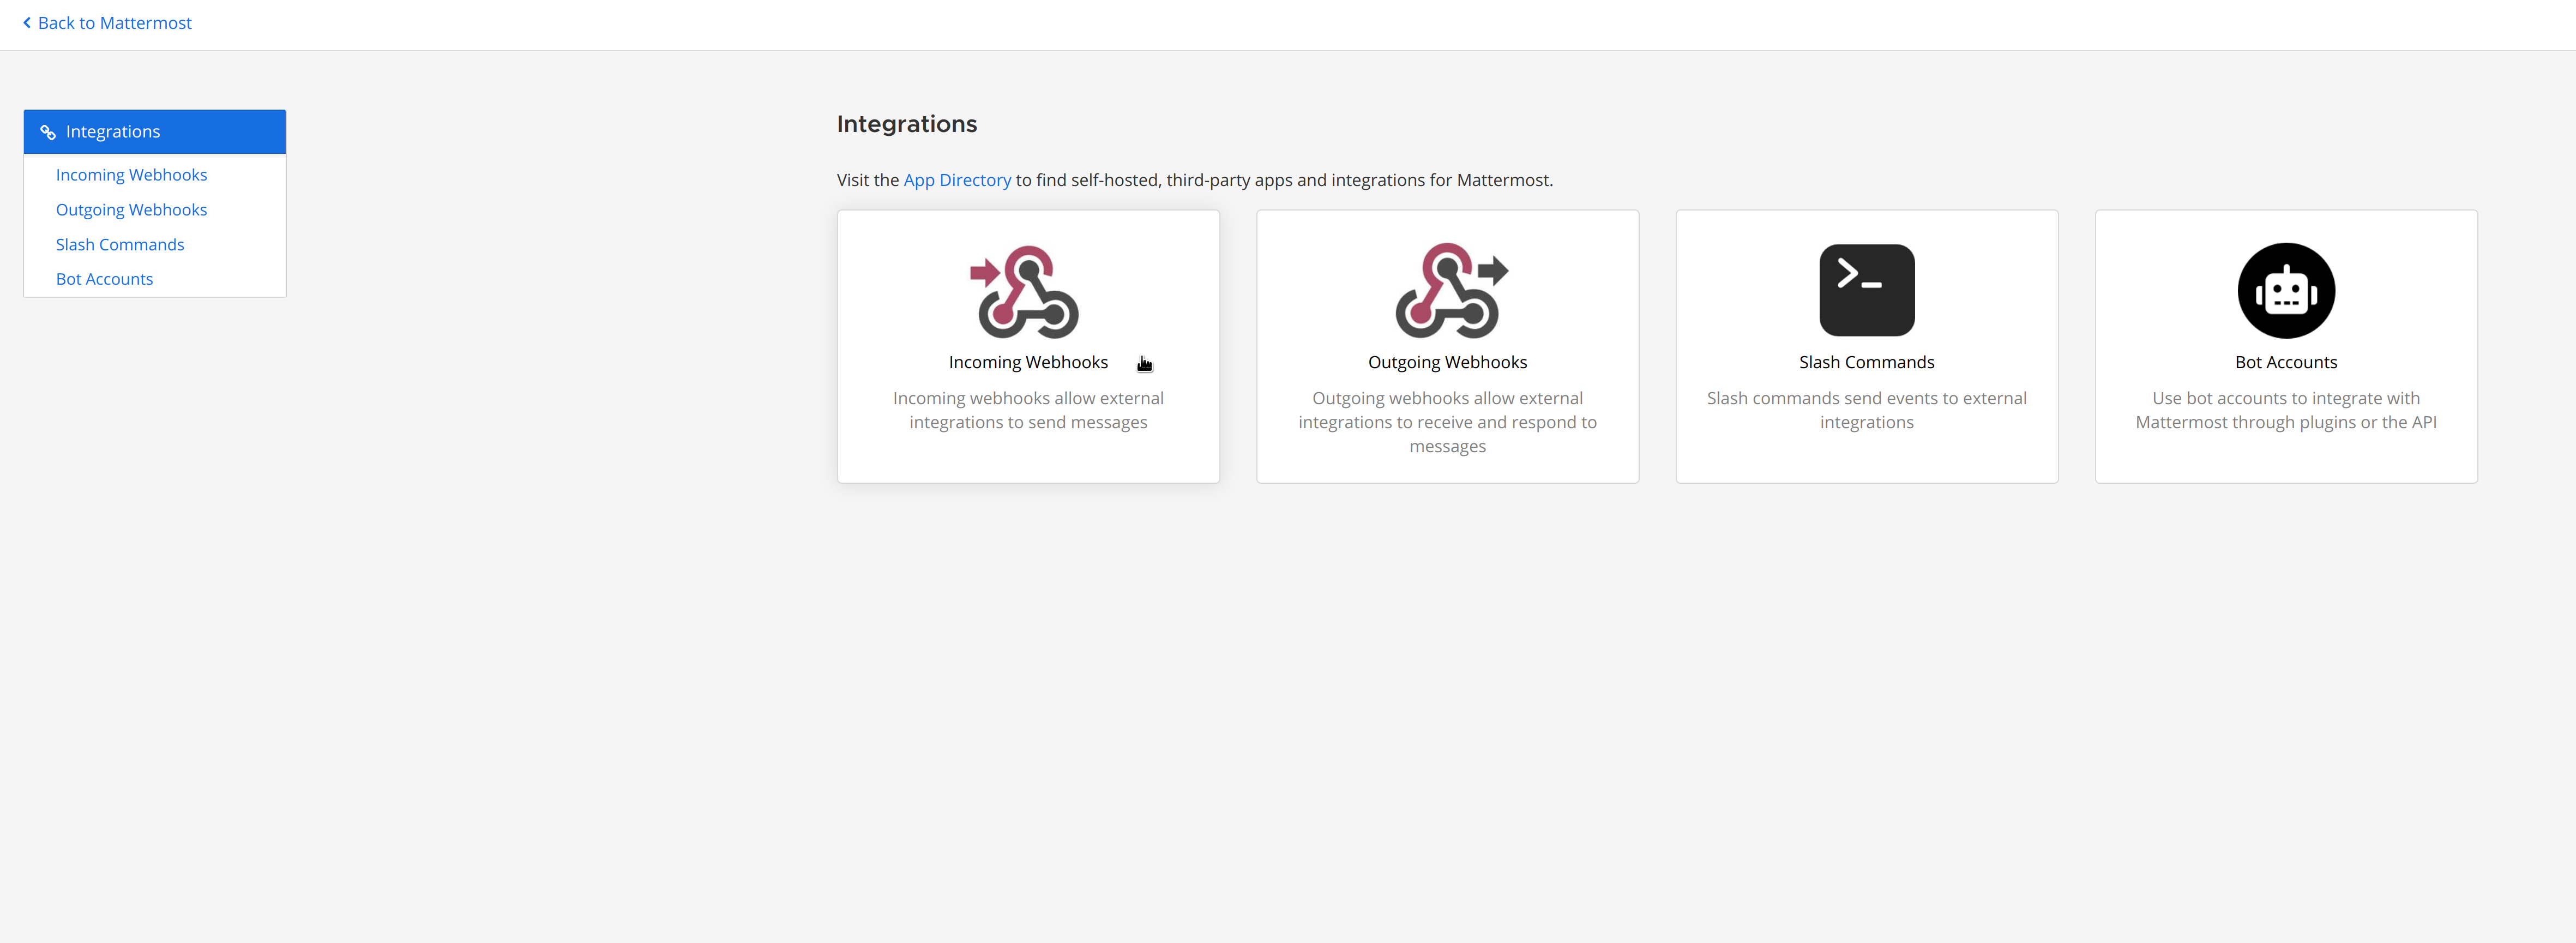 + + - If you don’t have the Integrations option, incoming webhooks may not be enabled on your Mattermost server or may be disabled for non-admins. They can be enabled by a System Admin from System Console > Integrations > Integration Management. Once incoming webhooks are enabled, continue with the steps below + +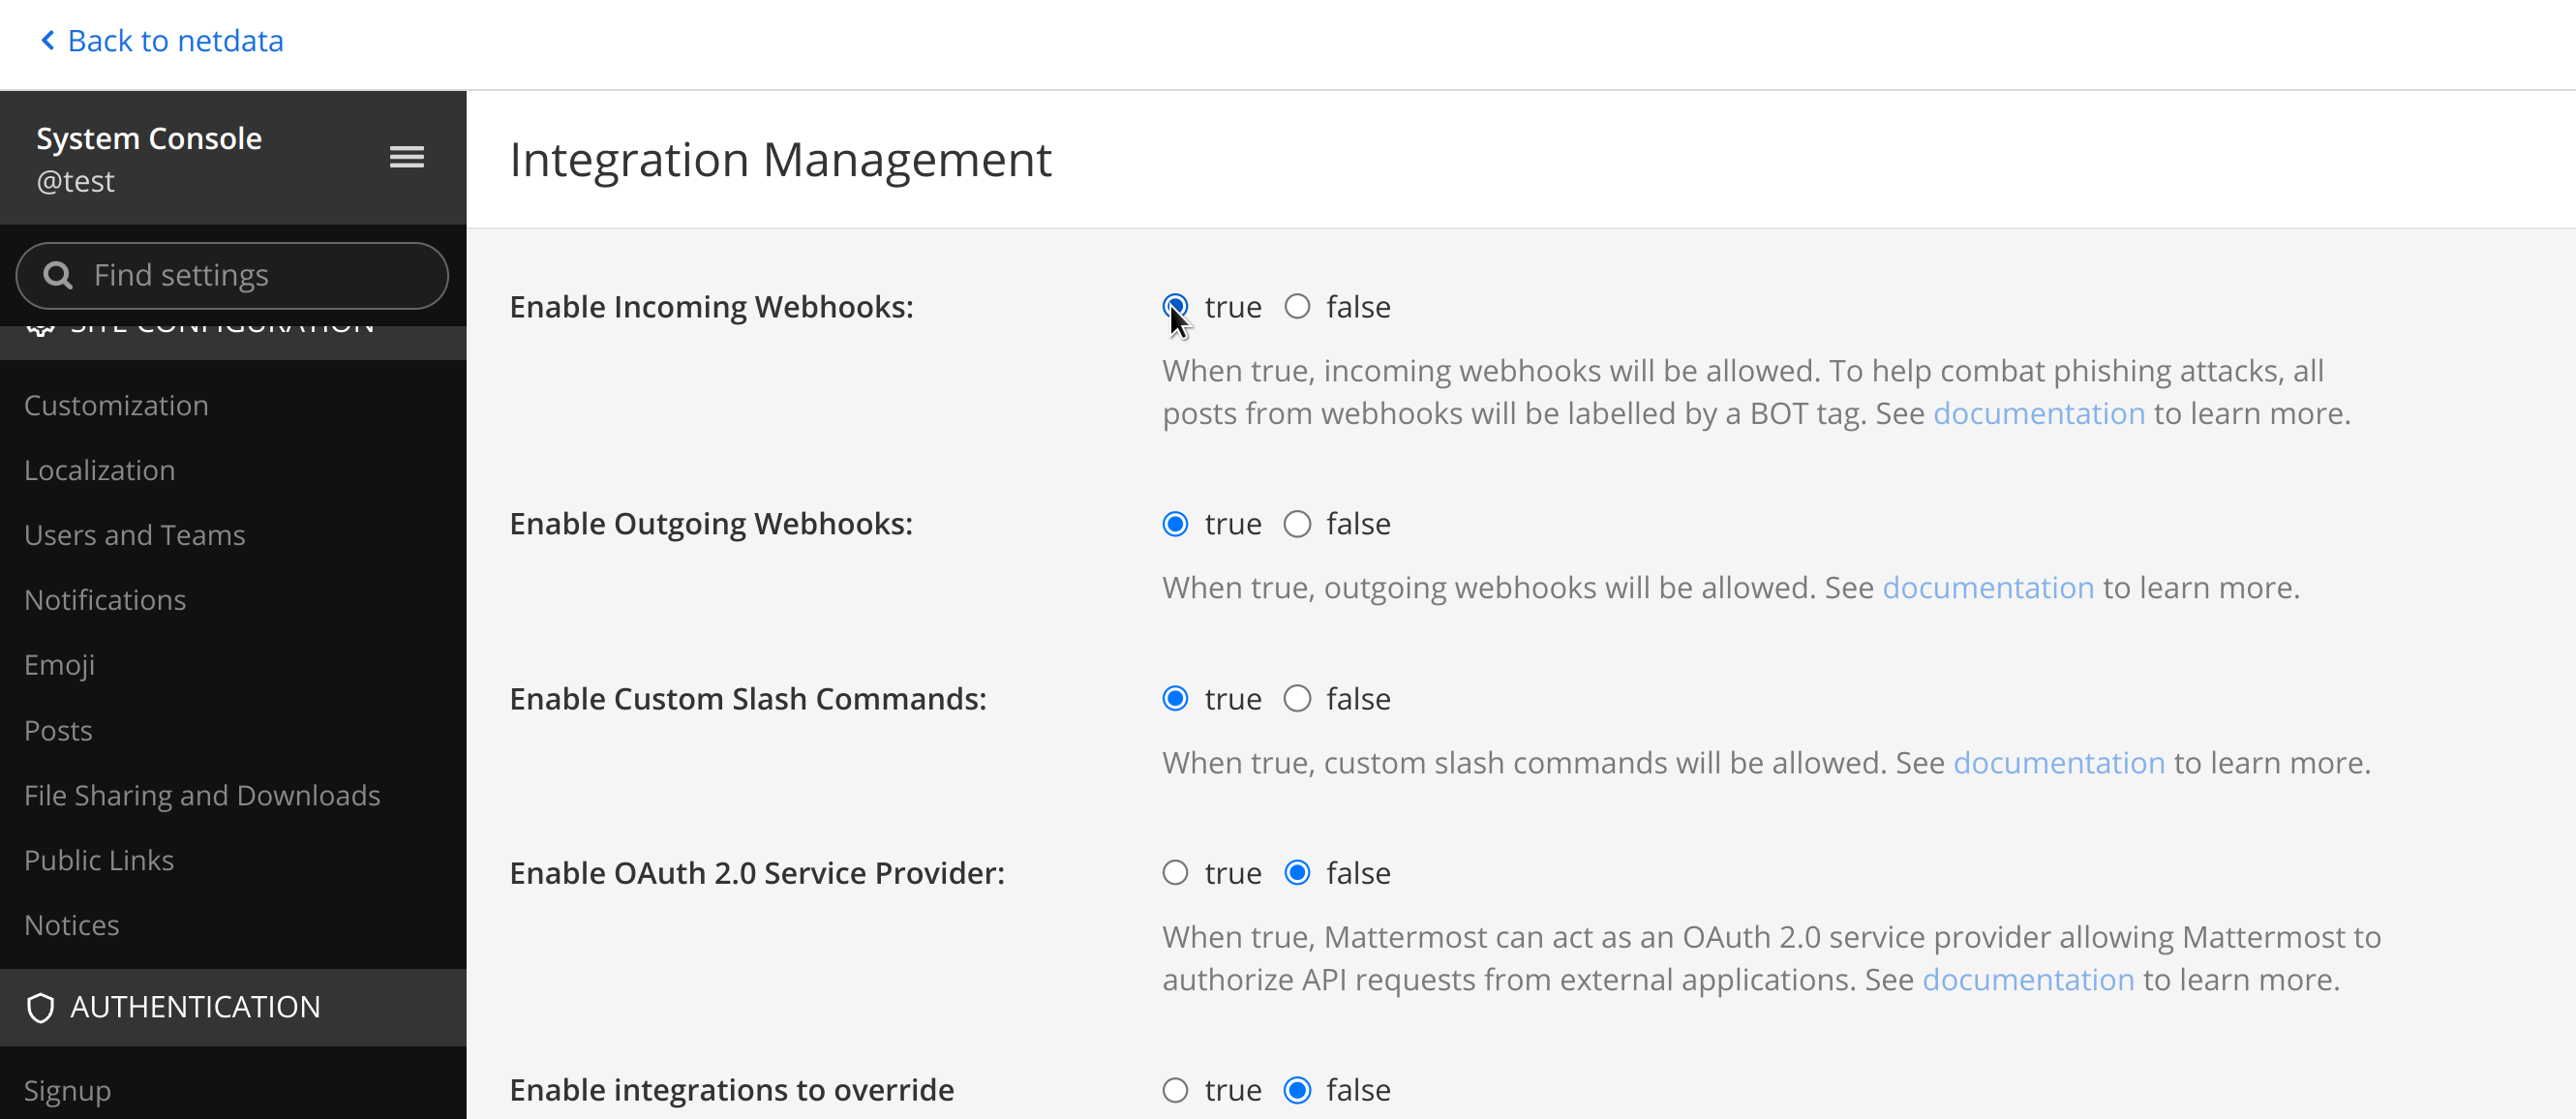 + +2. Select Add Incoming Webhook and add a name and description for the webhook. The description can be up to 500 characters + +3. Select the channel to receive webhook payloads, then select Add to create the webhook + +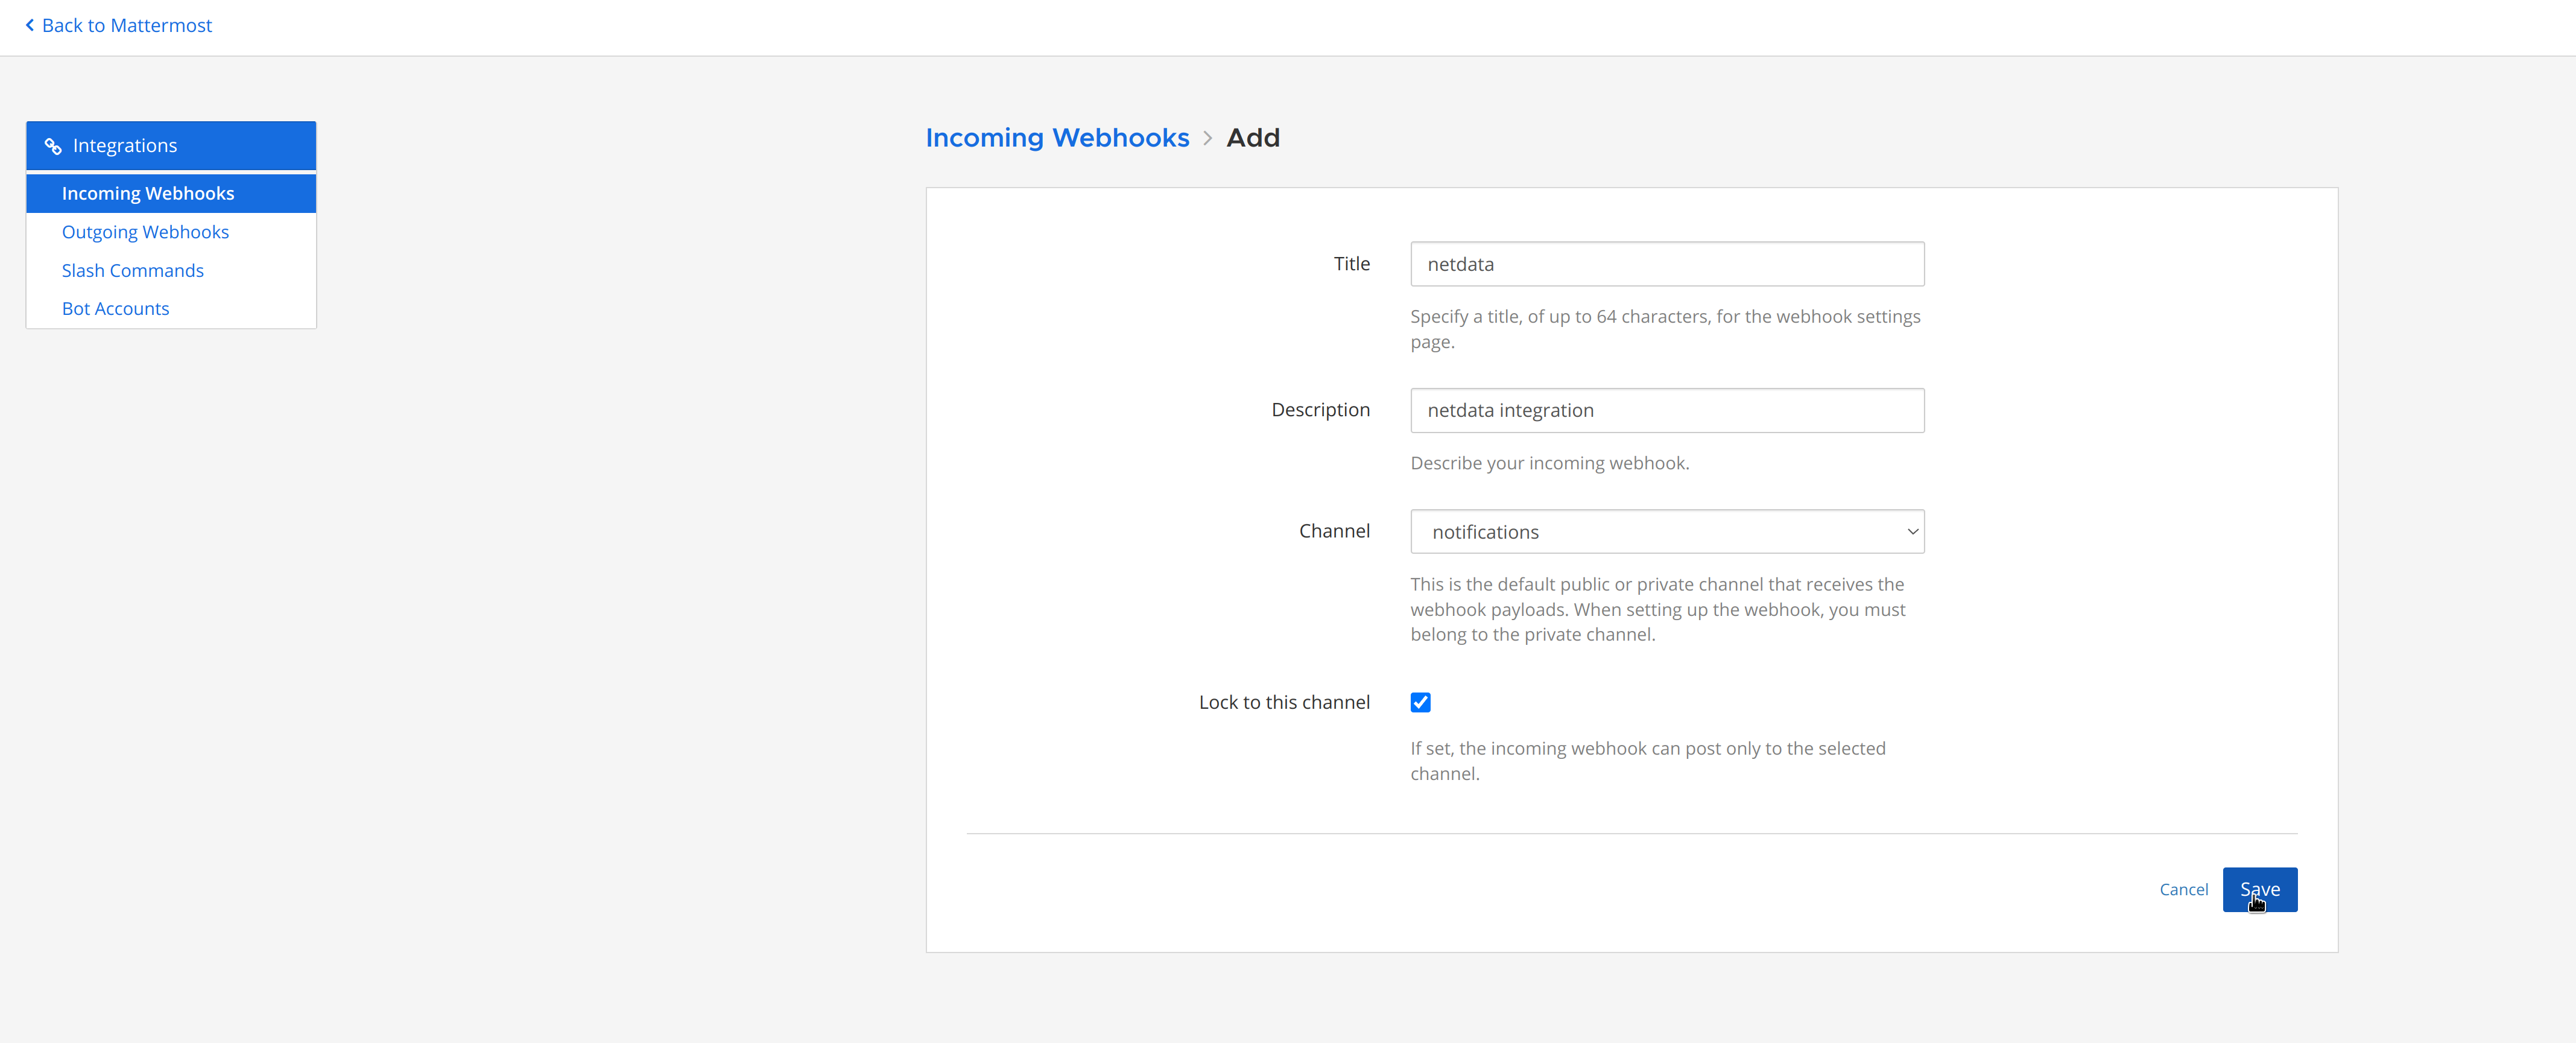 + +4. You will end up with a webhook endpoint that looks like so: +``` +https://your-mattermost-server.com/hooks/xxx-generatedkey-xxx +``` + - Treat this endpoint as a secret. Anyone who has it will be able to post messages to your Mattermost instance. + +For more details please check Mattermost's article [Incoming webhooks for Mattermost](https://developers.mattermost.com/integrate/webhooks/incoming/). diff --git a/docs/cloud/alerts-notifications/add-opsgenie-notification-configuration.md b/docs/cloud/alerts-notifications/add-opsgenie-notification-configuration.md index 28e526c90..0a80311ef 100644 --- a/docs/cloud/alerts-notifications/add-opsgenie-notification-configuration.md +++ b/docs/cloud/alerts-notifications/add-opsgenie-notification-configuration.md @@ -4,7 +4,7 @@ From the Cloud interface, you can manage your space's notification settings and ## Prerequisites -To add Opsgenie notification configurations you need +To add Opsgenie notification configurations you need: - A Netdata Cloud account - Access to the space as an **administrator** @@ -34,4 +34,4 @@ To enable the Netdata integration on Opsgenie you need: 1. Pick **API** from available integrations. Copy your API Key and press **Save Integration**. -1. Paste copied API key into the corresponding field in **Integration configuration** section of Opsgenie modal window in Netdata.
\ No newline at end of file +1. Paste copied API key into the corresponding field in **Integration configuration** section of Opsgenie modal window in Netdata. diff --git a/docs/cloud/alerts-notifications/add-pagerduty-notification-configuration.md b/docs/cloud/alerts-notifications/add-pagerduty-notification-configuration.md index 64880ebe3..eec4f94c1 100644 --- a/docs/cloud/alerts-notifications/add-pagerduty-notification-configuration.md +++ b/docs/cloud/alerts-notifications/add-pagerduty-notification-configuration.md @@ -4,12 +4,12 @@ From the Cloud interface, you can manage your space's notification settings and ## Prerequisites -To add PagerDuty notification configurations you need +To add PagerDuty notification configurations you need: - A Cloud account - Access to the space as and **administrator** - Space needs to be on **Business** plan or higher -- Have a PagerDuty service to receive events, for mode details check [how to configure this on PagerDuty](#settings-on-pagerduty) +- Have a PagerDuty service to receive events, for more details check [how to configure this on PagerDuty](#settings-on-pagerduty) ## Steps diff --git a/docs/cloud/alerts-notifications/add-slack-notification-configuration.md b/docs/cloud/alerts-notifications/add-slack-notification-configuration.md index 99bb2d5b5..ed845b4d3 100644 --- a/docs/cloud/alerts-notifications/add-slack-notification-configuration.md +++ b/docs/cloud/alerts-notifications/add-slack-notification-configuration.md @@ -4,12 +4,12 @@ From the Cloud interface, you can manage your space's notification settings and ## Prerequisites -To add discord notification configurations you need +To add slack notification configurations you need: - A Netdata Cloud account - Access to the space as an **administrator** - Space needs to be on **Business** plan or higher -- Have a Slack app on your workspace to receive the webhooks, for mode details check [how to configure this on Slack](#settings-on-slack) +- Have a Slack app on your workspace to receive the webhooks, for more details check [how to configure this on Slack](#settings-on-slack) ## Steps @@ -34,7 +34,7 @@ To enable the webhook integrations on Slack you need: - On your app go to **Incoming Webhooks** and click on **activate incoming webhooks** 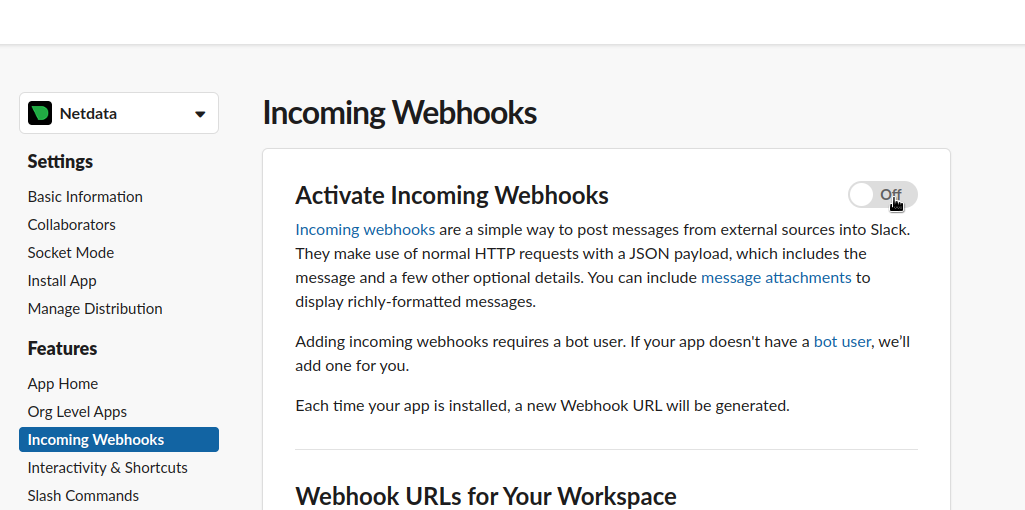 - + - At the bottom of **Webhook URLs for Your Workspace** section you have **Add New Webhook to Workspace** - After pressing that specify the channel where you want your notifications to be delivered diff --git a/docs/cloud/alerts-notifications/add-webhook-notification-configuration.md b/docs/cloud/alerts-notifications/add-webhook-notification-configuration.md index 0140c30fd..21d1b6ed8 100644 --- a/docs/cloud/alerts-notifications/add-webhook-notification-configuration.md +++ b/docs/cloud/alerts-notifications/add-webhook-notification-configuration.md @@ -4,12 +4,12 @@ From the Cloud interface, you can manage your space's notification settings and ## Prerequisites -To add discord notification configurations you need +To add webhook notification configurations you need: - A Netdata Cloud account - Access to the space as an **administrator** - Space needs to be on **Pro** plan or higher -- Have an app that allows you to receive webhooks following a predefined schema, for mode details check [how to create the webhook service](#webhook-service) +- Have an app that allows you to receive webhooks following a predefined schema, for more details check [how to create the webhook service](#webhook-service) ## Steps @@ -24,8 +24,8 @@ To add discord notification configurations you need - Notification - you specify which notifications you want to be notified using this configuration: All Alerts and unreachable, All Alerts, Critical only 1. **Integration configuration** are the specific notification integration required settings, which vary by notification method. For webhook: - Webhook URL - webhook URL is the url of the service that Netdata will send notifications to. In order to keep the communication secured, we only accept HTTPS urls. Check [how to create the webhook service](#webhook-service). - - Extra headers - these are optional key-value pairs that you can set to be included in the HTTP requests sent to the webhook URL. For mode details check [Extra headers](#extra-headers) - - Authentication Mechanism - Netdata webhook integration supports 3 different authentication mechanisms. For mode details check [Authentication mechanisms](#authentication-mechanisms): + - Extra headers - these are optional key-value pairs that you can set to be included in the HTTP requests sent to the webhook URL. For more details check [Extra headers](#extra-headers) + - Authentication Mechanism - Netdata webhook integration supports 3 different authentication mechanisms. For more details check [Authentication mechanisms](#authentication-mechanisms): - Mutual TLS (recommended) - default authentication mechanism used if no other method is selected. - Basic - the client sends a request with an Authorization header that includes a base64-encoded string in the format **username:password**. These will settings will be required inputs. - Bearer - the client sends a request with an Authorization header that includes a **bearer token**. This setting will be a required input. @@ -134,7 +134,7 @@ nsjoQAm6OwpTN5362vE9SYu1twz7KdzBlUkDhePEOgQkWfLHBJWwB+PvB1j/cUA3 ```bash server { listen 443 ssl default_server; - + # ... existing SSL configuration for server authentication ... ssl_verify_client on; ssl_client_certificate /path/to/Netdata_CA.pem; diff --git a/docs/cloud/alerts-notifications/manage-alert-notification-silencing-rules.md b/docs/cloud/alerts-notifications/manage-alert-notification-silencing-rules.md new file mode 100644 index 000000000..b9806c6fa --- /dev/null +++ b/docs/cloud/alerts-notifications/manage-alert-notification-silencing-rules.md @@ -0,0 +1,58 @@ +# Manage alert notification silencing rules + +From the Cloud interface, you can manage your space's alert notification silencing rules settings as well as allow users to define their personal ones. + +## Prerequisites + +To manage **space's alert notification silencing rule settings**, you will need the following: + +- A Netdata Cloud account +- Access to the space as an **administrator** or **manager** (**troubleshooters** can only view space rules) + + +To manage your **personal alert notification silencing rule settings**, you will need the following: + +- A Netdata Cloud account +- Access to the space with any roles except **billing** + +### Steps + +1. Click on the **Space settings** cog (located above your profile icon) +1. Click on the **Alert & Notification** tab on the left hand-side +1. Click on the **Notification Silencing Rules** tab +1. You will be presented with a table of the configured alert notification silencing rules for: + * the space (if aren't an **observer**) + * yourself + + You will be able to: + 1. **Add a new** alert notification silencing rule configuration. + - Choose if it applies to **All users** or **Myself** (All users is only available for **administrators** and **managers**) + - You need to provide a name for the configuration so you can easily refer to it + - Define criteria for Nodes: To which Rooms will this apply? What Nodes? Does it apply to host labels key-value pairs? + - Define criteria for Alerts: Which alert name is being targeted? What alert context? Will it apply to a specific alert role? + - Define when it will be applied: + - Immediately, from now till until it is turned off or until a specific duration (start and end date automatically set) + - Scheduled, you specify the start and end time for when the rule becomes active and then inactive (time is set according to your browser local timezone) + Note: You are only able to add a rule if your space is on a [paid plan](https://github.com/netdata/netdata/edit/master/docs/cloud/manage/plans.md). + 1. **Edit an existing** alert notification silencing rule configurations. You will be able to change: + - The name provided for it + - Who it applies to + - Selection criteria for Nodes and Alert + - When it will be applied + 1. **Enable/Disable** a given alert notification silencing rule configuration. + - Use the toggle to enable or disable + 1. **Delete an existing** alert notification silencing rule. + - Use the trash icon to delete your configuration + +## Silencing rules examples + +| Rule name | War Rooms | Nodes | Host Label | Alert name | Alert context | Alert role | Description | +| :-- | :-- | :-- | :-- | :-- | :-- | :-- | :--| +| Space silencing | All Rooms | * | * | * | * | * | This rule silences the entire space, targets all nodes and for all users. E.g. infrastructure wide maintenance window. | +| DB Servers Rooms | PostgreSQL Servers | * | * | * | * | * | This rules silences the nodes in the room named PostgreSQL Servers, for example it doesn't silence the `All Nodes` room. E.g. My team with membership to this room doesn't want to receive notifications for these nodes. | +| Node child1 | All Rooms | `child1` | * | * | * | * | This rule silences all alert state transitions for node `child1` on all rooms and for all users. E.g. node could be going under maintenance. | +| Production nodes | All Rooms | * | `environment:production` | * | * | * | This rule silences all alert state transitions for nodes with the host label key-value pair `environment:production`. E.g. Maintenance window on nodes with specific host labels. | +| Third party maintenance | All Rooms | * | * | `httpcheck_posthog_netdata_cloud.request_status` | * | * | This rule silences this specific alert since third party partner will be undergoing maintenance. | +| Intended stress usage on CPU | All Rooms | * | * | * | `system.cpu` | * | This rule silences specific alerts across all nodes and their CPU cores. | +| Silence role webmaster | All Rooms | * | * | * | * | `webmaster` | This rule silences all alerts configured with the role `webmaster`. | +| Silence alert on node | All Rooms | `child1` | * | `httpcheck_posthog_netdata_cloud.request_status` | * | * | This rule silences the specific alert on the `child1` node. | diff --git a/docs/cloud/alerts-notifications/manage-notification-methods.md b/docs/cloud/alerts-notifications/manage-notification-methods.md index 17c7f879a..f61b6bf6f 100644 --- a/docs/cloud/alerts-notifications/manage-notification-methods.md +++ b/docs/cloud/alerts-notifications/manage-notification-methods.md @@ -27,7 +27,8 @@ Notes: ### Steps 1. Click on the **Space settings** cog (located above your profile icon) -1. Click on the **Notification** tab +1. Click on the **Alerts & Notification** tab on the left hand-side +1. Click on the **Notification Methods** tab 1. You will be presented with a table of the configured notification methods for the space. You will be able to: 1. **Add a new** notification method configuration. - Choose the service from the list of the available ones, you'll may see a list of unavailable options if your plan doesn't allow some of them (you will see on the @@ -42,7 +43,7 @@ Notes: - Service specific inputs 1. **Enable/Disable** a given notification method configuration. - Use the toggle to enable or disable the notification method configuration - 1. **Delete an existing** notification method configuartion. Netdata provided ones can't be deleted, e.g. Email + 1. **Delete an existing** notification method configuration. Netdata provided ones can't be deleted, e.g. Email - Use the trash icon to delete your configuration ## Manage user notification settings diff --git a/docs/cloud/alerts-notifications/notifications.md b/docs/cloud/alerts-notifications/notifications.md index 94cd2dc3f..ad115d43f 100644 --- a/docs/cloud/alerts-notifications/notifications.md +++ b/docs/cloud/alerts-notifications/notifications.md @@ -31,7 +31,7 @@ or add new alert that you see in Netdata Cloud, and receive via centralized aler </Callout> -### Alert notifications +## Alert notifications Netdata Cloud can send centralized alert notifications to your team whenever a node enters a warning, critical, or unreachable state. By enabling notifications, you ensure no alert, on any node in your infrastructure, goes unnoticed by you or your team. @@ -51,9 +51,9 @@ All users in a Space can personalize their notifications settings, for Personal > ⚠️ Netdata Cloud supports different notification methods and their availability will depend on the plan you are at. > For more details check [Service classification](#service-classification) or [netdata.cloud/pricing](https://www.netdata.cloud/pricing). -#### Service level +### Service level -##### Personal +#### Personal The notifications methods classified as **Personal** are what we consider generic, meaning that these can't have specific rules for them set by the administrators. @@ -63,7 +63,7 @@ manage what specific configurations they want for the Space / Room(s) and the de One example of such a notification method is the E-mail. -##### System +#### System For **System** notification methods, the destination of the channel will be a target that usually isn't specific to a single user, e.g. slack channel. @@ -72,23 +72,49 @@ different targets depending on Rooms or Notification level settings. Some examples of such notification methods are: Webhook, PagerDuty, Slack. -#### Service classification +### Service classification -##### Community +#### Community Notification methods classified as Community can be used by everyone independent on the plan your space is at. These are: Email and discord -##### Pro +#### Pro Notification methods classified as Pro are only available for **Pro** and **Business** plans These are: webhook -##### Business +#### Business Notification methods classified as Business are only available for **Business** plans These are: PagerDuty, Slack, Opsgenie +## Silencing Alert notifications + +Netdata Cloud provides you a Silencing Rule engine which allows you to mute alert notifications. This muting action is specific to alert state transition notifications, it doesn't include node unreachable state transitions. + +The Silencing Rule engine is flexible and allows you to enter silence rules for the two main entities involved on alert notifications and can be set using different attributes. The main entities you can enter are **Nodes** and **Alerts** which can be used in combination or isolation to target specific needs - see some examples [here](https://github.com/netdata/netdata/blob/master/docs/cloud/alerts-notifications/manage-alert-notification-silencing-rules.md#silencing-rules-examples). + +### Scope definition for Nodes +* **Space:** silencing the space, selecting `All Rooms`, silences all alert state transitions from any node claimed to the space. +* **War Room:** silencing a specific room will silence all alert state transitions from any node in that room. Please note if the node belongs to +another room which isn't silenced it can trigger alert notifications to the users with membership to that other room. +* **Node:** silencing a specific node can be done for the entire space, selecting `All Rooms`, or for specific war room(s). The main difference is +if the node should be silenced for the entire space or just for specific rooms (when specific rooms are selected only users with membership to that room won't receive notifications). + +### Scope definition for Alerts +* **Alert name:** silencing a specific alert name silences all alert state transitions for that specific alert. +* **Alert context:** silencing a specific alert context will silence all alert state transitions for alerts targeting that chart context, for more details check [alert configuration docs](https://github.com/netdata/netdata/blob/master/health/REFERENCE.md#alarm-line-on). +* **Alert role:** silencing a specific alert role will silence all the alert state transitions for alerts that are configured to be specific role recipients, for more details check [alert configuration docs](https://github.com/netdata/netdata/blob/master/health/REFERENCE.md#alarm-line-to). + +Beside the above two main entities there are another two important settings that you can define on a silencing rule: +* Who does the rule affect? **All user** in the space or **Myself** +* When does is to apply? **Immediately** or on a **Schedule** (when setting immediately you can set duration) + +For further help on setting alert notification silencing rules go to [Manage Alert Notification Silencing Rules](https://github.com/netdata/netdata/blob/master/docs/cloud/alerts-notifications/manage-alert-notification-silencing-rules.md). + +> ⚠️ This feature is only available for [Netdata paid plans](https://github.com/netdata/netdata/edit/master/docs/cloud/manage/plans.md). + ## Flood protection If a node has too many state changes like firing too many alerts or going from reachable to unreachable, Netdata Cloud diff --git a/docs/cloud/insights/events-feed.md b/docs/cloud/insights/events-feed.md index 0e297ba81..a56877ab1 100644 --- a/docs/cloud/insights/events-feed.md +++ b/docs/cloud/insights/events-feed.md @@ -21,10 +21,30 @@ At a high-level view, these are the domains from which the Events feed will prov | **Domains of events** | **Community** | **Pro** | **Business** | | :-- | :-- | :-- | :-- | -| **Auditing events** - COMING SOON<br/>Events related to actions done on your Space, e.g. invite user, change user role or change plan.| 4 hours | 7 days | 90 days | +| **[Auditing events](#auditing-events)** - <br/>Events related to actions done on your Space, e.g. invite user, change user role or change plan.| 4 hours | 7 days | 90 days | | **[Topology events](#topology-events)**<br/>Node state transition events, e.g. live or offline.| 4 hours | 7 days | 14 days | | **[Alert events](#alert-events)**<br/>Alert state transition events, can be seen as an alert history log.| 4 hours | 7 days | 90 days | +### Auditing events + +| **Event name** | **Description** | **Example** | +| :-- | :-- | :-- | +| Space Created | The space was created.| Space `Acme Space` was **created** | +| Room Created | A room was created on the Space.| Room `DB Servers` was **created** by `John Doe` | +| Room Deleted | A room was deleted from the Space. | Room `DB servers` was **deleted** by `John Doe` | +| User Invited to Space | A user was invited to join the Space.| User `John Smith` was **invited** to this space by `Alan Doe` | +| User Uninvited from Space | An invitation for a user to join the space was revoked.| User `John Smith` was **uninvited** from this space | +| User Added to Space | A user was added to the Space from an invitation (user accepted the invitation).| User `John Smith` was **added** to this space by invite of `Alan Doe` | +| User Removed from Space | A user was added to the Space from an invitation. | User `John Smith` was **removed** from this space by `Alan Doe` | +| User Added to Room | A user was added to a room on the Space. | User `John Smith` was **added** to room `DB servers` | +| User Removed from Room | A user was removed from a room on the Space. | User `John Smith` was **removed** from room `DB Servers` by `Alan Doe` | +| User Space Properties Changed | The properties of a user on the Space have changed, e.g. change user role | User role for `John Smith` was **changed** to `troubleshooter` by `Alan Doe` | +| Node Added To Room | The node was added to a room on the Space. | Node `ip-xyz.ec2.internal` was **added** to room `DB Servers` by `John Doe` | +| Node Removed To Room | The node was removed from a room on the Space. | Node `ip-xyz.ec2.internal` was **removed** from room `DB Servers` by `John Doe` | +| Silencing Rule Created | A new alert notification silencing rule was created on the Space. | Silencing rule `DB Servers schedule silencing` on rooms `All nodes` and `DB Servers` was **created** by `John Smith` | +| Silencing Rule Changed | An existing alert notification silencing rule was modified on the Space. | Silencing rule `DB Servers schedule silencing` on rooms `All nodes` and `DB Servers` was **changed** by `John Doe` | +| Silencing Rule Deleted | An existing alert notifications silencing rule was removed from the Space. | Silencing rule `DB Servers schedule silencing` on rooms `All nodes` and `DB Servers` was **changed** by `Alan Smith` | + ### Topology events | **Event name** | **Description** | **Example** | diff --git a/docs/cloud/manage/plans.md b/docs/cloud/manage/plans.md index 9180ab5a0..23077f898 100644 --- a/docs/cloud/manage/plans.md +++ b/docs/cloud/manage/plans.md @@ -19,7 +19,7 @@ The plan is an attribute that is directly attached to your space(s) and that dic Netdata Cloud plans, with the exception of Community, work as subscriptions and overall consist of two pricing components: -* A flat fee component, that is a price per space, and +* A flat fee component, that is applied on yearly subscriptions for the [comitted-nodes](#committed-nodes) charte (space subscription fee has been waived off) * An on-demand metered component, that is related to your usage of Netdata which directly links to the [number of nodes you have running](#running-nodes-and-billing) Netdata provides two billing frequency options: @@ -55,16 +55,13 @@ If, for a given month, your usage is over these committed nodes we will charge t It is ok to change your mind. We allow to change your plan, billing frequency or adjust the committed nodes, on yearly plans, at any time. -To achieve this you will need to: +To achieve this you can check the [Update plan](https://github.com/netdata/netdata/blob/master/docs/cloud/manage/view-plan-billing.md#update-plan) section. -* Move to the Community plan, where we will cancel the current subscription and: - * Issue a credit to you for the unused period, in case you are on a **yearly plan** - * Charge you only for the current used period and issue a credit for the unused period related to the flat fee, in case you are on a **monthly plan** -* Select the new subscription with the change that you want - -> ⚠️ On a move to Community (cancellation of an active subscription), please note that you will have all your notification methods configurations active **for a period of 24 hours**. +> ⚠️ On a downgrade (going to a new plan with less benefits) or cancellation of an active subscription, please note that you will have all your notification methods configurations active **for a period of 24 hours**. > After that, any notification methods unavailable in your new plan at that time will be automatically disabled. You can always re-enable them once you move to a paid plan that includes them. +> ⚠️ Downgrade or cancellation may affect users in your Space. Please check what roles are available on the [each plans](https://github.com/netdata/netdata/blob/master/docs/cloud/manage/plans.md#areas-impacted-by-plans). Users with unavailable roles on the new plan will immediately have restricted access to the Space. + > ⚠️ Any credit given to you will be available to use on future paid subscriptions with us. It will be available until the the **end of the following year**. ### Areas impacted by plans @@ -104,7 +101,13 @@ The plan on your space will determine what type of notifications methods will be * **Pro** - Email, Discord and webhook * **Business** - Unlimited, this includes Slack, PagerDuty, Opsgenie etc. -For mode details check the documentation under [Alert Notifications](https://github.com/netdata/netdata/blob/master/docs/cloud/alerts-notifications/notifications.md). +For more details check the documentation under [Alert Notifications](https://github.com/netdata/netdata/blob/master/docs/cloud/alerts-notifications/notifications.md#alert-notifications). + +##### Alert notification silencing rules + +The plan on your space will determine if you are able to add alert notification silencing rules since this feature will only be available for paid plans: **Pro** or **Business**. + +For more details check the documentation under [Alert Notifications](https://github.com/netdata/netdata/blob/master/docs/cloud/alerts-notifications/notifications.md#silencing-alert-notifications). ### Related Topics diff --git a/docs/cloud/manage/role-based-access.md b/docs/cloud/manage/role-based-access.md index 1696e0964..a0b387749 100644 --- a/docs/cloud/manage/role-based-access.md +++ b/docs/cloud/manage/role-based-access.md @@ -84,6 +84,13 @@ In more detail, you can find on the following tables which functionalities are a | Edit configuration | :heavy_check_mark: | - | - | - | - | - | Some exceptions apply depending on [service level](https://github.com/netdata/netdata/blob/master/docs/cloud/alerts-notifications/manage-notification-methods.md#available-actions-per-notification-methods-based-on-service-level) | | Delete configuration | :heavy_check_mark: | - | - | - | - | - | | | Edit personal level notification settings | :heavy_check_mark: | :heavy_check_mark: | :heavy_check_mark: | :heavy_check_mark: | :heavy_check_mark: | :heavy_check_mark: | [Manage user notification settings](https://github.com/netdata/netdata/blob/master/docs/cloud/alerts-notifications/manage-notification-methods.md#manage-user-notification-settings) | +| See space alert notification silencing rules | :heavy_check_mark: | :heavy_check_mark: | :heavy_check_mark: | - | - | - | | +| Add new space alert notification silencing rule | :heavy_check_mark: | :heavy_check_mark: | - | - | - | - | | +| Enable/Disable space alert notification silencing rule | :heavy_check_mark: | :heavy_check_mark: | - | - | - | - | | +| Edit space alert notification silencing rule | :heavy_check_mark: | :heavy_check_mark: | - | - | - | - | | +| Delete space alert notification silencing rule | :heavy_check_mark: | :heavy_check_mark: | - | - | - | - | | +| See, add, edit or delete personal level alert notification silencing rule | :heavy_check_mark: | :heavy_check_mark: | :heavy_check_mark: | :heavy_check_mark: | - | - | | + Notes: * Enable, Edit and Add actions over specific notification methods will only be allowed if your plan has access to those ([service classification](https://github.com/netdata/netdata/blob/master/docs/cloud/alerts-notifications/notifications.md#service-classification)) diff --git a/docs/cloud/manage/view-plan-billing.md b/docs/cloud/manage/view-plan-billing.md index d29f93f98..5d381f952 100644 --- a/docs/cloud/manage/view-plan-billing.md +++ b/docs/cloud/manage/view-plan-billing.md @@ -13,11 +13,13 @@ To see your plan and billing setting you need: ## Steps +### View current plan and Billing options and Invoices + 1. Click on the **Space settings** cog (located above your profile icon) 1. Click on the **Plan & Billing** tab 1. On this page you will be presented with information on your current plan, billing settings, and usage information: 1. At the top of the page you will see: - - **Credit** amount which refers to any amount you have available to use on future invoices or subscription changes (<https://github.com/netdata/netdata/blob/master/docs/cloud/manage/plans.md#plan-changes-and-credit-balance>) - this is displayed once you have had an active paid subscription with us + - **Credit** amount which refers to any amount you have available to use on future invoices or subscription changes ([Plan changes and credit balance](https://github.com/netdata/netdata/blob/master/docs/cloud/manage/plans.md#plan-changes-and-credit-balance)) - this is displayed once you have had an active paid subscription with us - **Billing email** the email that was specified to be linked to tha plan subscription. This is where invoices, payment, and subscription-related notifications will be sent. - **Billing options and Invoices** is the link to our billing provider Customer Portal where you will be able to: - See the current subscription. There will always be 2 subscriptions active for the two pricing components mentioned on [Netdata Plans documentation page](https://github.com/netdata/netdata/blob/master/docs/cloud/manage/plans.md#plans) @@ -31,19 +33,51 @@ To see your plan and billing setting you need: - View your invoice history 1. At the middle, you'll see details on your current plan as well as means to: - Upgrade or cancel your plan - - View full plan details page + - View **All Plans** details page 1. At the bottom, you will find your Usage chart that displays: - Daily count - The weighted 90th percentile of the live node count during the day, taking time as the weight. If you have 30 live nodes throughout the day except for a two hour peak of 44 live nodes, the daily value is 31. - Period count: The 90th percentile of the daily counts for this period up to the date. The last value for the period is used as the number of nodes for the bill for that period. See more details in [running nodes and billing](https://github.com/netdata/netdata/blob/master/docs/cloud/manage/plans.md#running-nodes-and-billing) (only applicable if you are on a paid plan subscription) - Committed nodes: The number of nodes committed to in the yearly plan. In case the period count is higher than the number of committed nodes, the difference is billed as overage. -> ⚠️ At the moment, any changes to an active paid plan, upgrades, change billing frequency or committed nodes, will be a manual two-setup flow: -> -> 1. cancel your current subscription - move you to the Community plan -> 2. chose the plan with the intended changes -> -> This is a temporary process that we aim to sort out soon so that it will effortless for you to do any of these actions. + +### Update plan + +1. Click on the **Space settings** cog (located above your profile icon) +1. Click on the **Plan & Billing** tab +1. On this page you will be presented with information on your current plan, billing settings, and usage information + 1. Depending on your plan there could be shortcuts to immediately take you to change, for example, the billing frequency to **Yearly** + 1. Most actions will be available under the **Change plan** link that take you to the **All plans** details page where you can + 1. Downgrade or upgrade your plan + 1. Change the billing frequency + 1. Change committed nodes, in case you are on a Yearly plan + 1. Once you chose an action to update your plan a modal will pop-up on the right with + 1. Billing frequency displayed on the top right-corner + 1. Committed Nodes, when applicable + 1. Current billing information: + - Billing email + - Default payment method + - Business name and VAT number, when these are applicable + - Billing Address + Note: Any changes to these need to done through our billing provider Customer Portal prior to confirm the checkout. You can click on the link **Change billing info and payment method** to access it. + 1. Promotion code, so you can review any applied promotion or enter one you may have + 1. Detailed view on Node and Space charges + 1. Breakdown of: + - Subscription Total + - Discount from promotion codes, if applicable + - credit value for Unused time from current plan, if applicable + - Credit amount used from balance, if applicable + - Total Before Tax + - VAT rate and amount, if applicable + 1. Summary of: + - Total payable amount + - credit adjustment value for any Remaining Unused time from current plan, if applicable + - Final credit balance + +Notes: +* Since there is an active plan you won't be redirected to our billing provider, the checkout if performed as soon as you click on **Checkout** +* The change to your plan will be applied as soon as the checkout process is completed successfully +* Downgrade or cancellations may have impacts on some of notification method settings or user accesses to your space, for more details please check [Plan changes and credit balance](https://github.com/netdata/netdata/blob/master/docs/cloud/manage/plans.md#plan-changes-and-credit-balance) ## FAQ @@ -81,6 +115,8 @@ Every time you purchase or renew a Plan, two separate Invoices are generated: - One Invoice includes the recurring fees of the Plan you have chosen + We have waived off the space subscription free ($0.00), so the only recurring fee will be on annual plans for the committed nodes. + - The other Invoice includes your monthly “On Demand - Usage”. Right after the activation of your subscription, you will receive a zero value Invoice since you had no usage when you subscribed. @@ -90,3 +126,16 @@ Every time you purchase or renew a Plan, two separate Invoices are generated: You can find some further details on the [Netdata Plans page](https://github.com/netdata/netdata/blob/master/docs/cloud/manage/plans.md#plans). > ⚠️ We expect this to change to a single invoice in the future, but currently do not have a concrete timeline for when this change will happen. + +### 8. How is the **Total Before Tax** value calculated on plan changes? + +When you change your plan we will be calculating the residual before tax value you have from the _Unused time on your current plan_ in order to credit you with this value. + +After that, we will be performing the following calculations: + +1. Get the **Subscription total** (total amount to be paid for Nodes and Space) +2. Deduct any Discount applicable from promotion codes +3. If an amount remains, then we deduct the sum of the _Unused time on current plan_ then and the Credit amount from any existing credit balance. +4. The result, if positive, is the Total Before Tax, if applicable, any sales tax (VAT or other) will apply. + +If the calculation of step 3 returns a negative amount then this amount will be your new customer credit balance. diff --git a/docs/cloud/visualize/interact-new-charts.md b/docs/cloud/visualize/interact-new-charts.md index 4c6c2ebf5..3707e945f 100644 --- a/docs/cloud/visualize/interact-new-charts.md +++ b/docs/cloud/visualize/interact-new-charts.md @@ -8,129 +8,136 @@ To make sense of all the metrics, Netdata offers an enhanced version of charts t These charts provide a lot of useful information, so that you can: - Enjoy the high-resolution, granular metrics collected by Netdata -- Explore visualization with more options such as _line_, _stacked_ and _area_ types (other types like _bar_, _pie_ and - _gauges_ are to be added shortly) - Examine all the metrics by hovering over them with your cursor -- Use intuitive tooling and shortcuts to pan, zoom or highlight your charts -- On highlight, ease access - to [Metric Correlations](https://github.com/netdata/netdata/blob/master/docs/cloud/insights/metric-correlations.md) to - see other metrics with similar patterns +- Filter the metrics in any way you want using the [Definition bar](#definition-bar) +- View the combined anomaly rate of all underlying data with the [Anomaly Rate ribbon](#anomaly-rate-ribbon) +- Explore even more details about a chart's metrics through [hovering over certain elements of it](#hover-over-the-chart) +- Use intuitive tooling and shortcuts to pan, zoom or highlight areas of interest in your charts +- On highlight, get easy access to [Metric Correlations](https://github.com/netdata/netdata/blob/master/docs/cloud/insights/metric-correlations.md) to see other metrics with similar patterns - Have the dimensions sorted based on name or value - View information about the chart, its plugin, context, and type -- Get the chart status and possible errors. On top, reload functionality +- View individual metric collection status about a chart -These charts are available on Netdata Cloud's +These charts are available on Netdata Cloud's [Overview tab](https://github.com/netdata/netdata/blob/master/docs/cloud/visualize/overview.md), Single Node tab and on your [Custom Dashboards](https://github.com/netdata/netdata/blob/master/docs/cloud/visualize/dashboards.md). -Some of the features listed below are also available on the simpler charts that are available on each agent's user interface. - ## Overview -Have a look at the can see the overall look and feel of the charts for both with a composite chart from -the [Overview tab](https://github.com/netdata/netdata/blob/master/docs/cloud/visualize/overview.md) and a simple chart -from the Single Node tab: +A Netdata chart looks like this: -<img width="678" alt="image" src="https://user-images.githubusercontent.com/43294513/220913360-f3f2ac06-b715-4e99-a933-f3bcb776636f.png"/> +<img src="https://user-images.githubusercontent.com/70198089/236133212-353c102f-a6ed-45b7-9251-34e004c7a10a.png" width="900"/> With a quick glance you have immediate information available at your disposal: -- Chart title and units -- Definition bar -- Action bars -- Chart area -- Legend with dimensions +- [Chart title and units](#title-bar) +- [Anomaly Rate ribbon](#anomaly-rate-ribbon) +- [Definition bar](#definition-bar) +- [Tool bar](#tool-bar) +- [Chart area](#hover-over-the-chart) +- [Legend with dimensions](#dimensions-bar) -## Play, Pause and Reset +## Title bar -Your charts are controlled using the available -[Time controls](https://github.com/netdata/netdata/blob/master/docs/dashboard/visualization-date-and-time-controls.md#time-controls). -Besides these, when interacting with the chart you can also activate these controls by: +When you start interacting with a chart, you'll notice valuable information on the top bar: -- Hovering over any chart to temporarily pause it - this momentarily switches time control to Pause, so that you can - hover over a specific timeframe. When moving out of the chart time control will go back to Play (if it was it's - previous state) -- Clicking on the chart to lock it - this enables the Pause option on the time controls, to the current timeframe. This - is if you want to jump to a different chart to look for possible correlations. -- Double clicking to release a previously locked chart - move the time control back to Play +<img src="https://user-images.githubusercontent.com/70198089/236133832-fad45e65-5bd6-4fd1-8d68-33acf69fff5c.png" width="900"/> -| Interaction | Keyboard/mouse | Touchpad/touchscreen | Time control | -|:------------------|:---------------|:---------------------|:----------------------| -| **Pause** a chart | `hover` | `n/a` | Temporarily **Pause** | -| **Stop** a chart | `click` | `tap` | **Pause** | -| **Reset** a chart | `double click` | `n/a` | **Play** | +The elements that you can find on this top bar are: -Note: These interactions are available when the default "Pan" action is used. Other actions are accessible via -the [Exploration action bar](#exploration-action-bar). +- **Netdata icon**: this indicates that data is continuously being updated, this happens if [Time controls](https://github.com/netdata/netdata/blob/master/docs/dashboard/visualization-date-and-time-controls.md#time-controls) are in Play or Force Play mode. +- **Chart title**: on the chart title you can see the title together with the metric being displayed, as well as the unit of measurement. +- **Chart status icon**: possible values are: Loading, Timeout, Error or No data, otherwise this icon is not shown. -## Title and chart action bar +Along with viewing chart type, context and units, on this bar you have access to immediate actions over the chart: -When you start interacting with a chart, you'll notice valuable information on the top bar. You will see information -from the chart title to a chart action bar. +<img src="https://user-images.githubusercontent.com/70198089/236134195-ecb08f79-1355-4bce-8449-e829f4a6b1c0.png" width="200" /> -The elements that you can find on this top bar are: +- **Chart info**: get more information relevant to the chart you are interacting with. +- **Chart type**: change the chart type from **line**, **stacked**, **area**, **stacked bar** and **multi bar**. +- **Enter fullscreen mode**: expand the current chart to the full size of your screen. +- **Add chart to dashboard**: add the chart to an existing custom dashboard or directly create a new one that includes the chart. -- Netdata icon: this indicates that data is continuously being updated, this happens - if [Time controls](https://github.com/netdata/netdata/blob/master/docs/dashboard/visualization-date-and-time-controls.md#time-controls) - are in Play or Force Play mode -- Chart status icon: indicates the status of the chart. Possible values are: Loading, Timeout, Error or No data -- Chart title: on the chart title you can see the title together with the metric being displayed, as well as the unit of - measurement -- Chart action bar: here you'll have access to chart info, change chart types, enables fullscreen mode, and the ability - to add the chart to a custom dashboard +## Definition bar - +Each composite chart has a definition bar to provide information and options about the following: +<img src="https://user-images.githubusercontent.com/70198089/236134615-e53a1d68-8a0f-466b-b2ef-1974085f0e8d.png" width="900"/> + +- Group by option +- Aggregate function to be applied in case multiple data sources exist +- Nodes filter +- Instances filter +- Dimensions filter +- Labels filter +- The aggregate function over time to be applied if one point in the chart consists of multiple data points aggregated +- Resetting the Definition bar + +### NIDL framework + +To help users instantly understand and validate the data they see on charts, we developed the NIDL (Nodes, Instances, Dimensions, Labels) framework. This information is visualized on all charts. + + +> You can explore the in-depth infographic, by clicking on this image and opening it in a new tab, +> allowing you to zoom in to the different parts of it. +> +> <a href="https://user-images.githubusercontent.com/2662304/235475061-44628011-3b1f-4c44-9528-34452018eb89.png" target="_blank"> +> <img src="https://user-images.githubusercontent.com/2662304/235475061-44628011-3b1f-4c44-9528-34452018eb89.png" width="400" border="0" align="center"/> +> </a> -## Definition bar -Each composite chart has a definition bar to provide information about the following: +You can rapidly access condensed information for collected metrics, grouped by node, monitored instances, dimension, or any key/value label pair. -* Grouping option -* Aggregate function to be applied in case multiple data sources exist -* Instances -* Nodes -* Dimensions, and -* Aggregate function over time to be applied if one point in the chart consists of multiple data points aggregated +At the Definition bar of each chart, there are a few dropdown menus: -### Group by dimension, node, or chart +<img src="https://user-images.githubusercontent.com/43294513/235470150-62a3b9ac-51ca-4c0d-81de-8804e3d733eb.png" width="900"/> -Click on the **dimension** dropdown to change how a composite chart groups metrics. +These dropdown menus have 2 functions: -The default option is by _dimension_, so that each line/area in the visualization is the aggregation of a single -dimension. -This provides a per dimension view of the data from all the nodes in the War Room, taking into account filtering -criteria if defined. +1. Provide additional information about the visualized chart, to help with understanding the data that is presented. +2. Provide filtering and grouping capabilities, altering the query on the fly, to help get different views of the dataset. -A composite chart grouped by _node_ visualizes a single metric across contributing nodes. If the composite chart has -five -contributing nodes, there will be five lines/areas. This is typically an absolute value of the sum of the dimensions -over each node but there -are some opinionated-but-valuable exceptions where a specific dimension is selected. -Grouping by nodes allows you to quickly understand which nodes in your infrastructure are experiencing anomalous -behavior. +The NIDL framework attaches metadata to every metric that is collected to provide for each of them the following consolidated data for the visible time frame: -A composite chart grouped by _instance_ visualizes each instance of one software or hardware on a node and displays -these as a separate dimension. By grouping the -`disk.io` chart by _instance_, you can visualize the activity of each disk on each node that contributes to the -composite -chart. +1. The volume contribution of each metric into the final query. So even if a query comes from 1000 nodes, the contribution of each node in the result can instantly be visualized. The same goes for instances, dimensions and labels. Especially for labels, Netdata also provides the volume contribution of each label `key:value` pair to the final query, so that you can immediately see how much every label value involved in the query affected the chart. +2. The anomaly rate of each of them for the time-frame of the query. This is used to quickly spot which of the nodes, instances, dimensions or labels have anomalies in the requested time-frame. +3. The minimum, average and maximum values of all the points used for the query. This is used to quickly spot which of the nodes, instances, dimensions or labels are responsible for a spike or a dive in the chart. -Another very pertinent example is composite charts over contexts related to cgroups (VMs and containers). You have the -means to change the default group by or apply filtering to -get a better view into what data your are trying to analyze. For example, if you change the group by to _instance_ you -get a view with the data of all the instances (cgroups) that -contribute to that chart. Then you can use further filtering tools to focus the data that is important to you and even -save the result to your own dashboards. +All of these dropdown menus can be used for instantly filtering the information shown, by including or excluding specific nodes, instances, dimensions or labels. Directly from the dropdown menu, without the need to edit a query string and without any additional knowledge of the underlying data. - +### Group by dropdown -### Aggregate functions over data sources +The "Group by" dropdown menu allows selecting 1 or more groupings to be applied at once on the same dataset. -Each chart uses an opinionated-but-valuable default aggregate function over the data sources. For example, -the `system.cpu` chart shows the -average for each dimension from every contributing chart, while the `net.net` chart shows the sum for each dimension -from every contributing chart, which can also come from multiple networking interfaces. +<img src="https://user-images.githubusercontent.com/43294513/235468819-3af5a1d3-8619-48fb-a8b7-8e8b4cf6a8ff.png" width="900"/> + +It supports: + +1. **Group by Node**, to summarize the data of each node, and provide one dimension on the chart for each of the nodes involved. Filtering nodes is supported at the same time, using the nodes dropdown menu. +2. **Group by Instance**, to summarize the data of each instance and provide one dimension on the chart for each of the instances involved. Filtering instances is supported at the same time, using the instances dropdown menu. +3. **Group by Dimension**, so that each metric in the visualization is the aggregation of a single dimension. This provides a per dimension view of the data from all the nodes in the War Room, taking into account filtering criteria if defined. +4. **Group by Label**, to summarize the data for each label value. Multiple label keys can be selected at the same time. + +Using this menu, you can slice and dice the data in any possible way, to quickly get different views of it, without the need to edit a query string and without any need to better understand the format of the underlying data. + +> ### Tip +> +> A very pertinent example is composite charts over contexts related to cgroups (VMs and containers). +> You have the means to change the default group by or apply filtering to get a better view into what data your are trying to analyze. +> For example, if you change the group by to _instance_ you get a view with the data of all the instances (cgroups) that contribute to that chart. +> Then you can use further filtering tools to focus the data that is important to you and even save the result to your own dashboards. + +> ### Tip +> +> Group by instance, dimension to see the time series of every individual collected metric participating in the chart. + +### Aggregate functions over data sources dropdown + +Each chart uses an opinionated-but-valuable default aggregate function over the data sources. + +<img src="https://user-images.githubusercontent.com/70198089/236136725-778670b4-7e81-44a8-8d3d-f38ded823c94.png" width="500"/> + +For example, the `system.cpu` chart shows the average for each dimension from every contributing chart, while the `net.net` chart shows the sum for each dimension from every contributing chart, which can also come from multiple networking interfaces. The following aggregate functions are available for each selected dimension: @@ -144,105 +151,148 @@ The following aggregate functions are available for each selected dimension: - **Max**: Displays a maximum value. For dimensions with positive values, the max is the value with the largest magnitude. For charts with negative values, the max is the value closet to zero. -### Dimensions - -Select which dimensions to display on the composite chart. You can choose **All dimensions**, a single dimension, or any -number of dimensions available on that context. +### Nodes dropdown -### Instances +In this dropdown, you can view or filter the nodes contributing time-series metrics to the chart. +This menu also provides the contribution of each node to the volume of the chart, and a break down of the anomaly rate of the queried data per node. -Click on **X Instances** to display a dropdown of instances and nodes contributing to that composite chart. Each line in -the dropdown displays an instance name and the associated node's hostname. - -### Nodes - -Click on **X Nodes** to display a dropdown of nodes contributing to that composite chart. Each line displays a hostname -to help you identify which nodes contribute to a chart. You can also use this component to filter nodes directly on the -chart. +<img src="https://user-images.githubusercontent.com/70198089/236137765-b57d5443-3d4b-42f4-9e3d-db1eb606626f.png" width="900"/> If one or more nodes can't contribute to a given chart, the definition bar shows a warning symbol plus the number of affected nodes, then lists them in the dropdown along with the associated error. Nodes might return errors because of networking issues, a stopped `netdata` service, or because that node does not have any metrics for that context. +### Instances dropdown + +In this dropdown, you can view or filter the instances contributing time-series metrics to the chart. +This menu also provides the contribution of each instance to the volume of the chart, and a break down of the anomaly rate of the queried data per instance. + +<img src="https://user-images.githubusercontent.com/70198089/236138302-4dd4072e-3a0d-43bb-a9d8-4dde79c65e92.png" width="900"/> + +### Dimensions dropdown + +In this dropdown, you can view or filter the original dimensions contributing time-series metrics to the chart. +This menu also presents the contribution of each original dimensions on the chart, and a break down of the anomaly rate of the data per dimension. + +<img src="https://user-images.githubusercontent.com/70198089/236138796-08dc6ac6-9a50-4913-a46d-d9bbcedd48f6.png" width="900"/> + + +### Labels dropdown + +In this dropdown, you can view or filter the contributing time-series labels of the chart. +This menu also presents the contribution of each label on the chart,and a break down of the anomaly rate of the data per label. + +<img src="https://user-images.githubusercontent.com/70198089/236139027-8a51a958-2074-4675-a41b-efff30d8f51a.png" width="900"/> + ### Aggregate functions over time When the granularity of the data collected is higher than the plotted points on the chart an aggregation function over -time -is applied. By default the aggregation applied is _average_ but the user can choose different options from the -following: - -* Min -* Max -* Average -* Sum -* Incremental sum (Delta) -* Standard deviation -* Median -* Single exponential smoothing -* Double exponential smoothing -* Coefficient variation -* Trimmed Median `*` -* Trimmed Mean `*` -* Percentile `**` - -> ### Info -> -> - `*` For **Trimmed Median and Mean** you can choose the percentage of data tha you want to focus on: 1%, 2%, 3%, 5%, 10%, 15%, 20% and 25%. -> - `**` For **Percentile** you can specify the percentile you want to focus on: 25th, 50th, 75th, 80th, 90th, 95th, 97th, 98th and 99th. +time is applied. + +<img src="https://user-images.githubusercontent.com/70198089/236411297-e123db06-0117-4e24-a5ac-955b980a8f55.png" width="400"/> + +By default the aggregation applied is _average_ but the user can choose different options from the following: -For more details on each, you can refer to our Agent's HTTP API details -on [Data Queries - Data Grouping](https://github.com/netdata/netdata/blob/master/web/api/queries/README.md#data-grouping). +- Min, Max, Average or Sum +- Percentile + - you can specify the percentile you want to focus on: 25th, 50th, 75th, 80th, 90th, 95th, 97th, 98th and 99th. + <img src="https://user-images.githubusercontent.com/70198089/236410299-de5f3367-f3b0-4beb-a73f-a49007c543d4.png" width="250"/> +- Trimmed Mean or Trimmed Median + - you can choose the percentage of data tha you want to focus on: 1%, 2%, 3%, 5%, 10%, 15%, 20% and 25%. + <img src="https://user-images.githubusercontent.com/70198089/236410858-74b46af9-280a-4ab2-ad26-5a6aa9403aa8.png" width="250"/> +- Median +- Standard deviation +- Coefficient of variation +- Delta +- Single or Double exponential smoothing + +For more details on each, you can refer to our Agent's HTTP API details on [Data Queries - Data Grouping](https://github.com/netdata/netdata/blob/master/web/api/queries/README.md#data-grouping). ### Reset to defaults -Click on the 3-dot icon (**⋮**) on any chart, then **Reset to Defaults**, to reset the definition bar to its initial -state. +Finally, you can reset everything to its defaults by clicking the green "Reset" prompt at the end of the definition bar. + +## Anomaly Rate ribbon + +Netdata's unsupervised machine learning algorithm creates a unique model for each metric collected by your agents, using exclusively the metric's past data. +It then uses these unique models during data collection to predict the value that should be collected and check if the collected value is within the range of acceptable values based on past patterns and behavior. + +If the value collected is an outlier, it is marked as anomalous. + +<img src="https://user-images.githubusercontent.com/70198089/236139886-79d63cf6-61ed-4aa7-842c-b5a1728c870d.png" width="900"/> + +This unmatched capability of real-time predictions as data is collected allows you to **detect anomalies for potentially millions of metrics across your entire infrastructure within a second of occurrence**. + +The Anomaly Rate ribbon on top of each chart visualizes the combined anomaly rate of all the underlying data, highlighting areas of interest that may not be easily visible to the naked eye. + +Hovering over the Anomaly Rate ribbon provides a histogram of the anomaly rates per presented dimension, for the specific point in time. + +Anomaly Rate visualization does not make Netdata slower. Anomaly rate is saved in the the Netdata database, together with metric values, and due to the smart design of Netdata, it does not even incur a disk footprint penalty. -## Jump to single-node dashboards +## Hover over the chart -Click on **X Charts**/**X Nodes** to display one of the two dropdowns that list the charts and nodes contributing to a -given composite chart. For example, the nodes dropdown. +Hovering over any point in the chart will reveal a more informative overlay. +It includes a bar indicating the volume percentage of each time series compared to the total, the anomaly rate, and a notification on if there are data collection issues. - +This overlay sorts all dimensions by value, makes bold the closest dimension to the mouse and presents a histogram based on the values of the dimensions. -To jump to a single-node dashboard, click on the link icon -<img class="img__inline img__inline--link" src="https://user-images.githubusercontent.com/1153921/95762109-1d219300-0c62-11eb-8daa-9ba509a8e71c.png" /> next to the -node you're interested in. +<img src="https://user-images.githubusercontent.com/70198089/236141460-bfa66b99-d63c-4a2c-84b1-2509ed94857f.png" width="500"/> -The single-node dashboard opens in a new tab. From there, you can continue to troubleshoot or run -[Metric Correlations](https://github.com/netdata/netdata/blob/master/docs/cloud/insights/metric-correlations.md) for faster root -cause analysis. +When hovering the anomaly ribbon, the overlay sorts all dimensions by anomaly rate, and presents a histogram of these anomaly rates. -## Add composite charts to a dashboard +#### Info column -Click on the 3-dot icon (**⋮**) on any chart, then click on **Add to Dashboard**. Click the **+** button for any -dashboard you'd like to add this composite chart to, or create a new dashboard an initiate it with your chosen chart by -entering the name and clicking **New Dashboard**. +Additionally, when hovering over the chart, the overlay may display an indication in the "Info" column. -## Chart action bar +Currently, this column is used to inform users of any data collection issues that might affect the chart. +Below each chart, there is an information ribbon. This ribbon currently shows 3 states related to the points presented in the chart: -On this bar you have access to immediate actions over the chart, the available actions are: +1. **[P]: Partial Data** + At least one of the dimensions in the chart has partial data, meaning that not all instances available contributed data to this point. This can happen when a container is stopped, or when a node is restarted. This indicator helps to gain confidence of the dataset, in situations when unusual spikes or dives appear due to infrastructure maintenance, or due to failures to part of the infrastructure. -- Chart info: you will be able to get more information relevant to the chart you are interacting with -- Chart type: change the chart type from _line_, _stacked_ or _area_ -- Enter fullscreen mode: allows you expand the current chart to the full size of your screen -- Add chart to dashboard: This allows you to add the chart to an existing custom dashboard or directly create a new one - that includes the chart. +2. **[O]: Overflown** + At least one of the data sources included in the chart has a counter that has overflowed at this point. -<img src="https://user-images.githubusercontent.com/70198089/222689501-4116f5fe-e447-4359-83b5-62dadb33f4ef.png" width="40%" height="40%" /> +3. **[E]: Empty Data** + At least one of the dimensions included in the chart has no data at all for the given points. +All these indicators are also visualized per dimension, in the pop-over that appears when hovering the chart. -## Exploration action bar +<img src="https://user-images.githubusercontent.com/70198089/236145768-8ffadd02-93a4-4e9e-b4ae-c1367f614a7e.png" width="700"/> -When exploring the chart you will see a second action bar. This action bar is there to support you on this task. The -available actions that you can see are: +## Play, Pause and Reset + +Your charts are controlled using the available [Time controls](https://github.com/netdata/netdata/blob/master/docs/dashboard/visualization-date-and-time-controls.md#time-controls). +Besides these, when interacting with the chart you can also activate these controls by: + +- Hovering over any chart to temporarily pause it - this momentarily switches time control to Pause, so that you can + hover over a specific timeframe. When moving out of the chart time control will go back to Play (if it was it's + previous state) +- Clicking on the chart to lock it - this enables the Pause option on the time controls, to the current timeframe. This + is if you want to jump to a different chart to look for possible correlations. +- Double clicking to release a previously locked chart - move the time control back to Play + +| Interaction | Keyboard/mouse | Touchpad/touchscreen | Time control | +|:------------------|:---------------|:---------------------|:----------------------| +| **Pause** a chart | `hover` | `n/a` | Temporarily **Pause** | +| **Stop** a chart | `click` | `tap` | **Pause** | +| **Reset** a chart | `double click` | `n/a` | **Play** | + +Note: These interactions are available when the default "Pan" action is used from the [Tool Bar](#tool-bar). + +## Tool bar + +While exploring the chart, a tool bar will appear. This tool bar is there to support you on this task. +The available manipulation tools you can select are: + +<img src="https://user-images.githubusercontent.com/70198089/236143292-c1d75528-263d-4ddd-9db8-b8d6a31cb83e.png" width="400" /> - Pan - Highlight -- Horizontal and Vertical zooms -- In-context zoom in and out +- Select and zoom +- Chart zoom +- Reset zoom -<img src="https://user-images.githubusercontent.com/70198089/222689556-58ad77bc-924f-4c3f-b38b-fc63de2f5773.png" width="40%" height="40%" /> ### Pan @@ -258,47 +308,45 @@ it like pushing the current timeframe off the screen to see what came before or Selecting timeframes is useful when you see an interesting spike or change in a chart and want to investigate further by: - Looking at the same period of time on other charts/sections -- Running [metric correlations](https://github.com/netdata/netdata/blob/master/docs/cloud/insights/metric-correlations.md) - to filter metrics that also show something different in the selected period, vs the previous one - -<img alt="image" src="https://user-images.githubusercontent.com/43294513/221365853-1142944a-ace5-484a-a108-a205d050c594.png" /> +- Running [metric correlations](https://github.com/netdata/netdata/blob/master/docs/cloud/insights/metric-correlations.md) to filter metrics that also show something different in the selected period, vs the previous one | Interaction | Keyboard/mouse | Touchpad/touchscreen | |:-----------------------------------|:---------------------------------------------------------|:---------------------| | **Highlight** a specific timeframe | `Alt + mouse selection` or `⌘ + mouse selection` (macOS) | `n/a` | -### Zoom +### Select and zoom -Zooming in helps you see metrics with maximum granularity, which is useful when you're trying to diagnose the root cause -of an anomaly or outage. Zooming out lets you see metrics within the larger context, such as the last hour, day, or -week, which is useful in understanding what "normal" looks like, or to identify long-term trends, like a slow creep in -memory usage. +You can zoom to a specific timeframe, either horizontally of vertically, by selecting a timeframe. -The actions above are _normal_ vertical zoom actions. We also provide an horizontal zoom action that helps you focus on -a specific Y-axis area to further investigate a spike or dive on your charts. +| Interaction | Keyboard/mouse | Touchpad/touchscreen | +|:-------------------------------------------|:-------------------------------------|:-----------------------------------------------------| +| **Zoom** to a specific timeframe | `Shift + mouse vertical selection` | `n/a` | +| **Horizontal Zoom** a specific Y-axis area | `Shift + mouse horizontal selection` | `n/a` | - +### Chart zoom +Zooming in helps you see metrics with maximum granularity, which is useful when you're trying to diagnose the root cause +of an anomaly or outage. +Zooming out lets you see metrics within the larger context, such as the last hour, day, or week, which is useful in understanding what "normal" looks like, or to identify long-term trends, like a slow creep in memory usage. | Interaction | Keyboard/mouse | Touchpad/touchscreen | |:-------------------------------------------|:-------------------------------------|:-----------------------------------------------------| | **Zoom** in or out | `Shift + mouse scrollwheel` | `two-finger pinch` <br />`Shift + two-finger scroll` | -| **Zoom** to a specific timeframe | `Shift + mouse vertical selection` | `n/a` | -| **Horizontal Zoom** a specific Y-axis area | `Shift + mouse horizontal selection` | `n/a` | - -You also have two direct action buttons on the exploration action bar for in-context `Zoom in` and `Zoom out`. -## Other interactions +## Dimensions bar ### Order dimensions legend -The bottom legend of the chart where you can see the dimensions of the chart can now be ordered by: +The bottom legend where you can see the dimensions of the chart can be ordered by: + + +<img src="https://user-images.githubusercontent.com/70198089/236144658-6c3d0e31-9bcb-45f3-bb95-4eafdcbb0a58.png" width="300" /> + - Dimension name (Ascending or Descending) - Dimension value (Ascending or Descending) - -<img src="https://user-images.githubusercontent.com/70198089/222689791-48c77890-1093-4beb-84c2-7598353ca049.png" width="50%" height="50%" /> +- Dimension Anomaly Rate (Ascending or Descending) ### Show and hide dimensions @@ -310,10 +358,6 @@ behaving strangely. | **Show one** dimension and hide others | `click` | `tap` | | **Toggle (show/hide)** one dimension | `Shift + click` | `n/a` | -### Resize - -To resize the chart, click-and-drag the icon on the bottom-right corner of any chart. To restore the chart to its -original height, -double-click the same icon. +## Resize a chart - +To resize the chart, click-and-drag the icon on the bottom-right corner of any chart. To restore the chart to its original height, double-click the same icon. |