
diff options
Diffstat (limited to 'docs/cloud')
10 files changed, 43 insertions, 550 deletions
diff --git a/docs/cloud/alerts-notifications/add-discord-notification.md b/docs/cloud/alerts-notifications/add-discord-notification.md deleted file mode 100644 index 3edf5002b..000000000 --- a/docs/cloud/alerts-notifications/add-discord-notification.md +++ /dev/null @@ -1,44 +0,0 @@ -# Add Discord notification configuration - -From the Netdata Cloud UI, you can manage your space's notification settings and enable the configuration to deliver notifications on Discord. - -## Prerequisites - -To enable Discord notifications you need: - -- A Netdata Cloud account -- Access to the space as an **administrator** -- Have a Discord server able to receive webhook integrations. For more details check [how to configure this on Discord](#settings-on-discord) - -## Steps - -1. Click on the **Space settings** cog (located above your profile icon) -1. Click on the **Notification** tab -1. Click on the **+ Add configuration** button (near the top-right corner of your screen) -1. On the **Discord** card click on **+ Add** -1. A modal will be presented to you to enter the required details to enable the configuration: - 1. **Notification settings** are Netdata specific settings - - Configuration name - you can optionally provide a name for your configuration you can easily refer to it - - Rooms - by specifying a list of Rooms you are select to which nodes or areas of your infrastructure you want to be notified using this configuration - - Notification - you specify which notifications you want to be notified using this configuration: All Alerts and unreachable, All Alerts, Critical only - 1. **Integration configuration** are the specific notification integration required settings, which vary by notification method. For Discord: - - Define the type channel you want to send notifications to: **Text channel** or **Forum channel** - - Webhook URL - URL provided on Discord for the channel you want to receive your notifications. For more details check [how to configure this on Discord](#settings-on-discord) - - Thread name - if the Discord channel is a **Forum channel** you will need to provide the thread name as well - -## Settings on Discord - -## Enable webhook integrations on Discord server - -To enable the webhook integrations on Discord you need: -1. Go to *Integrations** under your **Server Settings - - 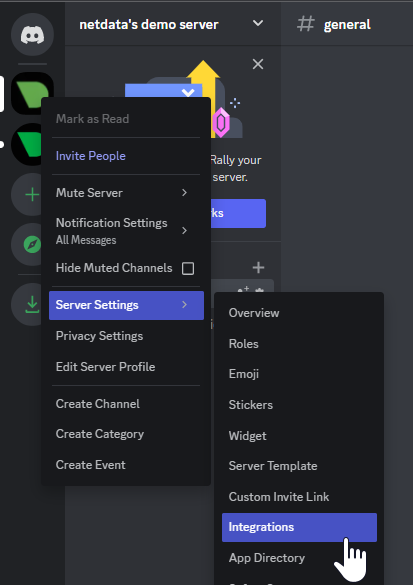 - -1. **Create Webhook** or **View Webhooks** if you already have some defined -1. When you create a new webhook you specify: Name and Channel -1. Once you have this configured you will need the Webhook URL to add your notification configuration on Netdata UI - - 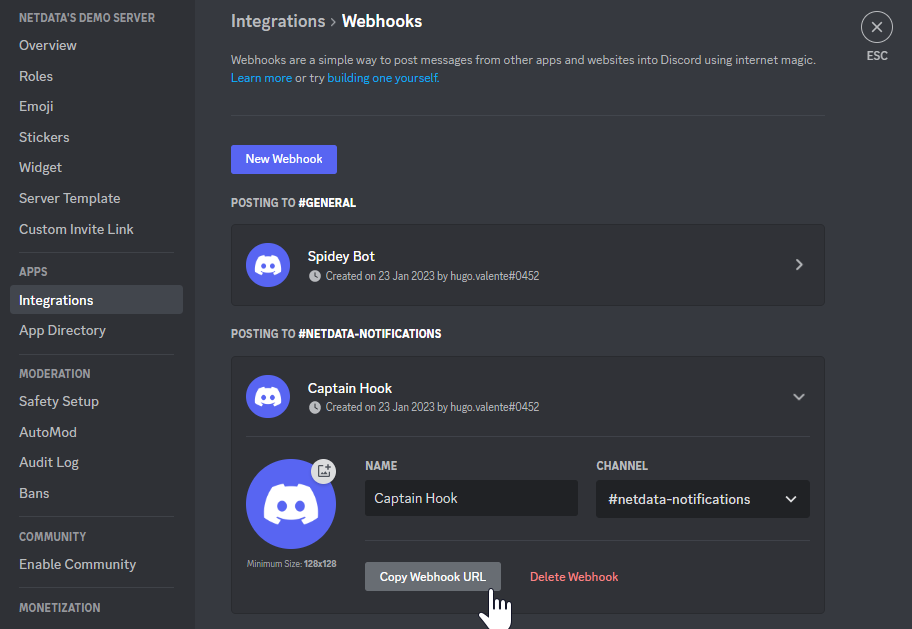 - -For more details please read this article from Discord: [Intro to Webhooks](https://support.discord.com/hc/en-us/articles/228383668). diff --git a/docs/cloud/alerts-notifications/add-mattermost-notification-configuration.md b/docs/cloud/alerts-notifications/add-mattermost-notification-configuration.md deleted file mode 100644 index 79bc98619..000000000 --- a/docs/cloud/alerts-notifications/add-mattermost-notification-configuration.md +++ /dev/null @@ -1,51 +0,0 @@ -# Add Mattermost notification configuration - -From the Cloud interface, you can manage your space's notification settings and from these you can add a specific configuration to get notifications delivered on Mattermost. - -## Prerequisites - -To add Mattermost notification configurations you need: - -- A Netdata Cloud account -- Access to the space as an **administrator** -- Space needs to be on **Business** plan or higher -- Have a Mattermost app on your workspace to receive the webhooks, for more details check [how to configure this on Mattermost](#settings-on-mattermost) - -## Steps - -1. Click on the **Space settings** cog (located above your profile icon) -1. Click on the **Notification** tab -1. Click on the **+ Add configuration** button (near the top-right corner of your screen) -1. On the **Mattermost** card click on **+ Add** -1. A modal will be presented to you to enter the required details to enable the configuration: - 1. **Notification settings** are Netdata specific settings - - Configuration name - you can optionally provide a name for your configuration you can easily refer to it - - Rooms - by specifying a list of Rooms you are select to which nodes or areas of your infrastructure you want to be notified using this configuration - - Notification - you specify which notifications you want to be notified using this configuration: All Alerts and unreachable, All Alerts, Critical only - 1. **Integration configuration** are the specific notification integration required settings, which vary by notification method. For Mattermost: - - Webhook URL - URL provided on Mattermost for the channel you want to receive your notifications. For more details check [how to configure this on Mattermost](#settings-on-mattermost) - -## Settings on Mattermost - -To enable the webhook integrations on Mattermost you need: -1. In Mattermost, go to Product menu > Integrations > Incoming Webhook. - -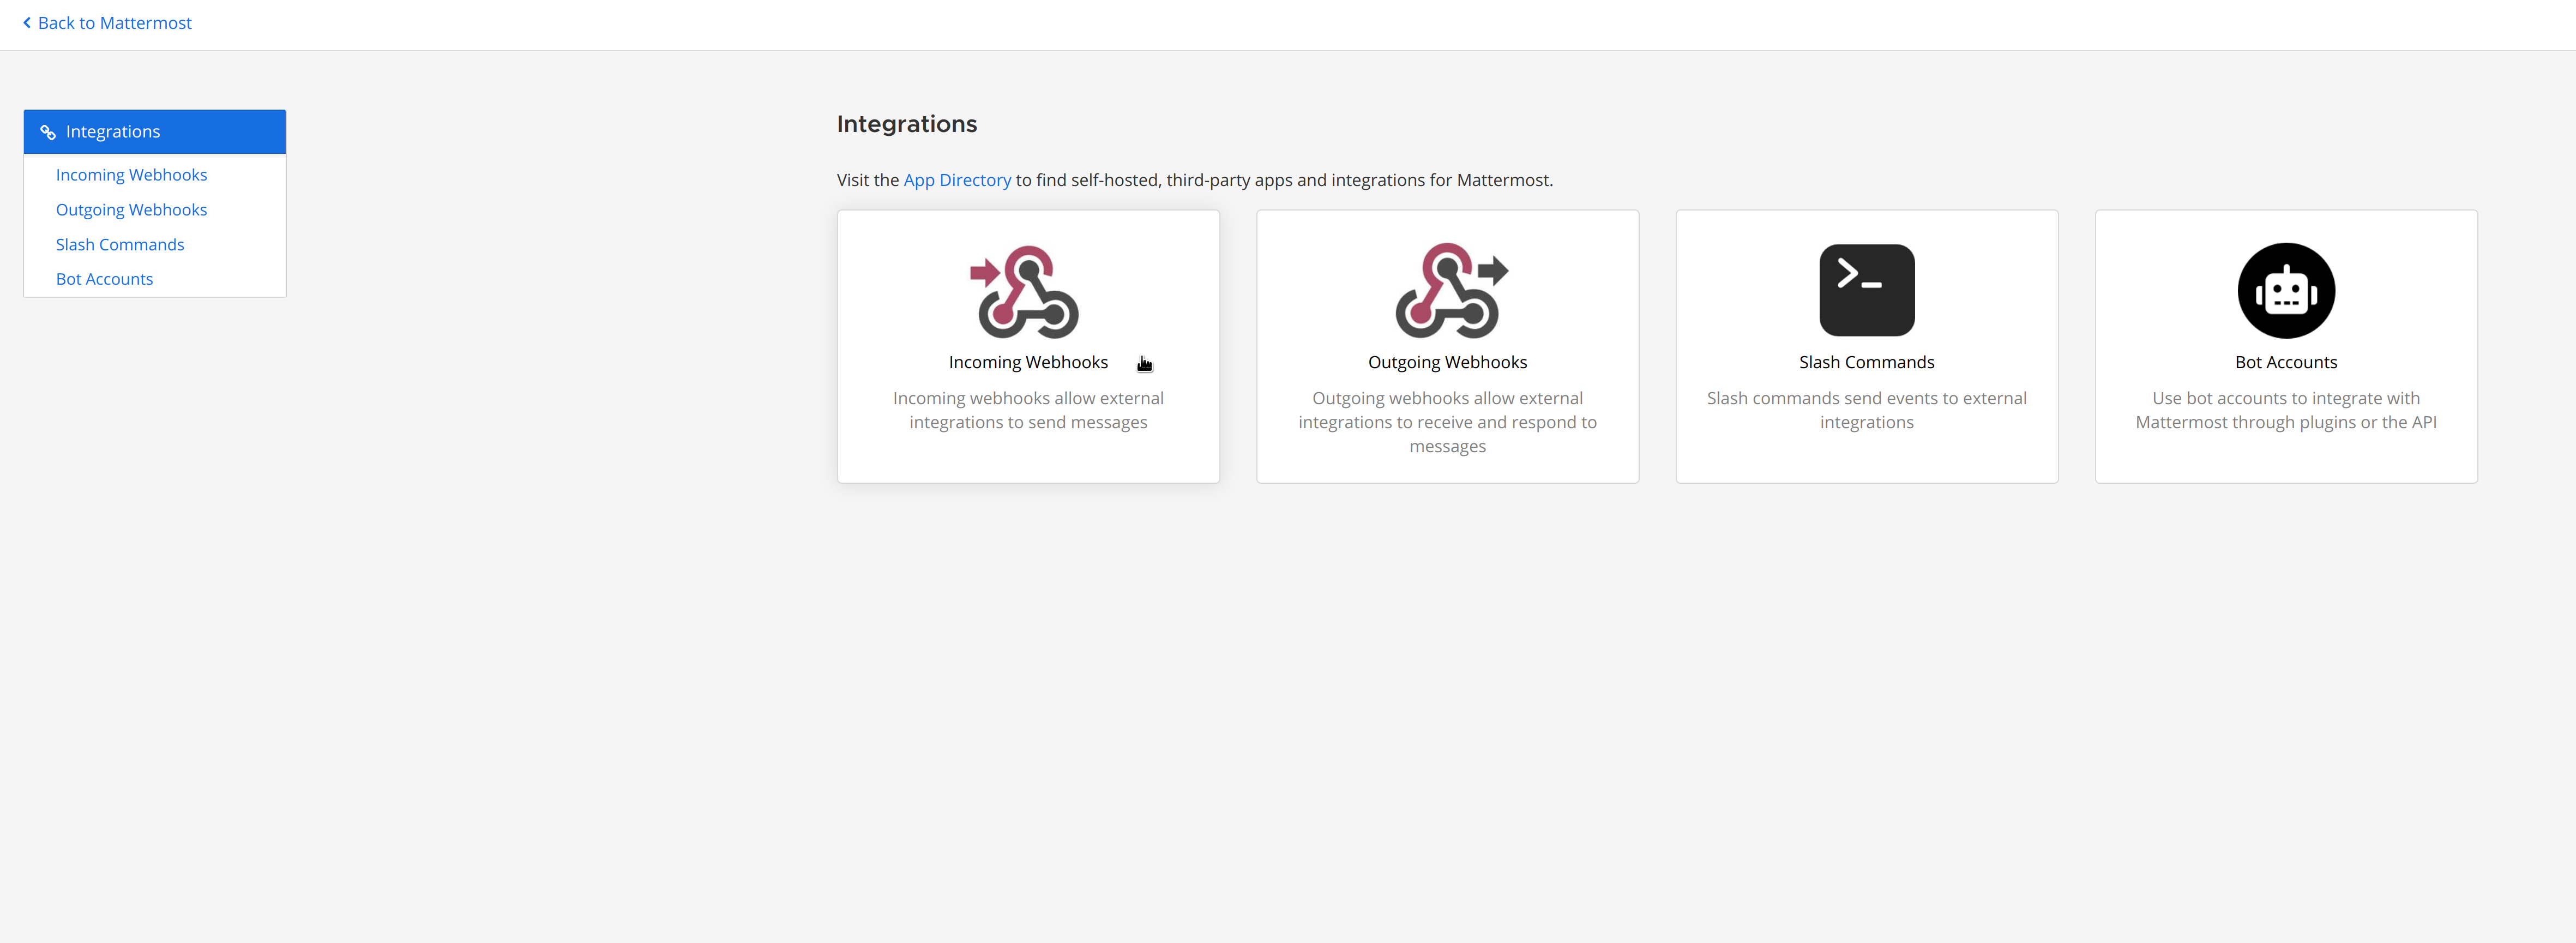 - - - If you don’t have the Integrations option, incoming webhooks may not be enabled on your Mattermost server or may be disabled for non-admins. They can be enabled by a System Admin from System Console > Integrations > Integration Management. Once incoming webhooks are enabled, continue with the steps below - -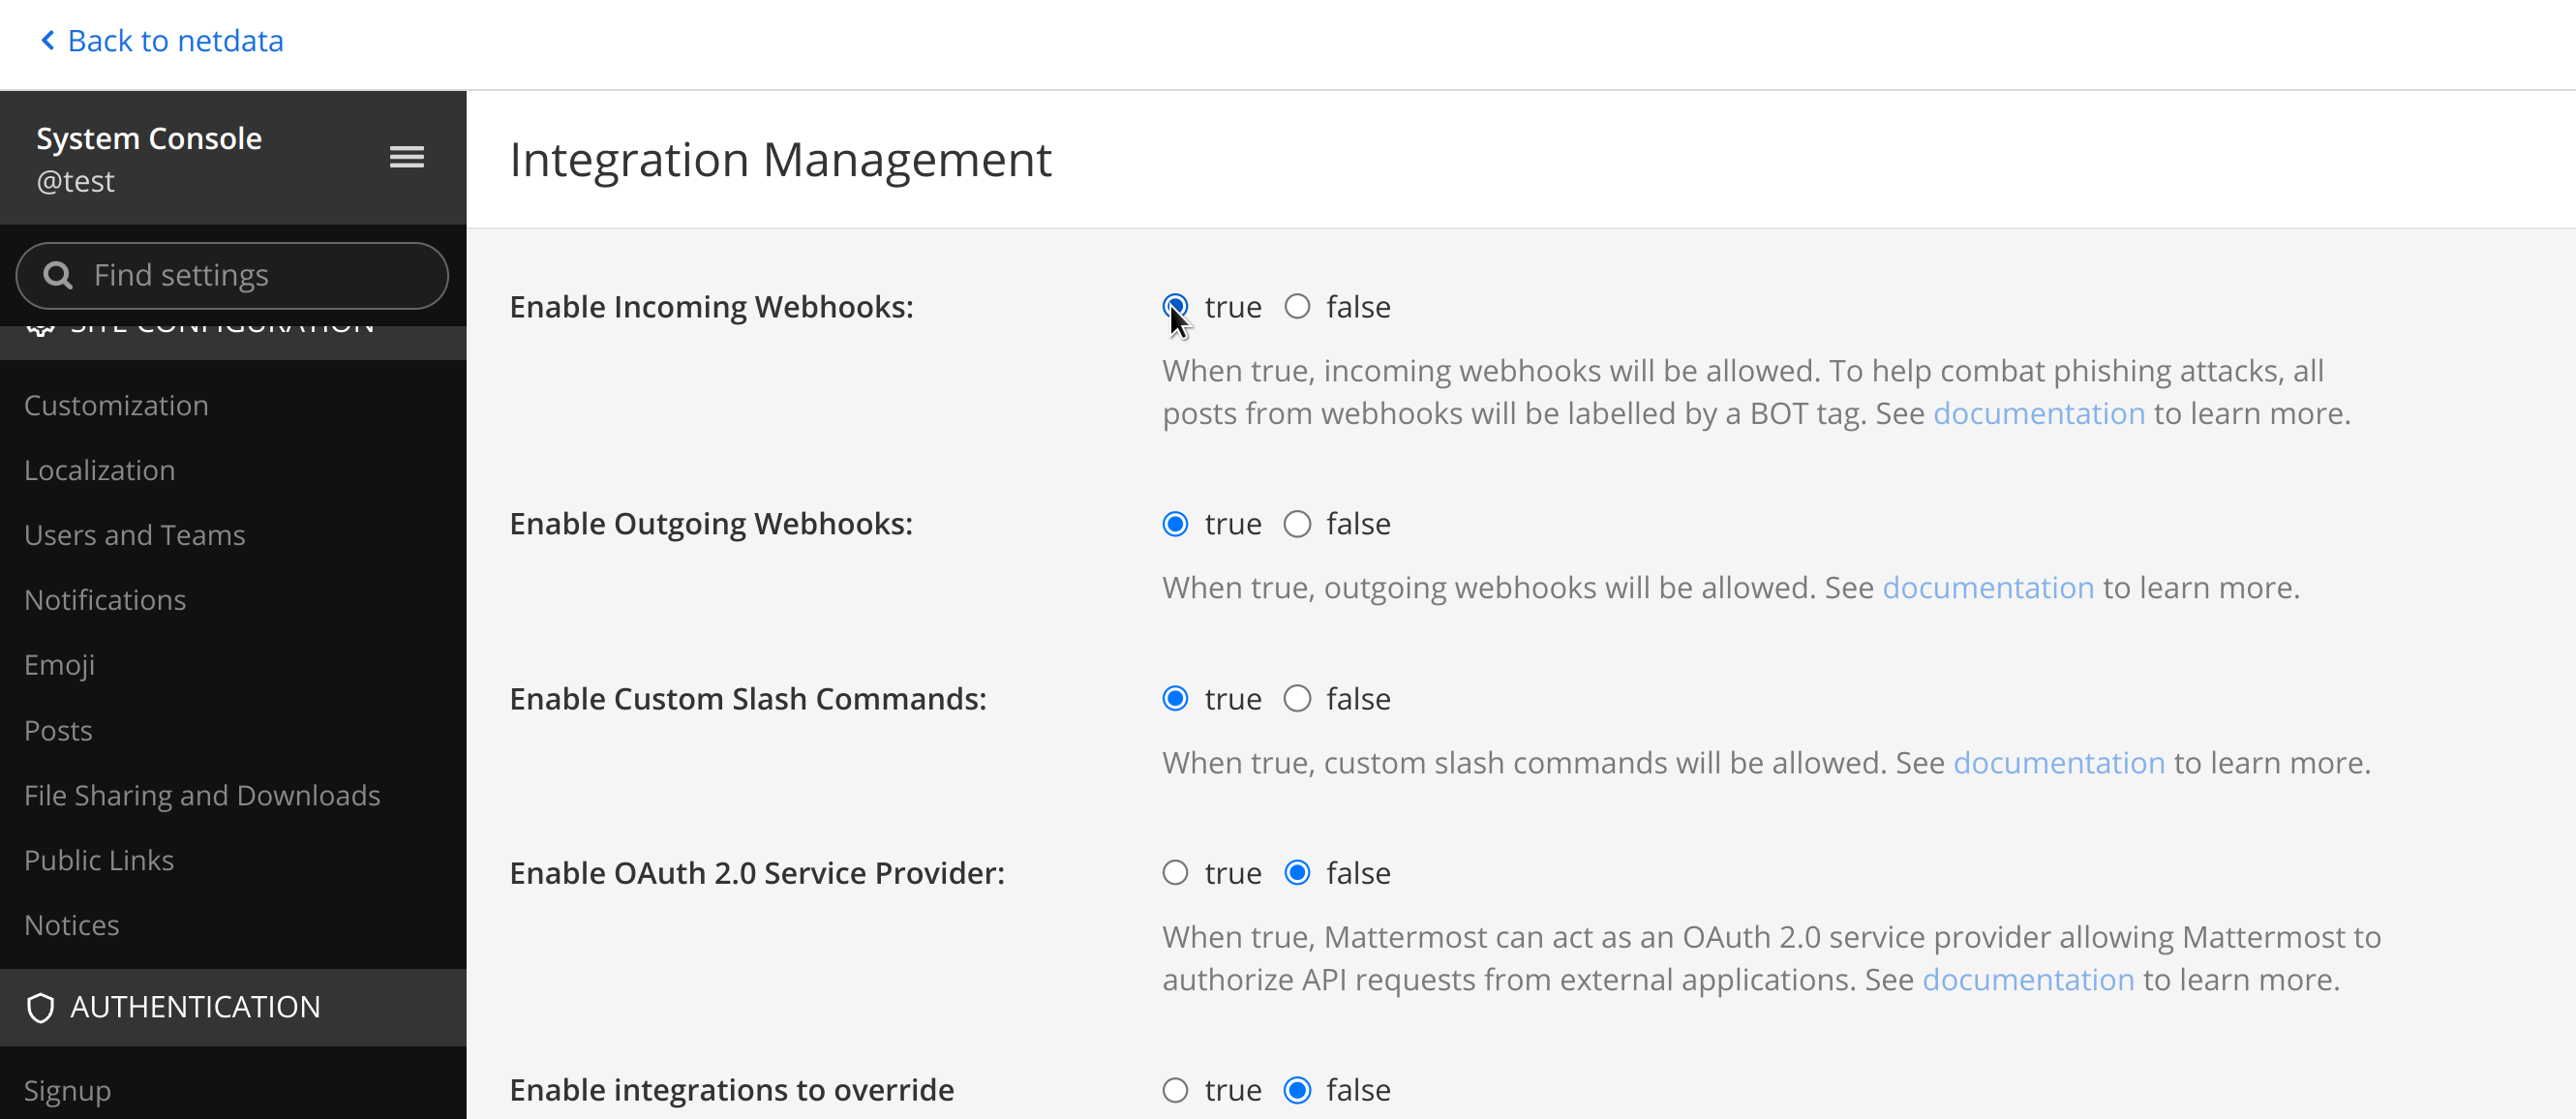 - -2. Select Add Incoming Webhook and add a name and description for the webhook. The description can be up to 500 characters - -3. Select the channel to receive webhook payloads, then select Add to create the webhook - -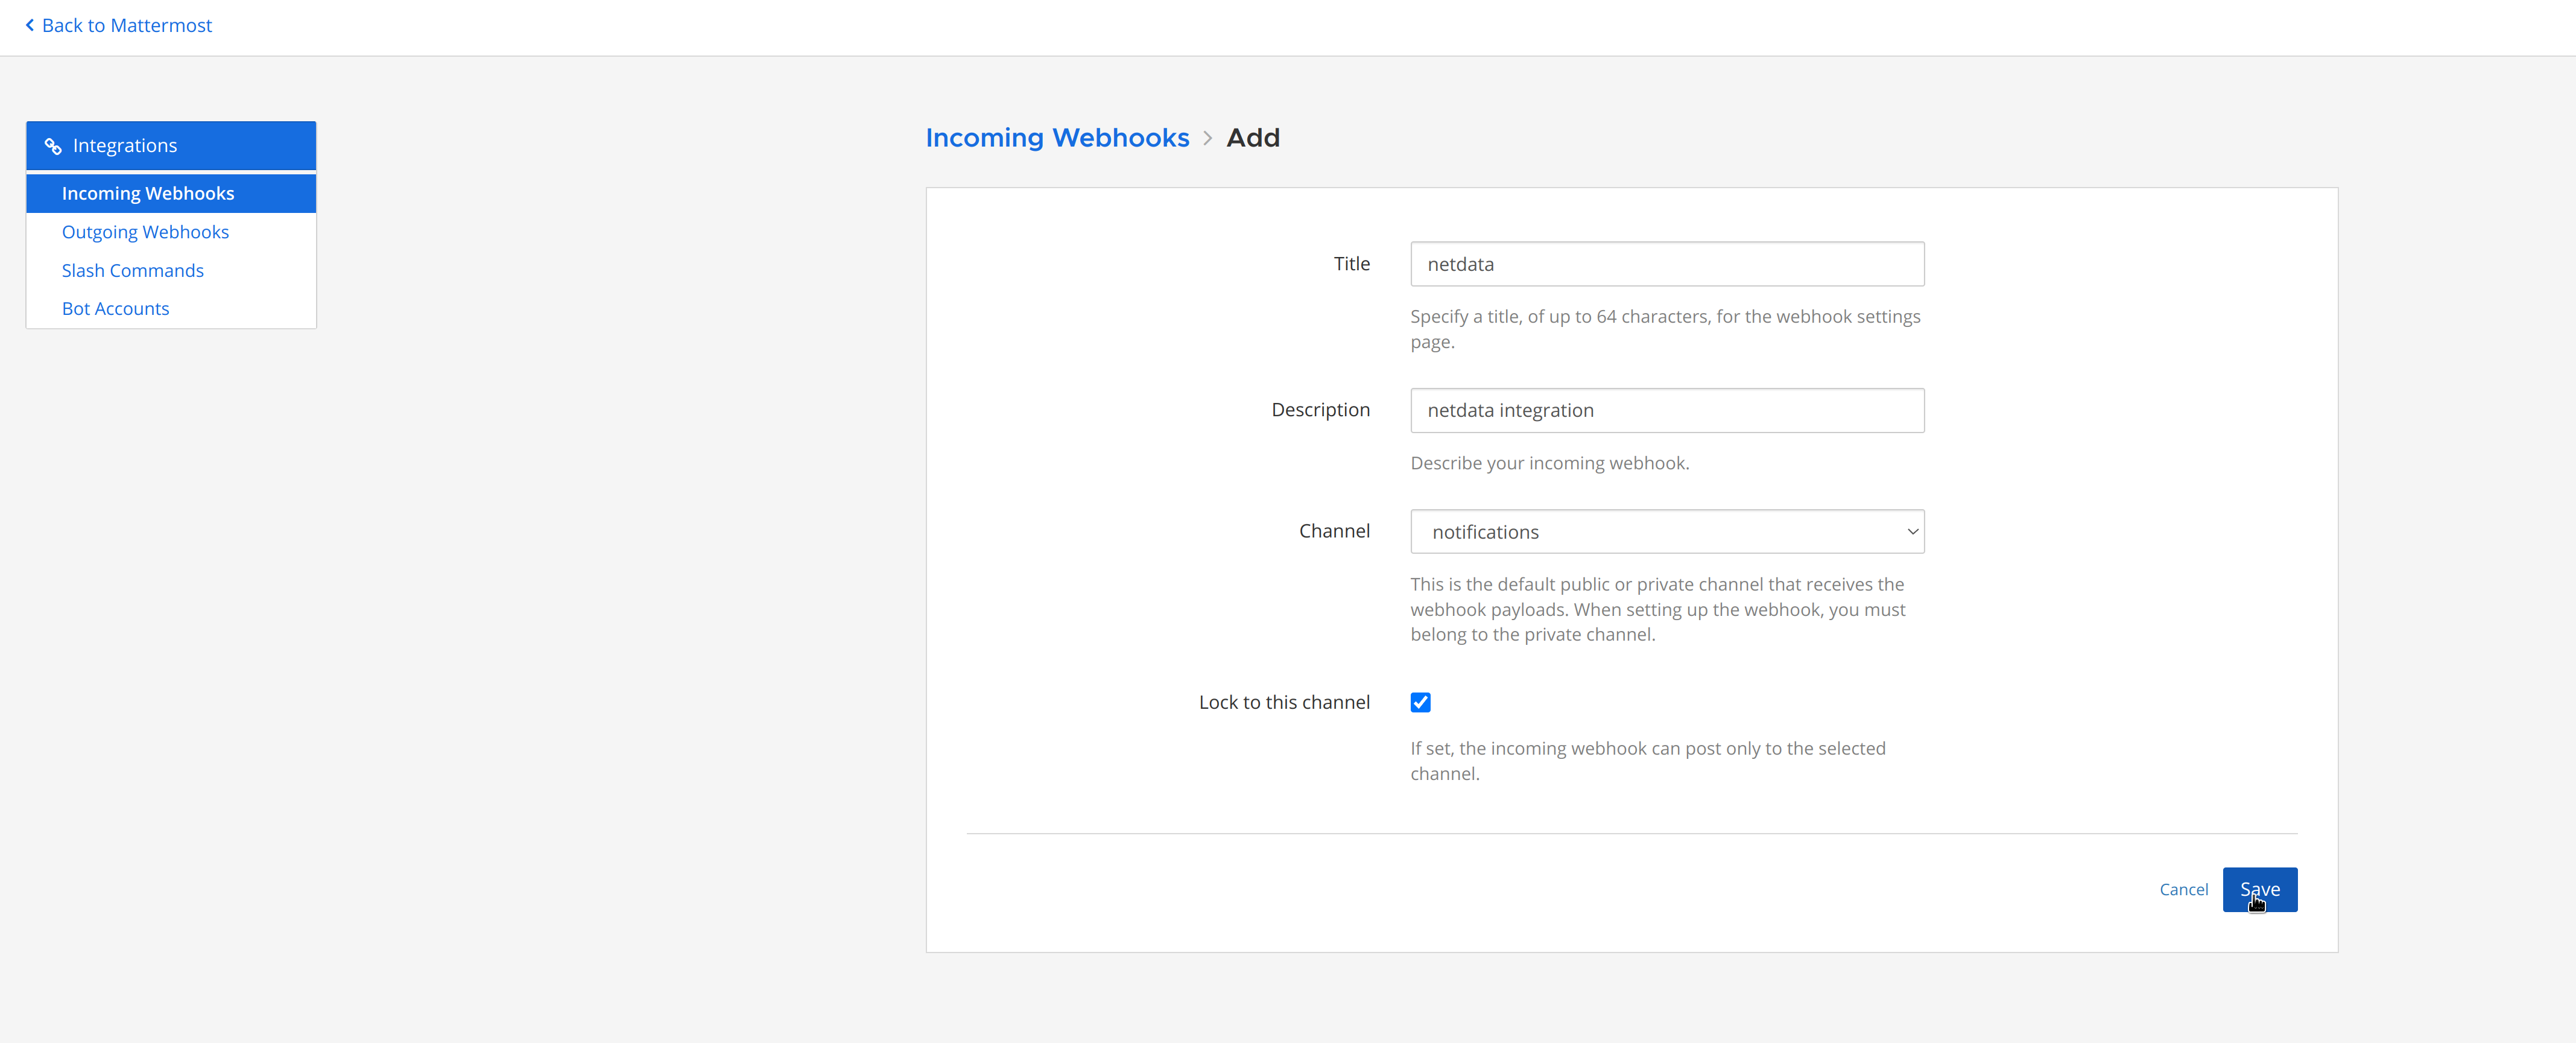 - -4. You will end up with a webhook endpoint that looks like so: -``` -https://your-mattermost-server.com/hooks/xxx-generatedkey-xxx -``` - - Treat this endpoint as a secret. Anyone who has it will be able to post messages to your Mattermost instance. - -For more details please check Mattermost's article [Incoming webhooks for Mattermost](https://developers.mattermost.com/integrate/webhooks/incoming/). diff --git a/docs/cloud/alerts-notifications/add-opsgenie-notification-configuration.md b/docs/cloud/alerts-notifications/add-opsgenie-notification-configuration.md deleted file mode 100644 index 0a80311ef..000000000 --- a/docs/cloud/alerts-notifications/add-opsgenie-notification-configuration.md +++ /dev/null @@ -1,37 +0,0 @@ -# Add Opsgenie notification configuration - -From the Cloud interface, you can manage your space's notification settings and from these you can add a specific configuration to get notifications delivered on Opsgenie. - -## Prerequisites - -To add Opsgenie notification configurations you need: - -- A Netdata Cloud account -- Access to the space as an **administrator** -- Space on **Business** plan or higher -- Have a permission to add new integrations in Opsgenie. - -## Steps - -1. Click on the **Space settings** cog (located above your profile icon) -1. Click on the **Notification** tab -1. Click on the **+ Add configuration** button (near the top-right corner of your screen) -1. On the **Opsgenie** card click on **+ Add** -1. A modal will be presented to you to enter the required details to enable the configuration: - 1. **Notification settings** are Netdata specific settings - - Configuration name - you can optionally provide a name for your configuration you can easily refer to it - - Rooms - by specifying a list of Rooms you are select to which nodes or areas of your infrastructure you want to be notified using this configuration - - Notification - you specify which notifications you want to be notified using this configuration: All Alerts and unreachable, All Alerts, Critical only - 1. **Integration configuration** are the specific notification integration required settings, which vary by notification method. For Opsgenie: - - API Key - a key provided on Opsgenie for the channel you want to receive your notifications. For more details check [how to configure this on Opsgenie](#settings-on-opsgenie) - -## Settings on Opsgenie - -To enable the Netdata integration on Opsgenie you need: -1. Go to integrations tab of your team, click **Add integration**. - - 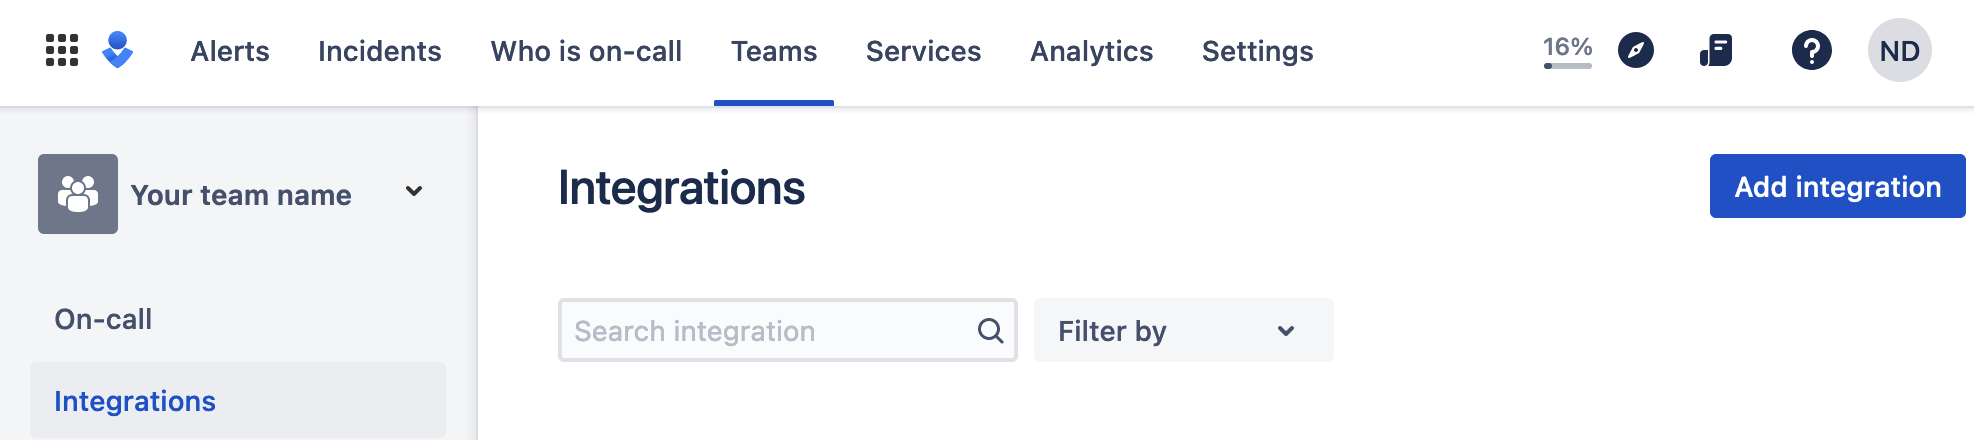 - -1. Pick **API** from available integrations. Copy your API Key and press **Save Integration**. - -1. Paste copied API key into the corresponding field in **Integration configuration** section of Opsgenie modal window in Netdata. diff --git a/docs/cloud/alerts-notifications/add-pagerduty-notification-configuration.md b/docs/cloud/alerts-notifications/add-pagerduty-notification-configuration.md deleted file mode 100644 index eec4f94c1..000000000 --- a/docs/cloud/alerts-notifications/add-pagerduty-notification-configuration.md +++ /dev/null @@ -1,43 +0,0 @@ -# Add PagerDuty notification configuration - -From the Cloud interface, you can manage your space's notification settings and from these you can add a specific configuration to get notifications delivered on PagerDuty. - -## Prerequisites - -To add PagerDuty notification configurations you need: - -- A Cloud account -- Access to the space as and **administrator** -- Space needs to be on **Business** plan or higher -- Have a PagerDuty service to receive events, for more details check [how to configure this on PagerDuty](#settings-on-pagerduty) - -## Steps - -1. Click on the **Space settings** cog (located above your profile icon) -1. Click on the **Notification** tab -1. Click on the **+ Add configuration** button (near the top-right corner of your screen) -1. On the **PagerDuty** card click on **+ Add** -1. A modal will be presented to you to enter the required details to enable the configuration: - 1. **Notification settings** are Netdata specific settings - - Configuration name - you can optionally provide a name for your configuration you can easily refer to it - - Rooms - by specifying a list of Rooms you are select to which nodes or areas of your infrastructure you want to be notified using this configuration - - Notification - you specify which notifications you want to be notified using this configuration: All Alerts and unreachable, All Alerts, Critical only - 1. **Integration configuration** are the specific notification integration required settings, which vary by notification method. For PagerDuty: - - Integration Key - is a 32 character key provided by PagerDuty to receive events on your service. For more details check [how to configure this on PagerDuty](#settings-on-pagerduty) - -## Settings on PagerDuty - -## Enable webhook integrations on PagerDuty - -To enable the webhook integrations on PagerDuty you need: -1. Create a service to receive events from your services directory page: - - 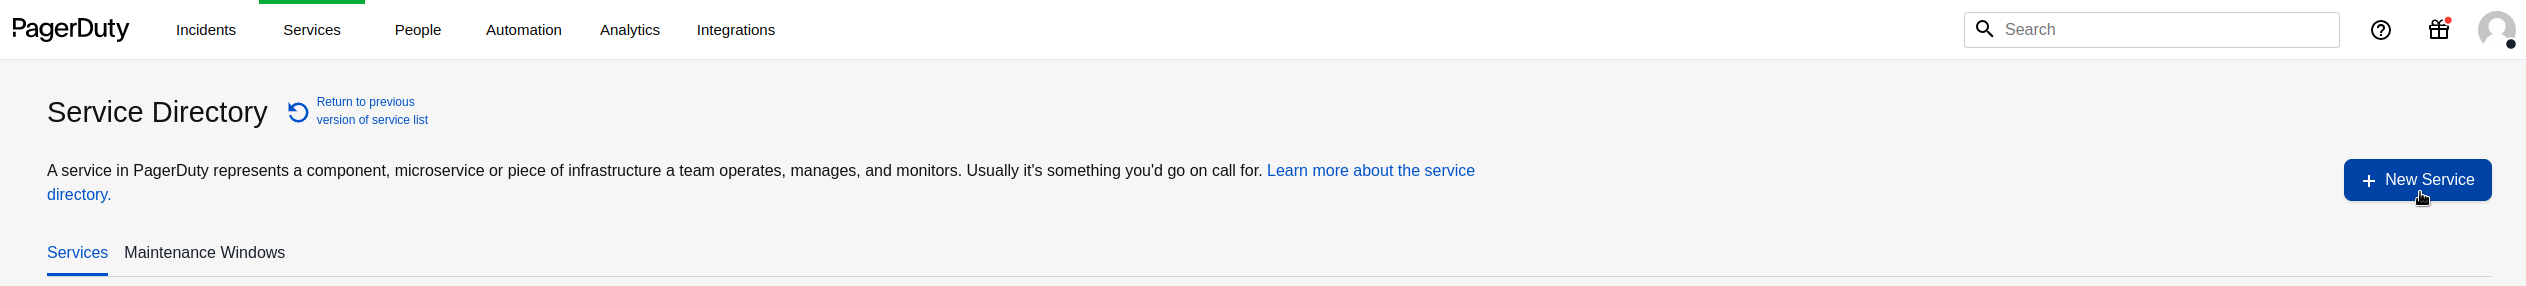 - -1. At step 3, select `Events API V2` Integration:or **View Webhooks** if you already have some defined - - 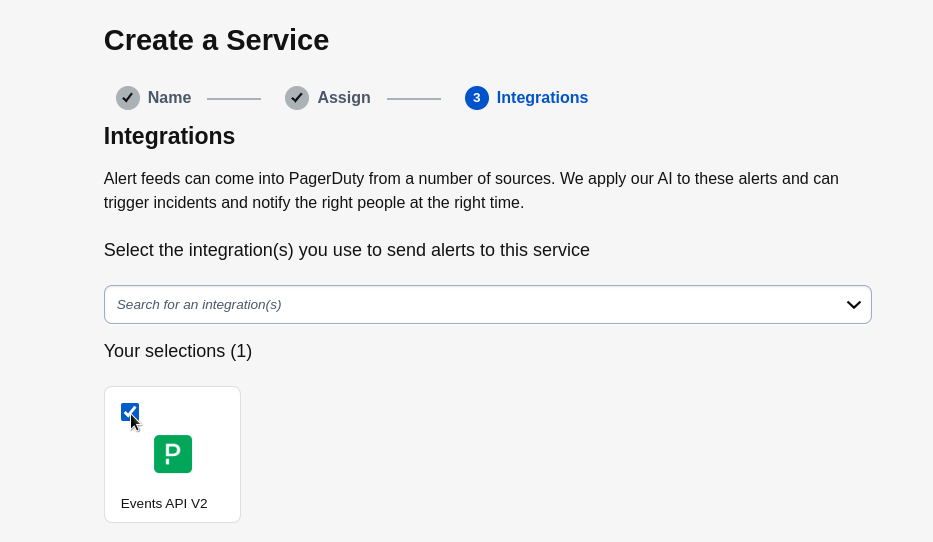 - -1. Once the service is created you will be redirected to its configuration page, where you can copy the **integration key**, that you will need need to add to your notification configuration on Netdata UI: - - 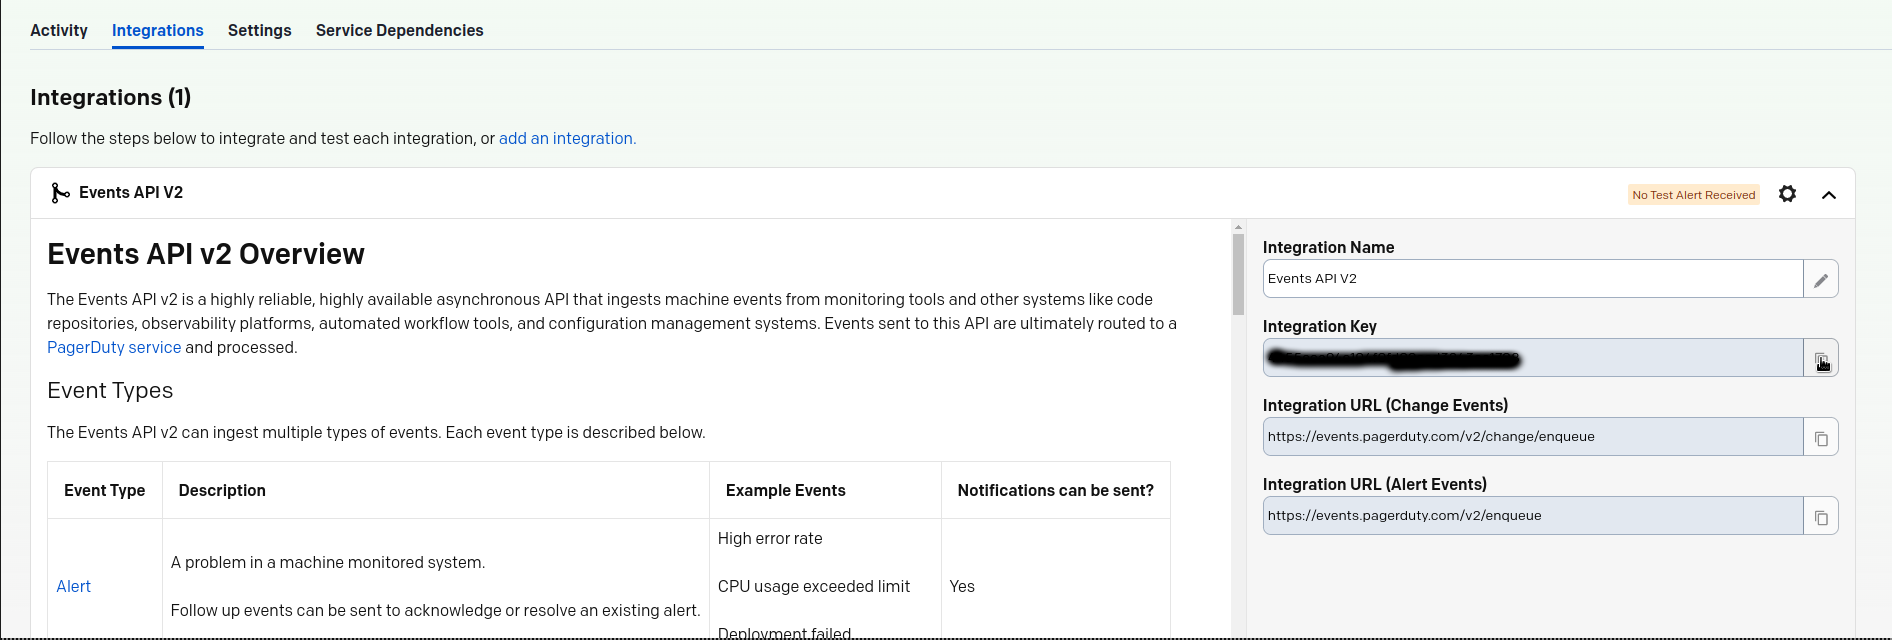 diff --git a/docs/cloud/alerts-notifications/add-rocketchat-notification-configuration.md b/docs/cloud/alerts-notifications/add-rocketchat-notification-configuration.md deleted file mode 100644 index 6a81ad1d7..000000000 --- a/docs/cloud/alerts-notifications/add-rocketchat-notification-configuration.md +++ /dev/null @@ -1,49 +0,0 @@ -# Add RocketChat notification configuration - -From the Cloud interface, you can manage your space's notification settings and from these you can add a specific configuration to get notifications delivered on RocketChat. - -## Prerequisites - -To add RocketChat notification configurations you need: - -- A Netdata Cloud account -- Access to the space as an **administrator** -- Space needs to be on **Business** plan or higher -- Have a RocketChat app on your workspace to receive the webhooks, for more details check [how to configure this on RocketChat](#settings-on-rocketchat) - -## Steps - -1. Click on the **Space settings** cog (located above your profile icon) -1. Click on the **Notification** tab -1. Click on the **+ Add configuration** button (near the top-right corner of your screen) -1. On the **RocketChat** card click on **+ Add** -1. A modal will be presented to you to enter the required details to enable the configuration: - 1. **Notification settings** are Netdata specific settings - - Configuration name - you can optionally provide a name for your configuration you can easily refer to it - - Rooms - by specifying a list of Rooms you are select to which nodes or areas of your infrastructure you want to be notified using this configuration - - Notification - you specify which notifications you want to be notified using this configuration: All Alerts and unreachable, All Alerts, Critical only - 1. **Integration configuration** are the specific notification integration required settings, which vary by notification method. For RocketChat: - - Webhook URL - URL provided on RocketChat for the channel you want to receive your notifications. For more details check [how to configure this on RocketChat](#settings-on-rocketchat) - -## Settings on RocketChat - -To enable the webhook integrations on RocketChat you need: -1. In RocketChat, Navigate to Administration > Workspace > Integrations. - -2. Click +New at the top right corner. - -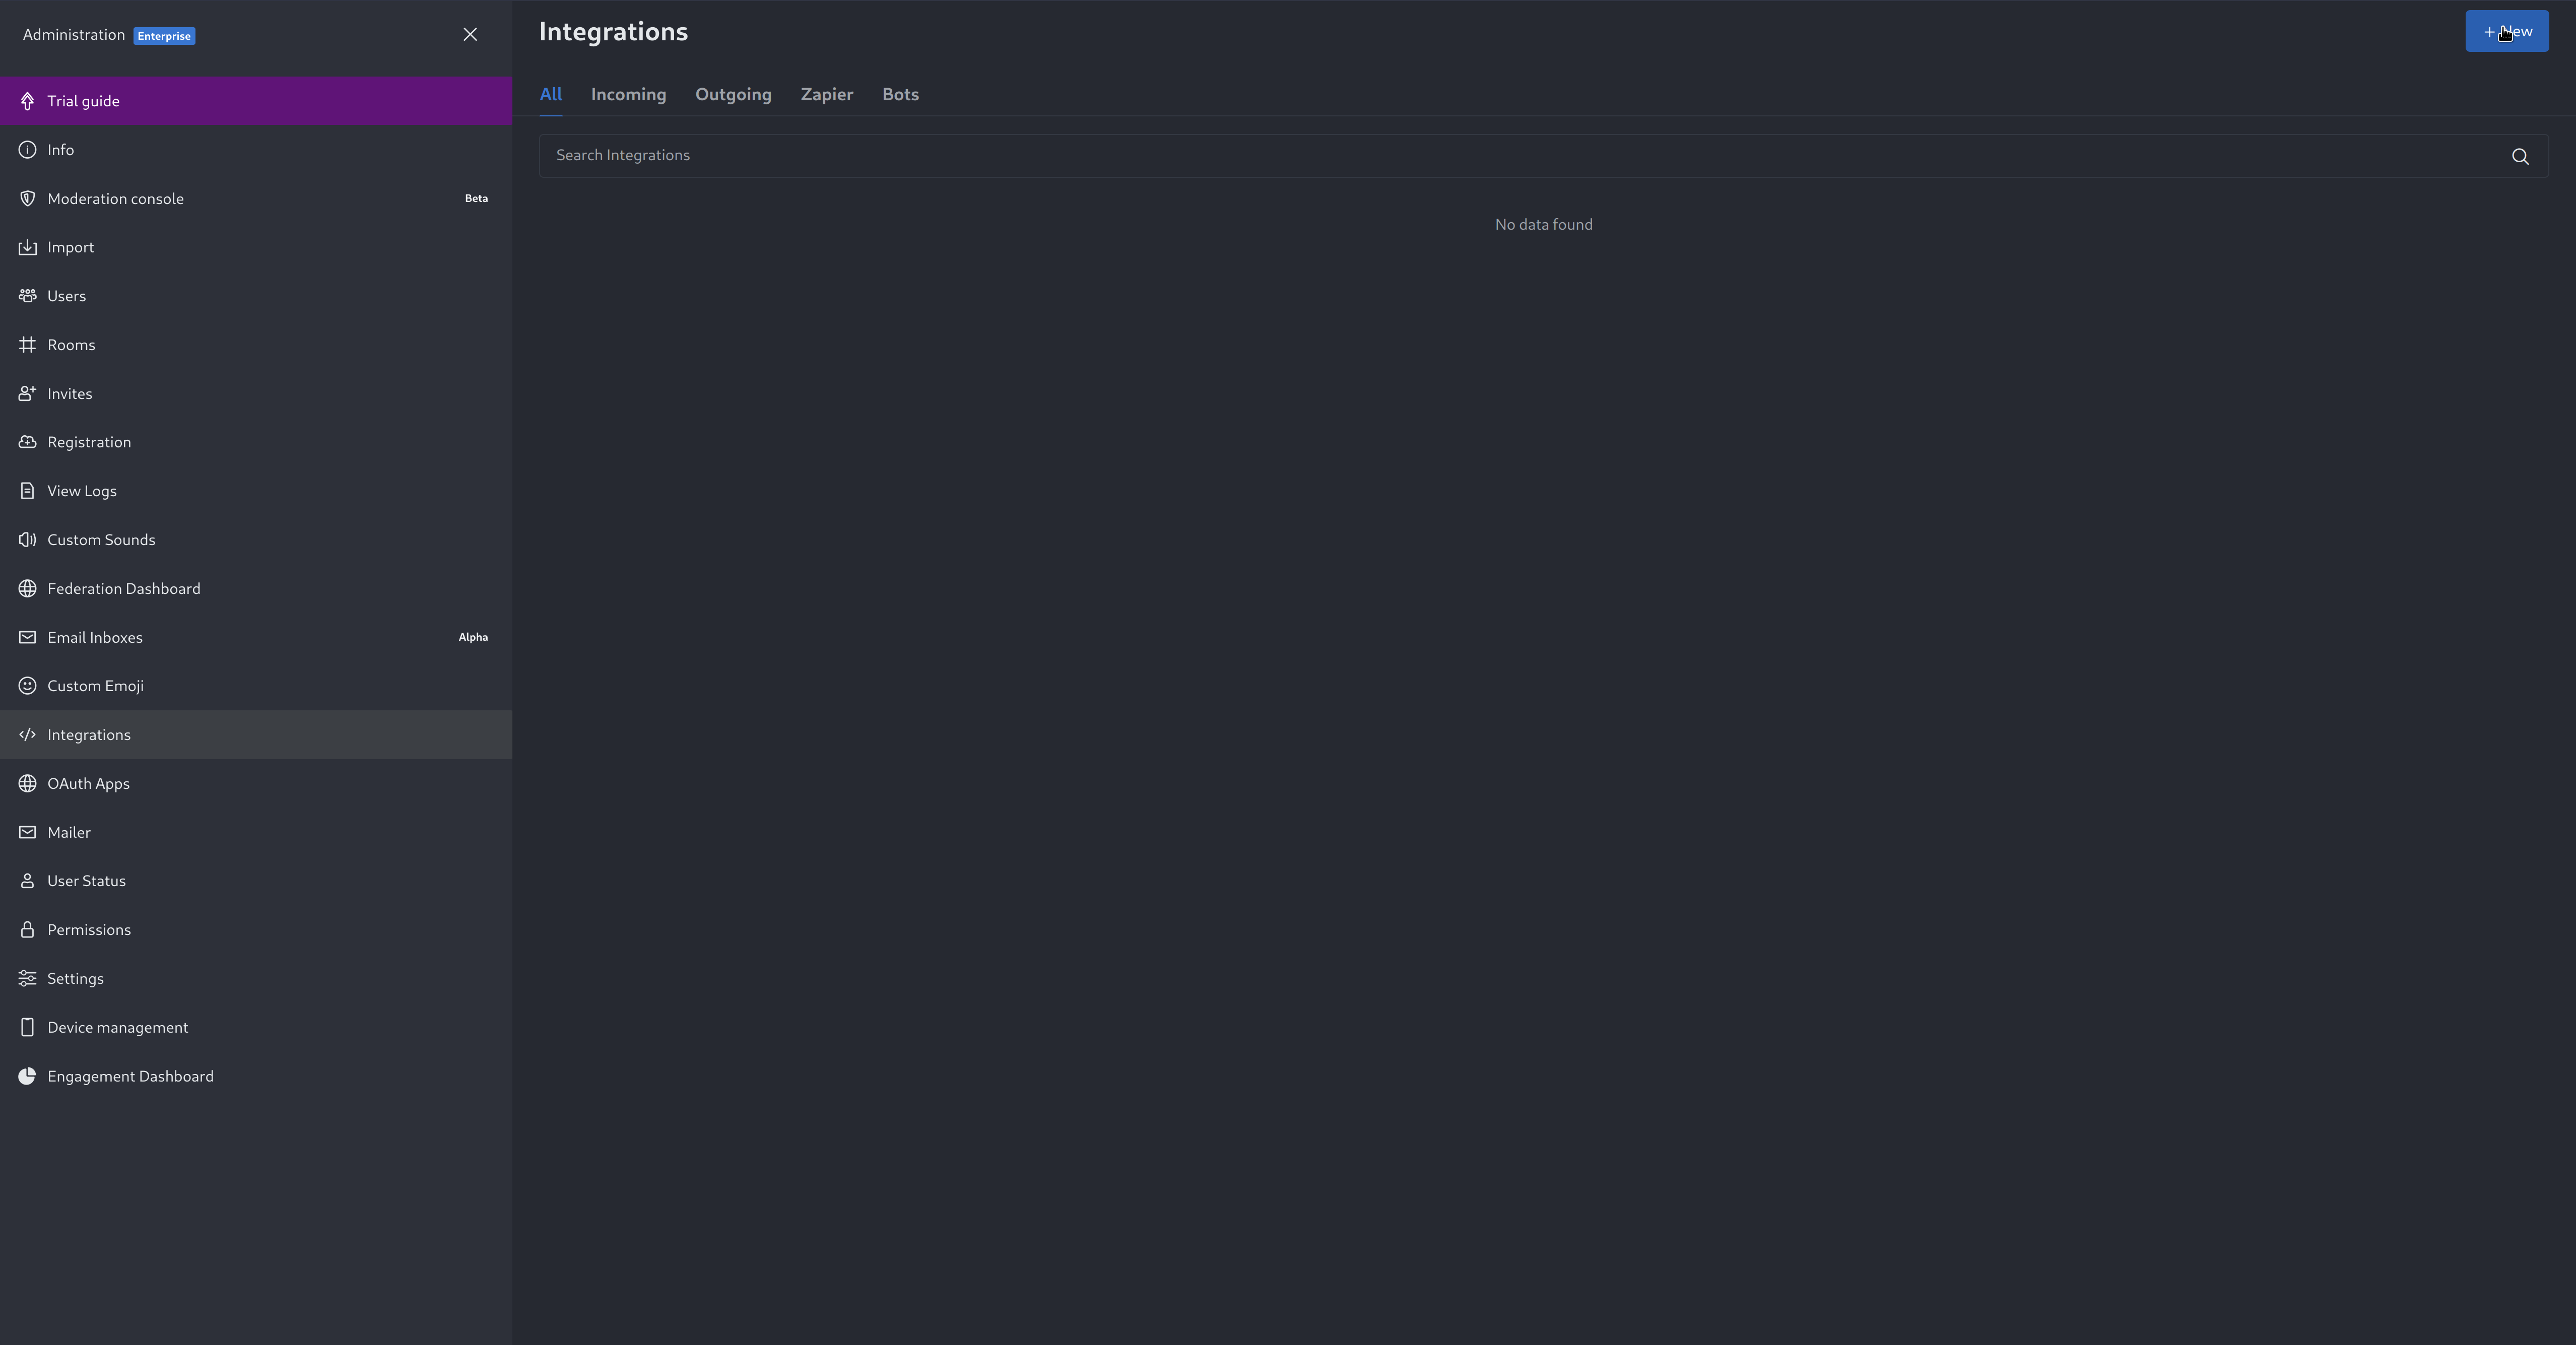 - -3. For more details about each parameter, check [create-a-new-incoming-webhook](https://docs.rocket.chat/use-rocket.chat/workspace-administration/integrations#create-a-new-incoming-webhook). - -4. After configuring integration, click Save. - -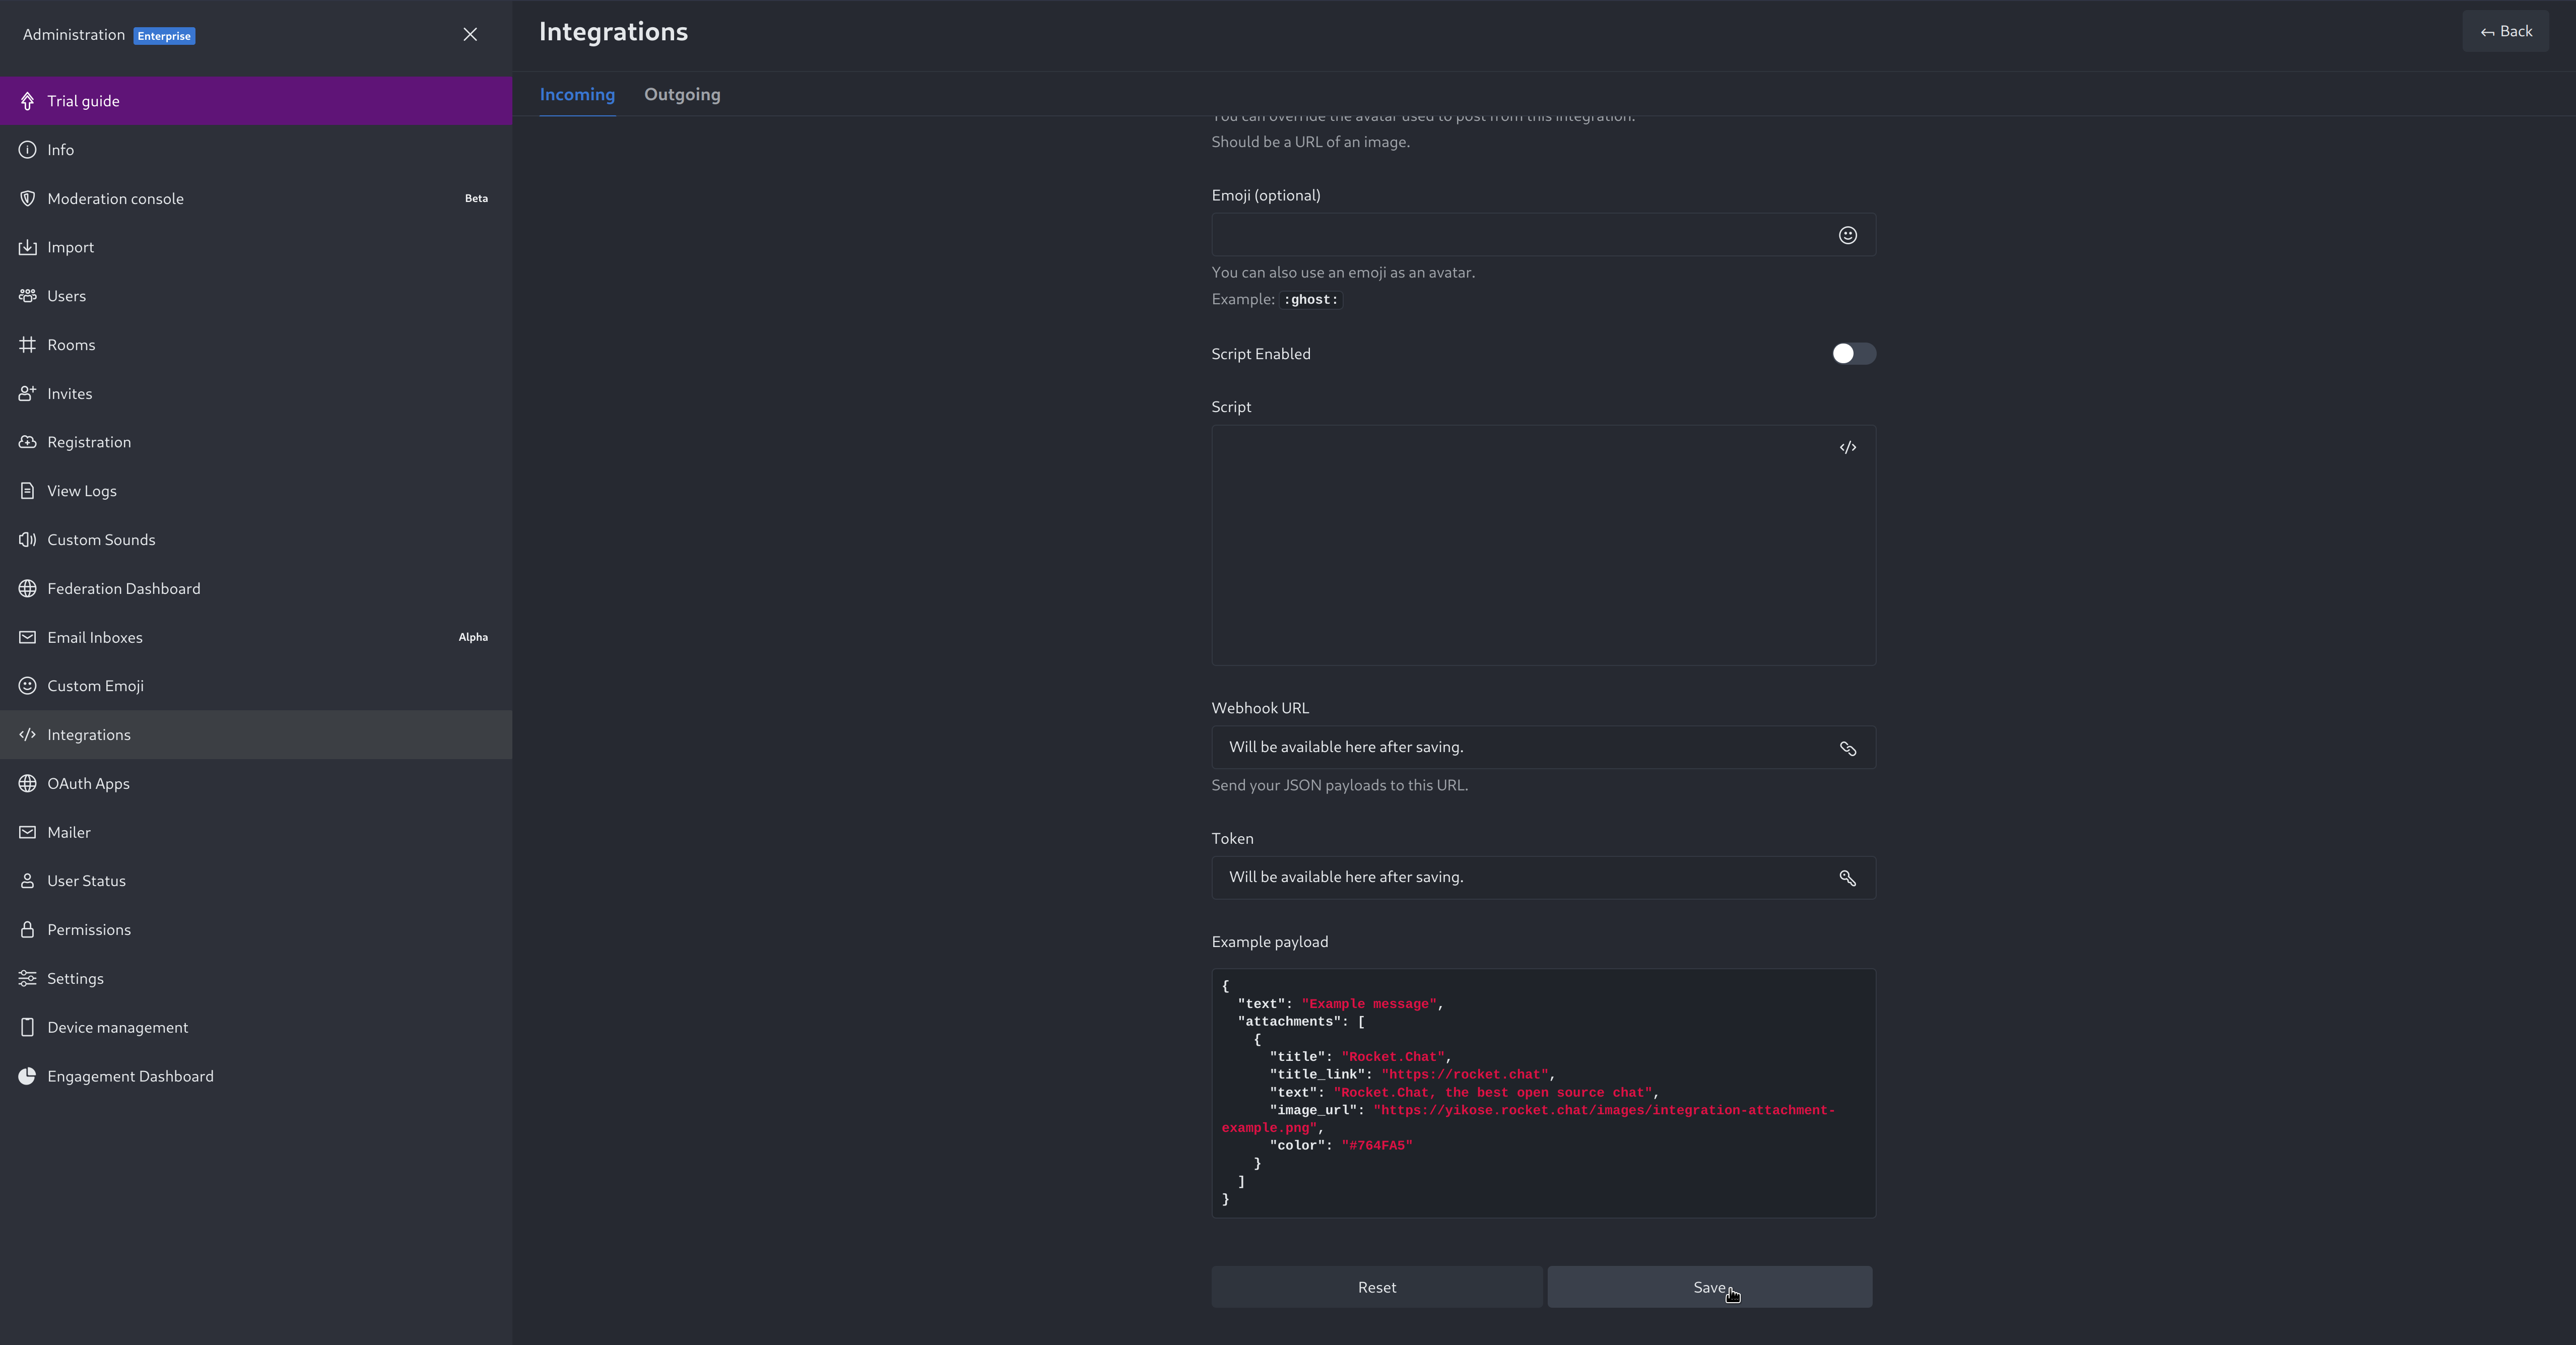 - -4. You will end up with a webhook endpoint that looks like so: -``` -https://your-server.rocket.chat/hooks/YYYYYYYYYYYYYYYYYYYYYYYY/XXXXXXXXXXXXXXXXXXXXXXXXXXXXXXXXXXXXXXXXXXXXXXXX -``` - - Treat this endpoint as a secret. Anyone who has it will be able to post messages to your RocketChat instance. - -For more details please check RocketChat's article [Incoming webhooks for RocketChat](https://docs.rocket.chat/use-rocket.chat/workspace-administration/integrations/). diff --git a/docs/cloud/alerts-notifications/add-slack-notification-configuration.md b/docs/cloud/alerts-notifications/add-slack-notification-configuration.md deleted file mode 100644 index ed845b4d3..000000000 --- a/docs/cloud/alerts-notifications/add-slack-notification-configuration.md +++ /dev/null @@ -1,47 +0,0 @@ -# Add Slack notification configuration - -From the Cloud interface, you can manage your space's notification settings and from these you can add a specific configuration to get notifications delivered on Slack. - -## Prerequisites - -To add slack notification configurations you need: - -- A Netdata Cloud account -- Access to the space as an **administrator** -- Space needs to be on **Business** plan or higher -- Have a Slack app on your workspace to receive the webhooks, for more details check [how to configure this on Slack](#settings-on-slack) - -## Steps - -1. Click on the **Space settings** cog (located above your profile icon) -1. Click on the **Notification** tab -1. Click on the **+ Add configuration** button (near the top-right corner of your screen) -1. On the **Slack** card click on **+ Add** -1. A modal will be presented to you to enter the required details to enable the configuration: - 1. **Notification settings** are Netdata specific settings - - Configuration name - you can optionally provide a name for your configuration you can easily refer to it - - Rooms - by specifying a list of Rooms you are select to which nodes or areas of your infrastructure you want to be notified using this configuration - - Notification - you specify which notifications you want to be notified using this configuration: All Alerts and unreachable, All Alerts, Critical only - 1. **Integration configuration** are the specific notification integration required settings, which vary by notification method. For Slack: - - Webhook URL - URL provided on Slack for the channel you want to receive your notifications. For more details check [how to configure this on Slack](#settings-on-slack) - -## Settings on Slack - -To enable the webhook integrations on Slack you need: -1. Create an app to receive webhook integrations. Check [Create an app](https://api.slack.com/apps?new_app=1) from Slack documentation for further details -1. Install the app on your workspace -1. Configure Webhook URLs for your workspace - - On your app go to **Incoming Webhooks** and click on **activate incoming webhooks** - - 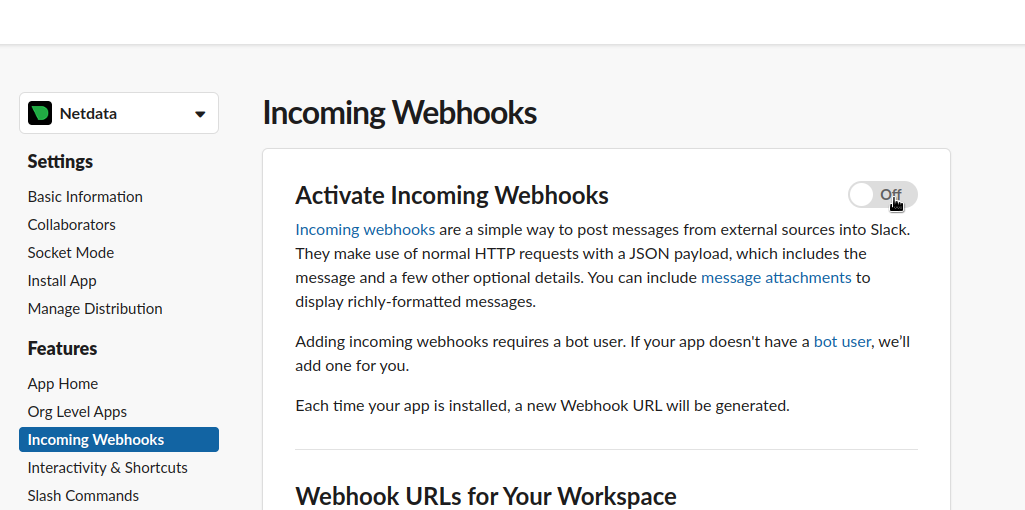 - - - At the bottom of **Webhook URLs for Your Workspace** section you have **Add New Webhook to Workspace** - - After pressing that specify the channel where you want your notifications to be delivered - - 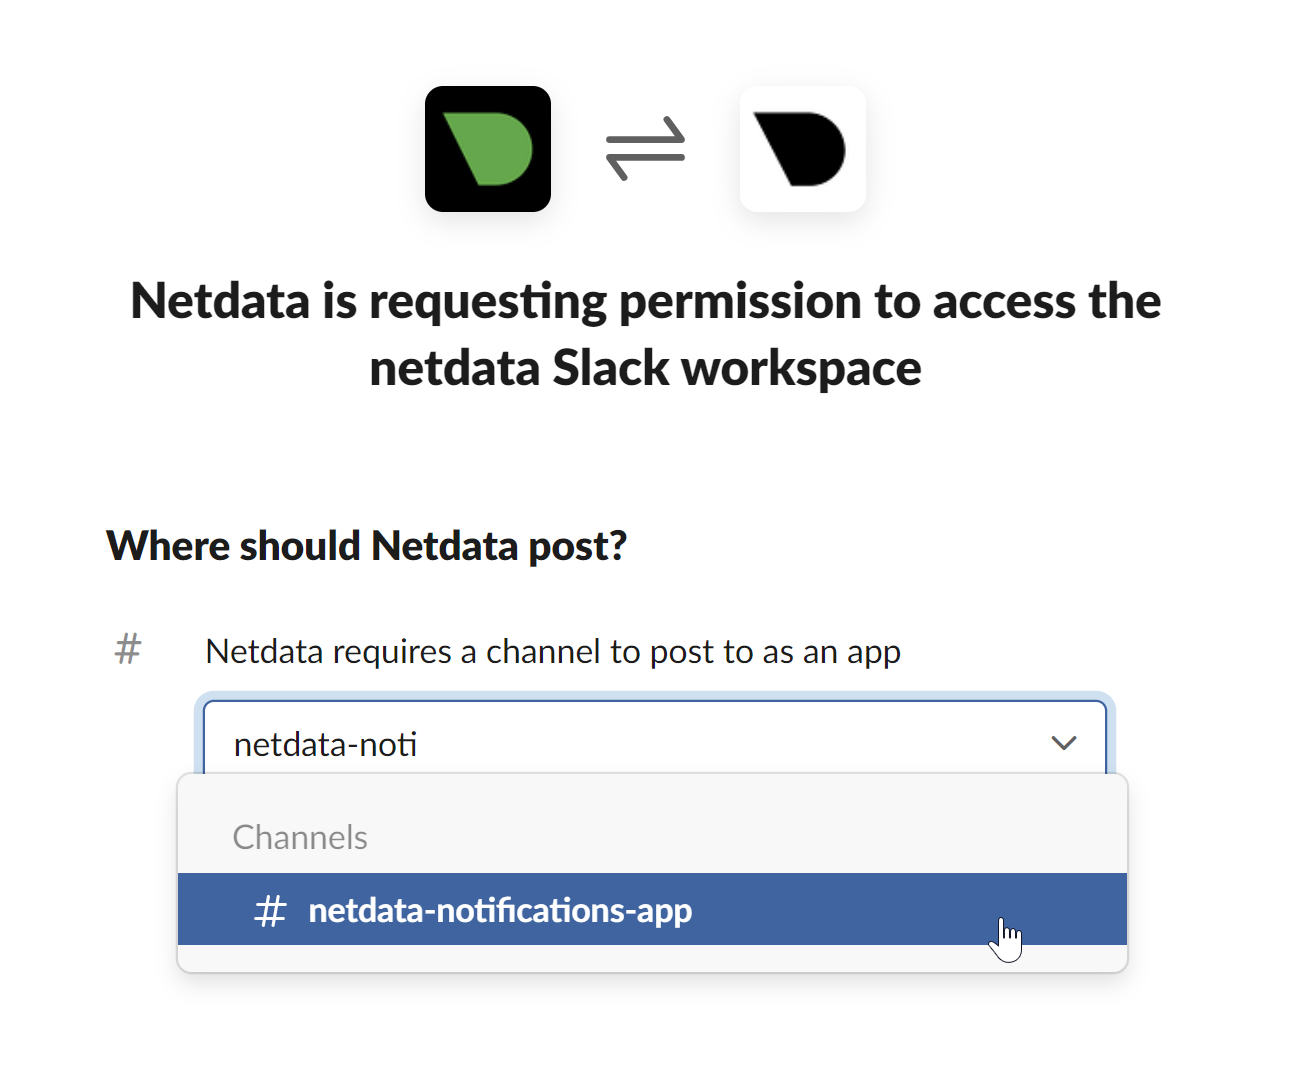 - - - Once completed copy the Webhook URL that you will need to add to your notification configuration on Netdata UI - - 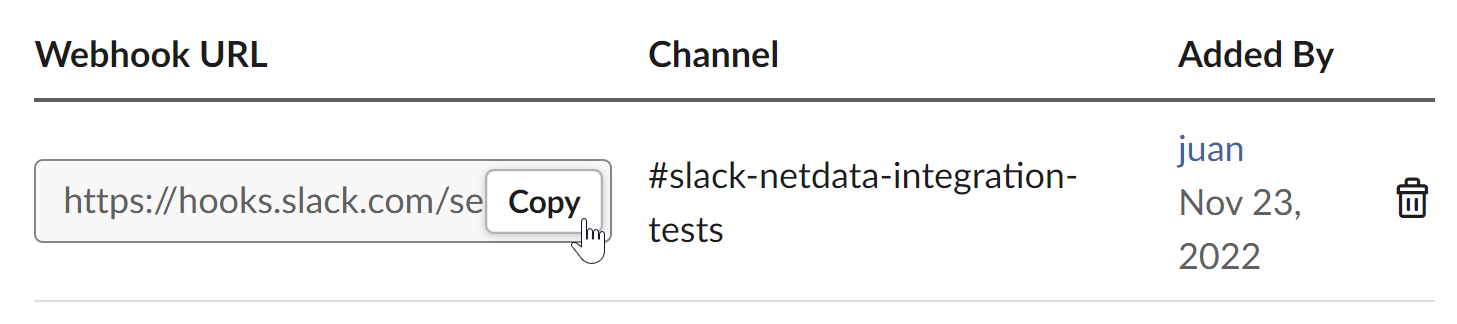 - -For more details please check Slacks's article [Incoming webhooks for Slack](https://slack.com/help/articles/115005265063-Incoming-webhooks-for-Slack). diff --git a/docs/cloud/alerts-notifications/add-webhook-notification-configuration.md b/docs/cloud/alerts-notifications/add-webhook-notification-configuration.md deleted file mode 100644 index 4fb518f63..000000000 --- a/docs/cloud/alerts-notifications/add-webhook-notification-configuration.md +++ /dev/null @@ -1,234 +0,0 @@ -# Add webhook notification configuration - -From the Cloud interface, you can manage your space's notification settings and from these you can add a specific configuration to get notifications delivered on a webhook using a predefined schema. - -## Prerequisites - -To add webhook notification configurations you need: - -- A Netdata Cloud account -- Access to the space as an **administrator** -- Space needs to be on **Pro** plan or higher -- Have an app that allows you to receive webhooks following a predefined schema, for more details check [how to create the webhook service](#webhook-service) - -## Steps - -1. Click on the **Space settings** cog (located above your profile icon) -1. Click on the **Notification** tab -1. Click on the **+ Add configuration** button (near the top-right corner of your screen) -1. On the **webhook** card click on **+ Add** -1. A modal will be presented to you to enter the required details to enable the configuration: - 1. **Notification settings** are Netdata specific settings - - Configuration name - you can optionally provide a name for your configuration you can easily refer to it - - Rooms - by specifying a list of Rooms you are select to which nodes or areas of your infrastructure you want to be notified using this configuration - - Notification - you specify which notifications you want to be notified using this configuration: All Alerts and unreachable, All Alerts, Critical only - 1. **Integration configuration** are the specific notification integration required settings, which vary by notification method. For webhook: - - Webhook URL - webhook URL is the url of the service that Netdata will send notifications to. In order to keep the communication secured, we only accept HTTPS urls. Check [how to create the webhook service](#webhook-service). - - Extra headers - these are optional key-value pairs that you can set to be included in the HTTP requests sent to the webhook URL. For more details check [Extra headers](#extra-headers) - - Authentication Mechanism - Netdata webhook integration supports 3 different authentication mechanisms. For more details check [Authentication mechanisms](#authentication-mechanisms): - - Mutual TLS (recommended) - default authentication mechanism used if no other method is selected. - - Basic - the client sends a request with an Authorization header that includes a base64-encoded string in the format **username:password**. These will settings will be required inputs. - - Bearer - the client sends a request with an Authorization header that includes a **bearer token**. This setting will be a required input. - -## Webhook service - -A webhook integration allows your application to receive real-time alerts from Netdata by sending HTTP requests to a specified URL. In this document, we'll go over the steps to set up a generic webhook integration, including adding headers, and implementing different types of authorization mechanisms. - -### Netdata webhook integration - -A webhook integration is a way for one service to notify another service about events that occur within it. This is done by sending an HTTP POST request to a specified URL (known as the "webhook URL") when an event occurs. - -Netdata webhook integration service will send alert notifications to the destination service as soon as they are detected. - -The notification content sent to the destination service will be a JSON object having these properties: - -| field | type | description | -|:----------------------------------|:------------------------------|:--------------------------------------------------------------------------| -| message | string | A summary message of the alert. | -| alarm | string | The alert the notification is about. | -| info | string | Additional info related with the alert. | -| chart | string | The chart associated with the alert. | -| context | string | The chart context. | -| space | string | The space where the node that raised the alert is assigned. | -| rooms | object[object(string,string)] | Object with list of rooms names and urls where the node belongs to. | -| family | string | Context family. | -| class | string | Classification of the alert, e.g. "Error". | -| severity | string | Alert severity, can be one of "warning", "critical" or "clear". | -| date | string | Date of the alert in ISO8601 format. | -| duration | string | Duration the alert has been raised. | -| additional_active_critical_alerts | integer | Number of additional critical alerts currently existing on the same node. | -| additional_active_warning_alerts | integer | Number of additional warning alerts currently existing on the same node. | -| alarm_url | string | Netdata Cloud URL for this alert. | - -### Extra headers - -When setting up a webhook integration, the user can specify a set of headers to be included in the HTTP requests sent to the webhook URL. - -By default, the following headers will be sent in the HTTP request - -| **Header** | **Value** | -|:------------:|------------------| -| Content-Type | application/json | - -### Authentication mechanisms - -Netdata webhook integration supports 3 different authentication mechanisms: - -#### Mutual TLS authentication (recommended) - -In mutual Transport Layer Security (mTLS) authentication, the client and the server authenticate each other using X.509 certificates. This ensures that the client is connecting to the intended server, and that the server is only accepting connections from authorized clients. - -This is the default authentication mechanism used if no other method is selected. - -To take advantage of mutual TLS, you can configure your server to verify Netdata's client certificate. In order to achieve this, the Netdata client sending the notification supports mutual TLS (mTLS) to identify itself with a client certificate that your server can validate. - -The steps to perform this validation are as follows: - -- Store Netdata CA certificate on a file in your disk. The content of this file should be: - -<details> - <summary>Netdata CA certificate</summary> - -``` ------BEGIN CERTIFICATE----- -MIIF0jCCA7qgAwIBAgIUDV0rS5jXsyNX33evHEQOwn9fPo0wDQYJKoZIhvcNAQEN -BQAwgYAxCzAJBgNVBAYTAlVTMRMwEQYDVQQIEwpDYWxpZm9ybmlhMRYwFAYDVQQH -Ew1TYW4gRnJhbmNpc2NvMRYwFAYDVQQKEw1OZXRkYXRhLCBJbmMuMRIwEAYDVQQL -EwlDbG91ZCBTUkUxGDAWBgNVBAMTD05ldGRhdGEgUm9vdCBDQTAeFw0yMzAyMjIx -MjQzMDBaFw0zMzAyMTkxMjQzMDBaMIGAMQswCQYDVQQGEwJVUzETMBEGA1UECBMK -Q2FsaWZvcm5pYTEWMBQGA1UEBxMNU2FuIEZyYW5jaXNjbzEWMBQGA1UEChMNTmV0 -ZGF0YSwgSW5jLjESMBAGA1UECxMJQ2xvdWQgU1JFMRgwFgYDVQQDEw9OZXRkYXRh -IFJvb3QgQ0EwggIiMA0GCSqGSIb3DQEBAQUAA4ICDwAwggIKAoICAQCwIg7z3R++ -ppQYYVVoMIDlhWO3qVTMsAQoJYEvVa6fqaImUBLW/k19LUaXgUJPohB7gBp1pkjs -QfY5dBo8iFr7MDHtyiAFjcQV181sITTMBEJwp77R4slOXCvrreizhTt1gvf4S1zL -qeHBYWEgH0RLrOAqD0jkOHwewVouO0k3Wf2lEbCq3qRk2HeDvkv0LR7sFC+dDms8 -fDHqb/htqhk+FAJELGRqLeaFq1Z5Eq1/9dk4SIeHgK5pdYqsjpBzOTmocgriw6he -s7F3dOec1ZZdcBEAxOjbYt4e58JwuR81cWAVMmyot5JNCzYVL9e5Vc5n22qt2dmc -Tzw2rLOPt9pT5bzbmyhcDuNg2Qj/5DySAQ+VQysx91BJRXyUimqE7DwQyLhpQU72 -jw29lf2RHdCPNmk8J1TNropmpz/aI7rkperPugdOmxzP55i48ECbvDF4Wtazi+l+ -4kx7ieeLfEQgixy4lRUUkrgJlIDOGbw+d2Ag6LtOgwBiBYnDgYpvLucnx5cFupPY -Cy3VlJ4EKUeQQSsz5kVmvotk9MED4sLx1As8V4e5ViwI5dCsRfKny7BeJ6XNPLnw -PtMh1hbiqCcDmB1urCqXcMle4sRhKccReYOwkLjLLZ80A+MuJuIEAUUuEPCwywzU -R7pagYsmvNgmwIIuJtB6mIJBShC7TpJG+wIDAQABo0IwQDAOBgNVHQ8BAf8EBAMC -AQYwDwYDVR0TAQH/BAUwAwEB/zAdBgNVHQ4EFgQU9IbvOsPSUrpr8H2zSafYVQ9e -Ft8wDQYJKoZIhvcNAQENBQADggIBABQ08aI31VKZs8jzg+y/QM5cvzXlVhcpkZsY -1VVBr0roSBw9Pld9SERrEHto8PVXbadRxeEs4sKivJBKubWAooQ6NTvEB9MHuGnZ -VCU+N035Gq/mhBZgtIs/Zz33jTB2ju3G4Gm9VTZbVqd0OUxFs41Iqvi0HStC3/Io -rKi7crubmp5f2cNW1HrS++ScbTM+VaKVgQ2Tg5jOjou8wtA+204iYXlFpw9Q0qnP -qq6ix7TfLLeRVp6mauwPsAJUgHZluz7yuv3r7TBdukU4ZKUmfAGIPSebtB3EzXfH -7Y326xzv0hEpjvDHLy6+yFfTdBSrKPsMHgc9bsf88dnypNYL8TUiEHlcTgCGU8ts -ud8sWN2M5FEWbHPNYRVfH3xgY2iOYZzn0i+PVyGryOPuzkRHTxDLPIGEWE5susM4 -X4bnNJyKH1AMkBCErR34CLXtAe2ngJlV/V3D4I8CQFJdQkn9tuznohUU/j80xvPH -FOcDGQYmh4m2aIJtlNVP6+/92Siugb5y7HfslyRK94+bZBg2D86TcCJWaaZOFUrR -Y3WniYXsqM5/JI4OOzu7dpjtkJUYvwtg7Qb5jmm8Ilf5rQZJhuvsygzX6+WM079y -nsjoQAm6OwpTN5362vE9SYu1twz7KdzBlUkDhePEOgQkWfLHBJWwB+PvB1j/cUA3 -5zrbwvQf ------END CERTIFICATE----- -``` -</details> - -- Enable client certificate validation on the web server that is doing the TLS termination. Below we show you how to perform this configuration in `NGINX` and `Apache` - - **NGINX** - -```bash -server { - listen 443 ssl default_server; - - # ... existing SSL configuration for server authentication ... - ssl_verify_client on; - ssl_client_certificate /path/to/Netdata_CA.pem; - - location / { - if ($ssl_client_s_dn !~ "CN=app.netdata.cloud") { - return 403; - } - # ... existing location configuration ... - } -} -``` - -**Apache** - -```bash -Listen 443 -<VirtualHost *:443> - # ... existing SSL configuration for server authentication ... - SSLVerifyClient require - SSLCACertificateFile "/path/to/Netdata_CA.pem" -</VirtualHost> -<Directory /var/www/> - Require expr "%{SSL_CLIENT_S_DN_CN} == 'app.netdata.cloud'" - # ... existing directory configuration ... -</Directory> -``` - -#### Basic authentication - -In basic authorization, the client sends a request with an Authorization header that includes a base64-encoded string in the format username:password. The server then uses this information to authenticate the client. If this authentication method is selected, the user can set the user and password that will be used when connecting to the destination service. - -#### Bearer token authentication - -In bearer token authentication, the client sends a request with an Authorization header that includes a bearer token. The server then uses this token to authenticate the client. Bearer tokens are typically generated by an authentication service, and are passed to the client after a successful authentication. If this method is selected, the user can set the token to be used for connecting to the destination service. - -##### Challenge secret - -To validate that you has ownership of the web application that will receive the webhook events, we are using a challenge response check mechanism. - -This mechanism works as follows: - -- The challenge secret parameter that you provide is a shared secret between you and Netdata only. -- On your request for creating a new Webhook integration, we will make a GET request to the url of the webhook, adding a query parameter `crc_token`, consisting of a random string. -- You will receive this request on your application and it must construct an encrypted response, consisting of a base64-encoded HMAC SHA-256 hash created from the crc_token and the shared secret. The response will be in the format: - -```json -{ - "response_token": "sha256=9GKoHJYmcHIkhD+C182QWN79YBd+D+Vkj4snmZrfNi4=" -} -``` - -- We will compare your application's response with the hash that we will generate using the challenge secret, and if they are the same, the integration creation will succeed. - -We will do this validation everytime you update your integration configuration. - -- Response requirements: - - A base64 encoded HMAC SHA-256 hash created from the crc_token and the shared secret. - - Valid response_token and JSON format. - - Latency less than 5 seconds. - - 200 HTTP response code. - -**Example response token generation in Python:** - -Here you can see how to define a handler for a Flask application in python 3: - -```python -import base64 -import hashlib -import hmac -import json - -key ='YOUR_CHALLENGE_SECRET' - -@app.route('/webhooks/netdata') -def webhook_challenge(): - token = request.args.get('crc_token').encode('ascii') - - # creates HMAC SHA-256 hash from incomming token and your consumer secret - sha256_hash_digest = hmac.new(key.encode(), - msg=token, - digestmod=hashlib.sha256).digest() - - # construct response data with base64 encoded hash - response = { - 'response_token': 'sha256=' + base64.b64encode(sha256_hash_digest).decode('ascii') - } - - # returns properly formatted json response - return json.dumps(response) -``` - -#### Related topics - -- [Alerts Configuration](https://github.com/netdata/netdata/blob/master/health/README.md) -- [Alert Notifications](https://github.com/netdata/netdata/blob/master/docs/cloud/alerts-notifications/notifications.md) -- [Manage notification methods](https://github.com/netdata/netdata/blob/master/docs/cloud/alerts-notifications/manage-notification-methods.md) diff --git a/docs/cloud/manage/organize-your-infrastrucutre-invite-your-team.md b/docs/cloud/manage/organize-your-infrastrucutre-invite-your-team.md index 95bc1741d..b36e0806b 100644 --- a/docs/cloud/manage/organize-your-infrastrucutre-invite-your-team.md +++ b/docs/cloud/manage/organize-your-infrastrucutre-invite-your-team.md @@ -128,7 +128,7 @@ Click on the gear icon of the War Room's name in the top of the page to do that. 2. To **include an existing node** to a War Room or **connect a new node\*** click on **Nodes** tab. Choose any connected node you want to add to this War Room by clicking on the checkbox next to its hostname, then click **+ Add** at the top of the panel. 3. To **add existing users to a War Room**, click on **Add Users**. - See our [invite doc](#invite-your-team.md) for details on inviting new users to your Space in Netdata Cloud. + See our [invite section](#invite-your-team) for details on inviting new users to your Space in Netdata Cloud. > #### Note > diff --git a/docs/cloud/netdata-functions.md b/docs/cloud/netdata-functions.md index 80616ca41..caff9b35d 100644 --- a/docs/cloud/netdata-functions.md +++ b/docs/cloud/netdata-functions.md @@ -30,11 +30,19 @@ functions - [plugins.d](https://github.com/netdata/netdata/blob/master/collector #### What functions are currently available? -| Function | Description | plugin - module | -| :-- | :-- | :-- | -| processes | Detailed information on the currently running processes on the node. | [apps.plugin](https://github.com/netdata/netdata/blob/master/collectors/apps.plugin/README.md) | -| ebpf_socket | Detailed socket information. | [ebpf.plugin](https://github.com/netdata/netdata/blob/master/collectors/ebpf.plugin/README.md#ebpf_thread) | -| ebpf_thread | Controller for eBPF threads. | [ebpf.plugin](https://github.com/netdata/netdata/blob/master/collectors/ebpf.plugin/README.md#ebpf_socket) | +| Function | Description | Alternative to CLI tools | plugin - module | +|:-------------------|:---------------------------------------------------------------------------------------------------------------------------------------------------------------|---------------------------------|:-----------------------------------------------------------------------------------------------------------| +| block-devices | Disk I/O activity for all block devices, offering insights into both data transfer volume and operation performance. | `iostat` | [proc](https://github.com/netdata/netdata/tree/master/collectors/proc.plugin#readme) | +| containers-vms | Insights into the resource utilization of containers and QEMU virtual machines: CPU usage, memory consumption, disk I/O, and network traffic. | `docker stats`, `systemd-cgtop` | [cgroups](https://github.com/netdata/netdata/tree/master/collectors/cgroups.plugin#readme) | +| ipmi-sensors | Readings and status of IPMI sensors. | `ipmi-sensors` | [freeipmi](https://github.com/netdata/netdata/tree/master/collectors/freeipmi.plugin#readme) | +| mount-points | Disk usage for each mount point, including used and available space, both in terms of percentage and actual bytes, as well as used and available inode counts. | `df` | [diskspace](https://github.com/netdata/netdata/tree/master/collectors/diskspace.plugin#readme) | +| network interfaces | Network traffic, packet drop rates, interface states, MTU, speed, and duplex mode for all network interfaces. | `bmon`, `bwm-ng` | [proc](https://github.com/netdata/netdata/tree/master/collectors/proc.plugin#readme) | +| processes | Real-time information about the system's resource usage, including CPU utilization, memory consumption, and disk IO for every running process. | `top`, `htop` | [apps](https://github.com/netdata/netdata/blob/master/collectors/apps.plugin/README.md) | +| systemd-journal | Viewing, exploring and analyzing systemd journal logs. | `journalctl` | [systemd-journal](https://github.com/netdata/netdata/tree/master/collectors/systemd-journal.plugin#readme) | +| systemd-list-units | Information about all systemd units, including their active state, description, whether or not they are enabled, and more. | `systemctl list-units` | [systemd-journal](https://github.com/netdata/netdata/tree/master/collectors/systemd-journal.plugin#readme) | +| systemd-services | System resource utilization for all running systemd services: CPU, memory, and disk IO. | `systemd-cgtop` | [cgroups](https://github.com/netdata/netdata/tree/master/collectors/cgroups.plugin#readme) | +| streaming | Comprehensive overview of all Netdata children instances, offering detailed information about their status, replication completion time, and many more. | | | + If you have ideas or requests for other functions: * Participate in the relevant [GitHub discussion](https://github.com/netdata/netdata/discussions/14412) @@ -43,7 +51,7 @@ If you have ideas or requests for other functions: #### How do functions work with streaming? -Via streaming, the definitions of functions are transmitted to a parent node so it knows all the functions available on +Via streaming, the definitions of functions are transmitted to a parent node, so it knows all the functions available on any children connected to it. If the parent node is the one connected to Netdata Cloud it is capable of triggering the call to the respective children @@ -51,7 +59,7 @@ node to run the function. #### Why are they available only on Netdata Cloud? -Since these functions are able to execute routines on the node and due the potential use cases that they can cover, our +Since these functions are able to execute routines on the node and due to the potential use cases that they can cover, our concern is to ensure no sensitive information or disruptive actions are exposed through the Agent's API. diff --git a/docs/cloud/visualize/dashboards.md b/docs/cloud/visualize/dashboards.md index 8291d6f1f..4b4baf426 100644 --- a/docs/cloud/visualize/dashboards.md +++ b/docs/cloud/visualize/dashboards.md @@ -9,22 +9,30 @@ Click on the **Dashboards** tab in any War Room to get started. From the Dashboards tab, click on the **+** button. - +<img width="98" alt=" Green plus button " src="https://github.com/netdata/netdata/assets/73346910/511e2b38-e751-4a88-bc7d-bcd49764b7f6"/> -In the modal, give your new dashboard a name, and click **+ Add**. -Click the **Add Chart** button to add your first chart card. From the dropdown, select either *All Nodes** or a specific -node. If you select **All Nodes**, you will add a [composite chart](https://github.com/netdata/netdata/blob/master/docs/cloud/visualize/overview.md) to -your new dashboard. Next, select the context. You'll see a preview of the chart before you finish adding it. +In the modal, give your new dashboard a name, and click **+ Add**. -The **Add Text** button creates a new card with user-defined text, which you can use to describe or document a +- The **Add Chart** button on the top right of the interface adds your first chart card. From the dropdown, select either **All Nodes** or a specific +node. Next, select the context. You'll see a preview of the chart before you finish adding it. In this modal you can also [interact with the chart](https://github.com/netdata/netdata/blob/master/docs/cloud/visualize/interact-new-charts.md), meaning you can configure all the aspects of the [NIDL framework](https://github.com/netdata/netdata/blob/master/docs/cloud/visualize/interact-new-charts.md#nidl-framework) of the chart and more in detail, you can: + - define which `group by` method to use + - select the aggregation function over the data source + - select nodes + - select instances + - select dimensions + - select labels + - select the aggregation function over time + + After you are done configuring the chart, you can also change the type of the chart from the right hand side of the [Title bar](https://github.com/netdata/netdata/blob/master/docs/cloud/visualize/interact-new-charts.md#title-bar), and select which of the final dimensions you want to be visible and in what order, from the [Dimensions bar](https://github.com/netdata/netdata/blob/master/docs/cloud/visualize/interact-new-charts.md#dimensions-bar). + +- The **Add Text** button on the top right of the interface creates a new card with user-defined text, which you can use to describe or document a particular dashboard's meaning and purpose. -Be sure to click the **Save** button any time you make changes to your dashboard. +> ### Important +> +> Be sure to click the **Save** button any time you make changes to your dashboard. - ## Using your dashboard @@ -33,24 +41,17 @@ of any number of **cards**, which can contain charts or text. ### Chart cards -Click the **Add Chart** button to add your first chart card. From the dropdown, select either *All Nodes** or a specific -node. If you select **All Nodes**, you will add a [composite chart](https://github.com/netdata/netdata/blob/master/docs/cloud/visualize/overview.md) to -your new dashboard. Next, select the context. You'll see a preview of the chart before you finish adding it. - -The charts you add to any dashboard are fully interactive, just like the charts in an Agent dashboard or a single node's -dashboard in Cloud. Zoom in and out, highlight timeframes, and more. +The charts you add to any dashboard are [fully interactive](https://github.com/netdata/netdata/blob/master/docs/cloud/visualize/interact-new-charts.md), just like any other Netdata chart. You can zoom in and out, highlight timeframes, and more. Charts also synchronize as you interact with them, even across contexts _or_ nodes. ### Text cards -The **Add Text** button creates a new card with user-defined text. When you create a new text card or edit an existing -one, select/highlight characters or words to open a modal to make them **bold**, _italic_, or <ins>underlined</ins>. You -can also create a link. +You can use text cards as notes to explain to other members of the [War Room](https://github.com/netdata/netdata/blob/master/docs/cloud/manage/organize-your-infrastrucutre-invite-your-team.md#netdata-cloud-war-rooms) the purpose of the dashboard's arrangement. ### Move cards -To move any card, click and hold on the top of the card, then drag it to a new location. A red placeholder indicates the +To move any card, click and hold on **Drag & rearrange** at the top right of the card and drag it to a new location. A red placeholder indicates the new location. Once you release your mouse, other charts re-sort to the grid system automatically. ### Resize cards @@ -58,27 +59,16 @@ new location. Once you release your mouse, other charts re-sort to the grid syst To resize any card on a dashboard, click on the bottom-right corner and drag to the card's new size. Other cards re-sort to the grid system automatically. -## Jump to single-node dashboards +## Go to chart -Quickly jump to any node's dashboard by clicking the 3-dot icon in the corner of any card to open a menu. Hit the **Go -to Chart** item. +Quickly jump to the location of the chart in either the Overview tab or if the card refers to a single node, its single node dashboard by clicking the 3-dot icon in the corner of any card to open a menu. Hit the **Go to Chart** item. You'll land directly on that chart of interest, but you can now scroll up and down to correlate your findings with other -charts. Of course, you can continue to zoom, highlight, and pan through time just as you're used to with Agent -dashboards. - -## Pin dashboards - -Click on the **Pin** button in any dashboard to put those charts into a separate panel at the bottom of the screen. You -can now navigate through Netdata Cloud freely, individual Cloud dashboards, the Nodes tab, different War Rooms, or even -different Spaces, and have those valuable metrics follow you. - -Pinning dashboards helps you correlate potentially related charts across your infrastructure, no matter how you -organized your Spaces and War Rooms, and helps you discover root causes faster. +charts. Of course, you can continue to zoom, highlight, and pan through time just as you're used to with Netdata Charts. -## Manage your dashboards +## Managing your dashboard -To see dashboards associated with the current War Room, click **Dashboards** tab in any War Room. You can select +To see dashboards associated with the current War Room, click the **Dashboards** tab in any War Room. You can select dashboards and delete them using the 🗑️ icon. ### Update/save a dashboard @@ -92,7 +82,7 @@ prompted to either overwrite the dashboard or reload to see the most recent chan ### Remove an individual card -Click on the 3-dot icon in the corner of any card to open a menu. Click the **Remove Card** item to remove the card. +Click on the 3-dot icon in the corner of any card to open a menu. Click the **Remove** item to remove the card. ### Delete a dashboard |