
diff options
Diffstat (limited to 'docs/dashboard')
| -rw-r--r-- | docs/dashboard/customize.md (renamed from docs/dashboard/customize.mdx) | 37 | ||||
| -rw-r--r-- | docs/dashboard/dimensions-contexts-families.md (renamed from docs/dashboard/dimensions-contexts-families.mdx) | 45 | ||||
| -rw-r--r-- | docs/dashboard/how-dashboard-works.mdx | 118 | ||||
| -rw-r--r-- | docs/dashboard/import-export-print-snapshot.md (renamed from docs/dashboard/import-export-print-snapshot.mdx) | 26 | ||||
| -rw-r--r-- | docs/dashboard/interact-charts.mdx | 201 | ||||
| -rw-r--r-- | docs/dashboard/reference-web-server.mdx | 278 | ||||
| -rw-r--r-- | docs/dashboard/visualization-date-and-time-controls.md | 92 | ||||
| -rw-r--r-- | docs/dashboard/visualization-date-and-time-controls.mdx | 125 |
8 files changed, 108 insertions, 814 deletions
diff --git a/docs/dashboard/customize.mdx b/docs/dashboard/customize.md index 3c30ee231..d9538e62f 100644 --- a/docs/dashboard/customize.mdx +++ b/docs/dashboard/customize.md @@ -1,25 +1,12 @@ ---- -title: "Customize the standard dashboard" -description: >- - "Netdata's preconfigured dashboard offers many customization options, such as choosing when - charts are updated, your preferred theme, and custom text to document processes, and more." -type: "how-to" -custom_edit_url: "https://github.com/netdata/netdata/blob/master/docs/dashboard/customize.mdx" -sidebar_label: "Customize the standard dashboard" -learn_status: "Published" -learn_topic_type: "Tasks" -learn_rel_path: "Operations" ---- - # Customize the standard dashboard -While the [Netdata dashboard](https://github.com/netdata/netdata/blob/master/docs/dashboard/how-dashboard-works.mdx) comes preconfigured with hundreds of charts and +While the [Netdata dashboard](https://github.com/netdata/netdata/blob/master/web/gui/README.md) comes preconfigured with hundreds of charts and thousands of metrics, you may want to alter your experience based on a particular use case or preferences. ## Dashboard settings -To change dashboard settings, click the on the **settings** icon  +To change dashboard settings, click the on the **settings** icon + in the top panel. These settings only affect how the dashboard behaves in your browser. They take effect immediately and are permanently @@ -30,7 +17,8 @@ Here are a few popular settings: ### Change chart legend position -Find this setting under the **Visual** tab. By default, Netdata places the [legend of dimensions](https://github.com/netdata/netdata/blob/master/docs/dashboard/dimensions-contexts-families.mdx#dimension) _below_ charts. +Find this setting under the **Visual** tab. By default, Netdata places the +[legend of dimensions](https://github.com/netdata/netdata/blob/master/docs/dashboard/dimensions-contexts-families.md#dimension) _below_ charts. Click this toggle to move the legend to the _right_ of charts. @@ -82,18 +70,3 @@ the following line to the `[web]` section to tell Netdata where to find your cus ``` Reload your browser tab to see your custom configuration. - -## What's next? - -If you're keen on continuing to customize your Netdata experience, check out our docs on [building new custom -dashboards](https://github.com/netdata/netdata/blob/master/web/gui/custom/README.md) with HTML, CSS, and JavaScript. - -### Further reading & related information - -- Dashboard - - [How the dashboard works](https://github.com/netdata/netdata/blob/master/docs/dashboard/how-dashboard-works.mdx) - - [Interact with charts](https://github.com/netdata/netdata/blob/master/docs/dashboard/interact-charts.mdx) - - [Chart dimensions, contexts, and families](https://github.com/netdata/netdata/blob/master/docs/dashboard/dimensions-contexts-families.mdx) - - [Select timeframes to visualize](https://github.com/netdata/netdata/blob/master/docs/dashboard/visualization-date-and-time-controls.mdx) - - [Import, export, and print a snapshot](https://github.com/netdata/netdata/blob/master/docs/dashboard/import-export-print-snapshot.mdx) - - **[Customize the standard dashboard](https://github.com/netdata/netdata/blob/master/docs/dashboard/customize.mdx)** diff --git a/docs/dashboard/dimensions-contexts-families.mdx b/docs/dashboard/dimensions-contexts-families.md index ee9636d15..41e839c85 100644 --- a/docs/dashboard/dimensions-contexts-families.mdx +++ b/docs/dashboard/dimensions-contexts-families.md @@ -1,26 +1,12 @@ ---- -title: "Chart dimensions, contexts, and families" -description: >- - "Netdata organizes charts into dimensions, contexts, and families to automatically - and meaningfully organize thousands of metrics into interactive charts." -type: "explanation" -custom_edit_url: "https://github.com/netdata/netdata/blob/master/docs/dashboard/dimensions-contexts-families.mdx" -sidebar_label: "Chart dimensions, contexts, and families" -learn_status: "Published" -learn_topic_type: "Concepts" -learn_rel_path: "Concepts" ---- - # Chart dimensions, contexts, and families -While Netdata's charts require no configuration and are [easy to interact with](https://github.com/netdata/netdata/blob/master/docs/dashboard/interact-charts.mdx), +While Netdata's charts require no configuration and are [easy to interact with](https://github.com/netdata/netdata/blob/master/docs/cloud/visualize/interact-new-charts.md), they have a lot of underlying complexity. To meaningfully organize charts out of the box based on what's happening in your nodes, Netdata uses the concepts of **dimensions**, **contexts**, and **families**. -Understanding how these work will help you more easily navigate the dashboard, [write new -alarms](https://github.com/netdata/netdata/blob/master/docs/monitor/configure-alarms.md), or play around with the [API](https://github.com/netdata/netdata/blob/master/web/api/README.md). - -For a refresher on the anatomy of a chart, see [dashboards and charts](https://github.com/netdata/netdata/blob/master/docs/dashboard/how-dashboard-works.mdx). +Understanding how these work will help you more easily navigate the dashboard, +[write new alarms](https://github.com/netdata/netdata/blob/master/health/REFERENCE.md), or play around +with the [API](https://github.com/netdata/netdata/blob/master/web/api/README.md). ## Dimension @@ -42,7 +28,7 @@ dimensions](https://user-images.githubusercontent.com/1153921/114207816-a5cb7400 The chart shows 13 unique dimensions, such as `httpd` for the CPU utilization for web servers, `kernel` for anything related to the Linux kernel, and so on. In your dashboard, these specific dimensions will almost certainly be different. -Dimensions can be [hidden](https://github.com/netdata/netdata/blob/master/docs/dashboard/interact-charts.mdx#show-and-hide-dimensions) to help you focus your +Dimensions can be [hidden](https://github.com/netdata/netdata/blob/master/docs/cloud/visualize/interact-new-charts.md#show-and-hide-dimensions) to help you focus your attention. ## Context @@ -56,7 +42,7 @@ whereas anything after the `.` is specified either by the chart's developer or b By default, a chart's type affects where it fits in the menu, while its family creates submenus. -Netdata also relies on contexts for [alarm configuration](https://github.com/netdata/netdata/blob/master/docs/monitor/configure-alarms.md) (the [`on` +Netdata also relies on contexts for [alarm configuration](https://github.com/netdata/netdata/blob/master/health/REFERENCE.md) (the [`on` line](https://github.com/netdata/netdata/blob/master/health/REFERENCE.md#alarm-line-on)). ## Family @@ -81,22 +67,3 @@ names: | `disk.ops` | `disk_ops.sda` | `disk_ops.sdb` | | `disk.backlog` | `disk_backlog.sda` | `disk_backlog.sdb` | | `disk.util` | `disk_util.sda` | `disk_util.sdb` | - -## What's next? - -With an understanding of a chart's dimensions, context, and family, you're now ready to dig even deeper into Netdata's -dashboard. We recommend looking into [using the timeframe selector](https://github.com/netdata/netdata/blob/master/docs/dashboard/visualization-date-and-time-controls.mdx). - -If you feel comfortable with the [dashboard](https://github.com/netdata/netdata/blob/master/docs/dashboard/how-dashboard-works.mdx) and interacting with charts, we -recommend learning about [configuration](https://github.com/netdata/netdata/blob/master/docs/configure/nodes.md). While Netdata doesn't _require_ a complicated setup -process or a query language to create charts, there are a lot of ways to tweak the experience to match your needs. - -### Further reading & related information - -- Dashboard - - [How the dashboard works](https://github.com/netdata/netdata/blob/master/docs/dashboard/how-dashboard-works.mdx) - - [Interact with charts](https://github.com/netdata/netdata/blob/master/docs/dashboard/interact-charts.mdx) - - **[Chart dimensions, contexts, and families](https://github.com/netdata/netdata/blob/master/docs/dashboard/dimensions-contexts-families.mdx)** - - [Select timeframes to visualize](https://github.com/netdata/netdata/blob/master/docs/dashboard/visualization-date-and-time-controls.mdx) - - [Import, export, and print a snapshot](https://github.com/netdata/netdata/blob/master/docs/dashboard/import-export-print-snapshot.mdx) - - [Customize the standard dashboard](https://github.com/netdata/netdata/blob/master/docs/dashboard/customize.mdx) diff --git a/docs/dashboard/how-dashboard-works.mdx b/docs/dashboard/how-dashboard-works.mdx deleted file mode 100644 index f14402705..000000000 --- a/docs/dashboard/how-dashboard-works.mdx +++ /dev/null @@ -1,118 +0,0 @@ ---- -title: "How the dashboard works" -description: >- - "Learn how to navigate Netdata's preconfigured dashboard to get started - exploring, visualizing, and troubleshooting in real time." -type: "explanation" -custom_edit_url: "https://github.com/netdata/netdata/blob/master/docs/dashboard/how-dashboard-works.mdx" -sidebar_label: "How the dashboard works" -learn_status: "Published" -learn_topic_type: "Concepts" -learn_rel_path: "Concepts" ---- - -# How the dashboard works - -Because Netdata is a monitoring and _troubleshooting_ platform, a dashboard with real-time, meaningful, and -context-aware charts is essential. - -As soon as you [install Netdata](https://github.com/netdata/netdata/blob/master/docs/get-started.mdx), it autodetects hardware, OS, containers, services, and -applications running on your node and builds a dashboard on a single, scrollable webpage. This page features hundreds of -charts, which are preconfigured to save you time from learning a query language, all stacked on top of one another. This -vertical rhythm is designed to encourage exploration and help you visually identify connections between the metrics -visualized in different charts. - -It's essential to understand the core concepts and features of Netdata's dashboard if you want to maximize your Netdata -experience right after installation. - -## Open the dashboard - -Access Netdata's dashboard by navigating to `http://NODE:19999` in your browser, replacing `NODE` with either -`localhost` or the hostname/IP address of a remote node. - - - -Many features of the internal web server that serves the dashboard are [configurable](https://github.com/netdata/netdata/blob/master/web/server/README.md), including -the listen port, enforced TLS, and even disabling the dashboard altogether. - -## Sections and menus - -As mentioned in the introduction, Netdata automatically organizes all the metrics it collects from your node, and places -them into **sections** of closely related charts. - -The first section on any dashboard is the **System Overview**, followed by **CPUs**, **Memory**, and so on. - -These sections populate the **menu**, which is on the right-hand side of the dashboard. Instead of manually scrolling up -and down to explore the dashboard, it's generally faster to click on the relevant menu item to jump to that position on -the dashboard. - -Many menu items also contain a **submenu**, with links to additional categories. For example, the **Disks** section is often separated into multiple groups based on the number of disk drives/partitions on your node, which are also known as a family. - - - -## Charts - -Every **chart** in the Netdata dashboard is [fully interactive](https://github.com/netdata/netdata/blob/master/docs/dashboard/interact-charts.mdx). Netdata -synchronizes your interactions to help you understand exactly how a node behaved in any timeframe, whether that's -seconds or days. - -A chart is an individual, interactive, always-updating graphic displaying one or more collected/calculated metrics, -which are generated by [collectors](https://github.com/netdata/netdata/blob/master/docs/collect/how-collectors-work.md). - - - -Hover over any chart to temporarily pause it and see the exact metrics values presented as different dimensions. Click -or tap to stop the chart from automatically updating with new metrics, thereby locking it to a single timeframe. -Double-click it to resume auto-updating. - -Let's cover two of the most important ways to interact with charts: panning through time and zooming. - -To pan through time, **click and hold** (or touch and hold) on any chart, then **drag your mouse** (or finger) to the -left or right. Drag to the right to pan backward through time, or drag to the left to pan forward in time. Think of it -like pushing the current timeframe off the screen to see what came before or after. - -To zoom, press and hold `Shift`, then use your mouse's scroll wheel, or a two-finger pinch if you're using a touchpad. - -See [interact with charts](https://github.com/netdata/netdata/blob/master/docs/dashboard/interact-charts.mdx) for all the possible ways to interact with the charts on -your dashboard. - -## Alarms - -Many of the preconfigured charts on the Netdata dashboard also come with preconfigured alarms. Netdata sends three -primary alarm states via alarms: `CLEAR`, `WARNING`, and `CRITICAL`. If an alarm moves from a `CLEAR` state to either -`WARNING` or `CRITICAL`, Netdata creates a notification to let you know exactly what's going on. There are [other alarm -states](https://github.com/netdata/netdata/blob/master/health/REFERENCE.md#alarm-statuses) as well. - -The easiest way to see alarms is by clicking on the alarm icon  -in the top panel to open the alarms panel, which shows you all the active alarms. The other **All** tab shows every -active alarm, and the **Log** tab shows a historical record of exactly when alarms triggered and to which state. - - - -Learn more about [viewing active alarms](https://github.com/netdata/netdata/blob/master/docs/monitor/view-active-alarms.md), [configuring -alarms](https://github.com/netdata/netdata/blob/master/docs/monitor/configure-alarms.md), or [enabling a new notification -method](https://github.com/netdata/netdata/blob/master/docs/monitor/enable-notifications.md). - -## What's next? - -Learn more about [interacting with charts](https://github.com/netdata/netdata/blob/master/docs/dashboard/interact-charts.mdx) to quickly pan through time, zoom, and -show/hide dimensions to best understand the state of your node in any timeframe. A complete understanding of [chart -dimensions, contexts, and families](https://github.com/netdata/netdata/blob/master/docs/dashboard/dimensions-contexts-families.mdx) will also help with how Netdata -organizes its dashboard and operates [alarms](https://github.com/netdata/netdata/blob/master/docs/monitor/configure-alarms.md). - -### Further reading & related information - -- Dashboard - - **[How the dashboard works](https://github.com/netdata/netdata/blob/master/docs/dashboard/how-dashboard-works.mdx)** - - [Interact with charts](https://github.com/netdata/netdata/blob/master/docs/dashboard/interact-charts.mdx) - - [Chart dimensions, contexts, and families](https://github.com/netdata/netdata/blob/master/docs/dashboard/dimensions-contexts-families.mdx) - - [Select timeframes to visualize](https://github.com/netdata/netdata/blob/master/docs/dashboard/visualization-date-and-time-controls.mdx) - - [Import, export, and print a snapshot](https://github.com/netdata/netdata/blob/master/docs/dashboard/import-export-print-snapshot.mdx) - - [Customize the standard dashboard](https://github.com/netdata/netdata/blob/master/docs/dashboard/customize.mdx) -- [HTTP API](https://github.com/netdata/netdata/blob/master/web/api/README.md) -- [Custom dashboards](https://github.com/netdata/netdata/blob/master/web/gui/custom/README.md) diff --git a/docs/dashboard/import-export-print-snapshot.mdx b/docs/dashboard/import-export-print-snapshot.md index 23430a561..35c3b9db9 100644 --- a/docs/dashboard/import-export-print-snapshot.mdx +++ b/docs/dashboard/import-export-print-snapshot.md @@ -1,25 +1,25 @@ ---- +<!-- title: "Import, export, and print a snapshot" description: >- "Snapshots can be incredibly useful for diagnosing anomalies after they've already happened, and are interoperable with any other node running Netdata." type: "how-to" -custom_edit_url: "https://github.com/netdata/netdata/blob/master/docs/dashboard/import-export-print-snapshot.mdx" +custom_edit_url: "https://github.com/netdata/netdata/blob/master/docs/dashboard/import-export-print-snapshot.md" sidebar_label: "Import, export, and print a snapshot" learn_status: "Published" learn_topic_type: "Tasks" learn_rel_path: "Operations" ---- +--> -# Import, export, and print snapshots +# Import, export, and print a snapshot Netdata can export snapshots of the contents of your dashboard at a given time, which you can then import into any other node running Netdata. Or, you can create a print-ready version of your dashboard to save to PDF or actually print to paper. Snapshots can be incredibly useful for diagnosing anomalies after they've already happened. Let's say Netdata triggered a warning alarm while you were asleep. In the morning, you can [select the -timeframe](https://github.com/netdata/netdata/blob/master/docs/dashboard/visualization-date-and-time-controls.mdx) when the alarm triggered, export a snapshot, and send it to a +timeframe](https://github.com/netdata/netdata/blob/master/docs/dashboard/visualization-date-and-time-controls.md) when the alarm triggered, export a snapshot, and send it to a colleague for further analysis. @@ -72,19 +72,3 @@ in the top panel. When you click **Print**, Netdata opens a new window to render every chart. This might take some time. When finished, Netdata opens a browser print dialog for you to save to PDF or print. - -## What's next? - -Now that you understand snapshots, now is a good time to delve deeper into some of the dashboard's lesser-known -features, such as [customization](https://github.com/netdata/netdata/blob/master/docs/dashboard/customize.mdx) or [building new, custom -dashboards](https://github.com/netdata/netdata/blob/master/web/gui/custom/README.md). - -### Further reading & related information - -- Dashboard - - [How the dashboard works](https://github.com/netdata/netdata/blob/master/docs/dashboard/how-dashboard-works.mdx) - - [Interact with charts](https://github.com/netdata/netdata/blob/master/docs/dashboard/interact-charts.mdx) - - [Chart dimensions, contexts, and families](https://github.com/netdata/netdata/blob/master/docs/dashboard/dimensions-contexts-families.mdx) - - [Select timeframes to visualize](https://github.com/netdata/netdata/blob/master/docs/dashboard/visualization-date-and-time-controls.mdx) - - **[Import, export, and print a snapshot](https://github.com/netdata/netdata/blob/master/docs/dashboard/import-export-print-snapshot.mdx)** - - [Customize the standard dashboard](https://github.com/netdata/netdata/blob/master/docs/dashboard/customize.mdx)
\ No newline at end of file diff --git a/docs/dashboard/interact-charts.mdx b/docs/dashboard/interact-charts.mdx deleted file mode 100644 index a733bc9e0..000000000 --- a/docs/dashboard/interact-charts.mdx +++ /dev/null @@ -1,201 +0,0 @@ ---- -title: "Interact with charts" -description: "Learn how to pan, zoom, select, and customize Netdata's preconfigured charts to help you troubleshooting with real-time, per-second metrics data." -type: "how-to" -custom_edit_url: "https://github.com/netdata/netdata/edit/master/docs/dashboard/interact-charts.mdx" -sidebar_label: "Interact with charts" -learn_status: "Published" -learn_topic_type: "Tasks" -learn_rel_path: "Operations" ---- - -# Interact with charts - -> ⚠️ There is a new version of charts that is currently **only** available on [Netdata Cloud](https://github.com/netdata/netdata/blob/master/docs/cloud/visualize/interact-new-charts.md). We didn't -> want to keep this valuable feature from you, so after we get this into your hands on the Cloud, we will collect and implement your feedback to make sure we are providing the best possible version of the feature on the Netdata Agent dashboard as quickly as possible. - -While charts that update every second with new metrics are helpful for understanding the immediate state of a node, deep -troubleshooting and root cause analysis begins by manipulating the default charts. To help you troubleshoot, Netdata -synchronizes every chart every time you interact with one of them. - -Here's what synchronization looks like: - - - -Once you understand all the interactions available to you, you'll be able to quickly move around the dashboard, search -for anomalies, and find root causes using per-second metrics. - -## Pause or stop - -| Interaction | Keyboard/mouse | Touchpad/touchscreen | -| :---------------- | :------------- | :------------------- | -| **Pause** a chart | `hover` | `n/a` | -| **Stop** a chart | `click` | `tap` | - -By hovering over any chart, you temporarily pause it so that you can hover over a specific timeframe and see the exact -values presented as dimensions. Click on the chart to lock it to this timeframe, which is useful if you want to jump to -a different chart to look for possible correlations. - - - -## Pan - -| Interaction | Keyboard/mouse | Touchpad/touchscreen | -| :---------- | :------------- | :------------------- | -| **Pan** | `click + drag` | `swipe` | - -Drag your mouse/finger to the right to pan backward through time, or drag to the left to pan forward in time. Think of -it like pushing the current timeframe off the screen to see what came before or after. - -## Zoom - -| Interaction | Keyboard/mouse | Touchpad/touchscreen | -| :------------------------------- | :-------------------------- | :--------------------------------------------------- | -| **Zoom** in or out | `Shift + mouse scrollwheel` | `two-finger pinch` <br />`Shift + two-finger scroll` | -| **Zoom** to a specific timeframe | `Shift + mouse selection` | `n/a` | - -Zooming in helps you see metrics with maximum granularity, which is useful when you're trying to diagnose the root cause -of an anomaly or outage. Zooming out lets you see metrics within the larger context, such as the last hour, day, or -week, which is useful in understanding what "normal" looks like, or to identify long-term trends, like a slow creep in -memory usage. - -## Select - -| Interaction | Keyboard/mouse | Touchpad/touchscreen | -| :------------------------------ | :-------------------------------------------------------- | :------------------- | -| **Select** a specific timeframe | `Alt + mouse selection` or `⌘ + mouse selection` (macOS) | `n/a` | - -Selecting timeframes is useful when you see an interesting spike or change in a chart and want to investigate further. - -Select a timeframe, then move to different charts/sections of the dashboard. Each chart shows the same selection to help -you immediately identify the timeframe and look for correlations. - -## Reset a chart to its default state - -| Interaction | Keyboard/mouse | Touchpad/touchscreen | -| :---------------- | :------------- | :------------------- | -| **Reset** a chart | `double-click` | `n/a` | - -Double-check on a chart to restore it to the default auto-updating state, with a timeframe based on your browser -viewport. - -## Resize - -Click-and-drag the icon on the bottom-right corner of any chart. To restore the chart to its original height, -double-click the same icon. - - - -## Show and hide dimensions - -| Interaction | Keyboard/mouse | Touchpad/touchscreen | -| :------------------------------------- | :-------------- | :------------------- | -| **Show one** dimension and hide others | `click` | `tap` | -| **Toggle (show/hide)** one dimension | `Shift + click` | `n/a` | - -Hiding dimensions simplifies the chart and can help you better discover exactly which aspect of your system might be -behaving strangely. - -## See the context - -Hover your mouse over the date that appears just beneath the chart itself. A tooltip will tell you the context for that -chart. Below, the context is `apps.cpu`. - - - -## See the resolution and update frequency - -Hover your mouse over the timestamp just to the right of the date. `resolution` is the number of seconds between each -"tick" in the chart. `collection every` is how often Netdata collects and stores that metric. - -If the `resolution` value is higher than `collection every`, such as `resolution 5 secs, collected every 1 sec`, this -means that each tick is calculating represents the average values across a 5-second period. You can zoom in to increase -the resolution to `resolution 1 sec` to see the exact values. - -## Chart controls - -Many of the above interactions can also be triggered using the icons on the bottom-right corner of every chart. They -are, respectively, `Pan Left`, `Reset`, `Pan Right`, `Zoom In`, and `Zoom Out`. - -## Chart label filtering - -The chart label filtering feature supports grouping by and filtering each chart based on labels (key/value pairs) applicable to the context and provides fine-grain capability on slicing the data and metrics. - -All metrics collected get "tagged" with labels and values, thus providing a powerful way of slicing and visualizing all metrics related to the infrastructure. - -The chart label filtering is currently enabled on: - -- All charts on the **Overview** tab -- Custom dashboards - -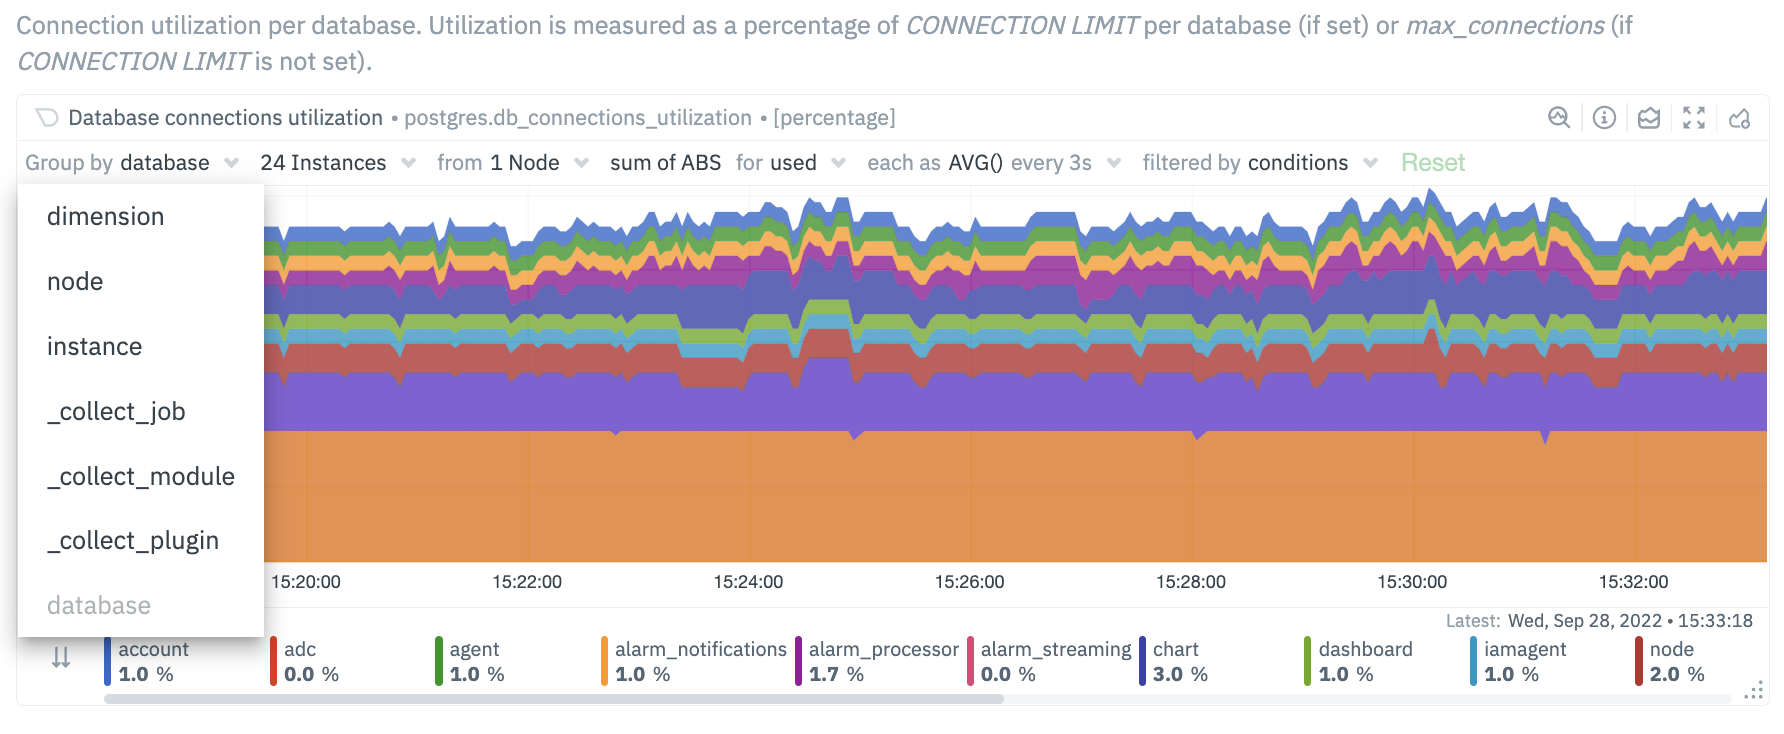 -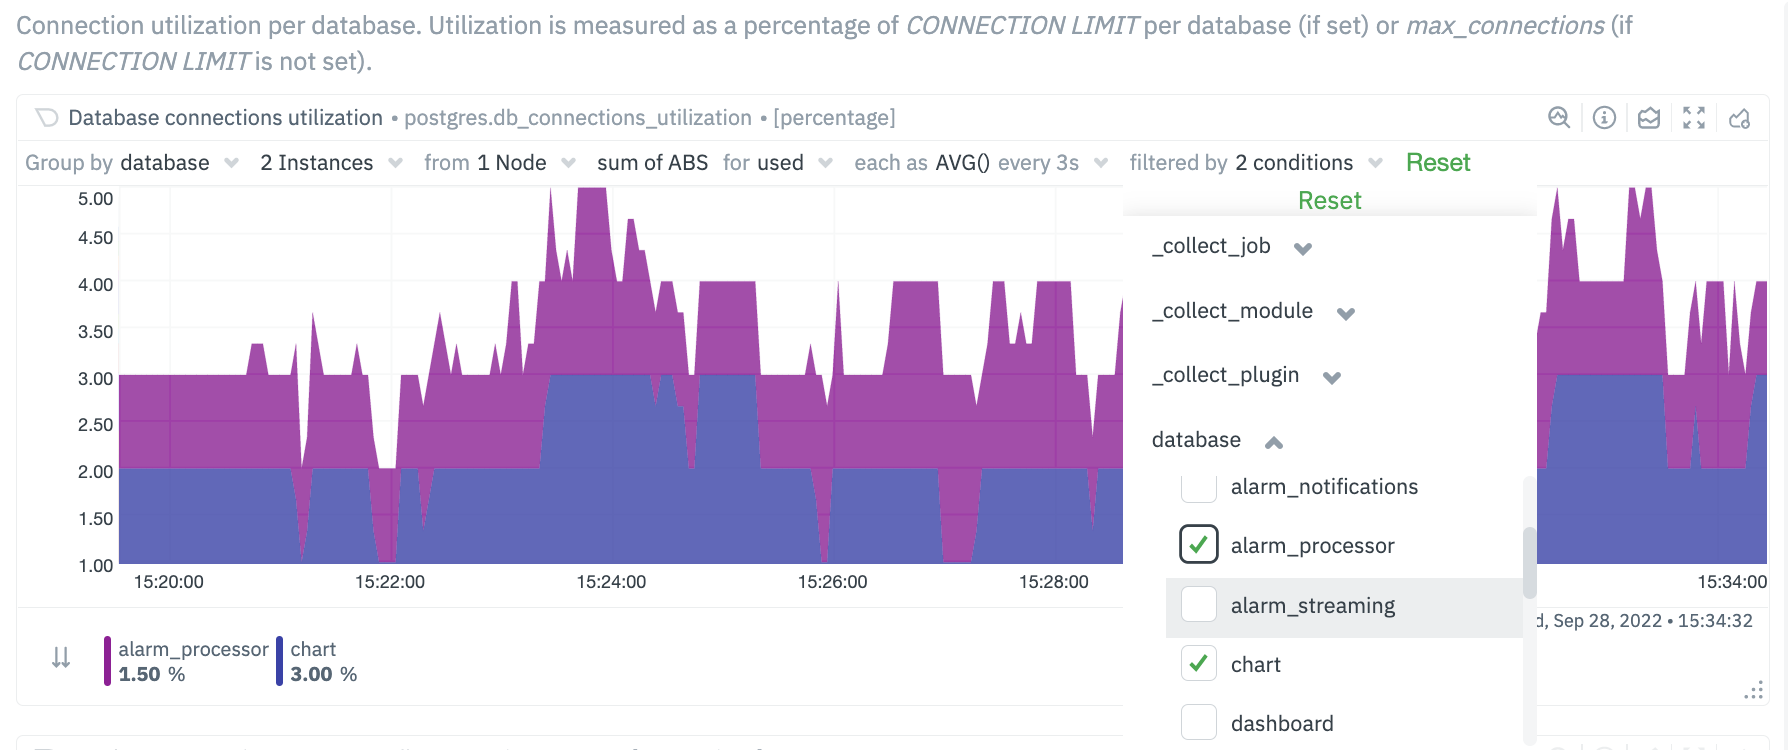 - -The top panel on each chart displays the various filters and grouping options selected on the specific chart. These filters are specific for each chart and need to be manually configured on each chart. - -Additionally, the charts can be saved to a custom dashboard, new or existing, with the selected filters from the overview screen. - -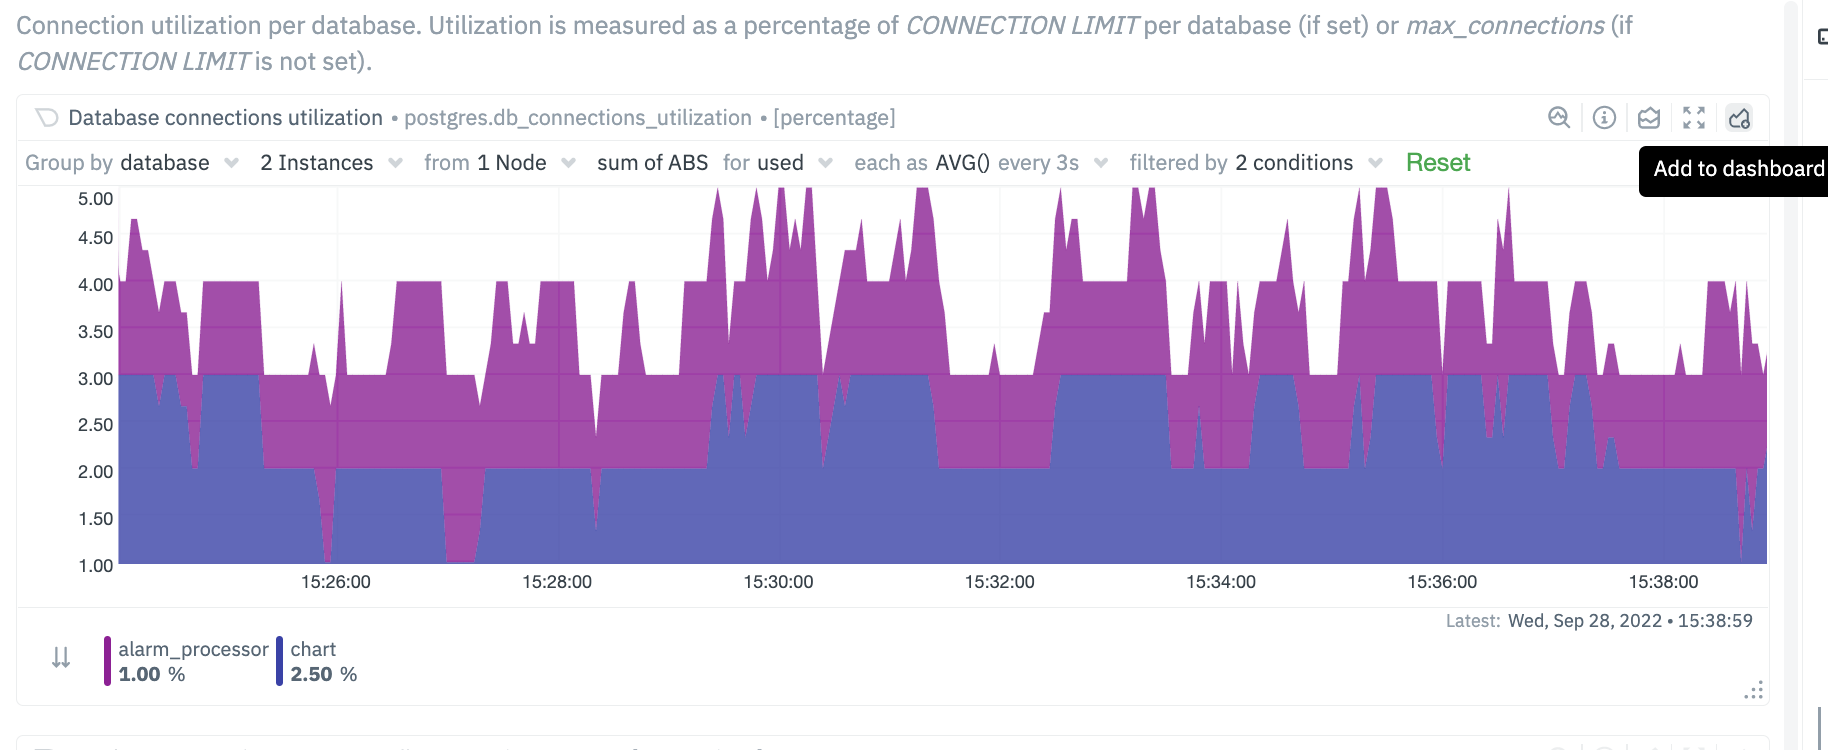 - -## Custom labels for Collectors - -In addition to the default labels associated with a collector and metrics context (you can identify them by seeing which ones have an underscore as a prefix), there is now a new feature enabled to create custom labels. These custom labels may be needed to group your jobs or instances into various categories. - -These custom labels can be configured within your go.d plugins by simply associating a label key/value pair, as in the following eaxmple. - -```conf -jobs: - - name: example_1 - someOption: someValue - labels: - label1: value1 - label2: value2 - - name: example_2 - someOption: someValue - labels: - label3: value3 - label4: value4 -``` - -For instance, you may be running multiple Postgres database instances within an infrastructure. Some of these may be associated with testing environments, some with staging and some with production environments. You can now associate each Postgres job / instance with a custom label. The “group by” and filtering options will then allow you to associate individual jobs by specific labels. - -```conf -jobs: - - name: local - dsn: 'postgres://postgres:postgres@127.0.0.1:5432/postgres' - collect_databases_matching: '*' - labels: - instance_type: production - ``` - 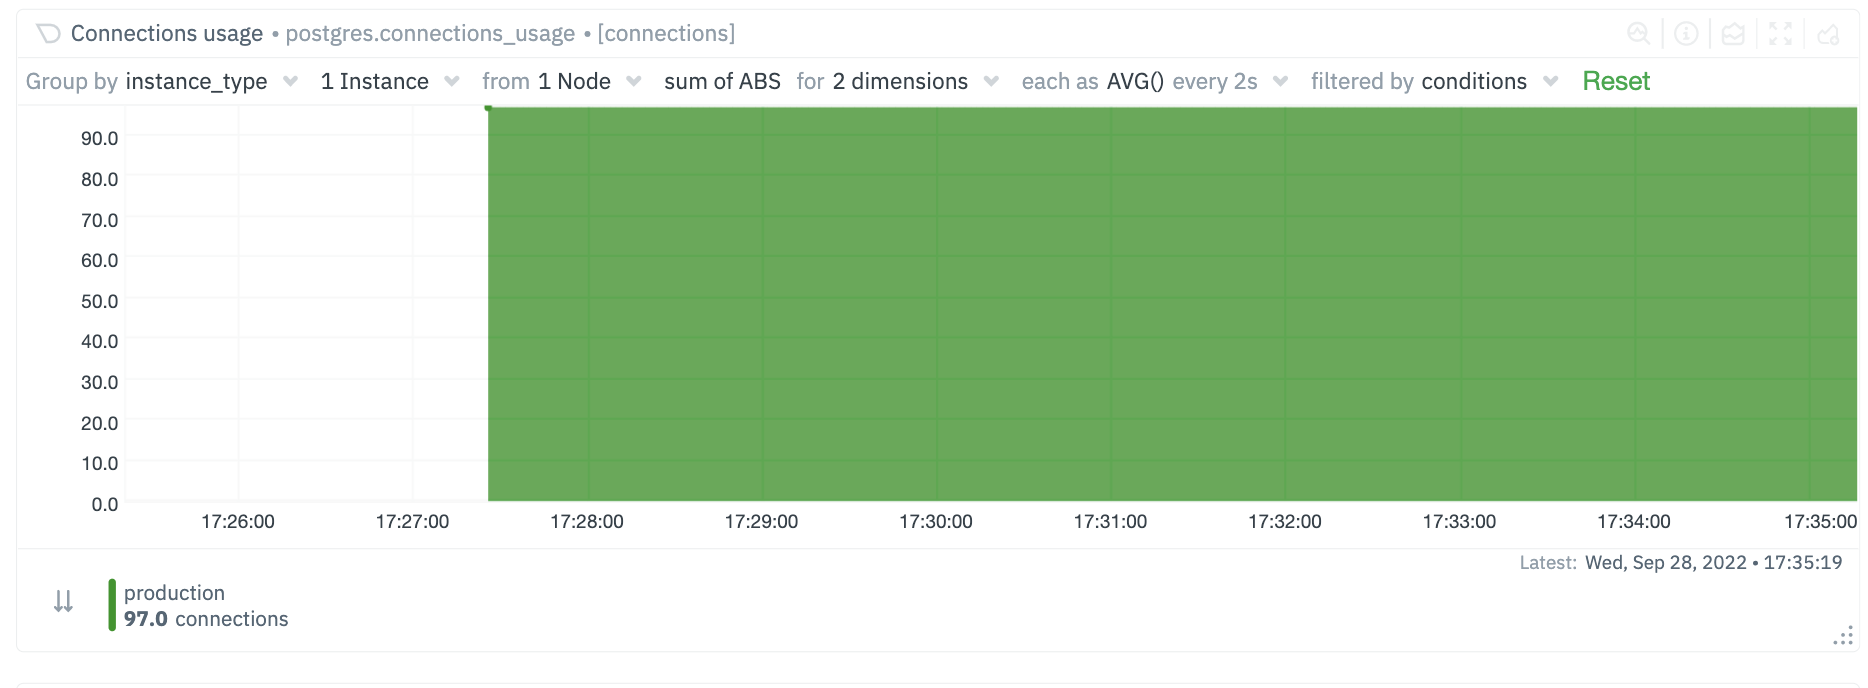 - 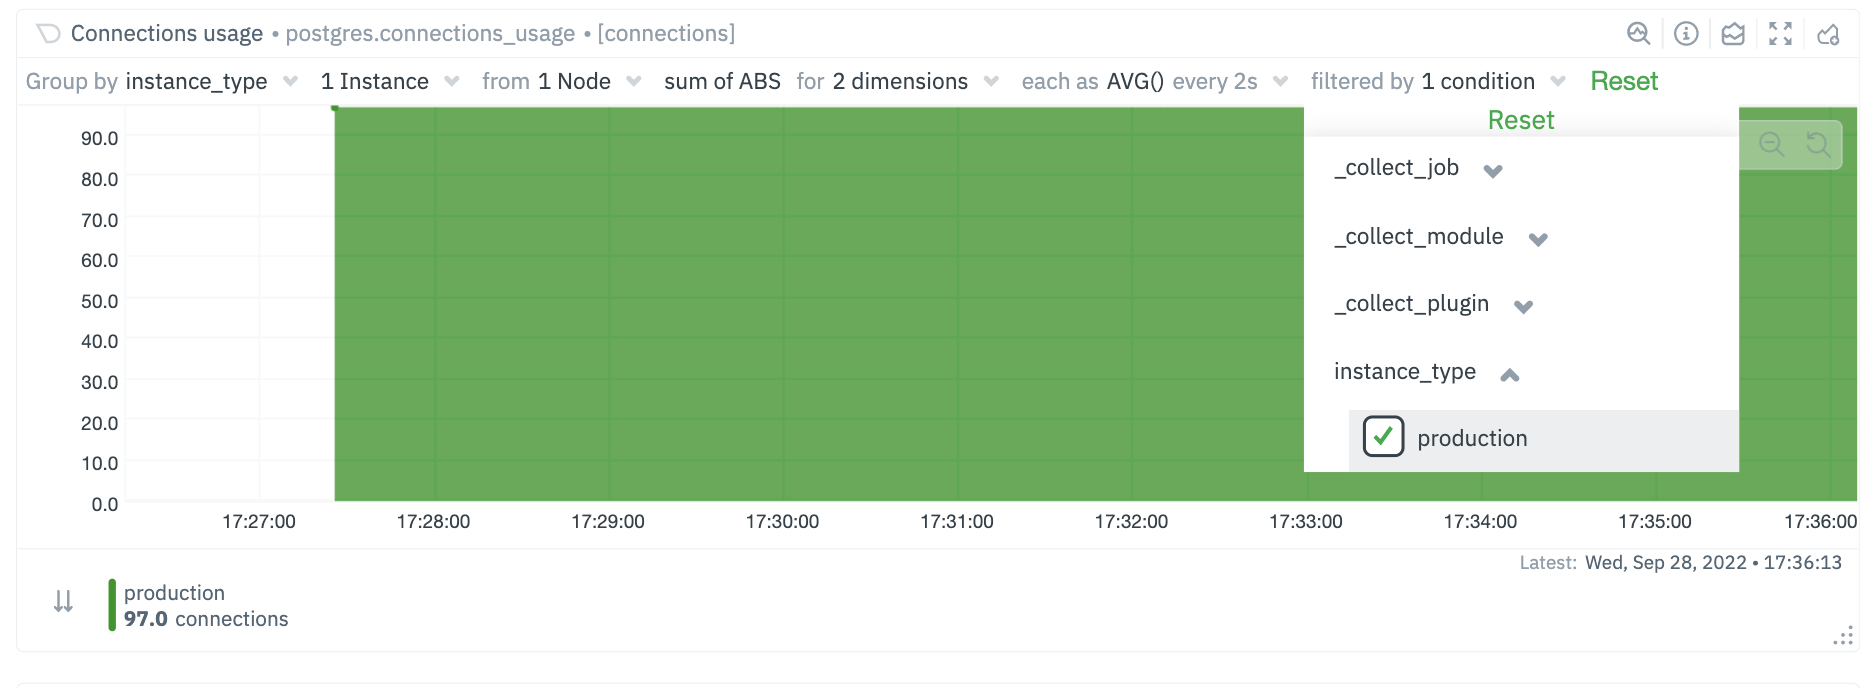 - -### Future Work - -We already have [configurable host labels](https://github.com/netdata/netdata/blob/master/docs/guides/using-host-labels.md) as well, which currently can’t be used to filter or group your metrics. We intend to provide the same capabilities described here with host labels, among other capabilities on other areas of the app as well - -## What's next? - -We recommend you read up on the differences between [chart dimensions, contexts, and -families](https://github.com/netdata/netdata/blob/master/docs/dashboard/dimensions-contexts-families.mdx) to complete your understanding of how Netdata organizes its -dashboards. Another valuable way to interact with charts is to use the [timeframe -selector](https://github.com/netdata/netdata/blob/master/docs/dashboard/visualization-date-and-time-controls.mdx), which helps you visualize specific moments of historical metrics. - -If you feel comfortable with the [dashboard](https://github.com/netdata/netdata/blob/master/docs/dashboard/how-dashboard-works.mdx) and interacting with charts, we -recommend moving on to learning about [configuration](https://github.com/netdata/netdata/blob/master/docs/configure/nodes.md). While Netdata doesn't _require_ a -complicated setup process or a query language to create charts, there are a lot of ways to tweak the experience to match -your needs. - -### Further reading & related information - -- Dashboard - - [How the dashboard works](https://github.com/netdata/netdata/blob/master/docs/dashboard/how-dashboard-works.mdx) - - [Netdata Cloud · Interact with new charts](https://github.com/netdata/netdata/blob/master/docs/cloud/visualize/interact-new-charts.md) - - [Chart dimensions, contexts, and families](https://github.com/netdata/netdata/blob/master/docs/dashboard/dimensions-contexts-families.mdx) - - [Select timeframes to visualize](https://github.com/netdata/netdata/blob/master/docs/dashboard/visualization-date-and-time-controls.mdx) - - [Import, export, and print a snapshot](https://github.com/netdata/netdata/blob/master/docs/dashboard/import-export-print-snapshot.mdx) - - [Customize the standard dashboard](https://github.com/netdata/netdata/blob/master/docs/dashboard/customize.mdx) diff --git a/docs/dashboard/reference-web-server.mdx b/docs/dashboard/reference-web-server.mdx deleted file mode 100644 index f90e6f873..000000000 --- a/docs/dashboard/reference-web-server.mdx +++ /dev/null @@ -1,278 +0,0 @@ ---- -title: "Web server reference" -description: "The Netdata Agent's local static-threaded web server serves dashboards and real-time visualizations with security and DDoS protection." -type: reference -custom_edit_url: https://github.com/netdata/netdata/edit/master/docs/dashboard/reference-web-server.mdx ---- - -# Web server reference - -The Netdata web server is `static-threaded`, with a fixed, configurable number of threads. - -All the threads are concurrently listening for web requests on the same sockets, and the kernel distributes the incoming -requests to them. Each thread uses non-blocking I/O so it can serve any number of web requests in parallel. - -This web server respects the `keep-alive` HTTP header to serve multiple HTTP requests via the same connection. - -## Configuration - -From within your Netdata config directory (typically `/etc/netdata`), [use `edit-config`](https://github.com/netdata/netdata/blob/master/docs/configure/nodes.md) to -open `netdata.conf`. - -``` -sudo ./edit-config netdata.conf -``` - -Scroll down to the `[web]` section to find the following settings. - -## Settings - -| Setting | Default | Description | -|:-------------------------------------------|:---------------------------------------------------------------------------------------------------------------------------------------------------------------------------------------|:--------------------------------------------------------------------------------------------------------------------------------------------------------------------------------------------------------------------------------------------------------------------------------------------------------------------------------------------------------------------------------------------------------------------------------------------------------------------------------------------------| -| `ssl key` | `/etc/netdata/ssl/key.pem` | Declare the location of an SSL key to [enable HTTPS](#enable-httpstls-support). | -| `ssl certificate` | `/etc/netdata/ssl/cert.pem` | Declare the location of an SSL certificate to [enable HTTPS](#enable-httpstls-support). | -| `tls version` | `1.3` | Choose which TLS version to use. While all versions are allowed (`1` or `1.0`, `1.1`, `1.2` and `1.3`), we recommend `1.3` for the most secure encryption. If left blank, Netdata uses the highest available protocol version on your system. | -| `tls ciphers` | `none` | Choose which TLS cipher to use. Options include `TLS_AES_256_GCM_SHA384`, `TLS_CHACHA20_POLY1305_SHA256`, and `TLS_AES_128_GCM_SHA256`. If left blank, Netdata uses the default cipher list for that protocol provided by your TLS implementation. | -| `ses max window` | `15` | See [single exponential smoothing](https://github.com/netdata/netdata/blob/master/web/api/queries/ses/README.md). | -| `des max window` | `15` | See [double exponential smoothing](https://github.com/netdata/netdata/blob/master/web/api/queries/des/README.md). | -| `mode` | `static-threaded` | Turns on (`static-threaded` or off (`none`) the static-threaded web server. See the [example](#disable-the-web-server) to turn off the web server and disable the dashboard. | -| `listen backlog` | `4096` | The port backlog. Check `man 2 listen`. | -| `default port` | `19999` | The listen port for the static web server. | -| `web files owner` | `netdata` | The user that owns the web static files. Netdata will refuse to serve a file that is not owned by this user, even if it has read access to that file. If the user given is not found, Netdata will only serve files owned by user given in `run as user`. | -| `web files group` | `netdata` | If this is set, Netdata will check if the file is owned by this group and refuse to serve the file if it's not. | -| `disconnect idle clients after seconds` | `60` | The time in seconds to disconnect web clients after being totally idle. | -| `timeout for first request` | `60` | How long to wait for a client to send a request before closing the socket. Prevents slow request attacks. | -| `accept a streaming request every seconds` | `0` | Can be used to set a limit on how often a parent node will accept streaming requests from child nodes in a [streaming and replication setup](https://github.com/netdata/netdata/blob/master/streaming/README.md). | -| `respect do not track policy` | `no` | If set to `yes`, Netdata will respect the user's browser preferences for [Do Not Track](https://www.eff.org/issues/do-not-track) (DNT) and storing cookies. If DNT is _enabled_ in the browser, and this option is set to `yes`, users will not be able to sign in to Netdata Cloud via their local Agent dashboard, and their node will not connect to any [registry](https://github.com/netdata/netdata/blob/master/registry/README.md). For certain browsers, users must disable DNT and change this option to `yes` for full functionality. | -| `x-frame-options response header` | ` ` | Avoid [clickjacking attacks](https://developer.mozilla.org/en-US/docs/Web/HTTP/Headers/X-Frame-Options), by ensuring that the content is not embedded into other sites. | -| `allow connections from` | `localhost *` | Declare which IP addresses or full-qualified domain names (FQDNs) are allowed to connect to the web server, including the [dashboard](https://github.com/netdata/netdata/blob/master/docs/dashboard/interact-charts.mdx) or [HTTP API](https://github.com/netdata/netdata/blob/master/web/api/README.md). This is a global setting with higher priority to any of the ones below. | -| `allow connections by dns` | `heuristic` | See the [access list examples](#access-lists) for details on using `allow` settings. | -| `allow dashboard from` | `localhost *` | | -| `allow dashboard by dns` | `heuristic` | | -| `allow badges from` | `*` | | -| `allow badges by dns` | `heuristic` | | -| `allow streaming from` | `*` | | -| `allow streaming by dns` | `heuristic` | | -| `allow netdata.conf` | `localhost fd* 10.* 192.168.* 172.16.* 172.17.* 172.18.* 172.19.* 172.20.* 172.21.* 172.22.* 172.23.* 172.24.* 172.25.* 172.26.* 172.27.* 172.28.* 172.29.* 172.30.* 172.31.* UNKNOWN` | | -| `allow netdata.conf by dns` | `no` | | -| `allow management from` | `localhost` | | -| `allow management by dns` | `heuristic` | | -| `enable gzip compression` | `yes` | When set to `yes`, Netdata web responses will be GZIP compressed, if the web client accepts such responses. | -| `gzip compression strategy` | `default` | Valid settings are `default`, `filtered`, `huffman only`, `rle` and `fixed`. | -| `gzip compression level` | `3` | Valid settings are 1 (fastest) to 9 (best ratio). | -| `web server threads` | ` ` | How many processor threads the web server is allowed. The default is system-specific, the minimum of `6` or the number of CPU cores. | -| `web server max sockets` | ` ` | Available sockets. The default is system-specific, automatically adjusted to 50% of the max number of open files Netdata is allowed to use (via `/etc/security/limits.conf` or systemd), to allow enough file descriptors to be available for data collection. | -| `custom dashboard_info.js` | ` ` | Specifies the location of a custom `dashboard.js` file. See [customizing the standard dashboard](https://github.com/netdata/netdata/blob/master/docs/dashboard/customize.mdx#customize-the-standard-dashboard) for details. | - -## Examples - -### Disable the web server - -Disable the web server by editing `netdata.conf` and setting: - -``` -[web] - mode = none -``` - -### Change the number of threads - -Control the number of threads and sockets with the following settings: - -``` -[web] - web server threads = 4 - web server max sockets = 512 -``` - -### Binding Netdata to multiple ports - -Netdata can bind to multiple IPs and ports, offering access to different services on each. Up to 100 sockets can be used (increase it at compile time with `CFLAGS="-DMAX_LISTEN_FDS=200" ./netdata-installer.sh ...`). - -The ports to bind are controlled via `[web].bind to`, like this: - -``` -[web] - default port = 19999 - bind to = 127.0.0.1=dashboard^SSL=optional 10.1.1.1:19998=management|netdata.conf hostname:19997=badges [::]:19996=streaming^SSL=force localhost:19995=registry *:http=dashboard unix:/run/netdata/netdata.sock -``` - -Using the above, Netdata will bind to: - -- IPv4 127.0.0.1 at port 19999 (port was used from `default port`). Only the UI (dashboard) and the read API will be accessible on this port. Both HTTP and HTTPS requests will be accepted. -- IPv4 10.1.1.1 at port 19998. The management API and `netdata.conf` will be accessible on this port. -- All the IPs `hostname` resolves to (both IPv4 and IPv6 depending on the resolved IPs) at port 19997. Only badges will be accessible on this port. -- All IPv6 IPs at port 19996. Only metric streaming requests from other Netdata agents will be accepted on this port. Only encrypted streams will be allowed (i.e. child nodes also need to be [configured for TLS](https://github.com/netdata/netdata/blob/master/streaming/README.md). -- All the IPs `localhost` resolves to (both IPv4 and IPv6 depending the resolved IPs) at port 19996. This port will only accept registry API requests. -- All IPv4 and IPv6 IPs at port `http` as set in `/etc/services`. Only the UI (dashboard) and the read API will be accessible on this port. -- Unix domain socket `/run/netdata/netdata.sock`. All requests are serviceable on this socket. Note that in some OSs like Fedora, every service sees a different `/tmp`, so don't create a Unix socket under `/tmp`. `/run` or `/var/run` is suggested. - -The option `[web].default port` is used when an entries in `[web].bind to` do not specify a port. - -Note that the access permissions specified with the `=request type|request type|...` format are available from version 1.12 onwards. -As shown in the example above, these permissions are optional, with the default being to permit all request types on the specified port. -The request types are strings identical to the `allow X from` directives of the access lists, i.e. `dashboard`, `streaming`, `registry`, `netdata.conf`, `badges` and `management`. -The access lists themselves and the general setting `allow connections from` in the next section are applied regardless of the ports that are configured to provide these services. -The API requests are serviced as follows: - -- `dashboard` gives access to the UI, the read API and badges API calls. -- `badges` gives access only to the badges API calls. -- `management` gives access only to the management API calls. - -### Enable HTTPS/TLS support - -Since v1.16.0, Netdata supports encrypted HTTP connections to the web server, plus encryption of streaming data to a -parent from its child nodes, via the TLS protocol. - -Inbound unix socket connections are unaffected, regardless of the TLS settings. - -> While Netdata uses Transport Layer Security (TLS) 1.2 to encrypt communications rather than the obsolete SSL protocol, -> it's still common practice to refer to encrypted web connections as `SSL`. Many vendors, like Nginx and even Netdata -> itself, use `SSL` in configuration files, whereas documentation will always refer to encrypted communications as `TLS` -> or `TLS/SSL`. - -To enable TLS, provide the path to your certificate and private key in the `[web]` section of `netdata.conf`: - -```conf -[web] - ssl key = /etc/netdata/ssl/key.pem - ssl certificate = /etc/netdata/ssl/cert.pem -``` - -Both files must be readable by the `netdata` user. If either of these files do not exist or are unreadable, Netdata will fall back to HTTP. For a parent-child connection, only the parent needs these settings. - -For test purposes, generate self-signed certificates with the following command: - -```bash -openssl req -newkey rsa:2048 -nodes -sha512 -x509 -days 365 -keyout key.pem -out cert.pem -``` - -> If you use 4096 bits for your key and the certificate, Netdata will need more CPU to process the communication. -> `rsa4096` can be up to 4 times slower than `rsa2048`, so we recommend using 2048 bits. Verify the difference -> by running: -> -> ```sh -> openssl speed rsa2048 rsa4096 -> ``` - -### Select TLS version - -Beginning with version `v1.21.0`, specify the TLS version and the ciphers that you want to use: - -```conf -[web] - tls version = 1.3 - tls ciphers = TLS_AES_256_GCM_SHA384:TLS_CHACHA20_POLY1305_SHA256:TLS_AES_128_GCM_SHA256 -``` - -If you do not specify these options, Netdata will use the highest available protocol version on your system and the default cipher list for that protocol provided by your TLS implementation. - -#### TLS/SSL enforcement - -When the certificates are defined and unless any other options are provided, a Netdata server will: - -- Redirect all incoming HTTP web server requests to HTTPS. Applies to the dashboard, the API, `netdata.conf` and badges. -- Allow incoming child connections to use both unencrypted and encrypted communications for streaming. - -To change this behavior, you need to modify the `bind to` setting in the `[web]` section of `netdata.conf`. At the end of each port definition, append `^SSL=force` or `^SSL=optional`. What happens with these settings differs, depending on whether the port is used for HTTP/S requests, or for streaming. - -| SSL setting | HTTP requests|HTTPS requests|Unencrypted Streams|Encrypted Streams| -|:---------:|:-----------:|:------------:|:-----------------:|:----------------| -| none | Redirected to HTTPS|Accepted|Accepted|Accepted| -| `force`| Redirected to HTTPS|Accepted|Denied|Accepted| -| `optional`| Accepted|Accepted|Accepted|Accepted| - -Example: - -``` -[web] - bind to = *=dashboard|registry|badges|management|streaming|netdata.conf^SSL=force -``` - -For information how to configure the child to use TLS, check [securing the communication](https://github.com/netdata/netdata/blob/master/streaming/README.md#securing-streaming-communications) in the streaming documentation. There you will find additional details on the expected behavior for client and server nodes, when their respective TLS options are enabled. - -When we define the use of SSL in a Netdata agent for different ports, Netdata will apply the behavior specified on each port. For example, using the configuration line below: - -``` -[web] - bind to = *=dashboard|registry|badges|management|streaming|netdata.conf^SSL=force *:20000=netdata.conf^SSL=optional *:20001=dashboard|registry -``` - -Netdata will: - -- Force all HTTP requests to the default port to be redirected to HTTPS (same port). -- Refuse unencrypted streaming connections from child nodes on the default port. -- Allow both HTTP and HTTPS requests to port 20000 for `netdata.conf` -- Force HTTP requests to port 20001 to be redirected to HTTPS (same port). Only allow requests for the dashboard, the read API and the registry on port 20001. - -#### TLS/SSL errors - -When you start using Netdata with TLS, you may find errors in the Netdata log, which is stored at `/var/log/netdata/error.log` by default. - -Most of the time, these errors are due to incompatibilities between your browser's options related to TLS/SSL protocols and Netdata's internal configuration. The most common error is `error:00000006:lib(0):func(0):EVP lib`. - -In the near future, Netdata will allow our users to change the internal configuration to avoid similar errors. Until then, we're recommending only the most common and safe encryption protocols listed above. - -### Access lists - -Netdata supports access lists in `netdata.conf`: - -``` -[web] - allow connections from = localhost * - allow dashboard from = localhost * - allow badges from = * - allow streaming from = * - allow netdata.conf from = localhost fd* 10.* 192.168.* 172.16.* 172.17.* 172.18.* 172.19.* 172.20.* 172.21.* 172.22.* 172.23.* 172.24.* 172.25.* 172.26.* 172.27.* 172.28.* 172.29.* 172.30.* 172.31.* - allow management from = localhost -``` - -`*` does string matches on the IPs or FQDNs of the clients. - -- `allow connections from` matches anyone that connects on the Netdata port(s). - So, if someone is not allowed, it will be connected and disconnected immediately, without reading even - a single byte from its connection. This is a global setting with higher priority to any of the ones below. - -- `allow dashboard from` receives the request and examines if it is a static dashboard file or an API call the - dashboards do. - -- `allow badges from` checks if the API request is for a badge. Badges are not matched by `allow dashboard from`. - -- `allow streaming from` checks if the child willing to stream metrics to this Netdata is allowed. - This can be controlled per API KEY and MACHINE GUID in `stream.conf`. - The setting in `netdata.conf` is checked before the ones in `stream.conf`. - -- `allow netdata.conf from` checks the IP to allow `http://netdata.host:19999/netdata.conf`. - The IPs listed are all the private IPv4 addresses, including link local IPv6 addresses. Keep in mind that connections to Netdata API ports are filtered by `allow connections from`. So, IPs allowed by `allow netdata.conf from` should also be allowed by `allow connections from`. - -- `allow management from` checks the IPs to allow API management calls. Management via the API is currently supported for [health](https://github.com/netdata/netdata/blob/master/web/api/health/README.md#health-management-api) - -In order to check the FQDN of the connection without opening the Netdata agent to DNS-spoofing, a reverse-dns record -must be setup for the connecting host. At connection time the reverse-dns of the peer IP address is resolved, and -a forward DNS resolution is made to validate the IP address against the name-pattern. - -Please note that this process can be expensive on a machine that is serving many connections. Each access list has an -associated configuration option to turn off DNS-based patterns completely to avoid incurring this cost at run-time: - -``` - allow connections by dns = heuristic - allow dashboard by dns = heuristic - allow badges by dns = heuristic - allow streaming by dns = heuristic - allow netdata.conf by dns = no - allow management by dns = heuristic -``` - -The three possible values for each of these options are `yes`, `no` and `heuristic`. The `heuristic` option disables -the check when the pattern only contains IPv4/IPv6 addresses or `localhost`, and enables it when wildcards are -present that may match DNS FQDNs. - -## DDoS protection - -If you publish your Netdata web server to the internet, you may want to apply some protection against DDoS: - -1. Use the `static-threaded` web server (it is the default) -2. Use reasonable `[web].web server max sockets` (the default is) -3. Don't use all your CPU cores for Netdata (lower `[web].web server threads`) -4. Run the `netdata` process with a low process scheduling priority (the default is the lowest) -5. If possible, proxy Netdata via a full featured web server (Nginx, Apache, etc) diff --git a/docs/dashboard/visualization-date-and-time-controls.md b/docs/dashboard/visualization-date-and-time-controls.md new file mode 100644 index 000000000..99e4c308e --- /dev/null +++ b/docs/dashboard/visualization-date-and-time-controls.md @@ -0,0 +1,92 @@ +# Visualization date and time controls + +Netdata's dashboard features powerful date visualization controls that include a time control, a timezone selector and a rich date and timeframe selector. + +The controls come with useful defaults and rich customization, to help you narrow your focus when troubleshooting issues or anomalies. + +## Time controls + +The time control provides you the following options: **Play**, **Pause** and **Force Play**. + +- **Play** - the content of the page will be automatically refreshed while this is in the foreground +- **Pause** - the content of the page isn't refreshed due to a manual request to pause it or, for example, when your investigating data on a chart (cursor is on top of a chart) +- **Force Play** - the content of the page will be automatically refreshed even if this is in the background + +With this, we aim to bring more clarity and allow you to distinguish if the content you are looking at is live or historical and also allow you to always refresh the content of the page when the tabs are in the background. + +Main use cases for **Force Play**: + +- You use a terminal or deployment tools to do changes in your infra and want to see the effect immediately, Netdata is in the background, displaying the impact of these changes +- You want to have Netdata on the background, example displayed on a TV, to constantly see metrics through dashboards or to watch the alert status + +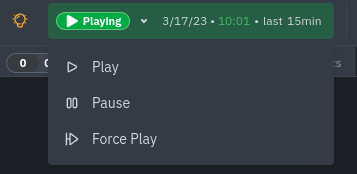 + +## Date and time selector + +The date and time selector allows you to change the visible timeframe and change the timezone used in the interface. + +### Pick timeframes to visualize + +While [panning through time and zooming in/out](https://github.com/netdata/netdata/blob/master/docs/cloud/visualize/interact-new-charts.md) from charts it is helpful when you're looking a recent history, or want to do granular troubleshooting, what if you want to see metrics from 6 hours ago? Or 6 days? + +Netdata's dashboard features a **timeframe selector** to help you visualize specific timeframes in a few helpful ways. +By default, it shows a certain number of minutes of historical metrics based on the your browser's viewport to ensure it's always showing per-second granularity. + +#### Open the timeframe selector + +To visualize a new timeframe, you need to open the picker, which appears just above the menu, near the top-right bar of the dashboard. + +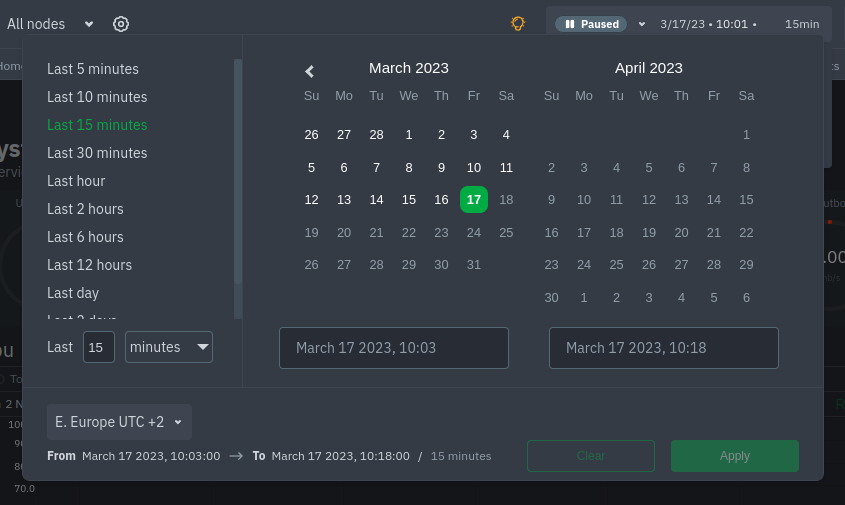 + +The **Clear** button resets the dashboard back to its default state based on your browser viewport, and **Apply** closes +the picker and shifts all charts to the selected timeframe. + +#### Use the pre-defined timeframes + +Click any of the following options in the predefined timeframe column to choose between: + +- Last 5 minutes +- Last 15 minutes +- Last 30 minutes +- Last hour +- Last 2 hours +- Last 6 hours +- Last 12 hours +- Last day +- Last 2 days +- Last 7 days + +Click **Apply** to see metrics from your selected timeframe. + +#### Choose a specific interval + +Beneath the predefined timeframe columns is an input field and dropdown you use in combination to select a specific timeframe of +minutes, hours, days, or months. Enter a number and choose the appropriate unit of time, then click **Apply**. + +#### Choose multiple days via the calendar + +Use the calendar to select multiple days. Click on a date to begin the timeframe selection, then an ending date. The +timeframe begins at noon on the beginning and end dates. Click **Apply** to see your selected multi-day timeframe. + +#### Caveats and considerations + +**Longer timeframes will decrease metrics granularity**. At the default timeframe, based on your browser viewport, each +"tick" on charts represents one second. If you select a timeframe of 6 hours, each tick represents the _average_ value +across a larger period of time. + +**You can only see metrics as far back in history as your metrics retention policy allows**. Netdata uses an internal +time-series database (TSDB) to store as many metrics as it can within a specific amount of disk space. The default +storage is 256 MiB, which should be enough for 1-3 days of historical metrics. If you navigate back to a timeframe +beyond stored historical metrics, you'll see this message: + +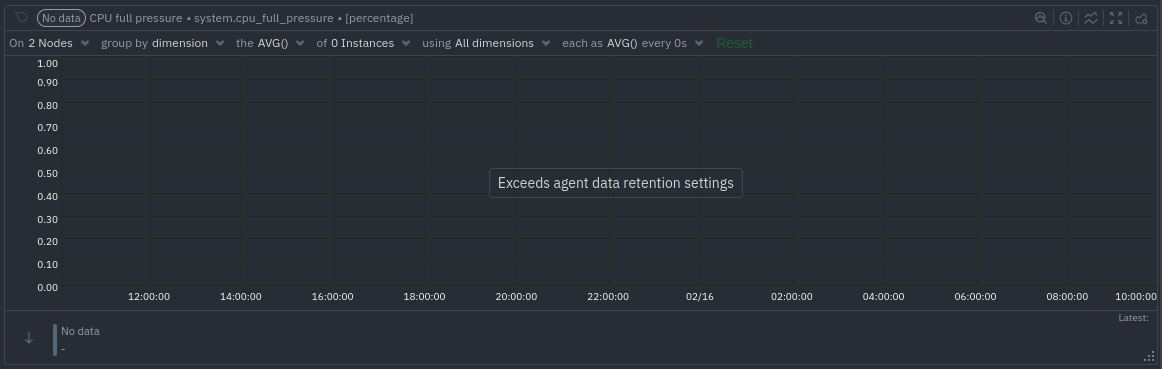 + +At any time, [configure the internal TSDB's storage capacity](https://github.com/netdata/netdata/blob/master/docs/store/change-metrics-storage.md) to expand your +depth of historical metrics. + +### Timezone selector + +The default timezone used in all date and time fields in Netdata Cloud comes from your browser. To change it, open the +date and time selector and use the control displayed here: + +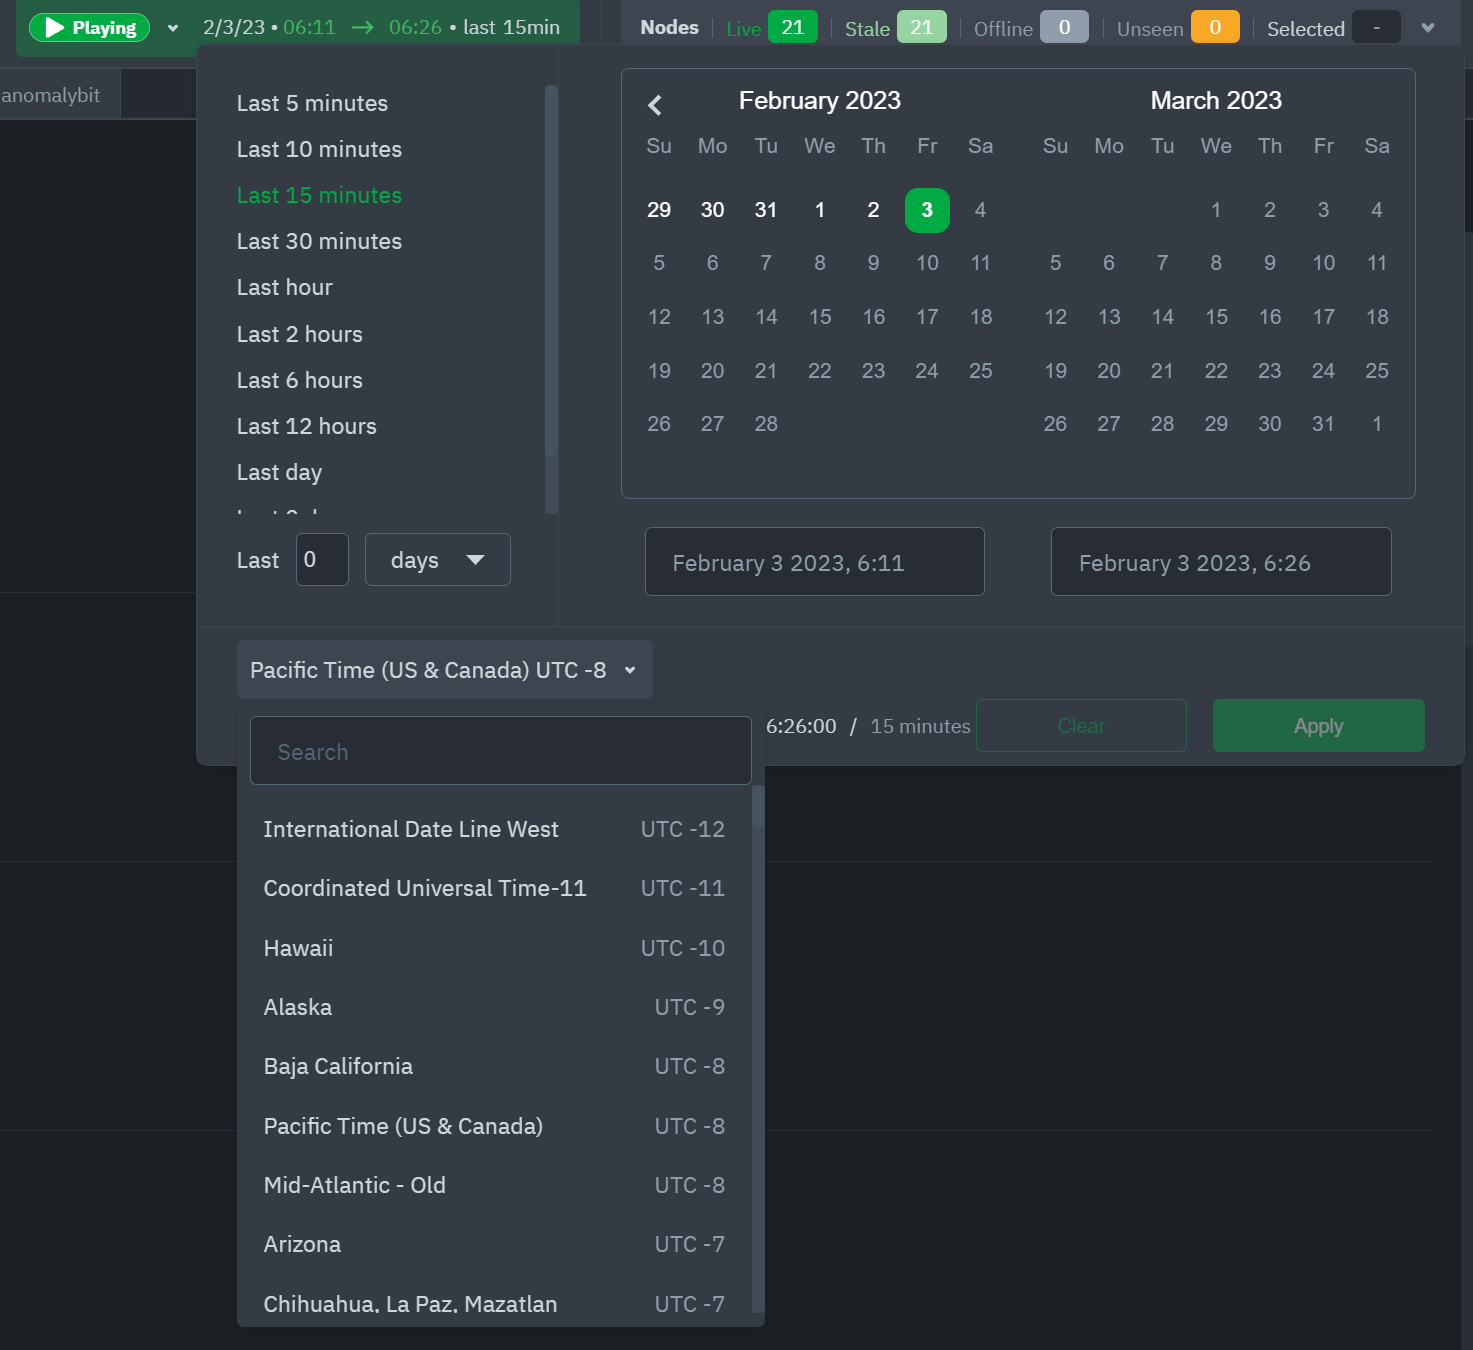 diff --git a/docs/dashboard/visualization-date-and-time-controls.mdx b/docs/dashboard/visualization-date-and-time-controls.mdx deleted file mode 100644 index a59a1f066..000000000 --- a/docs/dashboard/visualization-date-and-time-controls.mdx +++ /dev/null @@ -1,125 +0,0 @@ -<!-- -title: "Visualization date and time controls" -description: "Netdata's dashboard features powerful date visualization controls that include a time control (play, pause, force play), a timezone selector and a rich date and timeframe selector, with useful defaults and rich customization, to help you narrow your focus when troubleshooting issues or anomalies." -type: "how-to" -custom_edit_url: "https://github.com/netdata/netdata/edit/master/docs/dashboard/visualization-date-and-time-controls.mdx" -sidebar_label: "Visualization date and time controls" -learn_status: "Published" -learn_topic_type: "Concepts" -learn_rel_path: "Concepts" ---> - -# Visualization date and time controls - -## Date and time selector - -### Pick timeframes to visualize - -While [panning through time and zooming in/out](https://github.com/netdata/netdata/blob/master/docs/dashboard/interact-charts.mdx) from charts it is helpful when -you're looking a recent history, or want to do granular troubleshooting, what if you want to see metrics from 6 hours -ago? Or 6 days? - -Netdata's dashboard features a **timeframe selector** to help you visualize specific timeframes in a few helpful ways. -By default, it shows a certain number of minutes of historical metrics based on the your browser's viewport to ensure -it's always showing per-second granularity. - -#### Open the timeframe selector - -To visualize a new timeframe, you need to open the picker, which appears just above the menu, near the top-right cover -of the dashboard. - -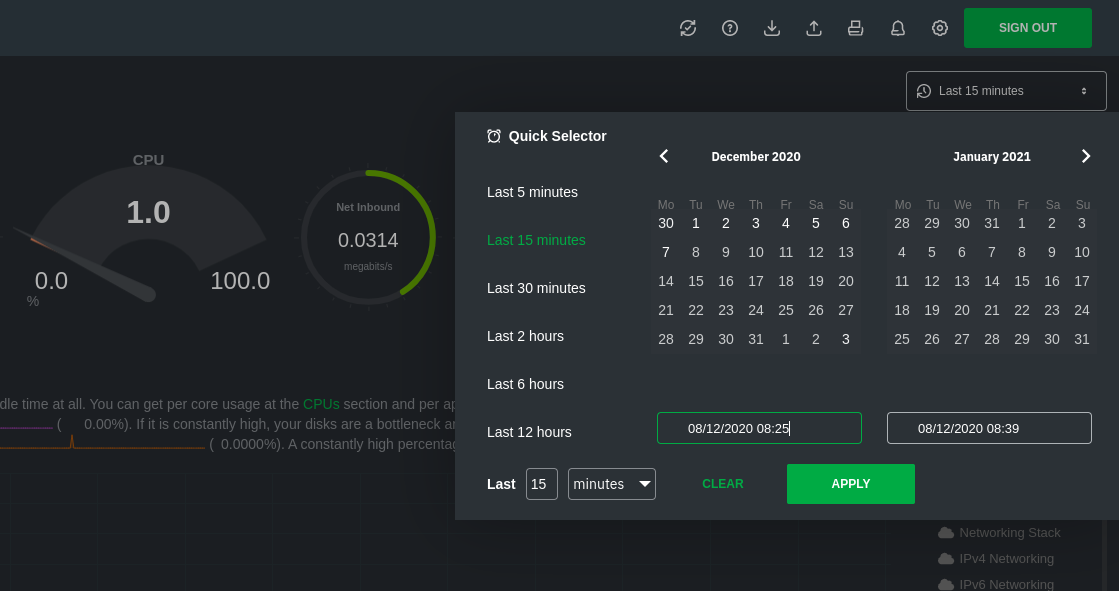 - -The **Clear** button resets the dashboard back to its default state based on your browser viewport, and **Apply** closes -the picker and shifts all charts to the selected timeframe. - -#### Use the Quick Selector - -Click any of the following options in the **Quick Selector** to choose a commonly-used timeframe. - -- Last 5 minutes -- Last 15 minutes -- Last 2 hours -- Last 6 hours -- Last 12 hours - -Click **Apply** to see metrics from your selected timeframe. - -#### Choose a specific interval - -Beneath the Quick Selector is an input field and dropdown you use in combination to select a specific timeframe of -minutes, hours, days, or months. Enter a number and choose the appropriate unit of time, then click **Apply**. - -#### Choose multiple days - -Use the calendar to select multiple days. Click on a date to begin the timeframe selection, then an ending date. The -timeframe begins at noon on the beginning and end dates. Click **Apply** to see your selected multi-day timeframe. - -## Time controls - -The time control provides you the following options: **Play**, **Pause** and **Force Play**. -* **Play** - the content of the page will be automatically refreshed while this is in the foreground -* **Pause** - the content of the page isn't refreshed due to a manual request to pause it or, for example, when your investigating data on a -chart (cursor is on top of a chart) -* **Force Play** - the content of the page will be automatically refreshed even if this is in the background - -With this, we aim to bring more clarity and allow you to distinguish if the content you are looking at is live or historical and also allow you - to always refresh the content of the page when the tabs are in the background. - -Main use cases for **Force Play**: -* You use a terminal or deployment tools to do changes in your infra and want to see immediately, Netdata is in the background, displaying the impact -of these changes -* You want to have Netdata on the background, example displayed on a TV, to constantly see metrics through dashboards or to watch the alert -status - -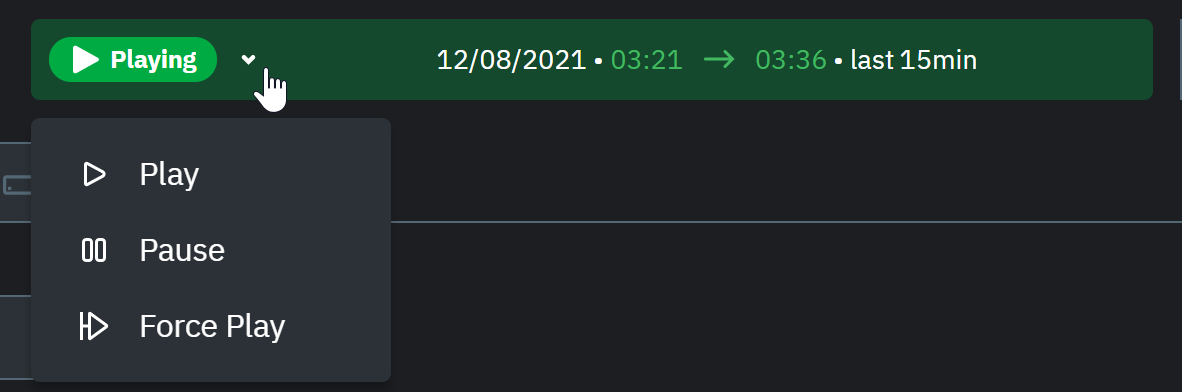 - -## Timezone selector - -With the timezone selector, you have the ability to change the timezone on Netdata Cloud. More often than not teams are -distributed in different timezones and they need to collaborate. - -Our goal is to make it easier for you and your teams to troubleshoot based on your timezone preference and communicate easily -with varying timezones and timeframes without the need to be concerned about their specificity. - -<img width="437" alt="Untitled1" src="https://user-images.githubusercontent.com/43294513/216628390-c3bd1cd2-349d-4523-b8d3-c7e68395f670.png"> - -When you change the timezone all the date and time fields will be updated to be displayed according to the specified timezone, this goes from -charts to alerts information and across the Netdata Cloud. - -## Caveats and considerations - -**Longer timeframes will decrease metrics granularity**. At the default timeframe, based on your browser viewport, each -"tick" on charts represents one second. If you select a timeframe of 6 hours, each tick represents the _average_ value -across a larger period of time. - -**You can only see metrics as far back in history as your metrics retention policy allows**. Netdata uses an internal -time-series database (TSDB) to store as many metrics as it can within a specific amount of disk space. The default -storage is 256 MiB, which should be enough for 1-3 days of historical metrics. If you navigate back to a timeframe -beyond stored historical metrics, you'll see this message: - -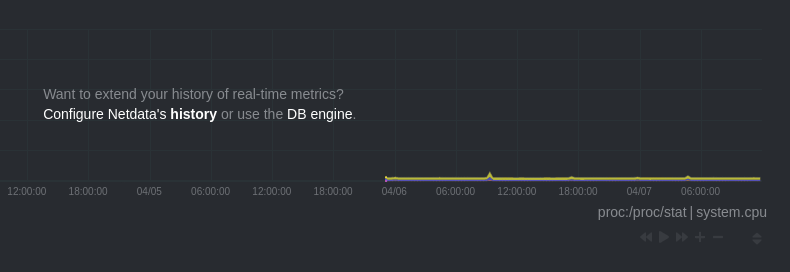 - -At any time, [configure the internal TSDB's storage capacity](https://github.com/netdata/netdata/blob/master/docs/store/change-metrics-storage.md) to expand your -depth of historical metrics. - -## What's next? - -One useful next step after selecting a timeframe is [exporting the -metrics](https://github.com/netdata/netdata/blob/master/docs/dashboard/import-export-print-snapshot.mdx) into a snapshot file, which can then be shared and imported -into any other Netdata dashboard. - -There are also many ways to [customize](https://github.com/netdata/netdata/blob/master/docs/dashboard/customize.mdx) the standard dashboard experience, from changing -the theme to editing the text that accompanies every section of charts. - -## Further reading & related information - -- Dashboard - - [How the dashboard works](https://github.com/netdata/netdata/blob/master/docs/dashboard/how-dashboard-works.mdx) - - [Interact with charts](https://github.com/netdata/netdata/blob/master/docs/dashboard/interact-charts.mdx) - - [Chart dimensions, contexts, and families](https://github.com/netdata/netdata/blob/master/docs/dashboard/dimensions-contexts-families.mdx) - - [Import, export, and print a snapshot](https://github.com/netdata/netdata/blob/master/docs/dashboard/import-export-print-snapshot.mdx) - - [Customize the standard dashboard](https://github.com/netdata/netdata/blob/master/docs/dashboard/customize.mdx) |