
diff options
Diffstat (limited to 'docs/dashboard')
| -rw-r--r-- | docs/dashboard/customize.mdx | 32 | ||||
| -rw-r--r-- | docs/dashboard/dimensions-contexts-families.mdx | 42 | ||||
| -rw-r--r-- | docs/dashboard/how-dashboard-works.mdx | 52 | ||||
| -rw-r--r-- | docs/dashboard/import-export-print-snapshot.mdx | 31 | ||||
| -rw-r--r-- | docs/dashboard/interact-charts.mdx | 32 | ||||
| -rw-r--r-- | docs/dashboard/reference-web-server.mdx | 20 | ||||
| -rw-r--r-- | docs/dashboard/visualization-date-and-time-controls.mdx | 32 |
7 files changed, 137 insertions, 104 deletions
diff --git a/docs/dashboard/customize.mdx b/docs/dashboard/customize.mdx index 8f0b222f2..3c30ee231 100644 --- a/docs/dashboard/customize.mdx +++ b/docs/dashboard/customize.mdx @@ -1,13 +1,19 @@ --- title: "Customize the standard dashboard" -description: "Netdata's preconfigured dashboard offers many customization options, such as choosing when charts are updated, your preferred theme, and custom text to document processes, and more." -type: how-to -custom_edit_url: https://github.com/netdata/netdata/edit/master/docs/dashboard/customize.mdx +description: >- + "Netdata's preconfigured dashboard offers many customization options, such as choosing when + charts are updated, your preferred theme, and custom text to document processes, and more." +type: "how-to" +custom_edit_url: "https://github.com/netdata/netdata/blob/master/docs/dashboard/customize.mdx" +sidebar_label: "Customize the standard dashboard" +learn_status: "Published" +learn_topic_type: "Tasks" +learn_rel_path: "Operations" --- # Customize the standard dashboard -While the [Netdata dashboard](/docs/dashboard/how-dashboard-works.mdx) comes preconfigured with hundreds of charts and +While the [Netdata dashboard](https://github.com/netdata/netdata/blob/master/docs/dashboard/how-dashboard-works.mdx) comes preconfigured with hundreds of charts and thousands of metrics, you may want to alter your experience based on a particular use case or preferences. ## Dashboard settings @@ -24,7 +30,7 @@ Here are a few popular settings: ### Change chart legend position -Find this setting under the **Visual** tab. By default, Netdata places the [legend of dimensions](/docs/dashboard/dimensions-contexts-families.mdx#dimension) _below_ charts. +Find this setting under the **Visual** tab. By default, Netdata places the [legend of dimensions](https://github.com/netdata/netdata/blob/master/docs/dashboard/dimensions-contexts-families.mdx#dimension) _below_ charts. Click this toggle to move the legend to the _right_ of charts. @@ -67,7 +73,7 @@ Edit the file with customizations to the `title`, `icon`, and `info` fields. Rep icon from [Font Awesome](https://fontawesome.com/cheatsheet) to customize the icons that appear throughout the dashboard. -Save the file, then navigate to your [Netdata config directory](/docs/configure/nodes.md) to edit `netdata.conf`. Add +Save the file, then navigate to your [Netdata config directory](https://github.com/netdata/netdata/blob/master/docs/configure/nodes.md) to edit `netdata.conf`. Add the following line to the `[web]` section to tell Netdata where to find your custom configuration. ```conf @@ -80,14 +86,14 @@ Reload your browser tab to see your custom configuration. ## What's next? If you're keen on continuing to customize your Netdata experience, check out our docs on [building new custom -dashboards](/web/gui/custom/README.md) with HTML, CSS, and JavaScript. +dashboards](https://github.com/netdata/netdata/blob/master/web/gui/custom/README.md) with HTML, CSS, and JavaScript. ### Further reading & related information - Dashboard - - [How the dashboard works](/docs/dashboard/how-dashboard-works.mdx) - - [Interact with charts](/docs/dashboard/interact-charts.mdx) - - [Chart dimensions, contexts, and families](/docs/dashboard/dimensions-contexts-families.mdx) - - [Select timeframes to visualize](/docs/dashboard/visualization-date-and-time-controls.mdx) - - [Import, export, and print a snapshot](/docs/dashboard/import-export-print-snapshot.mdx) - - **[Customize the standard dashboard](/docs/dashboard/customize.mdx)** + - [How the dashboard works](https://github.com/netdata/netdata/blob/master/docs/dashboard/how-dashboard-works.mdx) + - [Interact with charts](https://github.com/netdata/netdata/blob/master/docs/dashboard/interact-charts.mdx) + - [Chart dimensions, contexts, and families](https://github.com/netdata/netdata/blob/master/docs/dashboard/dimensions-contexts-families.mdx) + - [Select timeframes to visualize](https://github.com/netdata/netdata/blob/master/docs/dashboard/visualization-date-and-time-controls.mdx) + - [Import, export, and print a snapshot](https://github.com/netdata/netdata/blob/master/docs/dashboard/import-export-print-snapshot.mdx) + - **[Customize the standard dashboard](https://github.com/netdata/netdata/blob/master/docs/dashboard/customize.mdx)** diff --git a/docs/dashboard/dimensions-contexts-families.mdx b/docs/dashboard/dimensions-contexts-families.mdx index 0c6dd2adc..ee9636d15 100644 --- a/docs/dashboard/dimensions-contexts-families.mdx +++ b/docs/dashboard/dimensions-contexts-families.mdx @@ -1,20 +1,26 @@ --- title: "Chart dimensions, contexts, and families" -description: "Netdata organizes charts into dimensions, contexts, and families to automatically and meaningfully organize thousands of metrics into interactive charts." -type: explanation -custom_edit_url: https://github.com/netdata/netdata/edit/master/docs/dashboard/dimensions-contexts-families.mdx +description: >- + "Netdata organizes charts into dimensions, contexts, and families to automatically + and meaningfully organize thousands of metrics into interactive charts." +type: "explanation" +custom_edit_url: "https://github.com/netdata/netdata/blob/master/docs/dashboard/dimensions-contexts-families.mdx" +sidebar_label: "Chart dimensions, contexts, and families" +learn_status: "Published" +learn_topic_type: "Concepts" +learn_rel_path: "Concepts" --- # Chart dimensions, contexts, and families -While Netdata's charts require no configuration and are [easy to interact with](/docs/dashboard/interact-charts.mdx), +While Netdata's charts require no configuration and are [easy to interact with](https://github.com/netdata/netdata/blob/master/docs/dashboard/interact-charts.mdx), they have a lot of underlying complexity. To meaningfully organize charts out of the box based on what's happening in your nodes, Netdata uses the concepts of **dimensions**, **contexts**, and **families**. Understanding how these work will help you more easily navigate the dashboard, [write new -alarms](/docs/monitor/configure-alarms.md), or play around with the [API](/web/api/README.md). +alarms](https://github.com/netdata/netdata/blob/master/docs/monitor/configure-alarms.md), or play around with the [API](https://github.com/netdata/netdata/blob/master/web/api/README.md). -For a refresher on the anatomy of a chart, see [dashboards and charts](/docs/dashboard/how-dashboard-works.mdx). +For a refresher on the anatomy of a chart, see [dashboards and charts](https://github.com/netdata/netdata/blob/master/docs/dashboard/how-dashboard-works.mdx). ## Dimension @@ -36,7 +42,7 @@ dimensions](https://user-images.githubusercontent.com/1153921/114207816-a5cb7400 The chart shows 13 unique dimensions, such as `httpd` for the CPU utilization for web servers, `kernel` for anything related to the Linux kernel, and so on. In your dashboard, these specific dimensions will almost certainly be different. -Dimensions can be [hidden](/docs/dashboard/interact-charts.mdx#show-and-hide-dimensions) to help you focus your +Dimensions can be [hidden](https://github.com/netdata/netdata/blob/master/docs/dashboard/interact-charts.mdx#show-and-hide-dimensions) to help you focus your attention. ## Context @@ -50,8 +56,8 @@ whereas anything after the `.` is specified either by the chart's developer or b By default, a chart's type affects where it fits in the menu, while its family creates submenus. -Netdata also relies on contexts for [alarm configuration](/docs/monitor/configure-alarms.md) (the [`on` -line](/health/REFERENCE.md#alarm-line-on)). +Netdata also relies on contexts for [alarm configuration](https://github.com/netdata/netdata/blob/master/docs/monitor/configure-alarms.md) (the [`on` +line](https://github.com/netdata/netdata/blob/master/health/REFERENCE.md#alarm-line-on)). ## Family @@ -79,18 +85,18 @@ names: ## What's next? With an understanding of a chart's dimensions, context, and family, you're now ready to dig even deeper into Netdata's -dashboard. We recommend looking into [using the timeframe selector](/docs/dashboard/visualization-date-and-time-controls.mdx). +dashboard. We recommend looking into [using the timeframe selector](https://github.com/netdata/netdata/blob/master/docs/dashboard/visualization-date-and-time-controls.mdx). -If you feel comfortable with the [dashboard](/docs/dashboard/how-dashboard-works.mdx) and interacting with charts, we -recommend learning about [configuration](/docs/configure/nodes.md). While Netdata doesn't _require_ a complicated setup +If you feel comfortable with the [dashboard](https://github.com/netdata/netdata/blob/master/docs/dashboard/how-dashboard-works.mdx) and interacting with charts, we +recommend learning about [configuration](https://github.com/netdata/netdata/blob/master/docs/configure/nodes.md). While Netdata doesn't _require_ a complicated setup process or a query language to create charts, there are a lot of ways to tweak the experience to match your needs. ### Further reading & related information - Dashboard - - [How the dashboard works](/docs/dashboard/how-dashboard-works.mdx) - - [Interact with charts](/docs/dashboard/interact-charts.mdx) - - **[Chart dimensions, contexts, and families](/docs/dashboard/dimensions-contexts-families.mdx)** - - [Select timeframes to visualize](/docs/dashboard/visualization-date-and-time-controls.mdx) - - [Import, export, and print a snapshot](/docs/dashboard/import-export-print-snapshot.mdx) - - [Customize the standard dashboard](/docs/dashboard/customize.mdx) + - [How the dashboard works](https://github.com/netdata/netdata/blob/master/docs/dashboard/how-dashboard-works.mdx) + - [Interact with charts](https://github.com/netdata/netdata/blob/master/docs/dashboard/interact-charts.mdx) + - **[Chart dimensions, contexts, and families](https://github.com/netdata/netdata/blob/master/docs/dashboard/dimensions-contexts-families.mdx)** + - [Select timeframes to visualize](https://github.com/netdata/netdata/blob/master/docs/dashboard/visualization-date-and-time-controls.mdx) + - [Import, export, and print a snapshot](https://github.com/netdata/netdata/blob/master/docs/dashboard/import-export-print-snapshot.mdx) + - [Customize the standard dashboard](https://github.com/netdata/netdata/blob/master/docs/dashboard/customize.mdx) diff --git a/docs/dashboard/how-dashboard-works.mdx b/docs/dashboard/how-dashboard-works.mdx index 315614d69..f14402705 100644 --- a/docs/dashboard/how-dashboard-works.mdx +++ b/docs/dashboard/how-dashboard-works.mdx @@ -1,8 +1,14 @@ --- title: "How the dashboard works" -description: "Learn how to navigate Netdata's preconfigured dashboard to get started exploring, visualizing, and troubleshooting in real time." -type: explanation -custom_edit_url: https://github.com/netdata/netdata/edit/master/docs/dashboard/how-dashboard-works.mdx +description: >- + "Learn how to navigate Netdata's preconfigured dashboard to get started + exploring, visualizing, and troubleshooting in real time." +type: "explanation" +custom_edit_url: "https://github.com/netdata/netdata/blob/master/docs/dashboard/how-dashboard-works.mdx" +sidebar_label: "How the dashboard works" +learn_status: "Published" +learn_topic_type: "Concepts" +learn_rel_path: "Concepts" --- # How the dashboard works @@ -10,7 +16,7 @@ custom_edit_url: https://github.com/netdata/netdata/edit/master/docs/dashboard/h Because Netdata is a monitoring and _troubleshooting_ platform, a dashboard with real-time, meaningful, and context-aware charts is essential. -As soon as you [install Netdata](/docs/get-started.mdx), it autodetects hardware, OS, containers, services, and +As soon as you [install Netdata](https://github.com/netdata/netdata/blob/master/docs/get-started.mdx), it autodetects hardware, OS, containers, services, and applications running on your node and builds a dashboard on a single, scrollable webpage. This page features hundreds of charts, which are preconfigured to save you time from learning a query language, all stacked on top of one another. This vertical rhythm is designed to encourage exploration and help you visually identify connections between the metrics @@ -27,7 +33,7 @@ Access Netdata's dashboard by navigating to `http://NODE:19999` in your browser,  -Many features of the internal web server that serves the dashboard are [configurable](/web/server/README.md), including +Many features of the internal web server that serves the dashboard are [configurable](https://github.com/netdata/netdata/blob/master/web/server/README.md), including the listen port, enforced TLS, and even disabling the dashboard altogether. ## Sections and menus @@ -48,12 +54,12 @@ submenus](https://user-images.githubusercontent.com/1153921/80832425-7c528600-8b ## Charts -Every **chart** in the Netdata dashboard is [fully interactive](/docs/dashboard/interact-charts.mdx). Netdata +Every **chart** in the Netdata dashboard is [fully interactive](https://github.com/netdata/netdata/blob/master/docs/dashboard/interact-charts.mdx). Netdata synchronizes your interactions to help you understand exactly how a node behaved in any timeframe, whether that's seconds or days. A chart is an individual, interactive, always-updating graphic displaying one or more collected/calculated metrics, -which are generated by [collectors](/docs/collect/how-collectors-work.md). +which are generated by [collectors](https://github.com/netdata/netdata/blob/master/docs/collect/how-collectors-work.md).  @@ -70,7 +76,7 @@ like pushing the current timeframe off the screen to see what came before or aft To zoom, press and hold `Shift`, then use your mouse's scroll wheel, or a two-finger pinch if you're using a touchpad. -See [interact with charts](/docs/dashboard/interact-charts.mdx) for all the possible ways to interact with the charts on +See [interact with charts](https://github.com/netdata/netdata/blob/master/docs/dashboard/interact-charts.mdx) for all the possible ways to interact with the charts on your dashboard. ## Alarms @@ -78,7 +84,7 @@ your dashboard. Many of the preconfigured charts on the Netdata dashboard also come with preconfigured alarms. Netdata sends three primary alarm states via alarms: `CLEAR`, `WARNING`, and `CRITICAL`. If an alarm moves from a `CLEAR` state to either `WARNING` or `CRITICAL`, Netdata creates a notification to let you know exactly what's going on. There are [other alarm -states](/health/REFERENCE.md#alarm-statuses) as well. +states](https://github.com/netdata/netdata/blob/master/health/REFERENCE.md#alarm-statuses) as well. The easiest way to see alarms is by clicking on the alarm icon  @@ -88,25 +94,25 @@ active alarm, and the **Log** tab shows a historical record of exactly when alar  -Learn more about [viewing active alarms](/docs/monitor/view-active-alarms.md), [configuring -alarms](/docs/monitor/configure-alarms.md), or [enabling a new notification -method](/docs/monitor/enable-notifications.md). +Learn more about [viewing active alarms](https://github.com/netdata/netdata/blob/master/docs/monitor/view-active-alarms.md), [configuring +alarms](https://github.com/netdata/netdata/blob/master/docs/monitor/configure-alarms.md), or [enabling a new notification +method](https://github.com/netdata/netdata/blob/master/docs/monitor/enable-notifications.md). ## What's next? -Learn more about [interacting with charts](/docs/dashboard/interact-charts.mdx) to quickly pan through time, zoom, and +Learn more about [interacting with charts](https://github.com/netdata/netdata/blob/master/docs/dashboard/interact-charts.mdx) to quickly pan through time, zoom, and show/hide dimensions to best understand the state of your node in any timeframe. A complete understanding of [chart -dimensions, contexts, and families](/docs/dashboard/dimensions-contexts-families.mdx) will also help with how Netdata -organizes its dashboard and operates [alarms](/docs/monitor/configure-alarms.md). +dimensions, contexts, and families](https://github.com/netdata/netdata/blob/master/docs/dashboard/dimensions-contexts-families.mdx) will also help with how Netdata +organizes its dashboard and operates [alarms](https://github.com/netdata/netdata/blob/master/docs/monitor/configure-alarms.md). ### Further reading & related information - Dashboard - - **[How the dashboard works](/docs/dashboard/how-dashboard-works.mdx)** - - [Interact with charts](/docs/dashboard/interact-charts.mdx) - - [Chart dimensions, contexts, and families](/docs/dashboard/dimensions-contexts-families.mdx) - - [Select timeframes to visualize](/docs/dashboard/visualization-date-and-time-controls.mdx) - - [Import, export, and print a snapshot](/docs/dashboard/import-export-print-snapshot.mdx) - - [Customize the standard dashboard](/docs/dashboard/customize.mdx) -- [HTTP API](/web/api/README.md) -- [Custom dashboards](/web/gui/custom/README.md) + - **[How the dashboard works](https://github.com/netdata/netdata/blob/master/docs/dashboard/how-dashboard-works.mdx)** + - [Interact with charts](https://github.com/netdata/netdata/blob/master/docs/dashboard/interact-charts.mdx) + - [Chart dimensions, contexts, and families](https://github.com/netdata/netdata/blob/master/docs/dashboard/dimensions-contexts-families.mdx) + - [Select timeframes to visualize](https://github.com/netdata/netdata/blob/master/docs/dashboard/visualization-date-and-time-controls.mdx) + - [Import, export, and print a snapshot](https://github.com/netdata/netdata/blob/master/docs/dashboard/import-export-print-snapshot.mdx) + - [Customize the standard dashboard](https://github.com/netdata/netdata/blob/master/docs/dashboard/customize.mdx) +- [HTTP API](https://github.com/netdata/netdata/blob/master/web/api/README.md) +- [Custom dashboards](https://github.com/netdata/netdata/blob/master/web/gui/custom/README.md) diff --git a/docs/dashboard/import-export-print-snapshot.mdx b/docs/dashboard/import-export-print-snapshot.mdx index df43feb0f..23430a561 100644 --- a/docs/dashboard/import-export-print-snapshot.mdx +++ b/docs/dashboard/import-export-print-snapshot.mdx @@ -1,8 +1,15 @@ --- title: "Import, export, and print a snapshot" -description: "Snapshots can be incredibly useful for diagnosing anomalies after they've already happened, and are interoperable with any other node running Netdata." -type: how-to -custom_edit_url: https://github.com/netdata/netdata/edit/master/docs/dashboard/import-export-print-snapshot.mdx +description: >- + "Snapshots can be incredibly useful for diagnosing anomalies after + they've already happened, and are interoperable with any other node + running Netdata." +type: "how-to" +custom_edit_url: "https://github.com/netdata/netdata/blob/master/docs/dashboard/import-export-print-snapshot.mdx" +sidebar_label: "Import, export, and print a snapshot" +learn_status: "Published" +learn_topic_type: "Tasks" +learn_rel_path: "Operations" --- # Import, export, and print snapshots @@ -12,7 +19,7 @@ node running Netdata. Or, you can create a print-ready version of your dashboard paper. Snapshots can be incredibly useful for diagnosing anomalies after they've already happened. Let's say Netdata triggered a warning alarm while you were asleep. In the morning, you can [select the -timeframe](/docs/dashboard/visualization-date-and-time-controls.mdx) when the alarm triggered, export a snapshot, and send it to a +timeframe](https://github.com/netdata/netdata/blob/master/docs/dashboard/visualization-date-and-time-controls.mdx) when the alarm triggered, export a snapshot, and send it to a colleague for further analysis. @@ -69,15 +76,15 @@ Netdata opens a browser print dialog for you to save to PDF or print. ## What's next? Now that you understand snapshots, now is a good time to delve deeper into some of the dashboard's lesser-known -features, such as [customization](/docs/dashboard/customize.mdx) or [building new, custom -dashboards](/web/gui/custom/README.md). +features, such as [customization](https://github.com/netdata/netdata/blob/master/docs/dashboard/customize.mdx) or [building new, custom +dashboards](https://github.com/netdata/netdata/blob/master/web/gui/custom/README.md). ### Further reading & related information - Dashboard - - [How the dashboard works](/docs/dashboard/how-dashboard-works.mdx) - - [Interact with charts](/docs/dashboard/interact-charts.mdx) - - [Chart dimensions, contexts, and families](/docs/dashboard/dimensions-contexts-families.mdx) - - [Select timeframes to visualize](/docs/dashboard/visualization-date-and-time-controls.mdx) - - **[Import, export, and print a snapshot](/docs/dashboard/import-export-print-snapshot.mdx)** - - [Customize the standard dashboard](/docs/dashboard/customize.mdx)
\ No newline at end of file + - [How the dashboard works](https://github.com/netdata/netdata/blob/master/docs/dashboard/how-dashboard-works.mdx) + - [Interact with charts](https://github.com/netdata/netdata/blob/master/docs/dashboard/interact-charts.mdx) + - [Chart dimensions, contexts, and families](https://github.com/netdata/netdata/blob/master/docs/dashboard/dimensions-contexts-families.mdx) + - [Select timeframes to visualize](https://github.com/netdata/netdata/blob/master/docs/dashboard/visualization-date-and-time-controls.mdx) + - **[Import, export, and print a snapshot](https://github.com/netdata/netdata/blob/master/docs/dashboard/import-export-print-snapshot.mdx)** + - [Customize the standard dashboard](https://github.com/netdata/netdata/blob/master/docs/dashboard/customize.mdx)
\ No newline at end of file diff --git a/docs/dashboard/interact-charts.mdx b/docs/dashboard/interact-charts.mdx index fe0f05e3f..a733bc9e0 100644 --- a/docs/dashboard/interact-charts.mdx +++ b/docs/dashboard/interact-charts.mdx @@ -1,13 +1,17 @@ --- title: "Interact with charts" description: "Learn how to pan, zoom, select, and customize Netdata's preconfigured charts to help you troubleshooting with real-time, per-second metrics data." -type: how-to -custom_edit_url: https://github.com/netdata/netdata/edit/master/docs/dashboard/interact-charts.mdx +type: "how-to" +custom_edit_url: "https://github.com/netdata/netdata/edit/master/docs/dashboard/interact-charts.mdx" +sidebar_label: "Interact with charts" +learn_status: "Published" +learn_topic_type: "Tasks" +learn_rel_path: "Operations" --- # Interact with charts -> ⚠️ There is a new version of charts that is currently **only** available on [Netdata Cloud](https://learn.netdata.cloud/docs/cloud/visualize/interact-new-charts). We didn't +> ⚠️ There is a new version of charts that is currently **only** available on [Netdata Cloud](https://github.com/netdata/netdata/blob/master/docs/cloud/visualize/interact-new-charts.md). We didn't > want to keep this valuable feature from you, so after we get this into your hands on the Cloud, we will collect and implement your feedback to make sure we are providing the best possible version of the feature on the Netdata Agent dashboard as quickly as possible. While charts that update every second with new metrics are helpful for understanding the immediate state of a node, deep @@ -172,26 +176,26 @@ jobs: ### Future Work -We already have [configurable host labels](https://learn.netdata.cloud/guides/using-host-labels) as well, which currently can’t be used to filter or group your metrics. We intend to provide the same capabilities described here with host labels, among other capabilities on other areas of the app as well +We already have [configurable host labels](https://github.com/netdata/netdata/blob/master/docs/guides/using-host-labels.md) as well, which currently can’t be used to filter or group your metrics. We intend to provide the same capabilities described here with host labels, among other capabilities on other areas of the app as well ## What's next? We recommend you read up on the differences between [chart dimensions, contexts, and -families](/docs/dashboard/dimensions-contexts-families.mdx) to complete your understanding of how Netdata organizes its +families](https://github.com/netdata/netdata/blob/master/docs/dashboard/dimensions-contexts-families.mdx) to complete your understanding of how Netdata organizes its dashboards. Another valuable way to interact with charts is to use the [timeframe -selector](/docs/dashboard/visualization-date-and-time-controls.mdx), which helps you visualize specific moments of historical metrics. +selector](https://github.com/netdata/netdata/blob/master/docs/dashboard/visualization-date-and-time-controls.mdx), which helps you visualize specific moments of historical metrics. -If you feel comfortable with the [dashboard](/docs/dashboard/how-dashboard-works.mdx) and interacting with charts, we -recommend moving on to learning about [configuration](/docs/configure/nodes.md). While Netdata doesn't _require_ a +If you feel comfortable with the [dashboard](https://github.com/netdata/netdata/blob/master/docs/dashboard/how-dashboard-works.mdx) and interacting with charts, we +recommend moving on to learning about [configuration](https://github.com/netdata/netdata/blob/master/docs/configure/nodes.md). While Netdata doesn't _require_ a complicated setup process or a query language to create charts, there are a lot of ways to tweak the experience to match your needs. ### Further reading & related information - Dashboard - - [How the dashboard works](/docs/dashboard/how-dashboard-works.mdx) - - [Netdata Cloud · Interact with new charts](https://learn.netdata.cloud/docs/cloud/visualize/interact-new-charts) - - [Chart dimensions, contexts, and families](/docs/dashboard/dimensions-contexts-families.mdx) - - [Select timeframes to visualize](/docs/dashboard/visualization-date-and-time-controls.mdx) - - [Import, export, and print a snapshot](/docs/dashboard/import-export-print-snapshot.mdx) - - [Customize the standard dashboard](/docs/dashboard/customize.mdx) + - [How the dashboard works](https://github.com/netdata/netdata/blob/master/docs/dashboard/how-dashboard-works.mdx) + - [Netdata Cloud · Interact with new charts](https://github.com/netdata/netdata/blob/master/docs/cloud/visualize/interact-new-charts.md) + - [Chart dimensions, contexts, and families](https://github.com/netdata/netdata/blob/master/docs/dashboard/dimensions-contexts-families.mdx) + - [Select timeframes to visualize](https://github.com/netdata/netdata/blob/master/docs/dashboard/visualization-date-and-time-controls.mdx) + - [Import, export, and print a snapshot](https://github.com/netdata/netdata/blob/master/docs/dashboard/import-export-print-snapshot.mdx) + - [Customize the standard dashboard](https://github.com/netdata/netdata/blob/master/docs/dashboard/customize.mdx) diff --git a/docs/dashboard/reference-web-server.mdx b/docs/dashboard/reference-web-server.mdx index 55e761a23..f90e6f873 100644 --- a/docs/dashboard/reference-web-server.mdx +++ b/docs/dashboard/reference-web-server.mdx @@ -16,7 +16,7 @@ This web server respects the `keep-alive` HTTP header to serve multiple HTTP req ## Configuration -From within your Netdata config directory (typically `/etc/netdata`), [use `edit-config`](/docs/configure/nodes.md) to +From within your Netdata config directory (typically `/etc/netdata`), [use `edit-config`](https://github.com/netdata/netdata/blob/master/docs/configure/nodes.md) to open `netdata.conf`. ``` @@ -33,8 +33,8 @@ Scroll down to the `[web]` section to find the following settings. | `ssl certificate` | `/etc/netdata/ssl/cert.pem` | Declare the location of an SSL certificate to [enable HTTPS](#enable-httpstls-support). | | `tls version` | `1.3` | Choose which TLS version to use. While all versions are allowed (`1` or `1.0`, `1.1`, `1.2` and `1.3`), we recommend `1.3` for the most secure encryption. If left blank, Netdata uses the highest available protocol version on your system. | | `tls ciphers` | `none` | Choose which TLS cipher to use. Options include `TLS_AES_256_GCM_SHA384`, `TLS_CHACHA20_POLY1305_SHA256`, and `TLS_AES_128_GCM_SHA256`. If left blank, Netdata uses the default cipher list for that protocol provided by your TLS implementation. | -| `ses max window` | `15` | See [single exponential smoothing](/web/api/queries/ses/README.md). | -| `des max window` | `15` | See [double exponential smoothing](/web/api/queries/des/README.md). | +| `ses max window` | `15` | See [single exponential smoothing](https://github.com/netdata/netdata/blob/master/web/api/queries/ses/README.md). | +| `des max window` | `15` | See [double exponential smoothing](https://github.com/netdata/netdata/blob/master/web/api/queries/des/README.md). | | `mode` | `static-threaded` | Turns on (`static-threaded` or off (`none`) the static-threaded web server. See the [example](#disable-the-web-server) to turn off the web server and disable the dashboard. | | `listen backlog` | `4096` | The port backlog. Check `man 2 listen`. | | `default port` | `19999` | The listen port for the static web server. | @@ -42,10 +42,10 @@ Scroll down to the `[web]` section to find the following settings. | `web files group` | `netdata` | If this is set, Netdata will check if the file is owned by this group and refuse to serve the file if it's not. | | `disconnect idle clients after seconds` | `60` | The time in seconds to disconnect web clients after being totally idle. | | `timeout for first request` | `60` | How long to wait for a client to send a request before closing the socket. Prevents slow request attacks. | -| `accept a streaming request every seconds` | `0` | Can be used to set a limit on how often a parent node will accept streaming requests from child nodes in a [streaming and replication setup](/streaming/README.md). | -| `respect do not track policy` | `no` | If set to `yes`, Netdata will respect the user's browser preferences for [Do Not Track](https://www.eff.org/issues/do-not-track) (DNT) and storing cookies. If DNT is _enabled_ in the browser, and this option is set to `yes`, users will not be able to sign in to Netdata Cloud via their local Agent dashboard, and their node will not connect to any [registry](/registry/README.md). For certain browsers, users must disable DNT and change this option to `yes` for full functionality. | +| `accept a streaming request every seconds` | `0` | Can be used to set a limit on how often a parent node will accept streaming requests from child nodes in a [streaming and replication setup](https://github.com/netdata/netdata/blob/master/streaming/README.md). | +| `respect do not track policy` | `no` | If set to `yes`, Netdata will respect the user's browser preferences for [Do Not Track](https://www.eff.org/issues/do-not-track) (DNT) and storing cookies. If DNT is _enabled_ in the browser, and this option is set to `yes`, users will not be able to sign in to Netdata Cloud via their local Agent dashboard, and their node will not connect to any [registry](https://github.com/netdata/netdata/blob/master/registry/README.md). For certain browsers, users must disable DNT and change this option to `yes` for full functionality. | | `x-frame-options response header` | ` ` | Avoid [clickjacking attacks](https://developer.mozilla.org/en-US/docs/Web/HTTP/Headers/X-Frame-Options), by ensuring that the content is not embedded into other sites. | -| `allow connections from` | `localhost *` | Declare which IP addresses or full-qualified domain names (FQDNs) are allowed to connect to the web server, including the [dashboard](/docs/dashboard/interact-charts.mdx) or [HTTP API](/web/api/README.md). This is a global setting with higher priority to any of the ones below. | +| `allow connections from` | `localhost *` | Declare which IP addresses or full-qualified domain names (FQDNs) are allowed to connect to the web server, including the [dashboard](https://github.com/netdata/netdata/blob/master/docs/dashboard/interact-charts.mdx) or [HTTP API](https://github.com/netdata/netdata/blob/master/web/api/README.md). This is a global setting with higher priority to any of the ones below. | | `allow connections by dns` | `heuristic` | See the [access list examples](#access-lists) for details on using `allow` settings. | | `allow dashboard from` | `localhost *` | | | `allow dashboard by dns` | `heuristic` | | @@ -62,7 +62,7 @@ Scroll down to the `[web]` section to find the following settings. | `gzip compression level` | `3` | Valid settings are 1 (fastest) to 9 (best ratio). | | `web server threads` | ` ` | How many processor threads the web server is allowed. The default is system-specific, the minimum of `6` or the number of CPU cores. | | `web server max sockets` | ` ` | Available sockets. The default is system-specific, automatically adjusted to 50% of the max number of open files Netdata is allowed to use (via `/etc/security/limits.conf` or systemd), to allow enough file descriptors to be available for data collection. | -| `custom dashboard_info.js` | ` ` | Specifies the location of a custom `dashboard.js` file. See [customizing the standard dashboard](/docs/dashboard/customize.mdx#customize-the-standard-dashboard) for details. | +| `custom dashboard_info.js` | ` ` | Specifies the location of a custom `dashboard.js` file. See [customizing the standard dashboard](https://github.com/netdata/netdata/blob/master/docs/dashboard/customize.mdx#customize-the-standard-dashboard) for details. | ## Examples @@ -102,7 +102,7 @@ Using the above, Netdata will bind to: - IPv4 127.0.0.1 at port 19999 (port was used from `default port`). Only the UI (dashboard) and the read API will be accessible on this port. Both HTTP and HTTPS requests will be accepted. - IPv4 10.1.1.1 at port 19998. The management API and `netdata.conf` will be accessible on this port. - All the IPs `hostname` resolves to (both IPv4 and IPv6 depending on the resolved IPs) at port 19997. Only badges will be accessible on this port. -- All IPv6 IPs at port 19996. Only metric streaming requests from other Netdata agents will be accepted on this port. Only encrypted streams will be allowed (i.e. child nodes also need to be [configured for TLS](/streaming/README.md). +- All IPv6 IPs at port 19996. Only metric streaming requests from other Netdata agents will be accepted on this port. Only encrypted streams will be allowed (i.e. child nodes also need to be [configured for TLS](https://github.com/netdata/netdata/blob/master/streaming/README.md). - All the IPs `localhost` resolves to (both IPv4 and IPv6 depending the resolved IPs) at port 19996. This port will only accept registry API requests. - All IPv4 and IPv6 IPs at port `http` as set in `/etc/services`. Only the UI (dashboard) and the read API will be accessible on this port. - Unix domain socket `/run/netdata/netdata.sock`. All requests are serviceable on this socket. Note that in some OSs like Fedora, every service sees a different `/tmp`, so don't create a Unix socket under `/tmp`. `/run` or `/var/run` is suggested. @@ -189,7 +189,7 @@ Example: bind to = *=dashboard|registry|badges|management|streaming|netdata.conf^SSL=force ``` -For information how to configure the child to use TLS, check [securing the communication](/streaming/README.md#securing-streaming-communications) in the streaming documentation. There you will find additional details on the expected behavior for client and server nodes, when their respective TLS options are enabled. +For information how to configure the child to use TLS, check [securing the communication](https://github.com/netdata/netdata/blob/master/streaming/README.md#securing-streaming-communications) in the streaming documentation. There you will find additional details on the expected behavior for client and server nodes, when their respective TLS options are enabled. When we define the use of SSL in a Netdata agent for different ports, Netdata will apply the behavior specified on each port. For example, using the configuration line below: @@ -245,7 +245,7 @@ Netdata supports access lists in `netdata.conf`: - `allow netdata.conf from` checks the IP to allow `http://netdata.host:19999/netdata.conf`. The IPs listed are all the private IPv4 addresses, including link local IPv6 addresses. Keep in mind that connections to Netdata API ports are filtered by `allow connections from`. So, IPs allowed by `allow netdata.conf from` should also be allowed by `allow connections from`. -- `allow management from` checks the IPs to allow API management calls. Management via the API is currently supported for [health](/web/api/health/README.md#health-management-api) +- `allow management from` checks the IPs to allow API management calls. Management via the API is currently supported for [health](https://github.com/netdata/netdata/blob/master/web/api/health/README.md#health-management-api) In order to check the FQDN of the connection without opening the Netdata agent to DNS-spoofing, a reverse-dns record must be setup for the connecting host. At connection time the reverse-dns of the peer IP address is resolved, and diff --git a/docs/dashboard/visualization-date-and-time-controls.mdx b/docs/dashboard/visualization-date-and-time-controls.mdx index fe3e51091..a59a1f066 100644 --- a/docs/dashboard/visualization-date-and-time-controls.mdx +++ b/docs/dashboard/visualization-date-and-time-controls.mdx @@ -1,9 +1,13 @@ ---- +<!-- title: "Visualization date and time controls" description: "Netdata's dashboard features powerful date visualization controls that include a time control (play, pause, force play), a timezone selector and a rich date and timeframe selector, with useful defaults and rich customization, to help you narrow your focus when troubleshooting issues or anomalies." -type: how-to -custom_edit_url: https://github.com/netdata/netdata/edit/master/docs/dashboard/visualization-date-and-time-controls.mdx ---- +type: "how-to" +custom_edit_url: "https://github.com/netdata/netdata/edit/master/docs/dashboard/visualization-date-and-time-controls.mdx" +sidebar_label: "Visualization date and time controls" +learn_status: "Published" +learn_topic_type: "Concepts" +learn_rel_path: "Concepts" +--> # Visualization date and time controls @@ -11,7 +15,7 @@ custom_edit_url: https://github.com/netdata/netdata/edit/master/docs/dashboard/v ### Pick timeframes to visualize -While [panning through time and zooming in/out](/docs/dashboard/interact-charts.mdx) from charts it is helpful when +While [panning through time and zooming in/out](https://github.com/netdata/netdata/blob/master/docs/dashboard/interact-charts.mdx) from charts it is helpful when you're looking a recent history, or want to do granular troubleshooting, what if you want to see metrics from 6 hours ago? Or 6 days? @@ -80,7 +84,7 @@ distributed in different timezones and they need to collaborate. Our goal is to make it easier for you and your teams to troubleshoot based on your timezone preference and communicate easily with varying timezones and timeframes without the need to be concerned about their specificity. -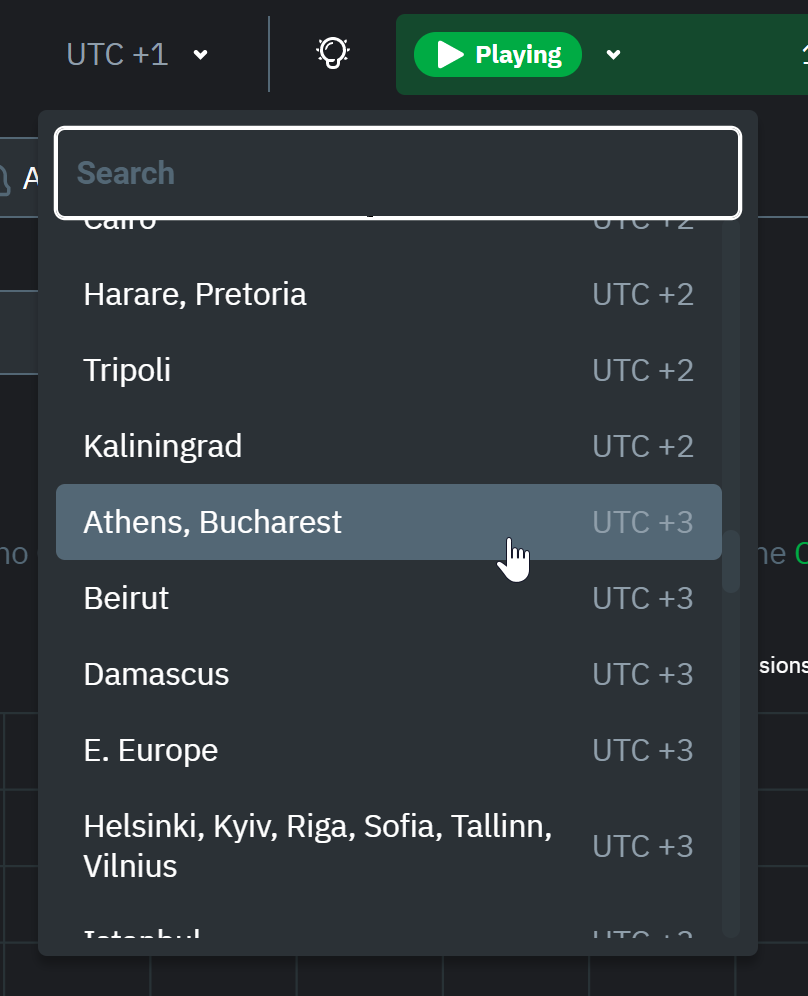 +<img width="437" alt="Untitled1" src="https://user-images.githubusercontent.com/43294513/216628390-c3bd1cd2-349d-4523-b8d3-c7e68395f670.png"> When you change the timezone all the date and time fields will be updated to be displayed according to the specified timezone, this goes from charts to alerts information and across the Netdata Cloud. @@ -99,23 +103,23 @@ beyond stored historical metrics, you'll see this message: 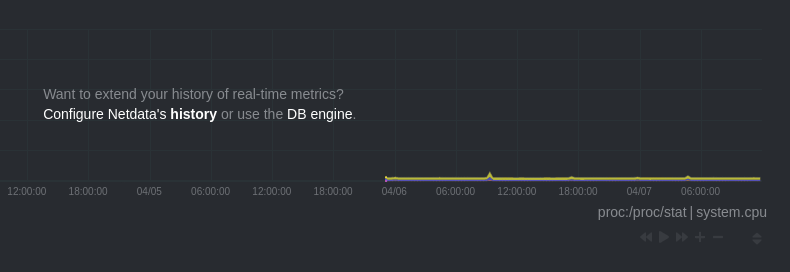 -At any time, [configure the internal TSDB's storage capacity](/docs/store/change-metrics-storage.md) to expand your +At any time, [configure the internal TSDB's storage capacity](https://github.com/netdata/netdata/blob/master/docs/store/change-metrics-storage.md) to expand your depth of historical metrics. ## What's next? One useful next step after selecting a timeframe is [exporting the -metrics](/docs/dashboard/import-export-print-snapshot.mdx) into a snapshot file, which can then be shared and imported +metrics](https://github.com/netdata/netdata/blob/master/docs/dashboard/import-export-print-snapshot.mdx) into a snapshot file, which can then be shared and imported into any other Netdata dashboard. -There are also many ways to [customize](/docs/dashboard/customize.mdx) the standard dashboard experience, from changing +There are also many ways to [customize](https://github.com/netdata/netdata/blob/master/docs/dashboard/customize.mdx) the standard dashboard experience, from changing the theme to editing the text that accompanies every section of charts. ## Further reading & related information - Dashboard - - [How the dashboard works](/docs/dashboard/how-dashboard-works.mdx) - - [Interact with charts](/docs/dashboard/interact-charts.mdx) - - [Chart dimensions, contexts, and families](/docs/dashboard/dimensions-contexts-families.mdx) - - [Import, export, and print a snapshot](/docs/dashboard/import-export-print-snapshot.mdx) - - [Customize the standard dashboard](/docs/dashboard/customize.mdx) + - [How the dashboard works](https://github.com/netdata/netdata/blob/master/docs/dashboard/how-dashboard-works.mdx) + - [Interact with charts](https://github.com/netdata/netdata/blob/master/docs/dashboard/interact-charts.mdx) + - [Chart dimensions, contexts, and families](https://github.com/netdata/netdata/blob/master/docs/dashboard/dimensions-contexts-families.mdx) + - [Import, export, and print a snapshot](https://github.com/netdata/netdata/blob/master/docs/dashboard/import-export-print-snapshot.mdx) + - [Customize the standard dashboard](https://github.com/netdata/netdata/blob/master/docs/dashboard/customize.mdx) |