
diff options
Diffstat (limited to '')
| -rw-r--r-- | docs/dashboards-and-charts/visualization-date-and-time-controls.md (renamed from docs/dashboard/visualization-date-and-time-controls.md) | 4 |
1 files changed, 2 insertions, 2 deletions
diff --git a/docs/dashboard/visualization-date-and-time-controls.md b/docs/dashboards-and-charts/visualization-date-and-time-controls.md index 99e4c308e..3e2b6dbdc 100644 --- a/docs/dashboard/visualization-date-and-time-controls.md +++ b/docs/dashboards-and-charts/visualization-date-and-time-controls.md @@ -27,7 +27,7 @@ The date and time selector allows you to change the visible timeframe and change ### Pick timeframes to visualize -While [panning through time and zooming in/out](https://github.com/netdata/netdata/blob/master/docs/cloud/visualize/interact-new-charts.md) from charts it is helpful when you're looking a recent history, or want to do granular troubleshooting, what if you want to see metrics from 6 hours ago? Or 6 days? +While [panning through time and zooming in/out](/docs/dashboards-and-charts/netdata-charts.md) from charts it is helpful when you're looking a recent history, or want to do granular troubleshooting, what if you want to see metrics from 6 hours ago? Or 6 days? Netdata's dashboard features a **timeframe selector** to help you visualize specific timeframes in a few helpful ways. By default, it shows a certain number of minutes of historical metrics based on the your browser's viewport to ensure it's always showing per-second granularity. @@ -81,7 +81,7 @@ beyond stored historical metrics, you'll see this message: 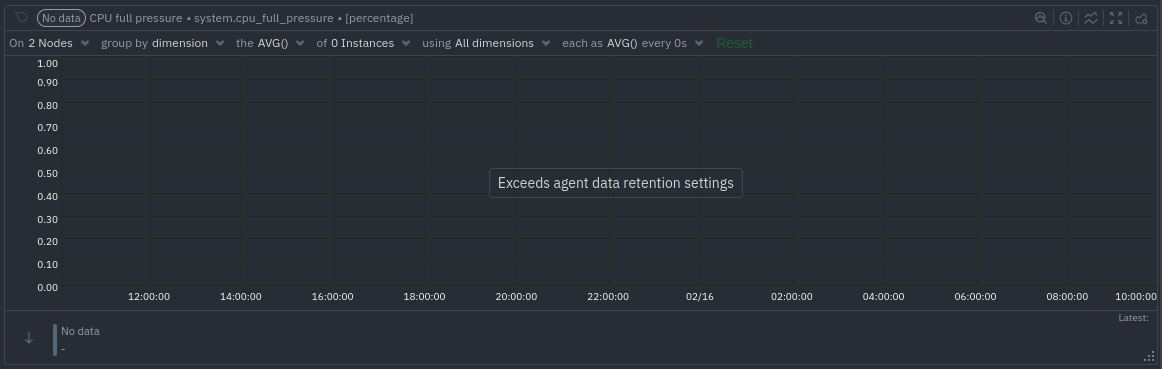 -At any time, [configure the internal TSDB's storage capacity](https://github.com/netdata/netdata/blob/master/docs/store/change-metrics-storage.md) to expand your +At any time, [configure the internal TSDB's storage capacity](/docs/netdata-agent/configuration/optimizing-metrics-database/change-metrics-storage.md) to expand your depth of historical metrics. ### Timezone selector |