
diff options
Diffstat (limited to 'docs/getting-started.md')
| -rw-r--r-- | docs/getting-started.md | 147 |
1 files changed, 77 insertions, 70 deletions
diff --git a/docs/getting-started.md b/docs/getting-started.md index 065da1c70..1ccab4247 100644 --- a/docs/getting-started.md +++ b/docs/getting-started.md @@ -1,26 +1,36 @@ -# Getting started guide +<!-- +title: "Get started guide" +date: 2020-05-04 +custom_edit_url: https://github.com/netdata/netdata/edit/master/docs/getting-started.md +--> -Thanks for trying Netdata! In this guide, we'll quickly walk you through the first steps you should take after getting -Netdata installed. +# Get started guide -Netdata can collect thousands of metrics in real-time without any configuration, but there are some valuable things to -know to get the most of out Netdata based on your needs. +Thanks for trying the Netdata Agent! In this getting started guide, we'll quickly walk you through the first steps you +should take after installing the Agent. -> If you haven't installed Netdata yet, visit the [installation instructions](../packaging/installer) for details, -> including our one-liner script, which automatically installs Netdata on almost all Linux distributions. +The Agent can collect thousands of metrics in real-time and use its database for long-term metrics storage without any +configuration, but there are some valuable things to know to get the most out of Netdata based on your needs. + +We'll skip right into some technical details, so if you're brand-new to monitoring the health and performance of systems +and applications, our [**step-by-step guide**](/docs/guides/step-by-step/step-00.md) might be a better fit. + +> If you haven't installed Netdata yet, visit the [installation instructions](/packaging/installer/README.md) for +> details, including our one-liner script, which automatically installs Netdata on almost all Linux distributions. ## Access the dashboard -Open up your web browser of choice and navigate to `http://YOUR-HOST:19999`. Welcome to Netdata! +Open up your web browser of choice and navigate to `http://NODE:19999`, replacing `NODE` with the IP address or hostname +of your Agent. Hit **Enter**. Welcome to Netdata!  +dashboard](https://user-images.githubusercontent.com/1153921/80825153-abaec600-8b94-11ea-8b17-1b770a2abaa9.gif) **What's next?**: -- Read more about the [standard Netdata dashboard](../web/gui/). -- Learn all the specifics of [using charts](../web/README.md#using-charts) or the differences between [charts, - context, and families](../web/README.md#charts-contexts-families). +- Read more about the [standard Netdata dashboard](/web/gui/). +- Learn all the specifics of [using charts](/web/README.md#using-charts) or the differences between [charts, + context, and families](/web/README.md#charts-contexts-families). ## Configuration basics @@ -39,12 +49,31 @@ Once you save your changes, [restart Netdata](#start-stop-and-restart-netdata) t **What's next?**: -- [Change how long Netdata stores metrics](#change-how-long-netdata-stores-metrics) by either increasing the `history` - option or switching to the database engine. -- Move Netdata's dashboard to a [different port](https://docs.netdata.cloud/web/server/) or enable TLS/HTTPS +- [Change how long Netdata stores metrics](#change-how-long-netdata-stores-metrics) by changing the `page cache size` + and `dbengine disk space` settings in `netdata.conf`. +- Move Netdata's dashboard to a [different port](/web/server/) or enable TLS/HTTPS encryption. -- See all the `netdata.conf` options in our [daemon configuration documentation](../daemon/config/). -- Run your own [registry](../registry/README.md#run-your-own-registry). +- See all the `netdata.conf` options in our [daemon configuration documentation](/daemon/config/). +- Run your own [registry](/registry/README.md#run-your-own-registry). + +## Change how long Netdata stores metrics + +Netdata can store long-term, historical metrics out of the box. A custom database uses RAM to store recent metrics, +ensuring dashboards and API queries are extremely responsive, while "spilling" historical metrics to disk. This +configuration keeps RAM usage low while allowing for long-term, on-disk metrics storage. + +You can tweak this custom _database engine_ to store a much larger dataset than your system's available RAM, +particularly if you allow Netdata to use slightly more RAM and disk space than the default configuration. + +Read our guide on [changing how long Netdata stores metrics](/docs/store/change-metrics-storage.md) to learn more and +use our the embedded database engine to figure out the exact settings you'll need to store historical metrics right in +the Agent's database. + +**What's next?**: + +- Learn more about the [memory requirements for the database + engine](/database/engine/README.md#memory-requirements) to understand how much RAM/disk space you should commit + to storing historical metrics. ## Collect data from more sources @@ -57,16 +86,16 @@ Netdata](#start-stop-and-restart-netdata). However, auto-detection only works if you installed the source using its standard installation procedure. If Netdata isn't collecting metrics after a restart, your source probably isn't configured correctly. Look at the [external plugin -documentation](../collectors/plugins.d/) to find the appropriate module for your source. Those pages will contain more -information about how to configure your source for auto-detection. +documentation](/collectors/plugins.d/) to find the appropriate module for your source. Those pages will contain +more information about how to configure your source for auto-detection. Some modules, like `chrony`, are disabled by default and must be enabled manually for auto-detection to work. Once Netdata detects a valid source of data, it will continue trying to collect data from it. For example, if Netdata is collecting data from an Nginx web server, and you shut Nginx down, Netdata will collect new data as soon as -you start the web server back up—no restart necessary. +you start the web server back up—no restart necessary. -### Configuring plugins +### Configure plugins Even if Netdata auto-detects your service/application, you might want to configure what, or how often, Netdata is collecting data. @@ -124,12 +153,12 @@ changes based on your particular Nginx setup. **What's next?**: -- Look at the [full list of data collection modules](Add-more-charts-to-netdata.md#available-data-collection-modules) +- Look at the [full list of data collection modules](/collectors/COLLECTORS.md) to configure your sources for auto-detection and monitoring. -- Improve the [performance](Performance.md) of Netdata on low-memory systems. +- Improve the [performance](/docs/guides/configure/performance.md) of Netdata on low-memory systems. - Configure `systemd` to expose [systemd services - utilization](../collectors/cgroups.plugin/README.md#monitoring-systemd-services) metrics automatically. -- [Reconfigure individual charts](../daemon/config/README.md#per-chart-configuration) in `netdata.conf`. + utilization](/collectors/cgroups.plugin/README.md#monitoring-systemd-services) metrics automatically. +- [Reconfigure individual charts](/daemon/config/README.md#per-chart-configuration) in `netdata.conf`. ## Health monitoring and alarms @@ -144,7 +173,7 @@ Edit your `/etc/netdata/netdata.conf` file and set the following: ``` If you want to keep health monitoring enabled, but turn email notifications off, edit your `health_alarm_notify.conf` -file with `edit-config`, or with your the text editor of your choice: +file with `edit-config`, or with the text editor of your choice: ```bash sudo /etc/netdata/edit-config health_alarm_notify.conf @@ -154,51 +183,28 @@ Find the `SEND_EMAIL="YES"` line and change it to `SEND_EMAIL="NO"`. **What's next?**: -- Write your own health alarm using the [examples](../health/README.md#examples). -- Add a new notification method, like [Slack](../health/notifications/slack/). - -## Change how long Netdata stores metrics - -By default, Netdata uses a custom database which uses both RAM and the disk to store metrics. Recent metrics are stored -in the system's RAM to keep access fast, while historical metrics are "spilled" to disk to keep RAM usage low. - -This custom database, which we call the _database engine_, allows you to store a much larger dataset than your system's -available RAM. - -If you're not sure whether you're using the database engine, or want to tweak the default settings to store even more -historical metrics, check out our tutorial: [**Changing how long Netdata stores -metrics**](../docs/tutorials/longer-metrics-storage.md). - -**What's next?**: - -- Learn more about the [memory requirements for the database engine](../database/engine/README.md#memory-requirements) - to understand how much RAM/disk space you should commit to storing historical metrics. -- Read up on the memory requirements of the [round-robin database](../database/), or figure out whether your system - has KSM enabled, which can [reduce the default database's memory usage](../database/README.md#ksm) by about 60%. - -## Monitoring multiple systems with Netdata - -If you have Netdata installed on multiple systems, you can have them all appear in the **My nodes** menu at the top-left -corner of the dashboard. +- Follow the [health quickstart](/health/QUICKSTART.md) to locate and edit existing health entities, and then + create your own. +- See all the alarm options via the [health configuration reference](/health/REFERENCE.md). +- Add a new notification method, like [Slack](/health/notifications/slack/). -To show all your servers in that menu, you need to [register for or sign in](../docs/netdata-cloud/signing-in.md) to -[Netdata Cloud](../docs/netdata-cloud/) from each system. Each system will then appear in the **My nodes** menu, which -you can use to navigate between your systems quickly. +## Monitor multiple systems with Netdata Cloud - +If you have the Agent installed on multiple nodes, you can use Netdata Cloud in two ways: Monitor the health and +performance of an entire infrastructure via the Netdata Cloud web application, or use the Visited Nodes menu that's +built into every dashboard. -Whenever you pan, zoom, highlight, select, or pause a chart, Netdata will synchronize those settings with any other -agent you visit via the My nodes menu. Even your scroll position is synchronized, so you'll see the same charts and -respective data for easy comparisons or root cause analysis. +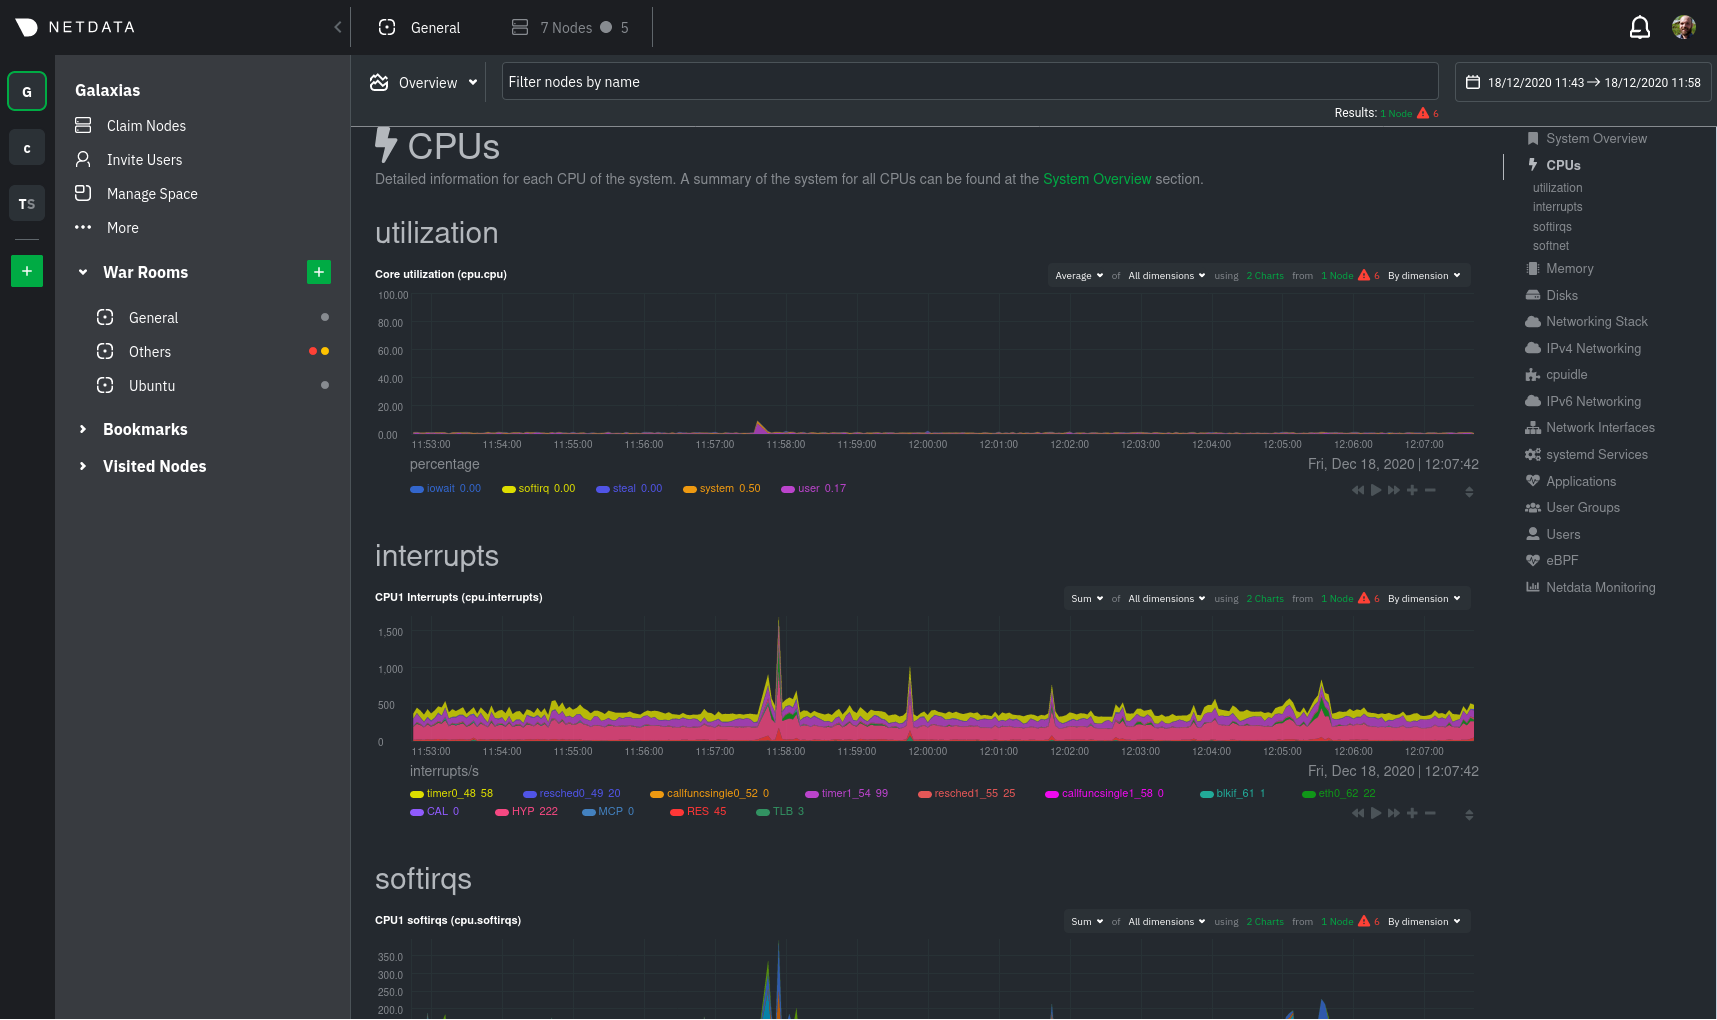 -You can now seamlessly track performance anomalies across your entire infrastructure! +You can use these features together or separately—the decision is up to you and the needs of your infrastructure. **What's next?**: -- Read up on how the [Netdata Cloud registry works](../registry/), and what kind of data it stores and sends to your - web browser. -- Familiarize yourself with the [Nodes View](../docs/netdata-cloud/nodes-view.md) +- Sign up for [Netdata Cloud](https://app.netdata.cloud). +- Read the [infrastructure monitoring quickstart](/docs/quickstart/infrastructure.md). +- Better understand how the Netdata Agent connects securely to Netdata Cloud with [claiming](/claim/README.md) and + [Agent-Cloud link](/aclk/README.md) documentation. ## Start, stop, and restart Netdata @@ -219,15 +225,16 @@ and `init.d`: ## What's next? Even after you've configured `netdata.conf`, tweaked alarms, learned the basics of performance troubleshooting, and -added all your systems to the **My nodes** menu, you've just gotten started with Netdata. +claimed all your systems in Netdata Cloud or added them to the Visited nodes menu, you've just gotten started with +Netdata. Take a look at some more advanced features and configurations: -- Centralize Netdata metrics from many systems with [streaming](../streaming) -- Enable long-term archiving of Netdata metrics via [backends](../backends) to time-series databases. -- Improve security by putting Netdata behind an [Nginx proxy with SSL](Running-behind-nginx.md). +- Centralize Netdata metrics from many systems with [streaming](/streaming/README.md) +- Enable long-term archiving of Netdata metrics via [exporting engine](/exporting/README.md) to time-series databases. +- Improve security by putting Netdata behind an [Nginx proxy with SSL](/docs/Running-behind-nginx.md). -Or, learn more about how you can contribute to [Netdata core](../CONTRIBUTING.md) or our -[documentation](../docs/contributing/contributing-documentation.md)! +Or, learn more about how you can contribute to [Netdata core](/CONTRIBUTING.md) or our +[documentation](/docs/contributing/contributing-documentation.md)! [](<>) |