
diff options
Diffstat (limited to 'docs/guides/monitor/dimension-templates.md')
| -rw-r--r-- | docs/guides/monitor/dimension-templates.md | 176 |
1 files changed, 176 insertions, 0 deletions
diff --git a/docs/guides/monitor/dimension-templates.md b/docs/guides/monitor/dimension-templates.md new file mode 100644 index 000000000..da1faed8b --- /dev/null +++ b/docs/guides/monitor/dimension-templates.md @@ -0,0 +1,176 @@ +<!-- +title: "Use dimension templates to create dynamic alarms" +custom_edit_url: https://github.com/netdata/netdata/edit/master/docs/monitor/health/dimension-templates.md +--> + +# Use dimension templates to create dynamic alarms + +Your ability to monitor the health of your systems and applications relies on your ability to create and maintain +the best set of alarms for your particular needs. + +In v1.18 of Netdata, we introduced **dimension templates** for alarms, which simplifies the process of writing [alarm +entities](/health/REFERENCE.md#health-entity-reference) for charts with many dimensions. + +Dimension templates can condense many individual entities into one—no more copy-pasting one entity and changing the +`alarm`/`template` and `lookup` lines for each dimension you'd like to monitor. + +They are, however, an advanced health monitoring feature. For more basic instructions on creating your first alarm, +check out our [health monitoring documentation](/health/README.md), which also includes +[examples](/health/REFERENCE.md#example-alarms). + +## The fundamentals of `foreach` + +Our dimension templates update creates a new `foreach` parameter to the existing [`lookup` +line](/health/REFERENCE.md#alarm-line-lookup). This is where the magic happens. + +You use the `foreach` parameter to specify which dimensions you want to monitor with this single alarm. You can separate +them with a comma (`,`) or a pipe (`|`). You can also use a [Netdata simple pattern](/libnetdata/simple_pattern/README.md) +to create many alarms with a regex-like syntax. + +The `foreach` parameter _has_ to be the last parameter in your `lookup` line, and if you have both `of` and `foreach` in +the same `lookup` line, Netdata will ignore the `of` parameter and use `foreach` instead. + +Let's get into some examples so you can see how the new parameter works. + +> ⚠️ The following entities are examples to showcase the functionality and syntax of dimension templates. They are not +> meant to be run as-is on production systems. + +## Condensing entities with `foreach` + +Let's say you want to monitor the `system`, `user`, and `nice` dimensions in your system's overall CPU utilization. +Before dimension templates, you would need the following three entities: + +```yaml + alarm: cpu_system + on: system.cpu +lookup: average -10m percentage of system + every: 1m + warn: $this > 50 + crit: $this > 80 + + alarm: cpu_user + on: system.cpu +lookup: average -10m percentage of user + every: 1m + warn: $this > 50 + crit: $this > 80 + + alarm: cpu_nice + on: system.cpu +lookup: average -10m percentage of nice + every: 1m + warn: $this > 50 + crit: $this > 80 +``` + +With dimension templates, you can condense these into a single alarm. Take note of the `alarm` and `lookup` lines. + +```yaml + alarm: cpu_template + on: system.cpu +lookup: average -10m percentage foreach system,user,nice + every: 1m + warn: $this > 50 + crit: $this > 80 +``` + +The `alarm` line specifies the naming scheme Netdata will use. You can use whatever naming scheme you'd like, with `.` +and `_` being the only allowed symbols. + +The `lookup` line has changed from `of` to `foreach`, and we're now passing three dimensions. + +In this example, Netdata will create three alarms with the names `cpu_template_system`, `cpu_template_user`, and +`cpu_template_nice`. Every minute, each alarm will use the same database query to calculate the average CPU usage for +the `system`, `user`, and `nice` dimensions over the last 10 minutes and send out alarms if necessary. + +You can find these three alarms active by clicking on the **Alarms** button in the top navigation, and then clicking on +the **All** tab and scrolling to the **system - cpu** collapsible section. + +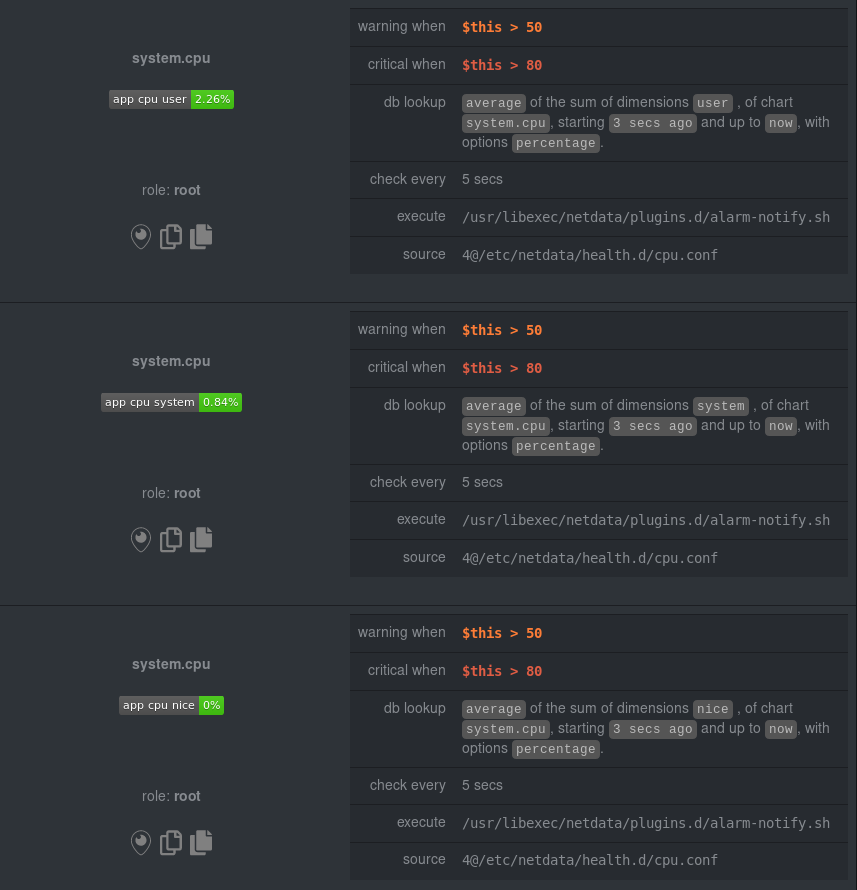 + +Let's look at some other examples of how `foreach` works so you can best apply it in your configurations. + +### Using a Netdata simple pattern in `foreach` + +In the last example, we used `foreach system,user,nice` to create three distinct alarms using dimension templates. But +what if you want to quickly create alarms for _all_ the dimensions of a given chart? + +Use a [simple pattern](/libnetdata/simple_pattern/README.md)! One example of a simple pattern is a single wildcard +(`*`). + +Instead of monitoring system CPU usage, let's monitor per-application CPU usage using the `apps.cpu` chart. Passing a +wildcard as the simple pattern tells Netdata to create a separate alarm for _every_ process on your system: + +```yaml + alarm: app_cpu + on: apps.cpu +lookup: average -10m percentage foreach * + every: 1m + warn: $this > 50 + crit: $this > 80 +``` + +This entity will now create alarms for every dimension in the `apps.cpu` chart. Given that most `apps.cpu` charts have +10 or more dimensions, using the wildcard ensures you catch every CPU-hogging process. + +To learn more about how to use simple patterns with dimension templates, see our [simple patterns +documentation](/libnetdata/simple_pattern/README.md). + +## Using `foreach` with alarm templates + +Dimension templates also work with [alarm templates](/health/REFERENCE.md#alarm-line-alarm-or-template). Alarm +templates help you create alarms for all the charts with a given context—for example, all the cores of your system's +CPU. + +By combining the two, you can create dozens of individual alarms with a single template entity. Here's how you would +create alarms for the `system`, `user`, and `nice` dimensions for every chart in the `cpu.cpu` context—or, in other +words, every CPU core. + +```yaml +template: cpu_template + on: cpu.cpu + lookup: average -10m percentage foreach system,user,nice + every: 1m + warn: $this > 50 + crit: $this > 80 +``` + +On a system with a 6-core, 12-thread Ryzen 5 1600 CPU, this one entity creates alarms on the following charts and +dimensions: + +- `cpu.cpu0` + - `cpu_template_user` + - `cpu_template_system` + - `cpu_template_nice` +- `cpu.cpu1` + - `cpu_template_user` + - `cpu_template_system` + - `cpu_template_nice` +- `cpu.cpu2` + - `cpu_template_user` + - `cpu_template_system` + - `cpu_template_nice` +- ... +- `cpu.cpu11` + - `cpu_template_user` + - `cpu_template_system` + - `cpu_template_nice` + +And how just a few of those dimension template-generated alarms look like in the Netdata dashboard. + +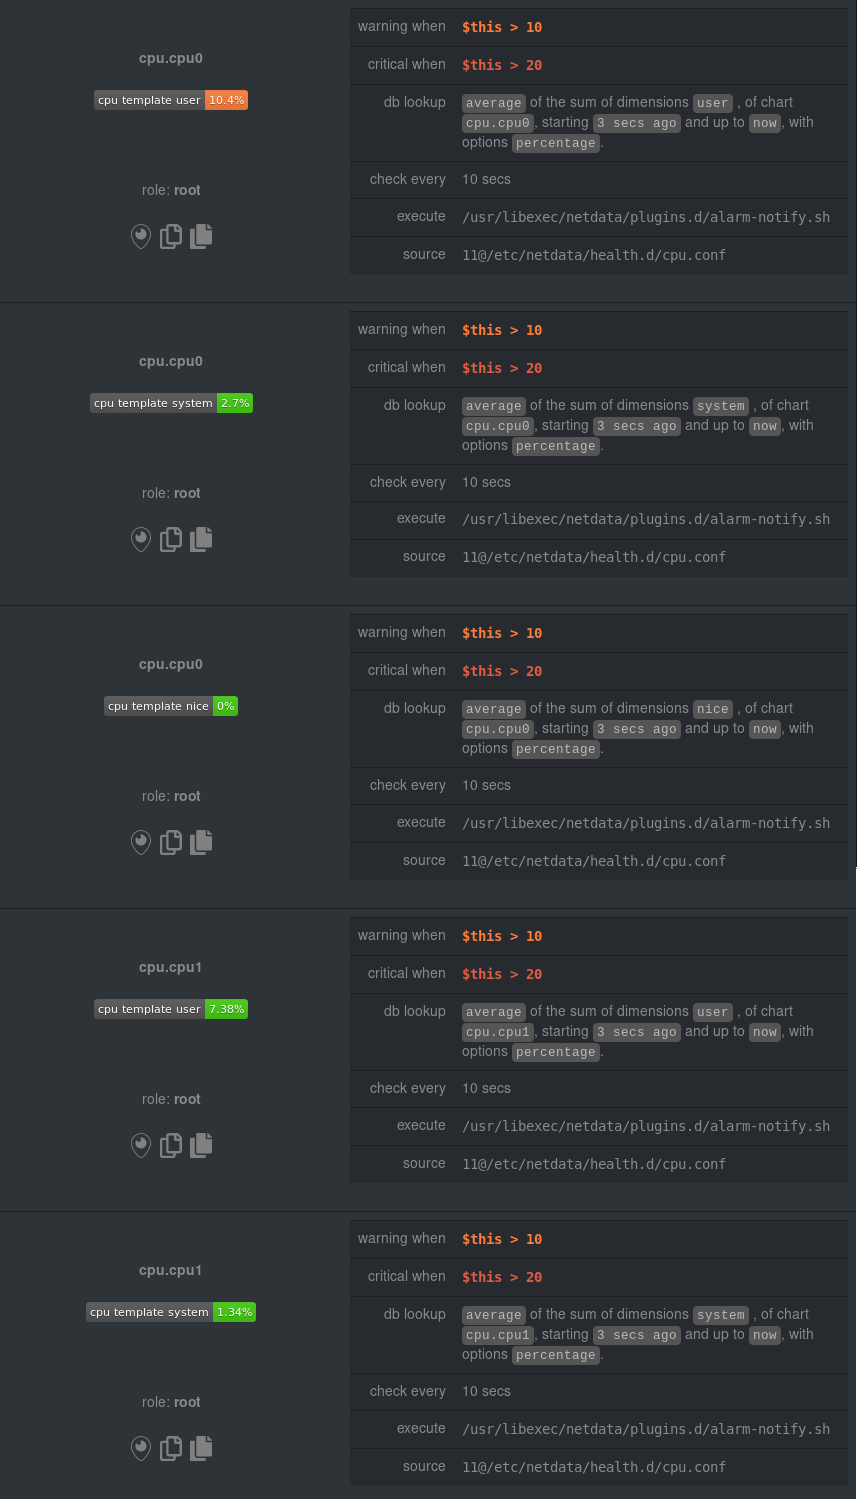 + +All in all, this single entity creates 36 individual alarms. Much easier than writing 36 separate entities in your +health configuration files! + +## What's next? + +We hope you're excited about the possibilities of using dimension templates! Maybe they'll inspire you to build new +alarms that will help you better monitor the health of your systems. + +Or, at the very least, simplify your configuration files. + +For information about other advanced features in Netdata's health monitoring toolkit, check out our [health +documentation](/health/README.md). And if you have some cool alarms you built using dimension templates, + +[](<>) |