
diff options
Diffstat (limited to 'docs/guides/monitor/pi-hole-raspberry-pi.md')
| -rw-r--r-- | docs/guides/monitor/pi-hole-raspberry-pi.md | 163 |
1 files changed, 163 insertions, 0 deletions
diff --git a/docs/guides/monitor/pi-hole-raspberry-pi.md b/docs/guides/monitor/pi-hole-raspberry-pi.md new file mode 100644 index 000000000..a180466fb --- /dev/null +++ b/docs/guides/monitor/pi-hole-raspberry-pi.md @@ -0,0 +1,163 @@ +<!-- +title: "Monitor Pi-hole (and a Raspberry Pi) with Netdata" +description: "Monitor Pi-hole metrics, plus Raspberry Pi system metrics, in minutes and completely for free with Netdata's open-source monitoring agent." +image: /img/seo/guides/monitor/netdata-pi-hole-raspberry-pi.png +custom_edit_url: https://github.com/netdata/netdata/edit/master/docs/guides/monitor/pi-hole-raspberry-pi.md +--> + +# Monitor Pi-hole (and a Raspberry Pi) with Netdata + +Between intrusive ads, invasive trackers, and vicious malware, many techies and homelab enthusiasts are advancing their +networks' security and speed with a tiny computer and a powerful piece of software: [Pi-hole](https://pi-hole.net/). + +Pi-hole is a DNS sinkhole that prevents unwanted content from even reaching devices on your home network. It blocks ads +and malware at the network, instead of using extensions/add-ons for individual browsers, so you'll stop seeing ads in +some of the most intrusive places, like your smart TV. Pi-hole can even [improve your network's speed and reduce +bandwidth](https://discourse.pi-hole.net/t/will-pi-hole-slow-down-my-network/2048). + +Most Pi-hole users run it on a [Raspberry Pi](https://www.raspberrypi.org/products/raspberry-pi-4-model-b/) (hence the +name), a credit card-sized, super-capable computer that costs about $35. + +And to keep tabs on how both Pi-hole and the Raspberry Pi are working to protect your network, you can use the +open-source [Netdata monitoring agent](https://github.com/netdata/netdata). + +To get started, all you need is a [Raspberry Pi](https://www.raspberrypi.org/products/raspberry-pi-4-model-b/) with +Raspbian installed. This guide uses a Raspberry Pi 4 Model B and Raspbian GNU/Linux 10 (buster). This guide assumes +you're connecting to a Raspberry Pi remotely over SSH, but you could also complete all these steps on the system +directly using a keyboard, mouse, and monitor. + +## Why monitor Pi-hole and a Raspberry Pi with Netdata? + +Netdata helps you monitor and troubleshoot all kinds of devices and the applications they run, including IoT devices +like the Raspberry Pi and applications like Pi-hole. + +After a two-minute installation and with zero configuration, you'll be able to see all of Pi-hole's metrics, including +the volume of queries, connected clients, DNS queries per type, top clients, top blocked domains, and more. + +With Netdata installed, you can also monitor system metrics and any other applications you might be running. By default, +Netdata collects metrics on CPU usage, disk IO, bandwidth, per-application resource usage, and a ton more. With the +Raspberry Pi used for this guide, Netdata automatically collects about 1,500 metrics every second! + +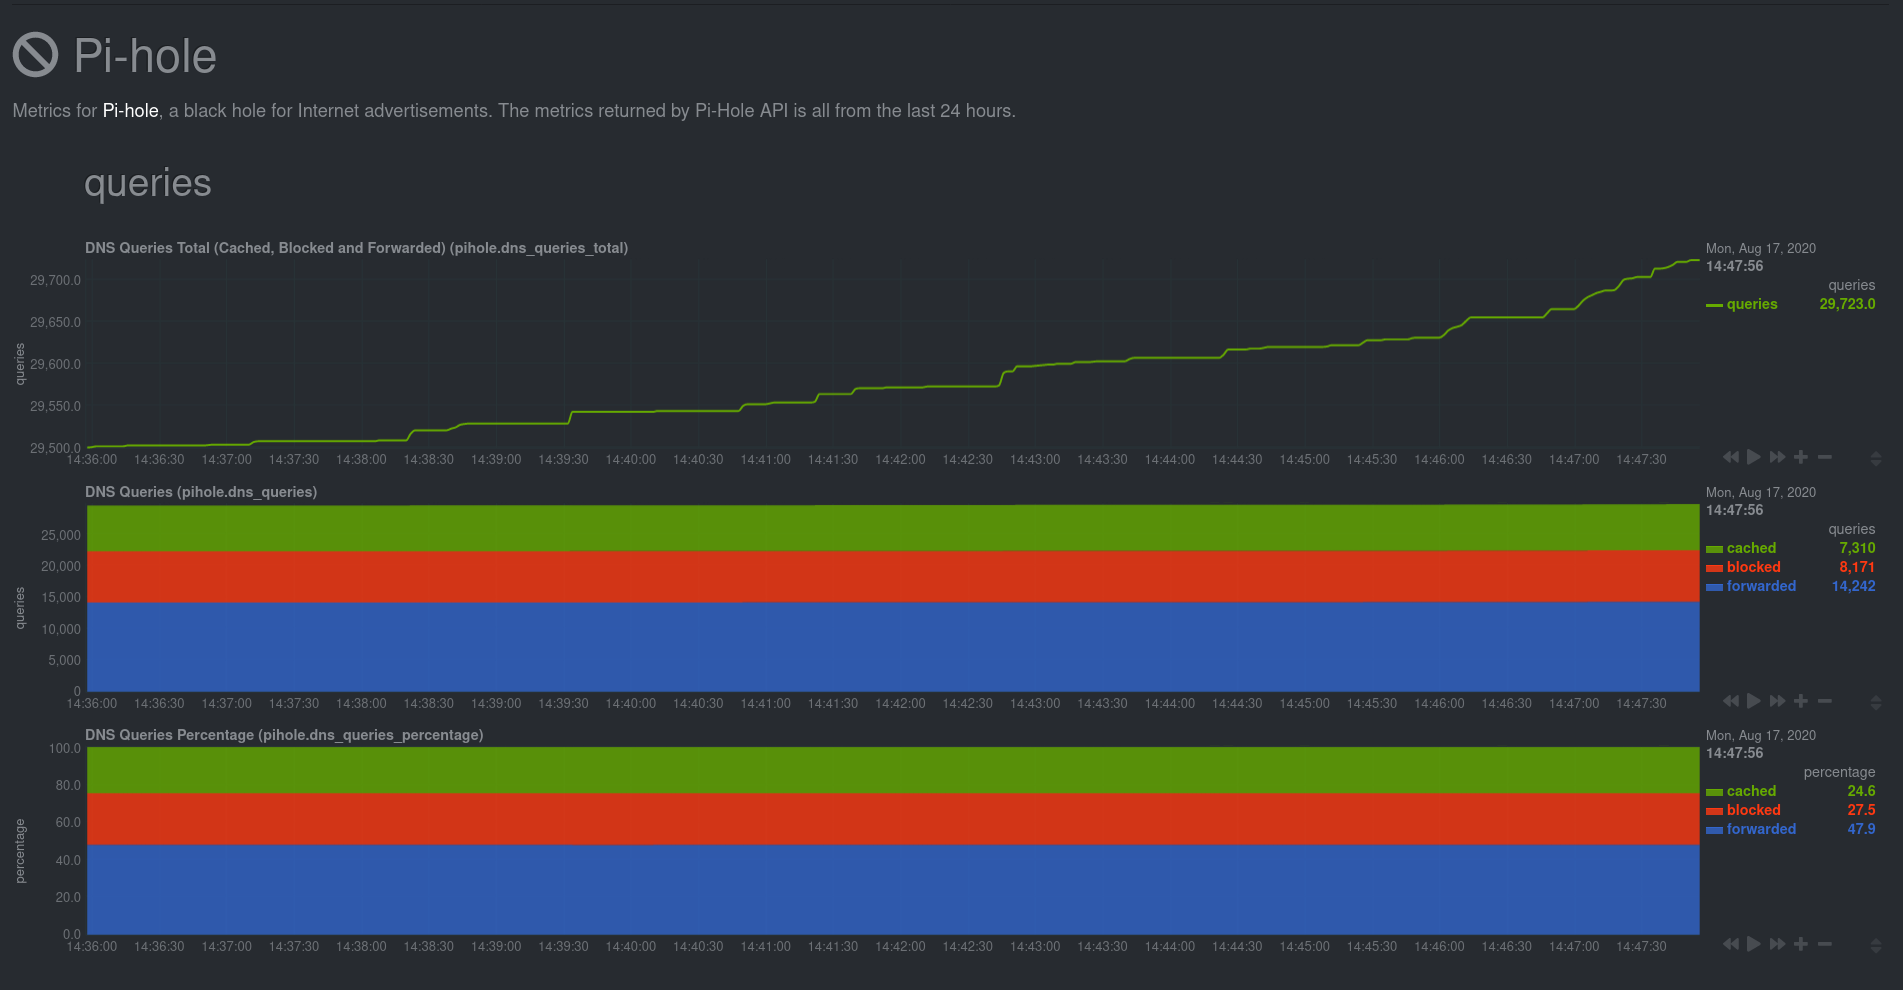 + +## Install Netdata + +Let's start by installing Netdata first so that it can start collecting system metrics as soon as possible for the most +possible historic data. + +> ⚠️ Don't install Netdata using `apt` and the default package available in Raspbian. The Netdata team does not maintain +> this package, and can't guarantee it works properly. + +On Raspberry Pis running Raspbian, the best way to install Netdata is our one-line kickstart script. This script asks +you to install dependencies, then compiles Netdata from source via [GitHub](https://github.com/netdata/netdata). + +```bash +bash <(curl -Ss https://my-netdata.io/kickstart.sh) +``` + +Once installed on a Raspberry Pi 4 with no accessories, Netdata starts collecting roughly 1,500 metrics every second and +populates its dashboard with more than 250 charts. + +Open your browser of choice and navigate to `http://NODE:19999/`, replacing `NODE` with the IP address of your Raspberry +Pi. Not sure what that IP is? Try running `hostname -I | awk '{print $1}'` from the Pi itself. + +You'll see Netdata's dashboard and a few hundred real-time, +[interactive](https://learn.netdata.cloud/guides/step-by-step/step-02#interact-with-charts) charts. Feel free to +explore, but let's turn our attention to installing Pi-hole. + +## Install Pi-Hole + +Like Netdata, Pi-hole has a one-line script for simple installation. From your Raspberry Pi, run the following: + +```bash +curl -sSL https://install.pi-hole.net | bash +``` + +The installer will help you set up Pi-hole based on the topology of your network. Once finished, you should set up your +devices—or your router for system-wide sinkhole protection—to [use Pi-hole as their DNS +service](https://discourse.pi-hole.net/t/how-do-i-configure-my-devices-to-use-pi-hole-as-their-dns-server/245). You've +finished setting up Pi-hole at this point. + +As far as configuring Netdata to monitor Pi-hole metrics, there's nothing you actually need to do. Netdata's [Pi-hole +collector](https://learn.netdata.cloud/docs/agent/collectors/go.d.plugin/modules/pihole) will autodetect the new service +running on your Raspberry Pi and immediately start collecting metrics every second. + +Restart Netdata with `sudo service netdata restart` to start Netdata, which will then recognize that Pi-hole is running +and start a per-second collection job. When you refresh your Netdata dashboard or load it up again in a new tab, you'll +see a new entry in the menu for **Pi-hole** metrics. + +## Use Netdata to explore and monitor your Raspberry Pi and Pi-hole + +By the time you've reached this point in the guide, Netdata has already collected a ton of valuable data about your +Raspberry Pi, Pi-hole, and any other apps/services you might be running. Even a few minutes of collecting 1,500 metrics +per second adds up quickly. + +You can now use Netdata's synchronized charts to zoom, highlight, scrub through time, and discern how an anomaly in one +part of your system might affect another. + + + +If you're completely new to Netdata, look at our [step-by-step guide](/docs/guides/step-by-step/step-00.md) for a +walkthrough of all its features. For a more expedited tour, see the [get started guide](/docs/getting-started.md). + +### Enable temperature sensor monitoring + +You need to manually enable Netdata's built-in [temperature sensor +collector](https://learn.netdata.cloud/docs/agent/collectors/charts.d.plugin/sensors) to start collecting metrics. + +> Netdata uses a few plugins to manage its [collectors](/collectors/REFERENCE.md), each using a different language: Go, +> Python, Node.js, and Bash. While our Go collectors are undergoing the most active development, we still support the +> other languages. In this case, you need to enable a temperature sensor collector that's written in Bash. + +First, open the `charts.d.conf` file for editing. You should always use the `edit-config` script to edit Netdata's +configuration files, as it ensures your settings persist across updates to the Netdata Agent. + +```bash +cd /etc/netdata +sudo ./edit-config charts.d.conf +``` + +Uncomment the `sensors=force` line and save the file. Restart Netdata with `sudo service netdata restart` to enable +Raspberry Pi temperature sensor monitoring. + +### Storing historical metrics on your Raspberry Pi + +By default, Netdata allocates 256 MiB in disk space to store historical metrics inside the [database +engine](/database/engine/README.md). On the Raspberry Pi used for this guide, Netdata collects 1,500 metrics every +second, which equates to storing 3.5 days worth of historical metrics. + +You can increase this allocation by editing `netdata.conf` and increasing the `dbengine multihost disk space` setting to +more than 256. + +```yaml +[global] + dbengine multihost disk space = 512 +``` + +Use our [database sizing +calculator](/docs/store/change-metrics-storage.md#calculate-the-system-resources-RAM-disk-space-needed-to-store-metrics) +and [guide on storing historical metrics](/docs/guides/longer-metrics-storage.md) to help you determine the right +setting for your Raspberry Pi. + +## What's next? + +Now that you're monitoring Pi-hole and your Raspberry Pi with Netdata, you can extend its capabilities even further, or +configure Netdata to more specific goals. + +Most importantly, you can always install additional services and instantly collect metrics from many of them with our +[300+ integrations](/collectors/COLLECTORS.md). + +- [Optimize performance](/docs/guides/configure/performance.md) using tweaks developed for IoT devices. +- [Stream Raspberry Pi metrics](/streaming/README.md) to a parent host for easy access or longer-term storage. +- [Tweak alarms](/health/QUICKSTART.md) for either Pi-hole or the health of your Raspberry Pi. +- [Export metrics to external databases](/exporting/README.md) with the exporting engine. + +Or, head over to [our guides](https://learn.netdata.cloud/guides/) for even more experiments and insights into +troubleshooting the health of your systems and services. + +If you have any questions about using Netdata to monitor your Raspberry Pi, Pi-hole, or any other applications, head on +over to our [community forum](https://community.netdata.cloud/). + +[](<>) |