
diff options
Diffstat (limited to '')
| -rw-r--r-- | docs/guides/monitor-cockroachdb.md | 8 | ||||
| -rw-r--r-- | docs/guides/monitor-hadoop-cluster.md | 10 | ||||
| -rw-r--r-- | docs/guides/monitor/anomaly-detection.md | 20 | ||||
| -rw-r--r-- | docs/guides/monitor/kubernetes-k8s-netdata.md | 16 | ||||
| -rw-r--r-- | docs/guides/monitor/lamp-stack.md | 28 | ||||
| -rw-r--r-- | docs/guides/monitor/pi-hole-raspberry-pi.md | 10 | ||||
| -rw-r--r-- | docs/guides/monitor/process.md | 12 | ||||
| -rw-r--r-- | docs/guides/monitor/raspberry-pi-anomaly-detection.md | 8 |
8 files changed, 56 insertions, 56 deletions
diff --git a/docs/guides/monitor-cockroachdb.md b/docs/guides/monitor-cockroachdb.md index d0db69ab5..9d4d3ea03 100644 --- a/docs/guides/monitor-cockroachdb.md +++ b/docs/guides/monitor-cockroachdb.md @@ -11,7 +11,7 @@ learn_rel_path: "Miscellaneous" [CockroachDB](https://github.com/cockroachdb/cockroach) is an open-source project that brings SQL databases into scalable, disaster-resilient cloud deployments. Thanks to -a [new CockroachDB collector](https://github.com/netdata/go.d.plugin/blob/master/modules/cockroachdb/README.md) +a [new CockroachDB collector](https://github.com/netdata/netdata/blob/master/src/go/collectors/go.d.plugin/modules/cockroachdb/README.md) released in [v1.20](https://blog.netdata.cloud/posts/release-1.20/), you can now monitor any number of CockroachDB databases with maximum granularity using Netdata. Collect more than 50 unique metrics and put them on interactive visualizations @@ -38,7 +38,7 @@ display them on the dashboard. If your CockroachDB instance is accessible through `http://localhost:8080/` or `http://127.0.0.1:8080`, your setup is complete. Restart Netdata with `sudo systemctl restart netdata`, or the [appropriate -method](https://github.com/netdata/netdata/blob/master/docs/configure/start-stop-restart.md) for your system, and refresh your browser. You should see CockroachDB +method](https://github.com/netdata/netdata/blob/master/packaging/installer/README.md#maintaining-a-netdata-agent-installation) for your system, and refresh your browser. You should see CockroachDB metrics in your Netdata dashboard! <figure> @@ -106,7 +106,7 @@ Netdata to see your new charts. This release also includes eight pre-configured alerts for live nodes, such as whether the node is live, storage capacity, issues with replication, and the number of SQL connections/statements. See [health.d/cockroachdb.conf on -GitHub](https://raw.githubusercontent.com/netdata/netdata/master/health/health.d/cockroachdb.conf) for details. +GitHub](https://raw.githubusercontent.com/netdata/netdata/master/src/health/health.d/cockroachdb.conf) for details. You can also edit these files directly with `edit-config`: @@ -115,4 +115,4 @@ cd /etc/netdata/ # Replace with your Netdata configuration directory, if not /et ./edit-config health.d/cockroachdb.conf # You may need to use `sudo` for write privileges ``` -For more information about editing the defaults or writing new alert entities, see our documentation on [configuring health alerts](https://github.com/netdata/netdata/blob/master/health/REFERENCE.md). +For more information about editing the defaults or writing new alert entities, see our documentation on [configuring health alerts](https://github.com/netdata/netdata/blob/master/src/health/REFERENCE.md). diff --git a/docs/guides/monitor-hadoop-cluster.md b/docs/guides/monitor-hadoop-cluster.md index 1ddac85ea..b536e0fa0 100644 --- a/docs/guides/monitor-hadoop-cluster.md +++ b/docs/guides/monitor-hadoop-cluster.md @@ -27,8 +27,8 @@ alternative, like the guide available from For more specifics on the collection modules used in this guide, read the respective pages in our documentation: -- [HDFS](https://github.com/netdata/go.d.plugin/blob/master/modules/hdfs/README.md) -- [Zookeeper](https://github.com/netdata/go.d.plugin/blob/master/modules/zookeeper/README.md) +- [HDFS](https://github.com/netdata/netdata/blob/master/src/go/collectors/go.d.plugin/modules/hdfs/README.md) +- [Zookeeper](https://github.com/netdata/netdata/blob/master/src/go/collectors/go.d.plugin/modules/zookeeper/README.md) ## Set up your HDFS and Zookeeper installations @@ -164,7 +164,7 @@ jobs: address : 203.0.113.10:2182 ``` -Finally, [restart Netdata](https://github.com/netdata/netdata/blob/master/docs/configure/start-stop-restart.md). +Finally, [restart Netdata](https://github.com/netdata/netdata/blob/master/packaging/installer/README.md#maintaining-a-netdata-agent-installation). ```sh sudo systemctl restart netdata @@ -178,7 +178,7 @@ showing real-time metrics for both in your Netdata dashboard. 🎉 The Netdata community helped us create sane defaults for alerts related to both HDFS and Zookeeper. You may want to investigate these to ensure they work well with your Hadoop implementation. -- [HDFS alerts](https://raw.githubusercontent.com/netdata/netdata/master/health/health.d/hdfs.conf) +- [HDFS alerts](https://raw.githubusercontent.com/netdata/netdata/master/src/health/health.d/hdfs.conf) You can also access/edit these files directly with `edit-config`: @@ -188,4 +188,4 @@ sudo /etc/netdata/edit-config health.d/zookeeper.conf ``` For more information about editing the defaults or writing new alert entities, see our -[health monitoring documentation](https://github.com/netdata/netdata/blob/master/health/README.md). +[health monitoring documentation](https://github.com/netdata/netdata/blob/master/src/health/README.md). diff --git a/docs/guides/monitor/anomaly-detection.md b/docs/guides/monitor/anomaly-detection.md index c0a00ef34..bc19a4f28 100644 --- a/docs/guides/monitor/anomaly-detection.md +++ b/docs/guides/monitor/anomaly-detection.md @@ -15,7 +15,7 @@ learn_rel_path: "Operations" As of [`v1.32.0`](https://github.com/netdata/netdata/releases/tag/v1.32.0), Netdata comes with some ML powered [anomaly detection](https://en.wikipedia.org/wiki/Anomaly_detection) capabilities built into it and available to use out of the box, with zero configuration required (ML was enabled by default in `v1.35.0-29-nightly` in [this PR](https://github.com/netdata/netdata/pull/13158), previously it required a one line config change). -This means that in addition to collecting raw value metrics, the Netdata agent will also produce an [`anomaly-bit`](https://github.com/netdata/netdata/blob/master/ml/README.md#anomaly-bit---100--anomalous-0--normal) every second which will be `100` when recent raw metric values are considered anomalous by Netdata and `0` when they look normal. Once we aggregate beyond one second intervals this aggregated `anomaly-bit` becomes an ["anomaly rate"](https://github.com/netdata/netdata/blob/master/ml/README.md#anomaly-rate---averageanomaly-bit). +This means that in addition to collecting raw value metrics, the Netdata agent will also produce an [`anomaly-bit`](https://github.com/netdata/netdata/blob/master/src/ml/README.md#anomaly-bit---100--anomalous-0--normal) every second which will be `100` when recent raw metric values are considered anomalous by Netdata and `0` when they look normal. Once we aggregate beyond one second intervals this aggregated `anomaly-bit` becomes an ["anomaly rate"](https://github.com/netdata/netdata/blob/master/src/ml/README.md#anomaly-rate---averageanomaly-bit). To be as concrete as possible, the below api call shows how to access the raw anomaly bit of the `system.cpu` chart from the [london.my-netdata.io](https://london.my-netdata.io) Netdata demo server. Passing `options=anomaly-bit` returns the anomaly bit instead of the raw metric value. @@ -23,19 +23,19 @@ To be as concrete as possible, the below api call shows how to access the raw an https://london.my-netdata.io/api/v1/data?chart=system.cpu&options=anomaly-bit ``` -If we aggregate the above to just 1 point by adding `points=1` we get an "[Anomaly Rate](https://github.com/netdata/netdata/blob/master/ml/README.md#anomaly-rate---averageanomaly-bit)": +If we aggregate the above to just 1 point by adding `points=1` we get an "[Anomaly Rate](https://github.com/netdata/netdata/blob/master/src/ml/README.md#anomaly-rate---averageanomaly-bit)": ``` https://london.my-netdata.io/api/v1/data?chart=system.cpu&options=anomaly-bit&points=1 ``` -The fundamentals of Netdata's anomaly detection approach and implementation are covered in lots more detail in the [agent ML documentation](https://github.com/netdata/netdata/blob/master/ml/README.md). +The fundamentals of Netdata's anomaly detection approach and implementation are covered in lots more detail in the [agent ML documentation](https://github.com/netdata/netdata/blob/master/src/ml/README.md). This guide will explain how to get started using these ML based anomaly detection capabilities within Netdata. ## Anomaly Advisor -The [Anomaly Advisor](https://github.com/netdata/netdata/blob/master/docs/cloud/insights/anomaly-advisor.md) is the flagship anomaly detection feature within Netdata. In the "Anomalies" tab of Netdata you will see an overall "Anomaly Rate" chart that aggregates node level anomaly rate for all nodes in a space. The aim of this chart is to make it easy to quickly spot periods of time where the overall "[node anomaly rate](https://github.com/netdata/netdata/blob/master/ml/README.md#node-anomaly-rate)" is elevated in some unusual way and for what node or nodes this relates to. +The [Anomaly Advisor](https://github.com/netdata/netdata/blob/master/docs/cloud/insights/anomaly-advisor.md) is the flagship anomaly detection feature within Netdata. In the "Anomalies" tab of Netdata you will see an overall "Anomaly Rate" chart that aggregates node level anomaly rate for all nodes in a space. The aim of this chart is to make it easy to quickly spot periods of time where the overall "[node anomaly rate](https://github.com/netdata/netdata/blob/master/src/ml/README.md#node-anomaly-rate)" is elevated in some unusual way and for what node or nodes this relates to. 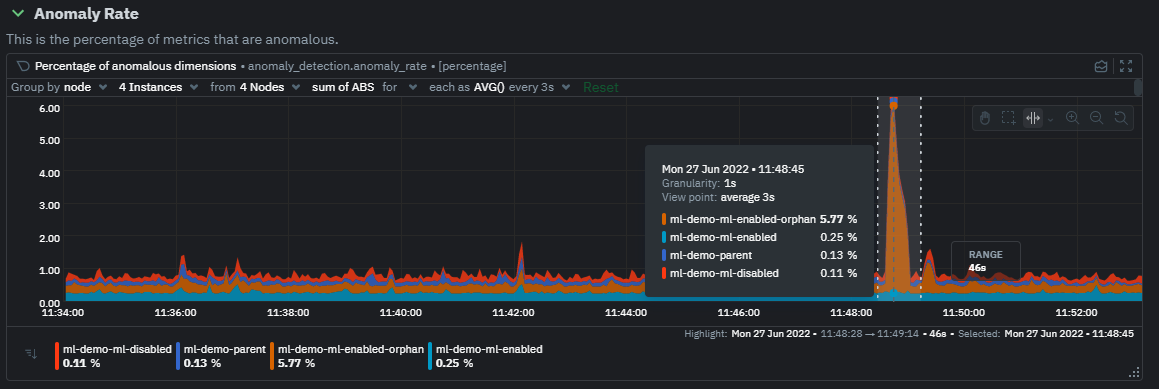 @@ -53,20 +53,20 @@ Pressing the anomalies icon (next to the information icon in the chart header) w ## Anomaly Rate Based Alerts -It is possible to use the `anomaly-bit` when defining traditional Alerts within netdata. The `anomaly-bit` is just another `options` parameter that can be passed as part of an [alert line lookup](https://github.com/netdata/netdata/blob/master/docs/configure/start-stop-restart.md#alert-line-lookup). +It is possible to use the `anomaly-bit` when defining traditional Alerts within netdata. The `anomaly-bit` is just another `options` parameter that can be passed as part of an alert line lookup. You can see some example ML based alert configurations below: -- [Anomaly rate based CPU dimensions alert](https://github.com/netdata/netdata/blob/master/health/REFERENCE.md#example-8---anomaly-rate-based-cpu-dimensions-alert) -- [Anomaly rate based CPU chart alert](https://github.com/netdata/netdata/blob/master/health/REFERENCE.md#example-9---anomaly-rate-based-cpu-chart-alert) -- [Anomaly rate based node level alert](https://github.com/netdata/netdata/blob/master/health/REFERENCE.md#example-10---anomaly-rate-based-node-level-alert) -- More examples in the [`/health/health.d/ml.conf`](https://github.com/netdata/netdata/blob/master/health/health.d/ml.conf) file that ships with the agent. +- [Anomaly rate based CPU dimensions alert](https://github.com/netdata/netdata/blob/master/src/health/REFERENCE.md#example-8---anomaly-rate-based-cpu-dimensions-alert) +- [Anomaly rate based CPU chart alert](https://github.com/netdata/netdata/blob/master/src/health/REFERENCE.md#example-9---anomaly-rate-based-cpu-chart-alert) +- [Anomaly rate based node level alert](https://github.com/netdata/netdata/blob/master/src/health/REFERENCE.md#example-10---anomaly-rate-based-node-level-alert) +- More examples in the [`/health/health.d/ml.conf`](https://github.com/netdata/netdata/blob/master/src/health/health.d/ml.conf) file that ships with the agent. ## Learn More Check out the resources below to learn more about how Netdata is approaching ML: -- [Agent ML documentation](https://github.com/netdata/netdata/blob/master/ml/README.md). +- [Agent ML documentation](https://github.com/netdata/netdata/blob/master/src/ml/README.md). - [Anomaly Advisor documentation](https://github.com/netdata/netdata/blob/master/docs/cloud/insights/anomaly-advisor.md). - [Metric Correlations documentation](https://github.com/netdata/netdata/blob/master/docs/cloud/insights/metric-correlations.md). - Anomaly Advisor [launch blog post](https://www.netdata.cloud/blog/introducing-anomaly-advisor-unsupervised-anomaly-detection-in-netdata/). diff --git a/docs/guides/monitor/kubernetes-k8s-netdata.md b/docs/guides/monitor/kubernetes-k8s-netdata.md index 96d79935b..982c35e79 100644 --- a/docs/guides/monitor/kubernetes-k8s-netdata.md +++ b/docs/guides/monitor/kubernetes-k8s-netdata.md @@ -146,7 +146,7 @@ Let's explore the most colorful box by hovering over it. container](https://user-images.githubusercontent.com/1153921/109049544-a8417980-7695-11eb-80a7-109b4a645a27.png) The **Context** tab shows `rabbitmq-5bb66bb6c9-6xr5b` as the container's image name, which means this container is -running a [RabbitMQ](https://github.com/netdata/go.d.plugin/blob/master/modules/rabbitmq/README.md) workload. +running a [RabbitMQ](https://github.com/netdata/netdata/blob/master/src/go/collectors/go.d.plugin/modules/rabbitmq/README.md) workload. Click the **Metrics** tab to see real-time metrics from that container. Unsurprisingly, it shows a spike in CPU utilization at regular intervals. @@ -175,13 +175,13 @@ for complete customization. For example, grouping the top chart by `k8s_containe Netdata has a [service discovery plugin](https://github.com/netdata/agent-service-discovery), which discovers and creates configuration files for [compatible services](https://github.com/netdata/helmchart#service-discovery-and-supported-services) and any endpoints covered by -our [generic Prometheus collector](https://github.com/netdata/go.d.plugin/blob/master/modules/prometheus/README.md). +our [generic Prometheus collector](https://github.com/netdata/netdata/blob/master/src/go/collectors/go.d.plugin/modules/prometheus/README.md). Netdata uses these files to collect metrics from any compatible application as they run _inside_ of a pod. Service discovery happens without manual intervention as pods are created, destroyed, or moved between nodes. Service metrics show up on the Overview as well, beneath the **Kubernetes** section, and are labeled according to the service in question. For example, the **RabbitMQ** section has numerous charts from the [`rabbitmq` -collector](https://github.com/netdata/go.d.plugin/blob/master/modules/rabbitmq/README.md): +collector](https://github.com/netdata/netdata/blob/master/src/go/collectors/go.d.plugin/modules/rabbitmq/README.md):  @@ -202,7 +202,7 @@ Netdata also automatically collects metrics from two essential Kubernetes proces The **k8s kubelet** section visualizes metrics from the Kubernetes agent responsible for managing every pod on a given node. This also happens without any configuration thanks to the [kubelet -collector](https://github.com/netdata/go.d.plugin/blob/master/modules/k8s_kubelet/README.md). +collector](https://github.com/netdata/netdata/blob/master/src/go/collectors/go.d.plugin/modules/k8s_kubelet/README.md). Monitoring each node's kubelet can be invaluable when diagnosing issues with your Kubernetes cluster. For example, you can see if the number of running containers/pods has dropped, which could signal a fault or crash in a particular @@ -218,7 +218,7 @@ configuration-related errors, and the actual vs. desired numbers of volumes, plu The **k8s kube-proxy** section displays metrics about the network proxy that runs on each node in your Kubernetes cluster. kube-proxy lets pods communicate with each other and accept sessions from outside your cluster. Its metrics are collected by the [kube-proxy -collector](https://github.com/netdata/go.d.plugin/blob/master/modules/k8s_kubeproxy/README.md). +collector](https://github.com/netdata/netdata/blob/master/src/go/collectors/go.d.plugin/modules/k8s_kubeproxy/README.md). With Netdata, you can monitor how often your k8s proxies are syncing proxy rules between nodes. Dramatic changes in these figures could indicate an anomaly in your cluster that's worthy of further investigation. @@ -238,9 +238,9 @@ clusters of all sizes. - [Netdata Helm chart](https://github.com/netdata/helmchart) - [Netdata service discovery](https://github.com/netdata/agent-service-discovery) - [Netdata Agent · `kubelet` - collector](https://github.com/netdata/go.d.plugin/blob/master/modules/k8s_kubelet/README.md) + collector](https://github.com/netdata/netdata/blob/master/src/go/collectors/go.d.plugin/modules/k8s_kubelet/README.md) - [Netdata Agent · `kube-proxy` - collector](https://github.com/netdata/go.d.plugin/blob/master/modules/k8s_kubeproxy/README.md) -- [Netdata Agent · `cgroups.plugin`](https://github.com/netdata/netdata/blob/master/collectors/cgroups.plugin/README.md) + collector](https://github.com/netdata/netdata/blob/master/src/go/collectors/go.d.plugin/modules/k8s_kubeproxy/README.md) +- [Netdata Agent · `cgroups.plugin`](https://github.com/netdata/netdata/blob/master/src/collectors/cgroups.plugin/README.md) diff --git a/docs/guides/monitor/lamp-stack.md b/docs/guides/monitor/lamp-stack.md index 2289c71c9..cc649dba9 100644 --- a/docs/guides/monitor/lamp-stack.md +++ b/docs/guides/monitor/lamp-stack.md @@ -64,12 +64,12 @@ replacing `NODE` with the hostname or IP address of your system. There's nothing you need to do to enable [system monitoring](https://github.com/netdata/netdata/blob/master/docs/collect/system-metrics.md) and Linux monitoring with the Netdata Agent, which autodetects metrics from CPUs, memory, disks, networking devices, and Linux processes like systemd without any configuration. If you're using containers, Netdata automatically collects resource utilization -metrics from each using the [cgroups data collector](https://github.com/netdata/netdata/blob/master/collectors/cgroups.plugin/README.md). +metrics from each using the [cgroups data collector](https://github.com/netdata/netdata/blob/master/src/collectors/cgroups.plugin/README.md). ## Enable Apache monitoring Let's begin by configuring Apache to work with Netdata's [Apache data -collector](https://github.com/netdata/go.d.plugin/blob/master/modules/apache/README.md). +collector](https://github.com/netdata/netdata/blob/master/src/go/collectors/go.d.plugin/modules/apache/README.md). Actually, there's nothing for you to do to enable Apache monitoring with Netdata. @@ -80,7 +80,7 @@ metrics](https://httpd.apache.org/docs/2.4/mod/mod_status.html), which is just _ ## Enable web log monitoring The Netdata Agent also comes with a [web log -collector](https://github.com/netdata/go.d.plugin/blob/master/modules/weblog/README.md), which reads Apache's access +collector](https://github.com/netdata/netdata/blob/master/src/go/collectors/go.d.plugin/modules/weblog/README.md), which reads Apache's access log file, processes each line, and converts them into per-second metrics. On Debian systems, it reads the file at `/var/log/apache2/access.log`. @@ -93,7 +93,7 @@ monitoring. Because your MySQL database is password-protected, you do need to tell MySQL to allow the `netdata` user to connect to without a password. Netdata's [MySQL data -collector](https://github.com/netdata/go.d.plugin/blob/master/modules/mysql/README.md) collects metrics in _read-only_ +collector](https://github.com/netdata/netdata/blob/master/src/go/collectors/go.d.plugin/modules/mysql/README.md) collects metrics in _read-only_ mode, without being able to alter or affect operations in any way. First, log into the MySQL shell. Then, run the following three commands, one at a time: @@ -105,15 +105,15 @@ FLUSH PRIVILEGES; ``` Run `sudo systemctl restart netdata`, or the [appropriate alternative for your -system](https://github.com/netdata/netdata/blob/master/docs/configure/start-stop-restart.md), to collect dozens of metrics every second for robust MySQL monitoring. +system](https://github.com/netdata/netdata/blob/master/packaging/installer/README.md#maintaining-a-netdata-agent-installation), to collect dozens of metrics every second for robust MySQL monitoring. ## Enable PHP monitoring Unlike Apache or MySQL, PHP isn't a service that you can monitor directly, unless you instrument a PHP-based application -with [StatsD](https://github.com/netdata/netdata/blob/master/collectors/statsd.plugin/README.md). +with [StatsD](https://github.com/netdata/netdata/blob/master/src/collectors/statsd.plugin/README.md). However, if you use [PHP-FPM](https://php-fpm.org/) in your LAMP stack, you can monitor that process with our [PHP-FPM -data collector](https://github.com/netdata/go.d.plugin/blob/master/modules/phpfpm/README.md). +data collector](https://github.com/netdata/netdata/blob/master/src/go/collectors/go.d.plugin/modules/phpfpm/README.md). Open your PHP-FPM configuration for editing, replacing `7.4` with your version of PHP: @@ -159,7 +159,7 @@ If the Netdata Agent isn't already open in your browser, open a new tab and navi > If you [signed up](https://app.netdata.cloud/sign-up?cloudRoute=/spaces) for Netdata Cloud earlier, you can also view > the exact same LAMP stack metrics there, plus additional features, like drag-and-drop custom dashboards. Be sure to -> [connecting your node](https://github.com/netdata/netdata/blob/master/claim/README.md) to start streaming metrics to your browser through Netdata Cloud. +> [connecting your node](https://github.com/netdata/netdata/blob/master/src/claim/README.md) to start streaming metrics to your browser through Netdata Cloud. Netdata automatically organizes all metrics and charts onto a single page for easy navigation. Peek at gauges to see overall system performance, then scroll down to see more. Click-and-drag with your mouse to pan _all_ charts back and @@ -203,7 +203,7 @@ shows any alerts currently triggered, while the **All** tab displays a list of _  -[Tweak alerts](https://github.com/netdata/netdata/blob/master/health/REFERENCE.md) based on your infrastructure monitoring needs, and to see these alerts +[Tweak alerts](https://github.com/netdata/netdata/blob/master/src/health/REFERENCE.md) based on your infrastructure monitoring needs, and to see these alerts in other places, like your inbox or a Slack channel, [enable a notification method](https://github.com/netdata/netdata/blob/master/docs/monitor/enable-notifications.md). @@ -215,7 +215,7 @@ services. The per-second metrics granularity means you have the most accurate in any LAMP-related issues. Another powerful way to monitor the availability of a LAMP stack is the [`httpcheck` -collector](https://github.com/netdata/go.d.plugin/blob/master/modules/httpcheck/README.md), which pings a web server at +collector](https://github.com/netdata/netdata/blob/master/src/go/collectors/go.d.plugin/modules/httpcheck/README.md), which pings a web server at a regular interval and tells you whether if and how quickly it's responding. The `response_match` option also lets you monitor when the web server's response isn't what you expect it to be, which might happen if PHP-FPM crashes, for example. @@ -231,8 +231,8 @@ source of issues faster with [Metric Correlations](https://github.com/netdata/ne ### Related reference documentation - [Netdata Agent · Get started](https://github.com/netdata/netdata/blob/master/packaging/installer/README.md) -- [Netdata Agent · Apache data collector](https://github.com/netdata/go.d.plugin/blob/master/modules/apache/README.md) -- [Netdata Agent · Web log collector](https://github.com/netdata/go.d.plugin/blob/master/modules/weblog/README.md) -- [Netdata Agent · MySQL data collector](https://github.com/netdata/go.d.plugin/blob/master/modules/mysql/README.md) -- [Netdata Agent · PHP-FPM data collector](https://github.com/netdata/go.d.plugin/blob/master/modules/phpfpm/README.md) +- [Netdata Agent · Apache data collector](https://github.com/netdata/netdata/blob/master/src/go/collectors/go.d.plugin/modules/apache/README.md) +- [Netdata Agent · Web log collector](https://github.com/netdata/netdata/blob/master/src/go/collectors/go.d.plugin/modules/weblog/README.md) +- [Netdata Agent · MySQL data collector](https://github.com/netdata/netdata/blob/master/src/go/collectors/go.d.plugin/modules/mysql/README.md) +- [Netdata Agent · PHP-FPM data collector](https://github.com/netdata/netdata/blob/master/src/go/collectors/go.d.plugin/modules/phpfpm/README.md) diff --git a/docs/guides/monitor/pi-hole-raspberry-pi.md b/docs/guides/monitor/pi-hole-raspberry-pi.md index 4f0ff4cd6..1e76cc096 100644 --- a/docs/guides/monitor/pi-hole-raspberry-pi.md +++ b/docs/guides/monitor/pi-hole-raspberry-pi.md @@ -81,7 +81,7 @@ service](https://discourse.pi-hole.net/t/how-do-i-configure-my-devices-to-use-pi finished setting up Pi-hole at this point. As far as configuring Netdata to monitor Pi-hole metrics, there's nothing you actually need to do. Netdata's [Pi-hole -collector](https://github.com/netdata/go.d.plugin/blob/master/modules/pihole/README.md) will autodetect the new service +collector](https://github.com/netdata/netdata/blob/master/src/go/collectors/go.d.plugin/modules/pihole/README.md) will autodetect the new service running on your Raspberry Pi and immediately start collecting metrics every second. Restart Netdata with `sudo systemctl restart netdata`, which will then recognize that Pi-hole is running and start a @@ -105,9 +105,9 @@ If you're completely new to Netdata, look at the [Introduction](https://github.c ### Enable temperature sensor monitoring You need to manually enable Netdata's built-in [temperature sensor -collector](https://github.com/netdata/netdata/blob/master/collectors/charts.d.plugin/sensors/README.md) to start collecting metrics. +collector](https://github.com/netdata/netdata/blob/master/src/collectors/charts.d.plugin/sensors/README.md) to start collecting metrics. -> Netdata uses a few plugins to manage its [collectors](https://github.com/netdata/netdata/blob/master/collectors/REFERENCE.md), each using a different language: Go, +> Netdata uses a few plugins to manage its [collectors](https://github.com/netdata/netdata/blob/master/src/collectors/REFERENCE.md), each using a different language: Go, > Python, Node.js, and Bash. While our Go collectors are undergoing the most active development, we still support the > other languages. In this case, you need to enable a temperature sensor collector that's written in Bash. @@ -125,7 +125,7 @@ Raspberry Pi temperature sensor monitoring. ### Storing historical metrics on your Raspberry Pi By default, Netdata allocates 256 MiB in disk space to store historical metrics inside the [database -engine](https://github.com/netdata/netdata/blob/master/database/engine/README.md). On the Raspberry Pi used for this guide, Netdata collects 1,500 metrics every +engine](https://github.com/netdata/netdata/blob/master/src/database/engine/README.md). On the Raspberry Pi used for this guide, Netdata collects 1,500 metrics every second, which equates to storing 3.5 days worth of historical metrics. You can increase this allocation by editing `netdata.conf` and increasing the `dbengine multihost disk space` setting to @@ -138,5 +138,5 @@ more than 256. Use our [database sizing calculator](https://github.com/netdata/netdata/blob/master/docs/store/change-metrics-storage.md#calculate-the-system-resources-ram-disk-space-needed-to-store-metrics) -and the [Database configuration documentation](https://github.com/netdata/netdata/blob/master/database/README.md) to help you determine the right +and the [Database configuration documentation](https://github.com/netdata/netdata/blob/master/src/database/README.md) to help you determine the right setting for your Raspberry Pi. diff --git a/docs/guides/monitor/process.md b/docs/guides/monitor/process.md index 9aa6911f1..af36aefa1 100644 --- a/docs/guides/monitor/process.md +++ b/docs/guides/monitor/process.md @@ -46,7 +46,7 @@ With Netdata's process monitoring, you can: ## How does Netdata do process monitoring? The Netdata Agent already knows to look for hundreds -of [standard applications that we support via collectors](https://github.com/netdata/netdata/blob/master/collectors/COLLECTORS.md), +of [standard applications that we support via collectors](https://github.com/netdata/netdata/blob/master/src/collectors/COLLECTORS.md), and groups them based on their purpose. Let's say you want to monitor a MySQL database using its process. The Netdata Agent already knows to look for processes with the string `mysqld` in their @@ -55,12 +55,12 @@ process-specific charts. The process and groups settings are used by two unique and powerful collectors. -[**`apps.plugin`**](https://github.com/netdata/netdata/blob/master/collectors/apps.plugin/README.md) looks at the Linux +[**`apps.plugin`**](https://github.com/netdata/netdata/blob/master/src/collectors/apps.plugin/README.md) looks at the Linux process tree every second, much like `top` or `ps fax`, and collects resource utilization information on every running process. It then automatically adds a layer of meaningful visualization on top of these metrics, and creates per-process/application charts. -[**`ebpf.plugin`**](https://github.com/netdata/netdata/blob/master/collectors/ebpf.plugin/README.md): Netdata's extended +[**`ebpf.plugin`**](https://github.com/netdata/netdata/blob/master/src/collectors/ebpf.plugin/README.md): Netdata's extended Berkeley Packet Filter (eBPF) collector monitors Linux kernel-level metrics for file descriptors, virtual filesystem IO, and process management, and then hands process-specific metrics over to `apps.plugin` for visualization. The eBPF collector also collects and visualizes @@ -146,7 +146,7 @@ others, and groups them into `sql`. That makes sense, since all these processes sql: mysqld* mariad* postgres* postmaster* oracle_* ora_* sqlservr ``` -These groups are then reflected as [dimensions](https://github.com/netdata/netdata/blob/master/web/README.md#dimensions) +These groups are then reflected as [dimensions](https://github.com/netdata/netdata/blob/master/src/web/README.md#dimensions) within Netdata's charts.  for your system, to start collecting utilization metrics +the [appropriate method](https://github.com/netdata/netdata/blob/master/packaging/installer/README.md#maintaining-a-netdata-agent-installation) for your system, to start collecting utilization metrics from your application. Time to [visualize your process metrics](#visualize-process-metrics). ### Custom applications @@ -207,7 +207,7 @@ custom-app: custom-app ``` Restart Netdata with `sudo systemctl restart netdata`, or -the [appropriate method](https://github.com/netdata/netdata/blob/master/docs/configure/start-stop-restart.md) for your system, to start collecting utilization metrics +the [appropriate method](https://github.com/netdata/netdata/blob/master/packaging/installer/README.md#maintaining-a-netdata-agent-installation) for your system, to start collecting utilization metrics from your application. ## Visualize process metrics diff --git a/docs/guides/monitor/raspberry-pi-anomaly-detection.md b/docs/guides/monitor/raspberry-pi-anomaly-detection.md index 935d0f6cf..3c56ac79a 100644 --- a/docs/guides/monitor/raspberry-pi-anomaly-detection.md +++ b/docs/guides/monitor/raspberry-pi-anomaly-detection.md @@ -6,7 +6,7 @@ We love IoT and edge at Netdata, we also love machine learning. Even better if w of monitoring increasingly complex systems. We recently explored what might be involved in enabling our Python-based [anomalies -collector](https://github.com/netdata/netdata/blob/master/collectors/python.d.plugin/anomalies/README.md) on a Raspberry Pi. To our delight, it's actually quite +collector](https://github.com/netdata/netdata/blob/master/src/collectors/python.d.plugin/anomalies/README.md) on a Raspberry Pi. To our delight, it's actually quite straightforward! Read on to learn all the steps and enable unsupervised anomaly detection on your on Raspberry Pi(s). @@ -24,7 +24,7 @@ Read on to learn all the steps and enable unsupervised anomaly detection on your First make sure Netdata is using Python 3 when it runs Python-based data collectors. Next, open `netdata.conf` using [`edit-config`](https://github.com/netdata/netdata/blob/master/docs/configure/nodes.md#use-edit-config-to-edit-configuration-files) -from within the [Netdata config directory](https://github.com/netdata/netdata/blob/master/docs/configure/nodes.md#the-netdata-config-directory). Scroll down to the +from within the [Netdata config directory](https://github.com/netdata/netdata/blob/master/docs/netdata-agent/configuration.md#the-netdata-config-directory). Scroll down to the `[plugin:python.d]` section to pass in the `-ppython3` command option. ```conf @@ -53,7 +53,7 @@ LLVM_CONFIG=llvm-config-9 pip3 install --user llvmlite numpy==1.20.1 netdata-pan ## Enable the anomalies collector -Now you're ready to enable the collector and [restart Netdata](https://github.com/netdata/netdata/blob/master/docs/configure/start-stop-restart.md). +Now you're ready to enable the collector and [restart Netdata](https://github.com/netdata/netdata/blob/master/packaging/installer/README.md#maintaining-a-netdata-agent-installation). ```bash sudo ./edit-config python.d.conf @@ -75,7 +75,7 @@ centralized cloud somewhere) is the resource utilization impact of running a mon With the default configuration, the anomalies collector uses about 6.5% of CPU at each run. During the retraining step, CPU utilization jumps to between 20-30% for a few seconds, but you can [configure -retraining](https://github.com/netdata/netdata/blob/master/collectors/python.d.plugin/anomalies/README.md#configuration) to happen less often if you wish. +retraining](https://github.com/netdata/netdata/blob/master/src/collectors/python.d.plugin/anomalies/README.md#configuration) to happen less often if you wish. 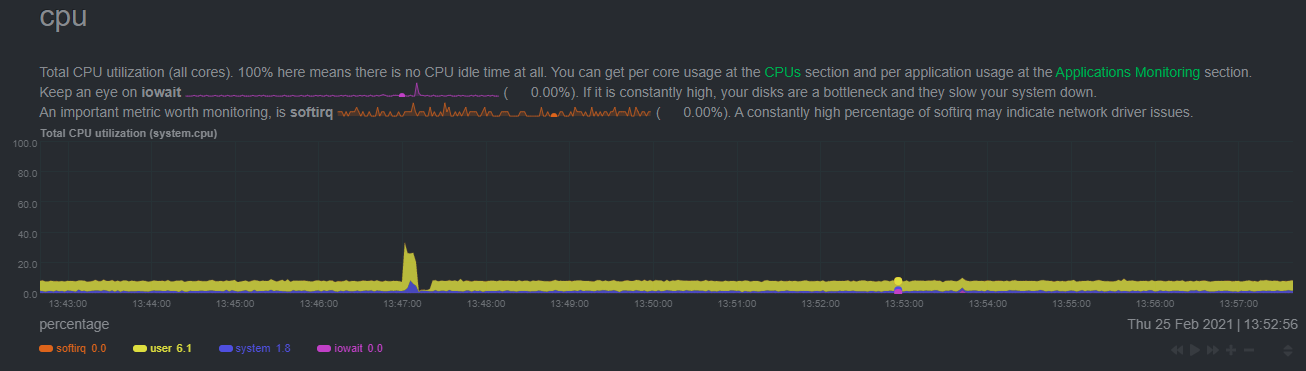 |