
diff options
Diffstat (limited to 'docs/guides/step-by-step/step-03.md')
| -rw-r--r-- | docs/guides/step-by-step/step-03.md | 91 |
1 files changed, 91 insertions, 0 deletions
diff --git a/docs/guides/step-by-step/step-03.md b/docs/guides/step-by-step/step-03.md new file mode 100644 index 000000000..2319adb44 --- /dev/null +++ b/docs/guides/step-by-step/step-03.md @@ -0,0 +1,91 @@ +<!-- +title: "Step 3. Monitor more than one system with Netdata" +date: 2020-05-01 +custom_edit_url: https://github.com/netdata/netdata/edit/master/docs/guides/step-by-step/step-03.md +--> + +# Step 3. Monitor more than one system with Netdata + +The Netdata agent is _distributed_ by design. That means each agent operates independently from any other, collecting +and creating charts only for the system you installed it on. We made this decision a long time ago to [improve security +and performance](step-01.md). + +You might be thinking, "So, now I have to remember all these IP addresses, and type them into my browser +manually, to move from one system to another? Maybe I should just make a bunch of bookmarks. What's a few more tabs +on top of the hundred I have already?" + +We get it. That's why we built [Netdata Cloud](https://learn.netdata.cloud/docs/cloud/), which connects many distributed +agents for a seamless experience when monitoring an entire infrastructure of Netdata-monitored nodes. + + + +## What you'll learn in this step + +In this step of the Netdata guide, we'll talk about the following: + +- [Why you should use Netdata Cloud](#why-use-netdata-cloud) +- [Get started with Netdata Cloud](#get-started-with-netdata-cloud) +- [Navigate between dashboards with Visited Nodes](#navigate-between-dashboards-with-visited-nodes) + +## Why use Netdata Cloud? + +Our [Cloud documentation](https://learn.netdata.cloud/docs/cloud/) does a good job (we think!) of explaining why Cloud +gives you a ton of value at no cost: + +> Netdata Cloud gives you real-time visibility for your entire infrastructure. With Netdata Cloud, you can run all your +> distributed Agents in headless mode _and_ access the real-time metrics and insightful charts from their dashboards. +> View key metrics and active alarms at-a-glance, and then seamlessly dive into any of your distributed dashboards +> without leaving Cloud's centralized interface. + +You can add as many nodes and team members as you need, and as our free and open source Agent gets better with more +features, new collectors for more applications, and improved UI, so will Cloud. + +## Get started with Netdata Cloud + +Signing in, onboarding, and claiming your first nodes only takes a few minutes, and we have a [Get started with +Cloud](https://learn.netdata.cloud/docs/cloud/get-started) guide to help you walk through every step. + +Or, if you're feeling confident, dive right in. + +<p><a href="https://app.netdata.cloud" className="button button--lg">Sign in to Cloud</a></p> + +When you finish that guide, circle back to this step in the guide to learn how to use the Visited Nodes feature on +top of Cloud's centralized web interface. + +## Navigate between dashboards with Visited Nodes + +To add nodes to your visited nodes, you first need to navigate to that node's dashboard, then click the **Sign in** +button at the top of the dashboard. On the screen that appears, which states your node is requesting access to your +Netdata Cloud account, sign in with your preferred method. + +Cloud redirects you back to your node's dashboard, which is now connected to your Netdata Cloud account. You can now see the menu populated by a single visited node. + +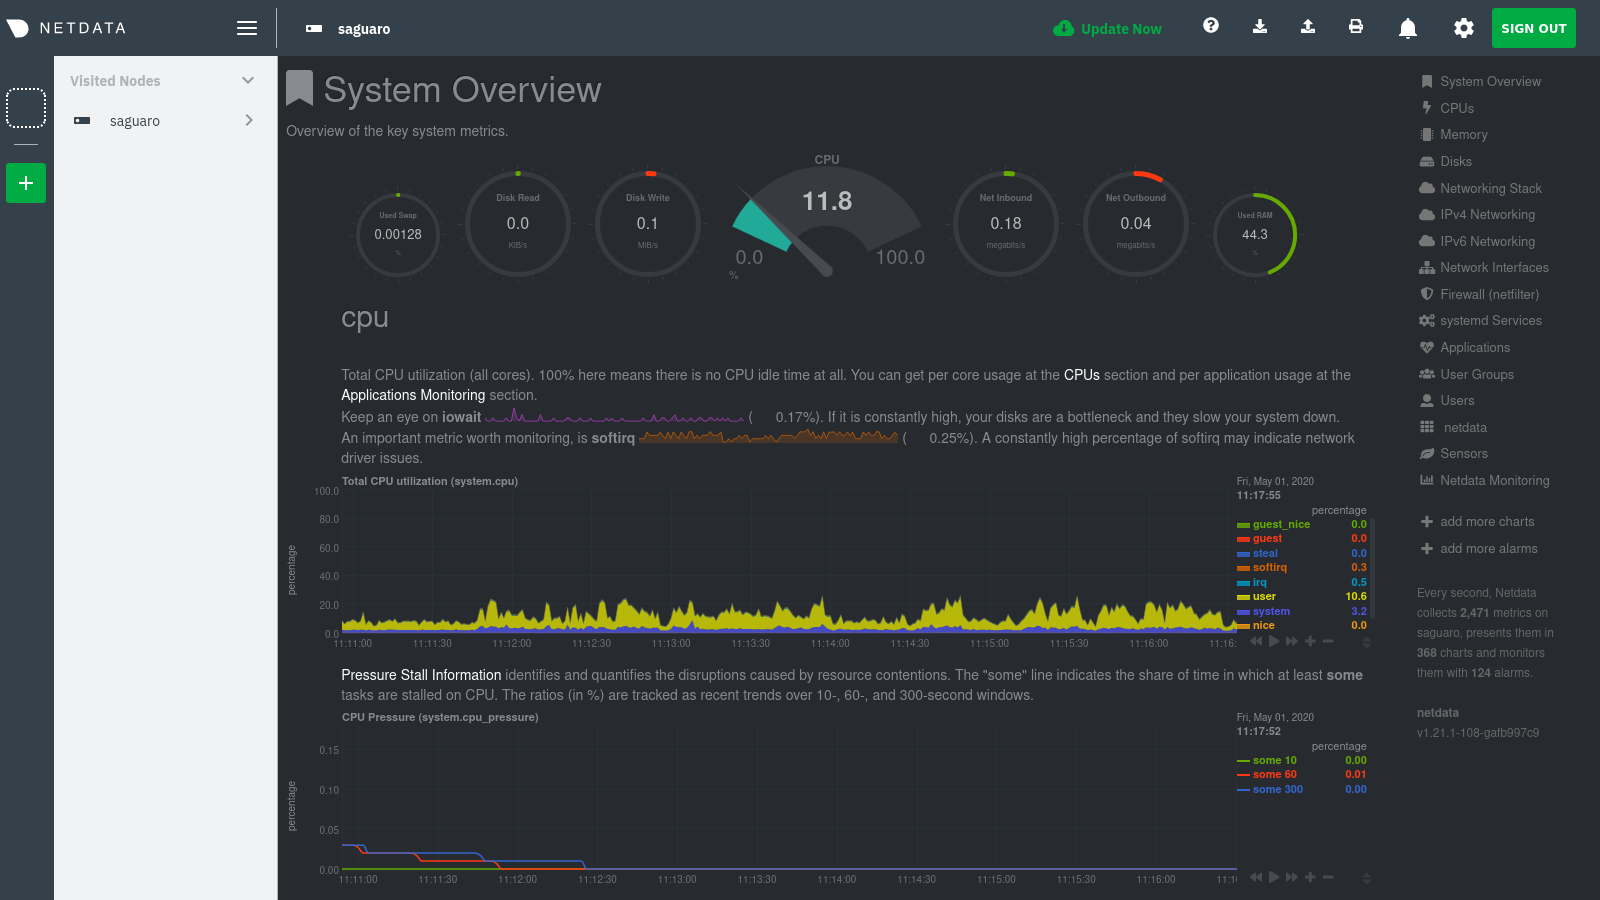 + +If you previously went through the Cloud onboarding process to create a Space and War Room, you will also see these +alongside your visited nodes. You can click on your Space or any of your War Rooms to navigate to Netdata Cloud and +continue monitoring your infrastructure from there. + +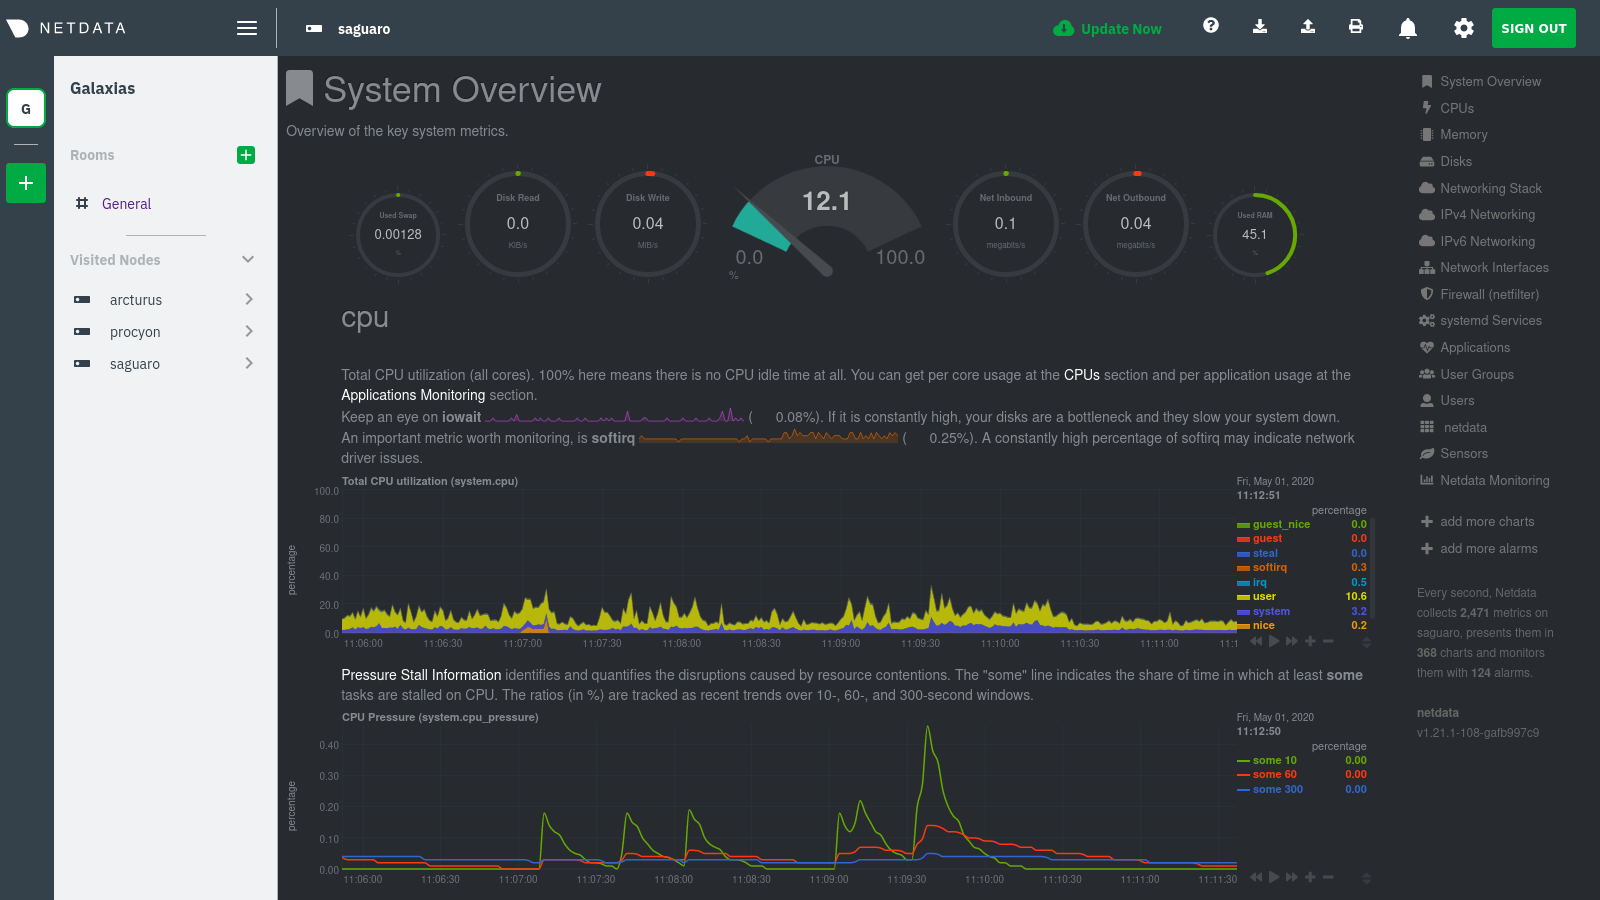 + +To add other visited nodes, navigate to their dashboard and sign in to Cloud by clicking on the **Sign in** button. This +process connects that node to your Cloud account and further populates the menu. + +Once you've added more than one node, you can use the menu to switch between various dashboards without remembering IP +addresses or hostnames or saving bookmarks for every node you want to monitor. + + + +## What's next? + +Now that you have a Netdata Cloud account with a claimed node (or a few!) and can navigate between your dashboards with +Visited nodes, it's time to learn more about how you can configure Netdata to your liking. From there, you'll be able to +customize your Netdata experience to your exact infrastructure and the information you need. + +[Next: The basics of configuring Netdata →](step-04.md) + +[](<>) |