
diff options
Diffstat (limited to 'docs/guides/step-by-step/step-09.md')
| -rw-r--r-- | docs/guides/step-by-step/step-09.md | 164 |
1 files changed, 164 insertions, 0 deletions
diff --git a/docs/guides/step-by-step/step-09.md b/docs/guides/step-by-step/step-09.md new file mode 100644 index 000000000..636ffea1f --- /dev/null +++ b/docs/guides/step-by-step/step-09.md @@ -0,0 +1,164 @@ +<!-- +title: "Step 9. Long-term metrics storage" +custom_edit_url: https://github.com/netdata/netdata/edit/master/docs/guides/step-by-step/step-09.md +--> + +# Step 9. Long-term metrics storage + +By default, Netdata stores metrics in a custom database we call the [database engine](/database/engine/README.md), which +stores recent metrics in your system's RAM and "spills" historical metrics to disk. By using both RAM and disk, the +database engine helps you store a much larger dataset than the amount of RAM your system has. + +On a system that's collecting 2,000 metrics every second, the database engine's default configuration will store about +two day's worth of metrics in RAM and on disk. + +That's a lot of metrics. We're talking 345,600,000 individual data points. And the database engine does it with a tiny +a portion of the RAM available on most systems. + +To store _even more_ metrics, you have two options. First, you can tweak the database engine's options to expand the RAM +or disk it uses. Second, you can archive metrics to an external database. For that, we'll use MongoDB as examples. + +## What you'll learn in this step + +In this step of the Netdata guide, you'll learn how to: + +- [Tweak the database engine's settings](#tweak-the-database-engines-settings) +- [Archive metrics to an external database](#archive-metrics-to-an-external-database) + - [Use the MongoDB database](#archive-metrics-via-the-mongodb-exporting-connector) + +Let's get started! + +## Tweak the database engine's settings + +If you're using Netdata v1.18.0 or higher, and you haven't changed your `memory mode` settings before following this +guide, your Netdata agent is already using the database engine. + +Let's look at your `netdata.conf` file again. Under the `[global]` section, you'll find three connected options. + +```conf +[global] + # memory mode = dbengine + # page cache size = 32 + # dbengine disk space = 256 +``` + +The `memory mode` option is set, by default, to `dbengine`. `page cache size` determines the amount of RAM, in MiB, that +the database engine dedicates to caching the metrics it's collecting. `dbengine disk space` determines the amount of +disk space, in MiB, that the database engine will use to store these metrics once they've been "spilled" to disk.. + +You can uncomment and change either `page cache size` or `dbengine disk space` based on how much RAM and disk you want +the database engine to use. The higher those values, the more metrics Netdata will store. If you change them to 64 and +512, respectively, the database engine should store about four day's worth of data on a system collecting 2,000 metrics +every second. + +[**See our database engine calculator**](/docs/store/change-metrics-storage.md) to help you correctly set `dbengine disk +space` based on your needs. The calculator gives an accurate estimate based on how many child nodes you have, how many +metrics your Agent collects, and more. + +```conf +[global] + memory mode = dbengine + page cache size = 64 + dbengine disk space = 512 +``` + +After you've made your changes, [restart Netdata](/docs/getting-started.md#start-stop-and-restart-netdata). + +To confirm the database engine is working, go to your Netdata dashboard and click on the **Netdata Monitoring** menu on +the right-hand side. You can find `dbengine` metrics after `queries`. + +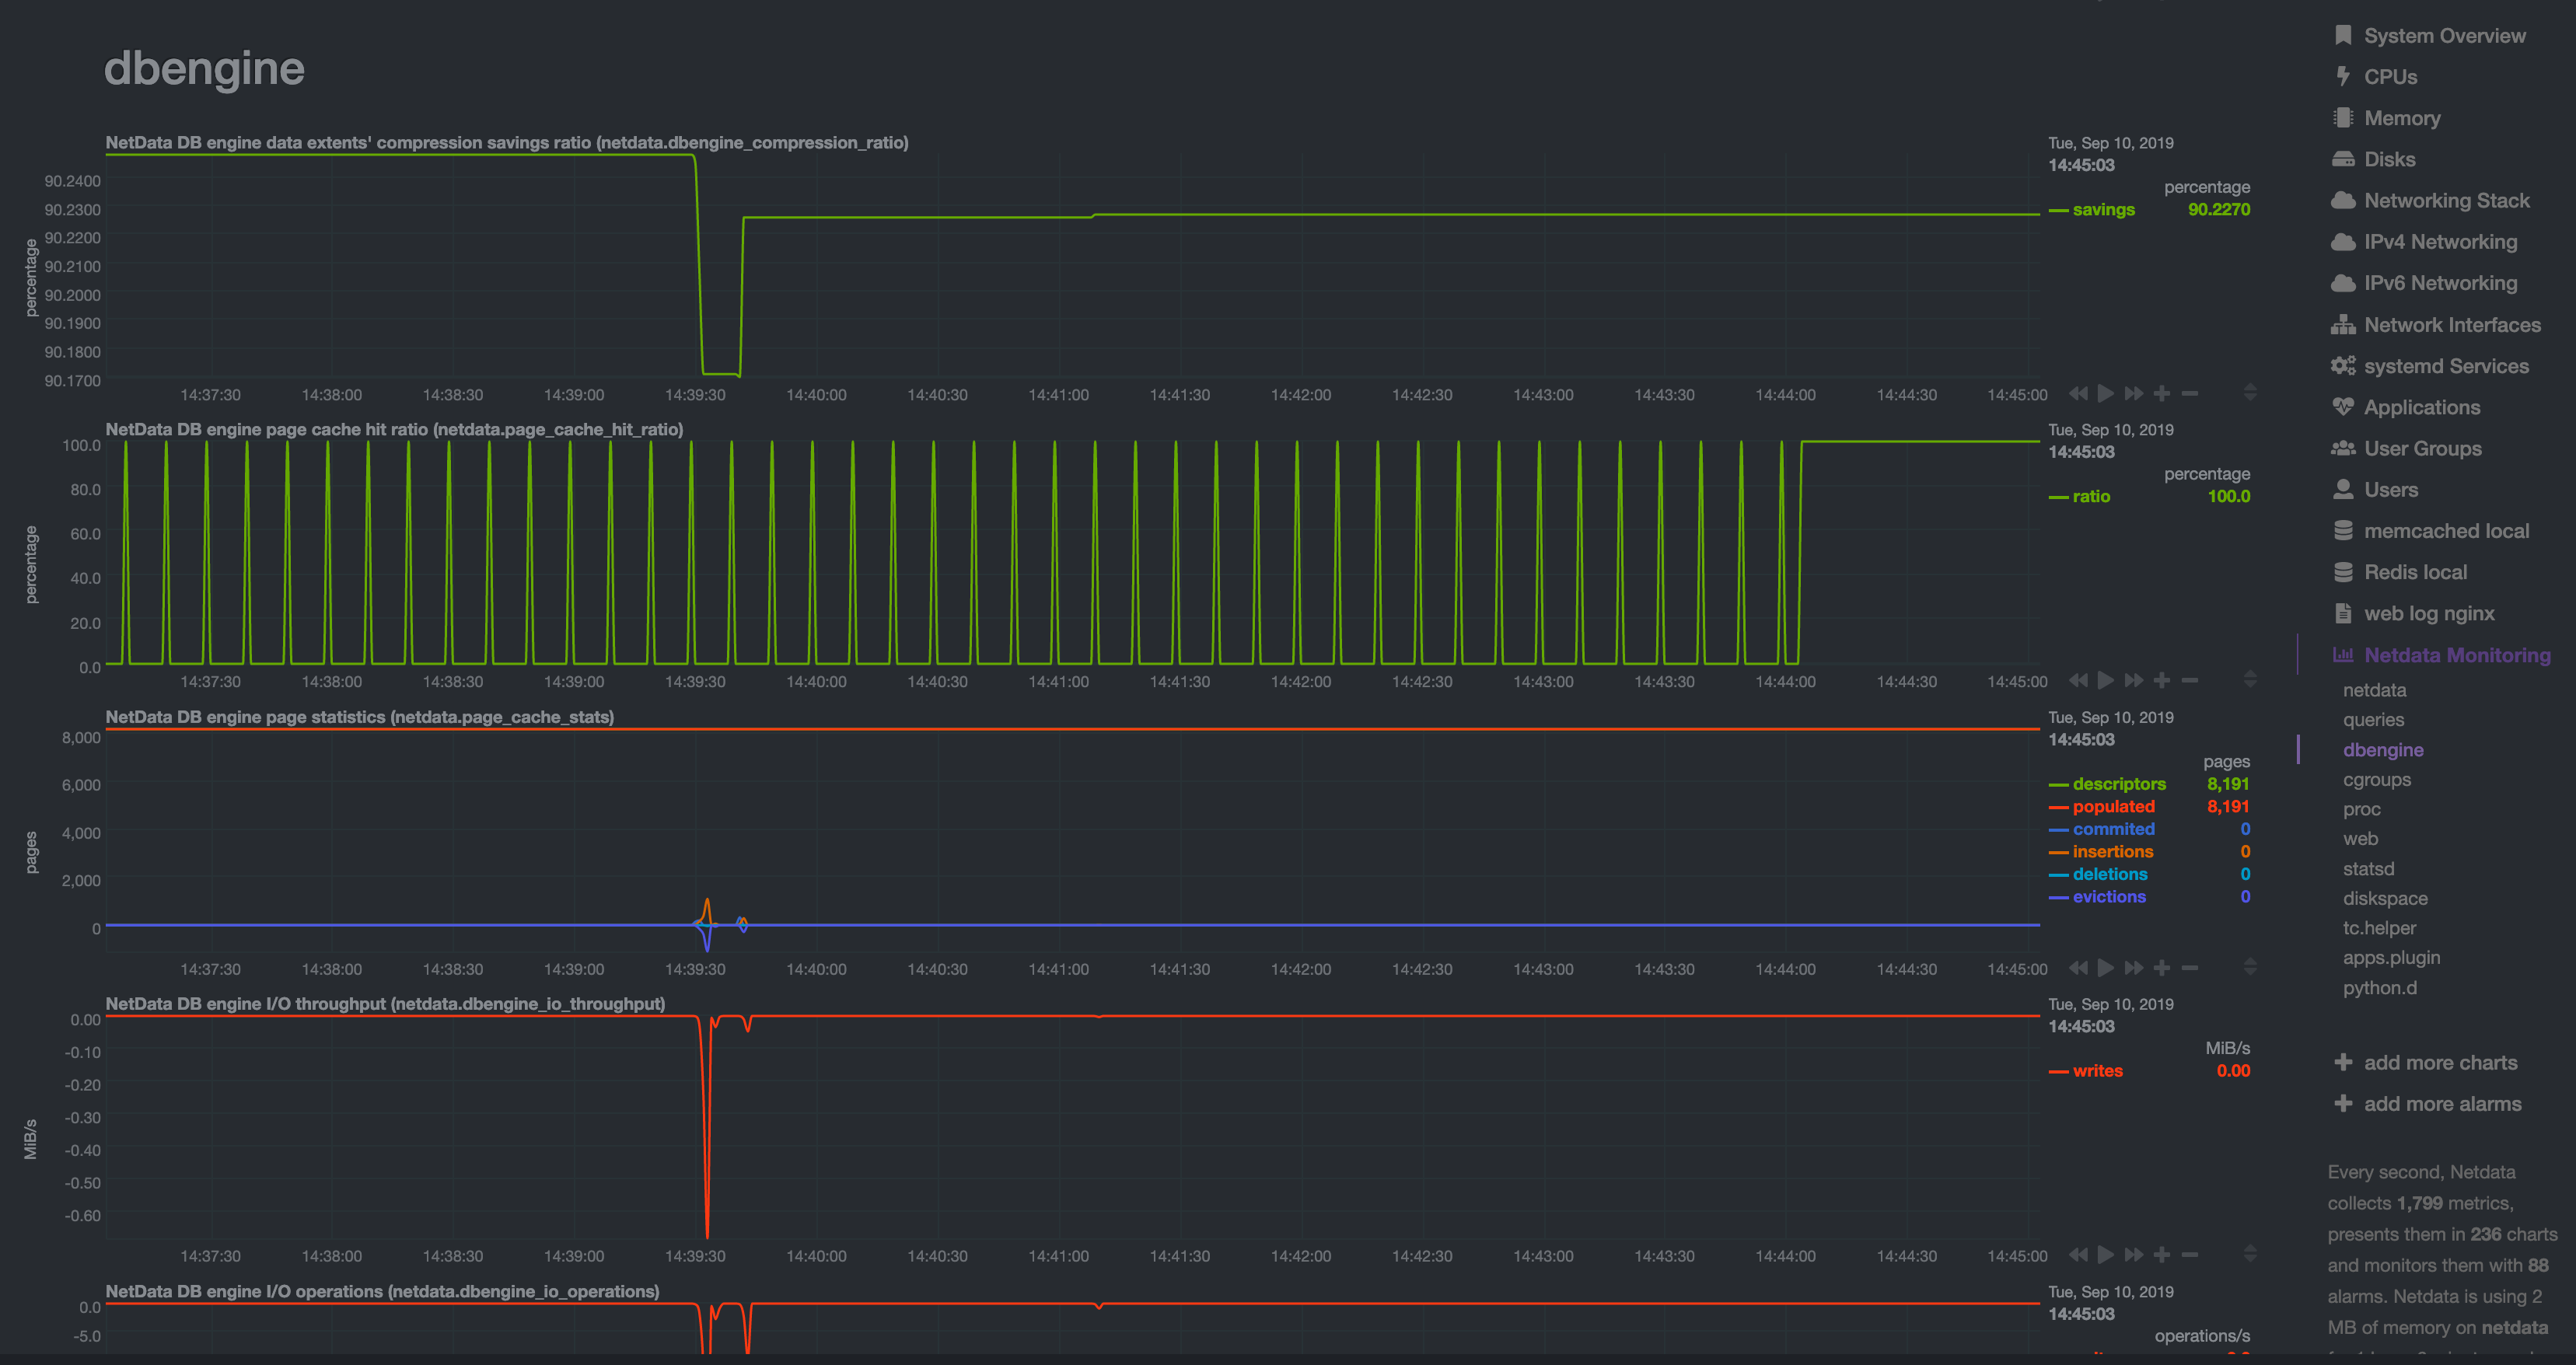 + +## Archive metrics to an external database + +You can archive all the metrics collected by Netdata to **external databases**. The supported databases and services +include Graphite, OpenTSDB, Prometheus, AWS Kinesis Data Streams, Google Cloud Pub/Sub, MongoDB, and the list is always +growing. + +As we said in [step 1](/docs/guides/step-by-step/step-01.md), we have only complimentary systems, not competitors! We're +happy to support these archiving methods and are always working to improve them. + +A lot of Netdata users archive their metrics to one of these databases for long-term storage or further analysis. Since +Netdata collects so many metrics every second, they can quickly overload small devices or even big servers that are +aggregating metrics streaming in from other Netdata agents. + +We even support resampling metrics during archiving. With resampling enabled, Netdata will archive only the average or +sum of every X seconds of metrics. This reduces the sheer amount of data, albeit with a little less accuracy. + +How you archive metrics, or if you archive metrics at all, is entirely up to you! But let's cover two easy archiving +methods, MongoDB and Prometheus remote write, to get you started. + +### Archive metrics via the MongoDB exporting connector + +Begin by installing MongoDB its dependencies via the correct package manager for your system. + +```bash +sudo apt-get install mongodb # Debian/Ubuntu +sudo dnf install mongodb # Fedora +sudo yum install mongodb # CentOS +``` + +Next, install the one essential dependency: v1.7.0 or higher of +[libmongoc](http://mongoc.org/libmongoc/current/installing.html). + +```bash +sudo apt-get install libmongoc-1.0-0 libmongoc-dev # Debian/Ubuntu +sudo dnf install mongo-c-driver mongo-c-driver-devel # Fedora +sudo yum install mongo-c-driver mongo-c-driver-devel # CentOS +``` + +Next, create a new MongoDB database and collection to store all these archived metrics. Use the `mongo` command to start +the MongoDB shell, and then execute the following command: + +```mongodb +use netdata +db.createCollection("netdata_metrics") +``` + +Next, Netdata needs to be [reinstalled](/packaging/installer/REINSTALL.md) in order to detect that the required +libraries to make this exporting connection exist. Since you most likely installed Netdata using the one-line installer +script, all you have to do is run that script again. Don't worry—any configuration changes you made along the way will +be retained! + +```bash +bash <(curl -Ss https://my-netdata.io/kickstart.sh) +``` + +Now, from your Netdata config directory, initialize and edit a `exporting.conf` file to tell Netdata where to find the +database you just created. + +```sh +./edit-config exporting.conf +``` + +Add the following section to the file: + +```conf +[mongodb:my_mongo_instance] + enabled = yes + destination = mongodb://localhost + database = netdata + collection = netdata_metrics +``` + +[Restart](/docs/getting-started.md#start-stop-and-restart-netdata) Netdata to enable the MongoDB exporting connector. +Click on the **Netdata Monitoring** menu and check out the **exporting my mongo instance** sub-menu. You should start +seeing these charts fill up with data about the exporting process! + +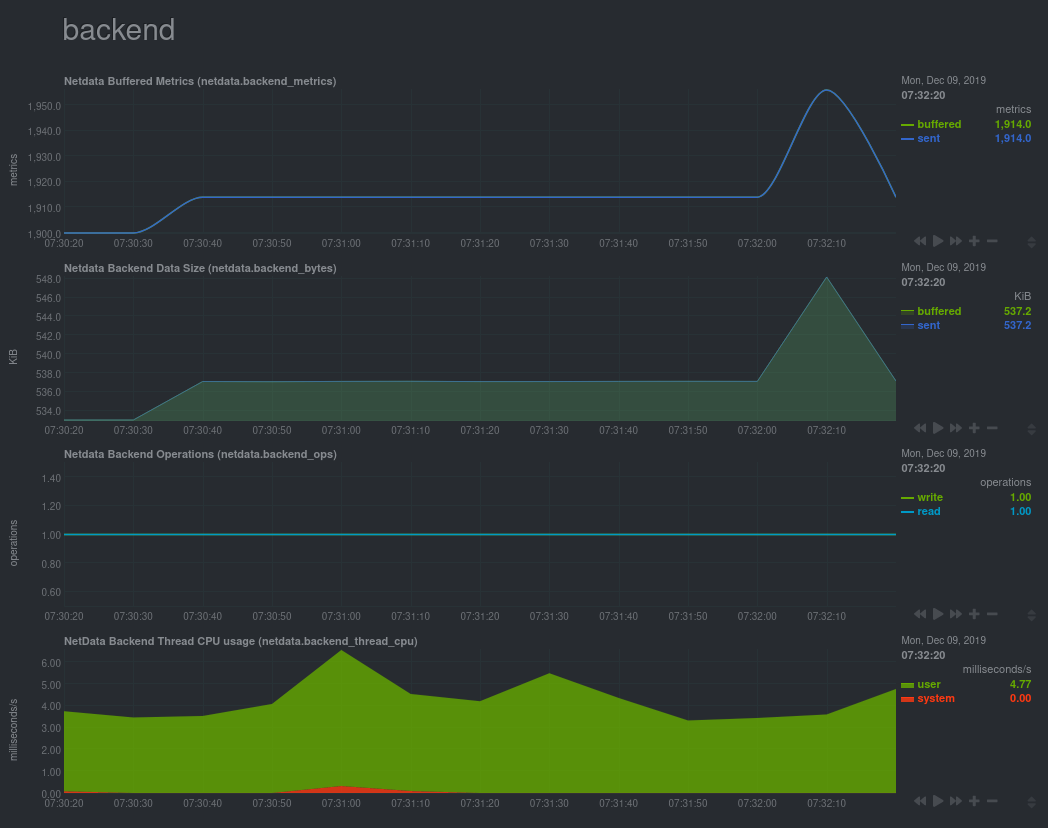 + +If you'd like to try connecting Netdata to another database, such as Prometheus or OpenTSDB, read our [exporting +documentation](/exporting/README.md). + +## What's next? + +You're getting close to the end! In this step, you learned how to make the most of the database engine, or archive +metrics to MongoDB for long-term storage. + +In the last step of this step-by-step guide, we'll put our sysadmin hat on and use Nginx to proxy traffic to and from +our Netdata dashboard. + +[Next: Set up a proxy →](/docs/guides/step-by-step/step-10.md) + +[](<>) |