
diff options
Diffstat (limited to 'docs/guides/step-by-step')
| -rw-r--r-- | docs/guides/step-by-step/step-00.md | 6 | ||||
| -rw-r--r-- | docs/guides/step-by-step/step-01.md | 2 | ||||
| -rw-r--r-- | docs/guides/step-by-step/step-02.md | 8 | ||||
| -rw-r--r-- | docs/guides/step-by-step/step-03.md | 15 | ||||
| -rw-r--r-- | docs/guides/step-by-step/step-04.md | 8 | ||||
| -rw-r--r-- | docs/guides/step-by-step/step-05.md | 19 | ||||
| -rw-r--r-- | docs/guides/step-by-step/step-06.md | 10 | ||||
| -rw-r--r-- | docs/guides/step-by-step/step-07.md | 8 | ||||
| -rw-r--r-- | docs/guides/step-by-step/step-08.md | 6 | ||||
| -rw-r--r-- | docs/guides/step-by-step/step-09.md | 16 | ||||
| -rw-r--r-- | docs/guides/step-by-step/step-10.md | 6 |
11 files changed, 53 insertions, 51 deletions
diff --git a/docs/guides/step-by-step/step-00.md b/docs/guides/step-by-step/step-00.md index 9f0fecac8..2f83ee9b4 100644 --- a/docs/guides/step-by-step/step-00.md +++ b/docs/guides/step-by-step/step-00.md @@ -18,7 +18,7 @@ completely new to Netdata, or have never tried health monitoring/performance tro guide is perfect for you. If you have monitoring experience, or would rather get straight into configuring Netdata to your needs, you can jump -straight into code and configurations with our [getting started guide](/docs/get-started.mdx). +straight into code and configurations with our [getting started guide](https://github.com/netdata/netdata/blob/master/docs/get-started.mdx). > This guide contains instructions for Netdata installed on a Linux system. Many of the instructions will work on > other supported operating systems, like FreeBSD and macOS, but we can't make any guarantees. @@ -44,7 +44,7 @@ The easiest way to install Netdata on a Linux system is our `kickstart.sh` one-l and let it take care of the rest. This script will install Netdata from source, keep it up to date with nightly releases, connects to the Netdata -[registry](/registry/README.md), and sends [_anonymous statistics_](/docs/anonymous-statistics.md) about how you use +[registry](https://github.com/netdata/netdata/blob/master/registry/README.md), and sends [_anonymous statistics_](https://github.com/netdata/netdata/blob/master/docs/anonymous-statistics.md) about how you use Netdata. We use this information to better understand how we can improve the Netdata experience for all our users. To install Netdata, run the following as your normal user: @@ -60,7 +60,7 @@ Once finished, you'll have Netdata installed, and you'll be set up to get _night improvements, and bugfixes. If this method doesn't work for you, or you want to use a different process, visit our [installation -documentation](/packaging/installer/README.md) for details. +documentation](https://github.com/netdata/netdata/blob/master/packaging/installer/README.md) for details. ## Netdata fundamentals diff --git a/docs/guides/step-by-step/step-01.md b/docs/guides/step-by-step/step-01.md index f5430e3a6..e60bb0769 100644 --- a/docs/guides/step-by-step/step-01.md +++ b/docs/guides/step-by-step/step-01.md @@ -139,7 +139,7 @@ easy! We'll cover this quickly, as you're probably eager to get on with using Netdata itself. We don't want to lock you in to using Netdata by itself, and forever. By supporting [archiving to -external databases](/exporting/README.md) like Graphite, Prometheus, OpenTSDB, MongoDB, and others, you can use Netdata _in +external databases](https://github.com/netdata/netdata/blob/master/exporting/README.md) like Graphite, Prometheus, OpenTSDB, MongoDB, and others, you can use Netdata _in conjunction_ with software that might seem like our competitors. We don't want to "wage war" with another monitoring solution, whether it's commercial, open-source, or anything in diff --git a/docs/guides/step-by-step/step-02.md b/docs/guides/step-by-step/step-02.md index 4b802ffd6..535f3cfa3 100644 --- a/docs/guides/step-by-step/step-02.md +++ b/docs/guides/step-by-step/step-02.md @@ -11,7 +11,7 @@ working with the dashboard directly. This step-by-step guide assumes you've already installed Netdata on a system of yours. If you haven't yet, hop back over to ["step 0"](step-00.md#before-we-get-started) for information about our one-line installer script. Or, view the -[installation docs](/packaging/installer/README.md) to learn more. Once you have Netdata installed, you can hop back +[installation docs](https://github.com/netdata/netdata/blob/master/packaging/installer/README.md) to learn more. Once you have Netdata installed, you can hop back over here and dig in. ## What you'll learn in this step @@ -56,7 +56,7 @@ what it's collecting. If you run Netdata on many different systems using differe menus and submenus may look a little different for each one. To learn more about menus, see our documentation about [navigating the standard -dashboard](/web/gui/README.md#metrics-menus). +dashboard](https://github.com/netdata/netdata/blob/master/web/gui/README.md#metrics-menus). > ❗ By default, Netdata only creates and displays charts if the metrics are _not zero_. So, you may be missing some > charts, menus, and submenus if those charts have zero metrics. You can change this by changing the **Which dimensions @@ -106,7 +106,7 @@ looking at its name or hovering over the chart's date. It's important to understand these differences, as Netdata uses charts, dimensions, families, and contexts to create health alarms and configure collectors. To read even more about the differences between all these elements of the dashboard, and how they affect other parts of Netdata, read our [dashboards -documentation](/web/README.md#charts-contexts-families). +documentation](https://github.com/netdata/netdata/blob/master/web/README.md#charts-contexts-families). ## Interact with charts @@ -148,7 +148,7 @@ chart to its original height, double-click the same icon.  -To learn more about other options and chart interactivity, read our [dashboard documentation](/web/README.md). +To learn more about other options and chart interactivity, read our [dashboard documentation](https://github.com/netdata/netdata/blob/master/web/README.md). ## See raised alarms and the alarm log diff --git a/docs/guides/step-by-step/step-03.md b/docs/guides/step-by-step/step-03.md index c1d283ba0..3204765b4 100644 --- a/docs/guides/step-by-step/step-03.md +++ b/docs/guides/step-by-step/step-03.md @@ -14,7 +14,7 @@ You might be thinking, "So, now I have to remember all these IP addresses, and t manually, to move from one system to another? Maybe I should just make a bunch of bookmarks. What's a few more tabs on top of the hundred I have already?" -We get it. That's why we built [Netdata Cloud](https://learn.netdata.cloud/docs/cloud/), which connects many distributed +We get it. That's why we built [Netdata Cloud](https://github.com/netdata/netdata/blob/master/docs/cloud/cloud.mdx), which connects many distributed agents for a seamless experience when monitoring an entire infrastructure of Netdata-monitored nodes.  -- [Get started with Netdata Cloud](#get-started-with-netdata-cloud) -- [Navigate between dashboards with Visited Nodes](#navigate-between-dashboards-with-visited-nodes) +- [Step 3. Monitor more than one system with Netdata](#step-3-monitor-more-than-one-system-with-netdata) + - [What you'll learn in this step](#what-youll-learn-in-this-step) + - [Why use Netdata Cloud?](#why-use-netdata-cloud) + - [Get started with Netdata Cloud](#get-started-with-netdata-cloud) + - [Navigate between dashboards with Visited Nodes](#navigate-between-dashboards-with-visited-nodes) + - [What's next?](#whats-next) ## Why use Netdata Cloud? -Our [Cloud documentation](https://learn.netdata.cloud/docs/cloud/) does a good job (we think!) of explaining why Cloud +Our [Cloud documentation](https://github.com/netdata/netdata/blob/master/docs/cloud/cloud.mdx) does a good job (we think!) of explaining why Cloud gives you a ton of value at no cost: > Netdata Cloud gives you real-time visibility for your entire infrastructure. With Netdata Cloud, you can run all your @@ -44,7 +47,7 @@ features, new collectors for more applications, and improved UI, so will Cloud. ## Get started with Netdata Cloud Signing in, onboarding, and connecting your first nodes only takes a few minutes, and we have a [Get started with -Cloud](https://learn.netdata.cloud/docs/cloud/get-started) guide to help you walk through every step. +Cloud](https://github.com/netdata/netdata/blob/master/docs/cloud/cloud.mdx) guide to help you walk through every step. Or, if you're feeling confident, dive right in. diff --git a/docs/guides/step-by-step/step-04.md b/docs/guides/step-by-step/step-04.md index 37b4245be..fcd84ce6a 100644 --- a/docs/guides/step-by-step/step-04.md +++ b/docs/guides/step-by-step/step-04.md @@ -43,7 +43,7 @@ In the system represented by the screenshot, the line reads: `config directory = `netdata.conf`, and all the other configuration files, can be found at `/etc/netdata`. > For more details on where your Netdata config directory is, take a look at our [installation -> instructions](/packaging/installer/README.md). +> instructions](https://github.com/netdata/netdata/blob/master/packaging/installer/README.md). For the rest of this guide, we'll assume you're editing files or running scripts from _within_ your **Netdata configuration directory**. @@ -96,7 +96,7 @@ section and give it the value of `1`. ``` Restart Netdata with `sudo systemctl restart netdata`, or the [appropriate -method](/docs/configure/start-stop-restart.md) for your system. +method](https://github.com/netdata/netdata/blob/master/docs/configure/start-stop-restart.md) for your system. Now, open up your browser and navigate to `http://HOST:19999/netdata.conf`. You'll see that Netdata has recognized that our fake option isn't valid and added a notice that Netdata will ignore it. @@ -124,8 +124,8 @@ Once you're done, restart Netdata and refresh the dashboard. Say hello to your r netdata.conf](https://user-images.githubusercontent.com/1153921/80994808-1c065300-8df2-11ea-81af-d28dc3ba27c8.gif) Netdata has dozens upon dozens of options you can change. To see them all, read our [daemon -configuration](/daemon/config/README.md), or hop into our popular guide on [increasing long-term metrics -storage](/docs/guides/longer-metrics-storage.md). +configuration](https://github.com/netdata/netdata/blob/master/daemon/config/README.md), or hop into our popular guide on [increasing long-term metrics +storage](https://github.com/netdata/netdata/blob/master/docs/guides/longer-metrics-storage.md). ## What's next? diff --git a/docs/guides/step-by-step/step-05.md b/docs/guides/step-by-step/step-05.md index 3cd8c5dbc..3ef498d40 100644 --- a/docs/guides/step-by-step/step-05.md +++ b/docs/guides/step-by-step/step-05.md @@ -32,8 +32,7 @@ The first chart you see on any Netdata dashboard is the `system.cpu` chart, whic across all cores. To figure out which file you need to edit to tune this alarm, click the **Alarms** button at the top of the dashboard, click on the **All** tab, and find the **system - cpu** alarm entity. -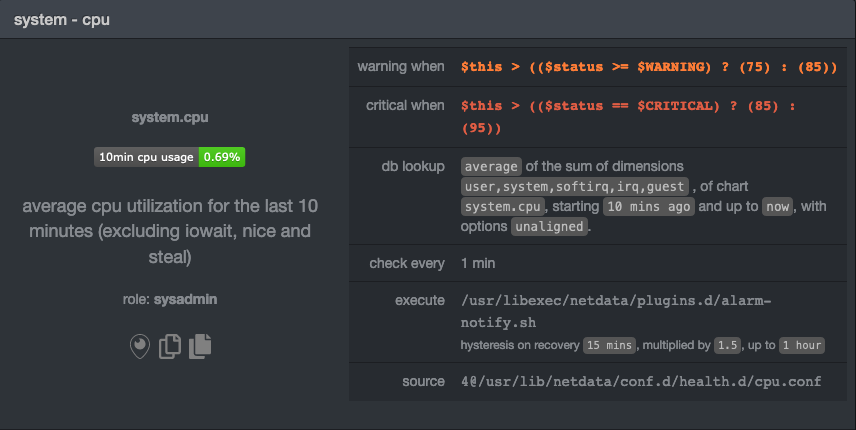 + Look at the `source` row in the table. This means the `system.cpu` chart sources its health alarms from `4@/usr/lib/netdata/conf.d/health.d/cpu.conf`. To tune these alarms, you'll need to edit the alarm file at @@ -70,10 +69,10 @@ the `warn` and `crit` lines to the values of your choosing. For example: ``` You _can_ restart Netdata with `sudo systemctl restart netdata`, to enable your tune, but you can also reload _only_ the -health monitoring component using one of the available [methods](/health/QUICKSTART.md#reload-health-configuration). +health monitoring component using one of the available [methods](https://github.com/netdata/netdata/blob/master/health/QUICKSTART.md#reload-health-configuration). You can also tune any other aspect of the default alarms. To better understand how each line in a health entity works, -read our [health documentation](/health/README.md). +read our [health documentation](https://github.com/netdata/netdata/blob/master/health/README.md). ### Silence an individual alarm @@ -176,7 +175,7 @@ These lines will trigger a warning if that average RAM usage goes above 80%, and > ❗ Most default Netdata alarms come with more complicated `warn` and `crit` lines. You may have noticed the line `warn: > $this > (($status >= $WARNING) ? (75) : (85))` in one of the health entity examples above, which is an example of -> using the [conditional operator for hysteresis](/health/REFERENCE.md#special-use-of-the-conditional-operator). +> using the [conditional operator for hysteresis](https://github.com/netdata/netdata/blob/master/health/REFERENCE.md#special-use-of-the-conditional-operator). > Hysteresis is used to keep Netdata from triggering a ton of alerts if the metric being tracked quickly goes above and > then falls below the threshold. For this very simple example, we'll skip hysteresis, but recommend implementing it in > your future health entities. @@ -215,7 +214,7 @@ stress -m 1 --vm-bytes 8G --vm-keep ``` Netdata is capable of understanding much more complicated entities. To better understand how they work, read the [health -documentation](/health/README.md), look at some [examples](/health/REFERENCE.md#example-alarms), and open the files +documentation](https://github.com/netdata/netdata/blob/master/health/README.md), look at some [examples](https://github.com/netdata/netdata/blob/master/health/REFERENCE.md#example-alarms), and open the files containing the default entities on your system. ## Enable Netdata's notification systems @@ -224,7 +223,7 @@ Health alarms, while great on their own, are pretty useless without some way of That's why Netdata comes with a notification system that supports more than a dozen services, such as email, Slack, Discord, PagerDuty, Twilio, Amazon SNS, and much more. -To see all the supported systems, visit our [notifications documentation](/health/notifications/README.md). +To see all the supported systems, visit our [notifications documentation](https://github.com/netdata/netdata/blob/master/health/notifications/README.md). We'll cover email and Slack notifications here, but with this knowledge you should be able to enable any other type of notifications instead of or in addition to these. @@ -330,9 +329,9 @@ applications. To further configure your email or Slack notification setup, or to enable other notification systems, check out the following documentation: -- [Email notifications](/health/notifications/email/README.md) -- [Slack notifications](/health/notifications/slack/README.md) -- [Netdata's notification system](/health/notifications/README.md) +- [Email notifications](https://github.com/netdata/netdata/blob/master/health/notifications/email/README.md) +- [Slack notifications](https://github.com/netdata/netdata/blob/master/health/notifications/slack/README.md) +- [Netdata's notification system](https://github.com/netdata/netdata/blob/master/health/notifications/README.md) ## What's next? diff --git a/docs/guides/step-by-step/step-06.md b/docs/guides/step-by-step/step-06.md index f04098fc1..b951a76bb 100644 --- a/docs/guides/step-by-step/step-06.md +++ b/docs/guides/step-by-step/step-06.md @@ -8,13 +8,13 @@ custom_edit_url: https://github.com/netdata/netdata/edit/master/docs/guides/step When Netdata _starts_, it auto-detects dozens of **data sources**, such as database servers, web servers, and more. To auto-detect and collect metrics from a source you just installed, you need to restart Netdata using `sudo systemctl -restart netdata`, or the [appropriate method](/docs/configure/start-stop-restart.md) for your system. +restart netdata`, or the [appropriate method](https://github.com/netdata/netdata/blob/master/docs/configure/start-stop-restart.md) for your system. However, auto-detection only works if you installed the source using its standard installation procedure. If Netdata isn't collecting metrics after a restart, your source probably isn't configured correctly. -Check out the [collectors that come pre-installed with Netdata](/collectors/COLLECTORS.md) to find the module for the +Check out the [collectors that come pre-installed with Netdata](https://github.com/netdata/netdata/blob/master/collectors/COLLECTORS.md) to find the module for the source you want to monitor. ## What you'll learn in this step @@ -37,8 +37,8 @@ are organized and manged by plugins. **Internal** plugins collect system metrics non-system metrics, and **orchestrator** plugins group individual collectors together based on the programming language they were built in. -These modules are primarily written in [Go](https://learn.netdata.cloud/docs/agent/collectors/go.d.plugin/) (`go.d`) and -[Python](/collectors/python.d.plugin/README.md), although some use [Bash](/collectors/charts.d.plugin/README.md) +These modules are primarily written in [Go](https://github.com/netdata/go.d.plugin/blob/master/README.md) (`go.d`) and +[Python](https://github.com/netdata/netdata/blob/master/collectors/python.d.plugin/README.md), although some use [Bash](https://github.com/netdata/netdata/blob/master/collectors/charts.d.plugin/README.md) (`charts.d`). ## Enable and disable plugins @@ -100,7 +100,7 @@ Next, edit your `/etc/nginx/sites-enabled/default` file to include a `location` ``` Restart Netdata using `sudo systemctl restart netdata`, or the [appropriate -method](/docs/configure/start-stop-restart.md) for your system, and Netdata will auto-detect metrics from your Nginx web +method](https://github.com/netdata/netdata/blob/master/docs/configure/start-stop-restart.md) for your system, and Netdata will auto-detect metrics from your Nginx web server! While not necessary for most auto-detection and collection purposes, you can also configure the Nginx collector itself diff --git a/docs/guides/step-by-step/step-07.md b/docs/guides/step-by-step/step-07.md index 17a02cd46..8c5c21bee 100644 --- a/docs/guides/step-by-step/step-07.md +++ b/docs/guides/step-by-step/step-07.md @@ -9,7 +9,7 @@ custom_edit_url: https://github.com/netdata/netdata/edit/master/docs/guides/step Welcome to the seventh step of the Netdata guide! This step of the guide aims to get you more familiar with the features of the dashboard not previously mentioned in -[step 2](/docs/guides/step-by-step/step-02.md). +[step 2](https://github.com/netdata/netdata/blob/master/docs/guides/step-by-step/step-02.md). ## What you'll learn in this step @@ -53,9 +53,9 @@ You can always check if there is an update available from the **Update** area of If an update is available, you'll see a modal similar to the one above. -When you use the [automatic one-line installer script](/packaging/installer/README.md) attempt to update every day. If -you choose to update it manually, there are [several well-documented methods](/packaging/installer/UPDATE.md) to achieve -that. However, it is best practice for you to first go over the [changelog](/CHANGELOG.md). +When you use the [automatic one-line installer script](https://github.com/netdata/netdata/blob/master/packaging/installer/README.md) attempt to update every day. If +you choose to update it manually, there are [several well-documented methods](https://github.com/netdata/netdata/blob/master/packaging/installer/UPDATE.md) to achieve +that. However, it is best practice for you to first go over the [changelog](https://github.com/netdata/netdata/blob/master/CHANGELOG.md). ## Export and import a snapshot diff --git a/docs/guides/step-by-step/step-08.md b/docs/guides/step-by-step/step-08.md index e9c0f902c..7a8d417f1 100644 --- a/docs/guides/step-by-step/step-08.md +++ b/docs/guides/step-by-step/step-08.md @@ -145,7 +145,7 @@ charts on a single page. ### The chart unique ID (required) You need to specify the unique ID of a chart to show it on your custom dashboard. If you forgot how to find the unique -ID, head back over to [step 2](/docs/guides/step-by-step/step-02.md#understand-charts-dimensions-families-and-contexts) +ID, head back over to [step 2](https://github.com/netdata/netdata/blob/master/docs/guides/step-by-step/step-02.md#understand-charts-dimensions-families-and-contexts) for a re-introduction. You can then put this unique ID into a `<div>` element with the `data-netdata` attribute. Put this in the `<body>` of @@ -385,11 +385,11 @@ In this guide, you learned the fundamentals of building a custom Netdata dashboa charts to your `custom-dashboard.html`, change the charts that are already there, and size them according to your needs. Of course, the custom dashboarding features covered here are just the beginning. Be sure to read up on our [custom -dashboard documentation](/web/gui/custom/README.md) for details on how you can use other chart libraries, pull metrics +dashboard documentation](https://github.com/netdata/netdata/blob/master/web/gui/custom/README.md) for details on how you can use other chart libraries, pull metrics from multiple Netdata agents, and choose which dimensions a given chart shows. Next, you'll learn how to store long-term historical metrics in Netdata! -[Next: Long-term metrics storage →](/docs/guides/step-by-step/step-09.md) +[Next: Long-term metrics storage →](https://github.com/netdata/netdata/blob/master/docs/guides/step-by-step/step-09.md) diff --git a/docs/guides/step-by-step/step-09.md b/docs/guides/step-by-step/step-09.md index 8aacd7514..839115a27 100644 --- a/docs/guides/step-by-step/step-09.md +++ b/docs/guides/step-by-step/step-09.md @@ -5,7 +5,7 @@ custom_edit_url: https://github.com/netdata/netdata/edit/master/docs/guides/step # Step 9. Long-term metrics storage -By default, Netdata stores metrics in a custom database we call the [database engine](/database/engine/README.md), which +By default, Netdata stores metrics in a custom database we call the [database engine](https://github.com/netdata/netdata/blob/master/database/engine/README.md), which stores recent metrics in your system's RAM and "spills" historical metrics to disk. By using both RAM and disk, the database engine helps you store a much larger dataset than the amount of RAM your system has. @@ -51,7 +51,7 @@ the database engine to use. The higher those values, the more metrics Netdata wi 512, respectively, the database engine should store about four day's worth of data on a system collecting 2,000 metrics every second. -[**See our database engine calculator**](/docs/store/change-metrics-storage.md) to help you correctly set `dbengine disk +[**See our database engine calculator**](https://github.com/netdata/netdata/blob/master/docs/store/change-metrics-storage.md) to help you correctly set `dbengine disk space` based on your needs. The calculator gives an accurate estimate based on how many child nodes you have, how many metrics your Agent collects, and more. @@ -63,7 +63,7 @@ metrics your Agent collects, and more. ``` After you've made your changes, restart Netdata using `sudo systemctl restart netdata`, or the [appropriate -method](/docs/configure/start-stop-restart.md) for your system. +method](https://github.com/netdata/netdata/blob/master/docs/configure/start-stop-restart.md) for your system. To confirm the database engine is working, go to your Netdata dashboard and click on the **Netdata Monitoring** menu on the right-hand side. You can find `dbengine` metrics after `queries`. @@ -77,7 +77,7 @@ You can archive all the metrics collected by Netdata to **external databases**. include Graphite, OpenTSDB, Prometheus, AWS Kinesis Data Streams, Google Cloud Pub/Sub, MongoDB, and the list is always growing. -As we said in [step 1](/docs/guides/step-by-step/step-01.md), we have only complimentary systems, not competitors! We're +As we said in [step 1](https://github.com/netdata/netdata/blob/master/docs/guides/step-by-step/step-01.md), we have only complimentary systems, not competitors! We're happy to support these archiving methods and are always working to improve them. A lot of Netdata users archive their metrics to one of these databases for long-term storage or further analysis. Since @@ -117,7 +117,7 @@ use netdata db.createCollection("netdata_metrics") ``` -Next, Netdata needs to be [reinstalled](/packaging/installer/REINSTALL.md) in order to detect that the required +Next, Netdata needs to be [reinstalled](https://github.com/netdata/netdata/blob/master/packaging/installer/REINSTALL.md) in order to detect that the required libraries to make this exporting connection exist. Since you most likely installed Netdata using the one-line installer script, all you have to do is run that script again. Don't worry—any configuration changes you made along the way will be retained! @@ -140,14 +140,14 @@ Add the following section to the file: ``` Restart Netdata using `sudo systemctl restart netdata`, or the [appropriate -method](/docs/configure/start-stop-restart.md) for your system, to enable the MongoDB exporting connector. Click on the +method](https://github.com/netdata/netdata/blob/master/docs/configure/start-stop-restart.md) for your system, to enable the MongoDB exporting connector. Click on the **Netdata Monitoring** menu and check out the **exporting my mongo instance** sub-menu. You should start seeing these charts fill up with data about the exporting process! 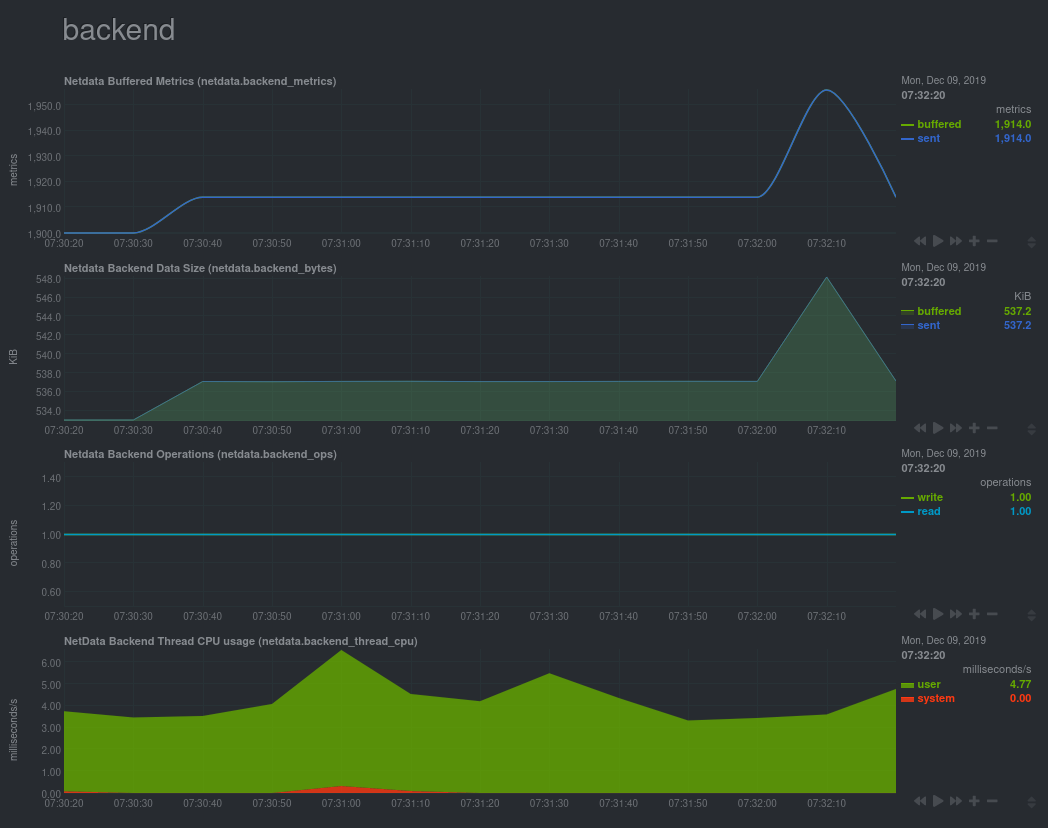 If you'd like to try connecting Netdata to another database, such as Prometheus or OpenTSDB, read our [exporting -documentation](/exporting/README.md). +documentation](https://github.com/netdata/netdata/blob/master/exporting/README.md). ## What's next? @@ -157,6 +157,6 @@ metrics to MongoDB for long-term storage. In the last step of this step-by-step guide, we'll put our sysadmin hat on and use Nginx to proxy traffic to and from our Netdata dashboard. -[Next: Set up a proxy →](/docs/guides/step-by-step/step-10.md) +[Next: Set up a proxy →](https://github.com/netdata/netdata/blob/master/docs/guides/step-by-step/step-10.md) diff --git a/docs/guides/step-by-step/step-10.md b/docs/guides/step-by-step/step-10.md index c9acf5aaf..a24e803f7 100644 --- a/docs/guides/step-by-step/step-10.md +++ b/docs/guides/step-by-step/step-10.md @@ -219,9 +219,9 @@ You're a real sysadmin now! If you want to configure your Nginx proxy further, check out the following: -- [Running Netdata behind Nginx](/docs/Running-behind-nginx.md) -- [How to optimize Netdata's performance](/docs/guides/configure/performance.md) -- [Enabling TLS on Netdata's dashboard](/web/server/README.md#enabling-tls-support) +- [Running Netdata behind Nginx](https://github.com/netdata/netdata/blob/master/docs/Running-behind-nginx.md) +- [How to optimize Netdata's performance](https://github.com/netdata/netdata/blob/master/docs/guides/configure/performance.md) +- [Enabling TLS on Netdata's dashboard](https://github.com/netdata/netdata/blob/master/web/server/README.md#enabling-tls-support) And... you're _almost_ done with the Netdata guide. |