
diff options
Diffstat (limited to 'docs/guides/step-by-step')
| -rw-r--r-- | docs/guides/step-by-step/step-00.md | 115 | ||||
| -rw-r--r-- | docs/guides/step-by-step/step-01.md | 156 | ||||
| -rw-r--r-- | docs/guides/step-by-step/step-02.md | 208 | ||||
| -rw-r--r-- | docs/guides/step-by-step/step-03.md | 91 | ||||
| -rw-r--r-- | docs/guides/step-by-step/step-04.md | 144 | ||||
| -rw-r--r-- | docs/guides/step-by-step/step-05.md | 343 | ||||
| -rw-r--r-- | docs/guides/step-by-step/step-06.md | 122 | ||||
| -rw-r--r-- | docs/guides/step-by-step/step-07.md | 114 | ||||
| -rw-r--r-- | docs/guides/step-by-step/step-08.md | 395 | ||||
| -rw-r--r-- | docs/guides/step-by-step/step-09.md | 164 | ||||
| -rw-r--r-- | docs/guides/step-by-step/step-10.md | 230 | ||||
| -rw-r--r-- | docs/guides/step-by-step/step-99.md | 51 |
12 files changed, 2133 insertions, 0 deletions
diff --git a/docs/guides/step-by-step/step-00.md b/docs/guides/step-by-step/step-00.md new file mode 100644 index 000000000..794366645 --- /dev/null +++ b/docs/guides/step-by-step/step-00.md @@ -0,0 +1,115 @@ +<!-- +title: "The step-by-step Netdata guide" +date: 2020-03-31 +custom_edit_url: https://github.com/netdata/netdata/edit/master/docs/guides/step-by-step/step-00.md +--> + +# The step-by-step Netdata guide + +Welcome to Netdata! We're glad you're interested in our health monitoring and performance troubleshooting system. + +Because Netdata is entirely open-source software, you can use it free of charge, whether you want to monitor one or ten +thousand systems! All our code is hosted on [GitHub](https://github.com/netdata/netdata). + +This guide is designed to help you understand what Netdata is, what it's capable of, and how it'll help you make +faster and more informed decisions about the health and performance of your systems and applications. If you're +completely new to Netdata, or have never tried health monitoring/performance troubleshooting systems before, this +guide is perfect for you. + +If you have monitoring experience, or would rather get straight into configuring Netdata to your needs, you can jump +straight into code and configurations with our [getting started guide](/docs/getting-started.md). + +> This guide contains instructions for Netdata installed on a Linux system. Many of the instructions will work on +> other supported operating systems, like FreeBSD and macOS, but we can't make any guarantees. + +## Where to go if you need help + +No matter where you are in this Netdata guide, if you need help, head over to our [GitHub +repository](https://github.com/netdata/netdata/). That's where we collect questions from users, help fix their bugs, and +point people toward documentation that explains what they're having trouble with. + +Click on the **issues** tab to see all the conversations we're having with Netdata users. Use the search bar to find +previously-written advice for your specific problem, and if you don't see any results, hit the **New issue** button to +send us a question. + +Or, if that's too complicated, feel free to send this guide's author [an email](mailto:joel@netdata.cloud). + +## Before we get started + +Let's make sure you have Netdata installed on your system! + +> If you already installed Netdata, feel free to skip to [Step 1: Netdata's building blocks](step-01.md). + +The easiest way to install Netdata on a Linux system is our `kickstart.sh` one-line installer. Run this on your system +and let it take care of the rest. + +This script will install Netdata from source, keep it up to date with nightly releases, connects to the Netdata +[registry](/registry/README.md), and sends [_anonymous statistics_](/docs/anonymous-statistics.md) about how you use +Netdata. We use this information to better understand how we can improve the Netdata experience for all our users. + +```bash +bash <(curl -Ss https://my-netdata.io/kickstart.sh) +``` + +Once finished, you'll have Netdata installed, and you'll be set up to get _nightly updates_ to get the latest features, +improvements, and bugfixes. + +If this method doesn't work for you, or you want to use a different process, visit our [installation +documentation](/packaging/installer/README.md) for details. + +## Netdata fundamentals + +[Step 1. Netdata's building blocks](step-01.md) + +In this introductory step, we'll talk about the fundamental ideas, philosophies, and UX decisions behind Netdata. + +[Step 2. Get to know Netdata's dashboard](step-02.md) + +Visit Netdata's dashboard to explore, manipulate charts, and check out alarms. Get your first taste of visual anomaly +detection. + +[Step 3. Monitor more than one system with Netdata](step-03.md) + +While the dashboard lets you quickly move from one agent to another, Netdata Cloud is our SaaS solution for monitoring +the health of many systems. We'll cover its features and the benefits of using Netdata Cloud on top of the dashboard. + +[Step 4. The basics of configuring Netdata](step-04.md) + +While Netdata can monitor thousands of metrics in real-time without any configuration, you may _want_ to tweak some +settings based on your system's resources. + +## Intermediate steps + +[Step 5. Health monitoring alarms and notifications](step-05.md) + +Learn how to tune, silence, and write custom alarms. Then enable notifications so you never miss a change in health +status or performance anomaly. + +[Step 6. Collect metrics from more services and apps](step-06.md) + +Learn how to enable/disable collection plugins and configure a collection plugin job to add more charts to your Netdata +dashboard and begin monitoring more apps and services, like MySQL, Nginx, MongoDB, and hundreds more. + +[Step 7. Netdata's dashboard in depth](step-07.md) + +Now that you configured your Netdata monitoring agent to your exact needs, you'll dive back into metrics snapshots, +updates, and the dashboard's settings. + +## Advanced steps + +[Step 8. Building your first custom dashboard](step-08.md) + +Using simple HTML, CSS, and JavaScript, we'll build a custom dashboard that displays essential information in any format +you choose. You can even monitor many systems from a single HTML file. + +[Step 9. Long-term metrics storage](step-09.md) + +By default, Netdata can store lots of real-time metrics, but you can also tweak our custom database engine to your +heart's content. Want to take your Netdata metrics elsewhere? We're happy to help you archive data to Prometheus, +MongoDB, TimescaleDB, and others. + +[Step 10. Set up a proxy](step-10.md) + +Run Netdata behind an Nginx proxy to improve performance, and enable TLS/HTTPS for better security. + +[](<>) diff --git a/docs/guides/step-by-step/step-01.md b/docs/guides/step-by-step/step-01.md new file mode 100644 index 000000000..cdcfcd7a2 --- /dev/null +++ b/docs/guides/step-by-step/step-01.md @@ -0,0 +1,156 @@ +<!-- +title: "Step 1. Netdata's building blocks" +custom_edit_url: https://github.com/netdata/netdata/edit/master/docs/guides/step-by-step/step-01.md +--> + +# Step 1. Netdata's building blocks + +Netdata is a distributed and real-time _health monitoring and performance troubleshooting toolkit_ for monitoring your +systems and applications. + +Because the monitoring agent is highly-optimized, you can install it all your physical systems, containers, IoT devices, +and edge devices without disrupting their core function. + +By default, and without configuration, Netdata delivers real-time insights into everything happening on the system, from +CPU utilization to packet loss on every network device. Netdata can also auto-detect metrics from hundreds of your +favorite services and applications, like MySQL/MariaDB, Docker, Nginx, Apache, MongoDB, and more. + +All metrics are automatically-updated, providing interactive dashboards that allow you to dive in, discover anomalies, +and figure out the root cause analysis of any issue. + +Best of all, Netdata is entirely free, open-source software! Solo developers and enterprises with thousands of systems +can both use it free of charge. We're hosted on [GitHub](https://github.com/netdata/netdata). + +Want to learn about the history of Netdata, and what inspired our CEO to build it in the first place, and where we're +headed? Read Costa's comprehensive blog post: _[Redefining monitoring with Netdata (and how it came to +be)](https://blog.netdata.cloud/posts/redefining-monitoring-netdata/)_. + +## What you'll learn in this step + +In the first step of the Netdata guide, you'll learn about: + +- [Netdata's core features](#netdatas-core-features) +- [Why you should use Netdata](#why-you-should-use-netdata) +- [How Netdata has complementary systems, not competitors](#how-netdata-has-complementary-systems-not-competitors) + +Let's get started! + +## Netdata's core features + +Netdata has only been around for a few years, but it's a complex piece of software. Here are just some of the features +we'll cover throughout this guide. + +- A sophisticated **dashboard**, which we'll cover in [step 2](step-02.md). The real-time, highly-granular dashboard, + with hundreds of charts, is your main source of information about the health and performance of your systems/ + applications. We designed the dashboard with anomaly detection and quick analysis in mind. We'll return to + dashboard-related topics in both [step 7](step-07.md) and [step 8](step-08.md). +- **Long-term metrics storage** by default. With our new database engine, you can store days, weeks, or months of + per-second historical metrics. Or you can archive metrics to another database, like MongoDB or Prometheus. We'll + cover all these options in [step 9](step-09.md). +- **No configuration necessary**. Without any configuration, you'll get thousands of real-time metrics and hundreds of + alarms designed by our community of sysadmin experts. But you _can_ configure Netdata in a lot of ways, some of + which we'll cover in [step 4](step-04.md). +- **Distributed, per-system installation**. Instead of centralizing metrics in one location, you install Netdata on + _every_ system, and each system is responsible for its metrics. Having distributed agents reduces cost and lets + Netdata run on devices with little available resources, such as IoT and edge devices, without affecting their core + purpose. +- **Sophisticated health monitoring** to ensure you always know when an anomaly hits. In [step 5](step-05.md), we dive + into how you can tune alarms, write your own alarm, and enable two types of notifications. +- **High-speed, low-resource collectors** that allow you to collect thousands of metrics every second while using only + a fraction of your system's CPU resources and a few MiB of RAM. +- **Netdata Cloud** is our SaaS toolkit that helps Netdata users monitor the health and performance of entire + infrastructures, whether they are two or two thousand (or more!) systems. We'll cover Netdata Cloud in [step + 3](step-03.md). + +## Why you should use Netdata + +Because you care about the health and performance of your systems and applications, and all of the awesome features we +just mentioned. And it's free! + +All these may be valid reasons, but let's step back and talk about Netdata's _principles_ for health monitoring and +performance troubleshooting. We have a lot of [complementary +systems](#how-netdata-has-complementary-systems-not-competitors), and we think there's a good reason why Netdata should +always be your first choice when troubleshooting an anomaly. + +We built Netdata on four principles. + +### Per-second data collection + +Our first principle is per-second data collection for all metrics. + +That matters because you can't monitor a 2-second service-level agreement (SLA) with 10-second metrics. You can't detect +quick anomalies if your metrics don't show them. + +How do we solve this? By decentralizing monitoring. Each node is responsible for collecting metrics, triggering alarms, +and building dashboards locally, and we work hard to ensure it does each step (and others) with remarkable efficiency. +For example, Netdata can [collect 100,000 metrics](https://github.com/netdata/netdata/issues/1323) every second while +using only 9% of a single server-grade CPU core! + +By decentralizing monitoring and emphasizing speed at every turn, Netdata helps you scale your health monitoring and +performance troubleshooting to an infrastructure of every size. _And_ you get to keep per-second metrics in long-term +storage thanks to the database engine. + +### Unlimited metrics + +We believe all metrics are fundamentally important, and all metrics should be available to the user. + +If you don't collect _all_ the metrics a system creates, you're only seeing part of the story. It's like saying you've +read a book after skipping all but the last ten pages. You only know the ending, not everything that leads to it. + +Most monitoring solutions exist to poke you when there's a problem, and then tell you to use a dozen different console +tools to find the root cause. Netdata prefers to give you every piece of information you might need to understand why an +anomaly happened. + +### Meaningful presentation + +We want every piece of Netdata's dashboard not only to look good and update every second, but also provide context as to +what you're looking at and why it matters. + +The principle of meaningful presentation is fundamental to our dashboard's user experience (UX). We could have put +charts in a grid or hidden some behind tabs or buttons. We instead chose to stack them vertically, on a single page, so +you can visually see how, for example, a jump in disk usage can also increase system load. + +Here's an example of a system undergoing a disk stress test: + +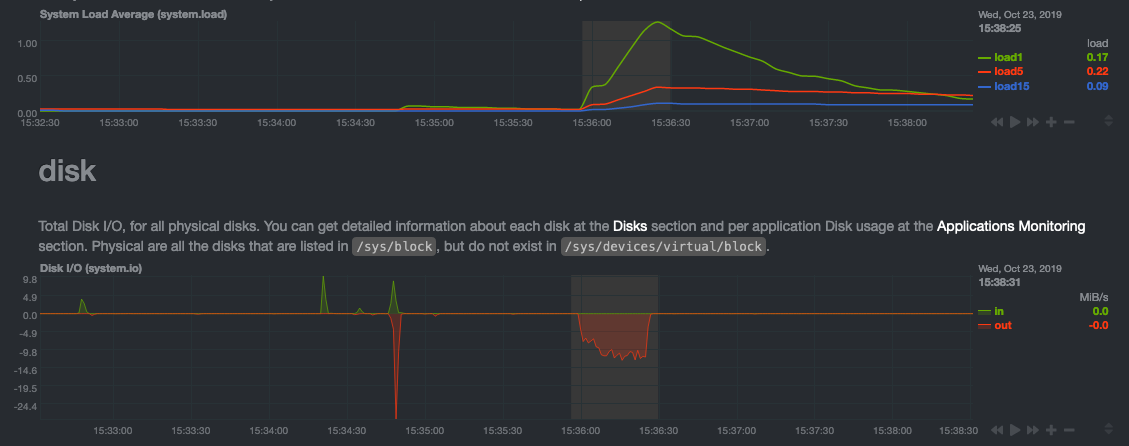 + +> For the curious, here's the command: `stress-ng --fallocate 4 --fallocate-bytes 4g --timeout 1m --metrics --verify +> --times`! + +### Immediate results + +Finally, Netdata should be usable from the moment you install it. + +As we've talked about, and as you'll learn in the following nine steps, Netdata comes installed with: + +- Auto-detected metrics +- Human-readable units +- Metrics that are structured into charts, families, and contexts +- Automatically generated dashboards +- Charts designed for visual anomaly detection +- Hundreds of pre-configured alarms + +By standardizing your monitoring infrastructure, Netdata tries to make at least one part of your administrative tasks +easy! + +## How Netdata has complementary systems, not competitors + +We'll cover this quickly, as you're probably eager to get on with using Netdata itself. + +We don't want to lock you in to using Netdata by itself, and forever. By supporting [archiving to +external databases](/exporting/README.md) like Graphite, Prometheus, OpenTSDB, MongoDB, and others, you can use Netdata _in +conjunction_ with software that might seem like our competitors. + +We don't want to "wage war" with another monitoring solution, whether it's commercial, open-source, or anything in +between. We just want to give you all the metrics every second, and what you do with them next is your business, not +ours. Our mission is helping people create more extraordinary infrastructures! + +## What's next? + +We think it's imperative you understand why we built Netdata the way we did. But now that we have that behind us, let's +get right into that dashboard you've heard so much about. + +[Next: Get to know Netdata's dashboard →](step-02.md) + +[](<>) diff --git a/docs/guides/step-by-step/step-02.md b/docs/guides/step-by-step/step-02.md new file mode 100644 index 000000000..c87712c9a --- /dev/null +++ b/docs/guides/step-by-step/step-02.md @@ -0,0 +1,208 @@ +<!-- +title: "Step 2. Get to know Netdata's dashboard" +date: 2020-05-04 +custom_edit_url: https://github.com/netdata/netdata/edit/master/docs/guides/step-by-step/step-02.md +--> + +# Step 2. Get to know Netdata's dashboard + +Welcome to Netdata proper! Now that you understand how Netdata works, how it's built, and why we built it, you can start +working with the dashboard directly. + +This step-by-step guide assumes you've already installed Netdata on a system of yours. If you haven't yet, hop back over +to ["step 0"](step-00.md#before-we-get-started) for information about our one-line installer script. Or, view the +[installation docs](/packaging/installer/README.md) to learn more. Once you have Netdata installed, you can hop back +over here and dig in. + +## What you'll learn in this step + +In this step of the Netdata guide, you'll learn how to: + +- [Visit and explore the dashboard](#visit-and-explore-the-dashboard) +- [Explore available charts using menus](#explore-available-charts-using-menus) +- [Read the descriptions accompanying charts](#read-the-descriptions-accompanying-charts) +- [Interact with charts](#interact-with-charts) +- [See raised alarms and the alarm log](#see-raised-alarms-and-the-alarm-log) + +Let's get started! + +## Visit and explore the dashboard + +Netdata's dashboard is where you interact with your system's metrics. Time to open it up and start exploring. Open up +your browser of choice. + +Open up your web browser of choice and navigate to `http://NODE:19999`, replacing `NODE` with the IP address or hostname +of your Agent. If you're unsure, try `http://localhost:19999` first. Hit **Enter**. Welcome to Netdata! + + + +> From here on out in this guide, we'll refer to the address you use to view your dashboard as `NODE`. Be sure to +> replace it with either `localhost`, the IP address, or the hostname of your system. + +## Explore available charts using menus + +**Menus** are located on the right-hand side of the Netdata dashboard. You can use these to navigate to the +charts you're interested in. + + + +Netdata shows all its charts on a single page, so you can also scroll up and down using the mouse wheel, your +touchscreen/touchpad, or the scrollbar. + +Both menus and the items displayed beneath them, called **submenus**, are populated automatically by Netdata based on +what it's collecting. If you run Netdata on many different systems using different OS types or versions, the +menus and submenus may look a little different for each one. + +To learn more about menus, see our documentation about [navigating the standard +dashboard](/web/gui/README.md#metrics-menus). + +> ❗ By default, Netdata only creates and displays charts if the metrics are _not zero_. So, you may be missing some +> charts, menus, and submenus if those charts have zero metrics. You can change this by changing the **Which dimensions +> to show?** setting to **All**. In addition, if you start Netdata and immediately load the dashboard, not all +> charts/menus/submenus may be displayed, as some collectors can take a while to initialize. + +## Read the descriptions accompanying charts + +Many charts come with a short description of what dimensions the chart is displaying and why they matter. + +For example, here's the description that accompanies the **swap** chart. + + + +If you're new to health monitoring and performance troubleshooting, we recommend you spend some time reading these +descriptions and learning more at the pages linked above. + +## Understand charts, dimensions, families, and contexts + +A **chart** is an interactive visualization of one or more collected/calculated metrics. You can see the name (also +known as its unique ID) of a chart by looking at the top-left corner of a chart and finding the parenthesized text. On a +Linux system, one of the first charts on the dashboard will be the system CPU chart, with the name `system.cpu`: + + + +A **dimension** is any value that gets shown on a chart. The value can be raw data or calculated values, such as +percentages, aggregates, and more. Most charts will have more than one dimension, in which case it will display each in +a different color. Here, a `system.cpu` chart is showing many dimensions, such as `user`, `system`, `softirq`, `irq`, +and more. + +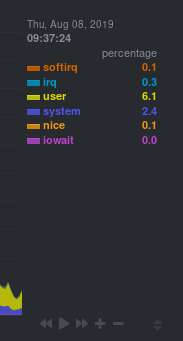 + +A **family** is _one_ instance of a monitored hardware or software resource that needs to be monitored and displayed +separately from similar instances. For example, if your system has multiple partitions, Netdata will create different +families for `/`, `/boot`, `/home`, and so on. Same goes for entire disks, network devices, and more. + + + +A **context** groups several charts based on the types of metrics being collected and displayed. For example, the +**Disk** section often has many contexts: `disk.io`, `disk.ops`, `disk.backlog`, `disk.util`, and so on. Netdata uses +this context to create individual charts and then groups them by family. You can always see the context of any chart by +looking at its name or hovering over the chart's date. + +It's important to understand these differences, as Netdata uses charts, dimensions, families, and contexts to create +health alarms and configure collectors. To read even more about the differences between all these elements of the +dashboard, and how they affect other parts of Netdata, read our [dashboards +documentation](/web/README.md#charts-contexts-families). + +## Interact with charts + +We built Netdata to be a big sandbox for learning more about your systems and applications. Time to play! + +Netdata's charts are fully interactive. You can pan through historical metrics, zoom in and out, select specific +timeframes for further analysis, resize charts, and more. + +Best of all, Whenever you use a chart in this way, Netdata synchronizes all the other charts to match it. + + + +### Pan, zoom, highlight, and reset charts + +You can change how charts show their metrics in a few different ways, each of which have a few methods: + +| Change | Method #1 | Method #2 | Method #3 | +| ------------------------------------------------- | ----------------------------------- | --------------------------------------------------------- | ---------------------------------------------------------- | +| **Reset** charts to default auto-refreshing state | `double click` | `double tap` (touchpad/touchscreen) | | +| **Select** a certain timeframe | `ALT` + `mouse selection` | `⌘` + `mouse selection` (macOS) | | +| **Pan** forward or back in time | `click and drag` | `touch and drag` (touchpad/touchscreen) | | +| **Zoom** to a specific timeframe | `SHIFT` + `mouse selection` | | | +| **Zoom** in/out | `SHIFT`/`ALT` + `mouse scrollwheel` | `SHIFT`/`ALT` + `two-finger pinch` (touchpad/touchscreen) | `SHIFT`/`ALT` + `two-finger scroll` (touchpad/touchscreen) | + +These interactions can also be triggered using the icons on the bottom-right corner of every chart. They are, +respectively, `Pan Left`, `Reset`, `Pan Right`, `Zoom In`, and `Zoom Out`. + +### Show and hide dimensions + +Each dimension can be hidden by clicking on it. Hiding dimensions simplifies the chart and can help you better discover +exactly which aspect of your system is behaving strangely. + +### Resize charts + +Additionally, resize charts by clicking-and-dragging the icon on the bottom-right corner of any chart. To restore the +chart to its original height, double-click the same icon. + + + +To learn more about other options and chart interactivity, read our [dashboard documentation](/web/README.md). + +## See raised alarms and the alarm log + +Aside from performance troubleshooting, the Agent helps you monitor the health of your systems and applications. That's +why every Netdata installation comes with dozens of pre-configured alarms that trigger alerts when your system starts +acting strangely. + +Find the **Alarms** button in the top navigation bring up a modal that shows currently raised alarms, all running +alarms, and the alarms log. + +Here is an example of a raised `system.cpu` alarm, followed by the full list and alarm log: + + + +And a static screenshot of the raised CPU alarm: + + + +The alarm itself is named *system - cpu**, and its context is `system.cpu`. Beneath that is an auto-updating badge that +shows the latest value the chart that triggered the alarm. + +With the three icons beneath that and the **role** designation, you can: + +1. Scroll to the chart associated with this raised alarm. +2. Copy a link to the badge to your clipboard. +3. Copy the code to embed the badge onto another web page using an `<embed>` element. + +The table on the right-hand side displays information about the alarm's configuration. In above example, Netdata +triggers a warning alarm when CPU usage is between 75 and 85%, and a critical alarm when above 85%. It's a _little_ more +complicated than that, but we'll get into more complex health entity configurations in a later step. + +The `calculation` field is the equation used to calculate those percentages, and the `check every` field specifies how +often Netdata should be calculating these metrics to see if the alarm should remain triggered. + +The `execute` field tells Netdata how to notify you about this alarm, and the `source` field lets you know where you can +find the configuration file, if you'd like to edit its configuration. + +We'll cover alarm configuration in more detail later in the guide, so don't worry about it too much for now! Right +now, it's most important that you understand how to see alarms, and parse their details, if and when they appear on your +system. + +## What's next? + +In this step of the Netdata guide, you learned how to: + +- Visit the dashboard +- Explore available charts (using the right-side menu) +- Read the descriptions accompanying charts +- Interact with charts +- See raised alarms and the alarm log + +Next, you'll learn how to monitor multiple nodes through the dashboard. + +[Next: Monitor more than one system with Netdata →](step-03.md) + +[](<>) diff --git a/docs/guides/step-by-step/step-03.md b/docs/guides/step-by-step/step-03.md new file mode 100644 index 000000000..2319adb44 --- /dev/null +++ b/docs/guides/step-by-step/step-03.md @@ -0,0 +1,91 @@ +<!-- +title: "Step 3. Monitor more than one system with Netdata" +date: 2020-05-01 +custom_edit_url: https://github.com/netdata/netdata/edit/master/docs/guides/step-by-step/step-03.md +--> + +# Step 3. Monitor more than one system with Netdata + +The Netdata agent is _distributed_ by design. That means each agent operates independently from any other, collecting +and creating charts only for the system you installed it on. We made this decision a long time ago to [improve security +and performance](step-01.md). + +You might be thinking, "So, now I have to remember all these IP addresses, and type them into my browser +manually, to move from one system to another? Maybe I should just make a bunch of bookmarks. What's a few more tabs +on top of the hundred I have already?" + +We get it. That's why we built [Netdata Cloud](https://learn.netdata.cloud/docs/cloud/), which connects many distributed +agents for a seamless experience when monitoring an entire infrastructure of Netdata-monitored nodes. + + + +## What you'll learn in this step + +In this step of the Netdata guide, we'll talk about the following: + +- [Why you should use Netdata Cloud](#why-use-netdata-cloud) +- [Get started with Netdata Cloud](#get-started-with-netdata-cloud) +- [Navigate between dashboards with Visited Nodes](#navigate-between-dashboards-with-visited-nodes) + +## Why use Netdata Cloud? + +Our [Cloud documentation](https://learn.netdata.cloud/docs/cloud/) does a good job (we think!) of explaining why Cloud +gives you a ton of value at no cost: + +> Netdata Cloud gives you real-time visibility for your entire infrastructure. With Netdata Cloud, you can run all your +> distributed Agents in headless mode _and_ access the real-time metrics and insightful charts from their dashboards. +> View key metrics and active alarms at-a-glance, and then seamlessly dive into any of your distributed dashboards +> without leaving Cloud's centralized interface. + +You can add as many nodes and team members as you need, and as our free and open source Agent gets better with more +features, new collectors for more applications, and improved UI, so will Cloud. + +## Get started with Netdata Cloud + +Signing in, onboarding, and claiming your first nodes only takes a few minutes, and we have a [Get started with +Cloud](https://learn.netdata.cloud/docs/cloud/get-started) guide to help you walk through every step. + +Or, if you're feeling confident, dive right in. + +<p><a href="https://app.netdata.cloud" className="button button--lg">Sign in to Cloud</a></p> + +When you finish that guide, circle back to this step in the guide to learn how to use the Visited Nodes feature on +top of Cloud's centralized web interface. + +## Navigate between dashboards with Visited Nodes + +To add nodes to your visited nodes, you first need to navigate to that node's dashboard, then click the **Sign in** +button at the top of the dashboard. On the screen that appears, which states your node is requesting access to your +Netdata Cloud account, sign in with your preferred method. + +Cloud redirects you back to your node's dashboard, which is now connected to your Netdata Cloud account. You can now see the menu populated by a single visited node. + +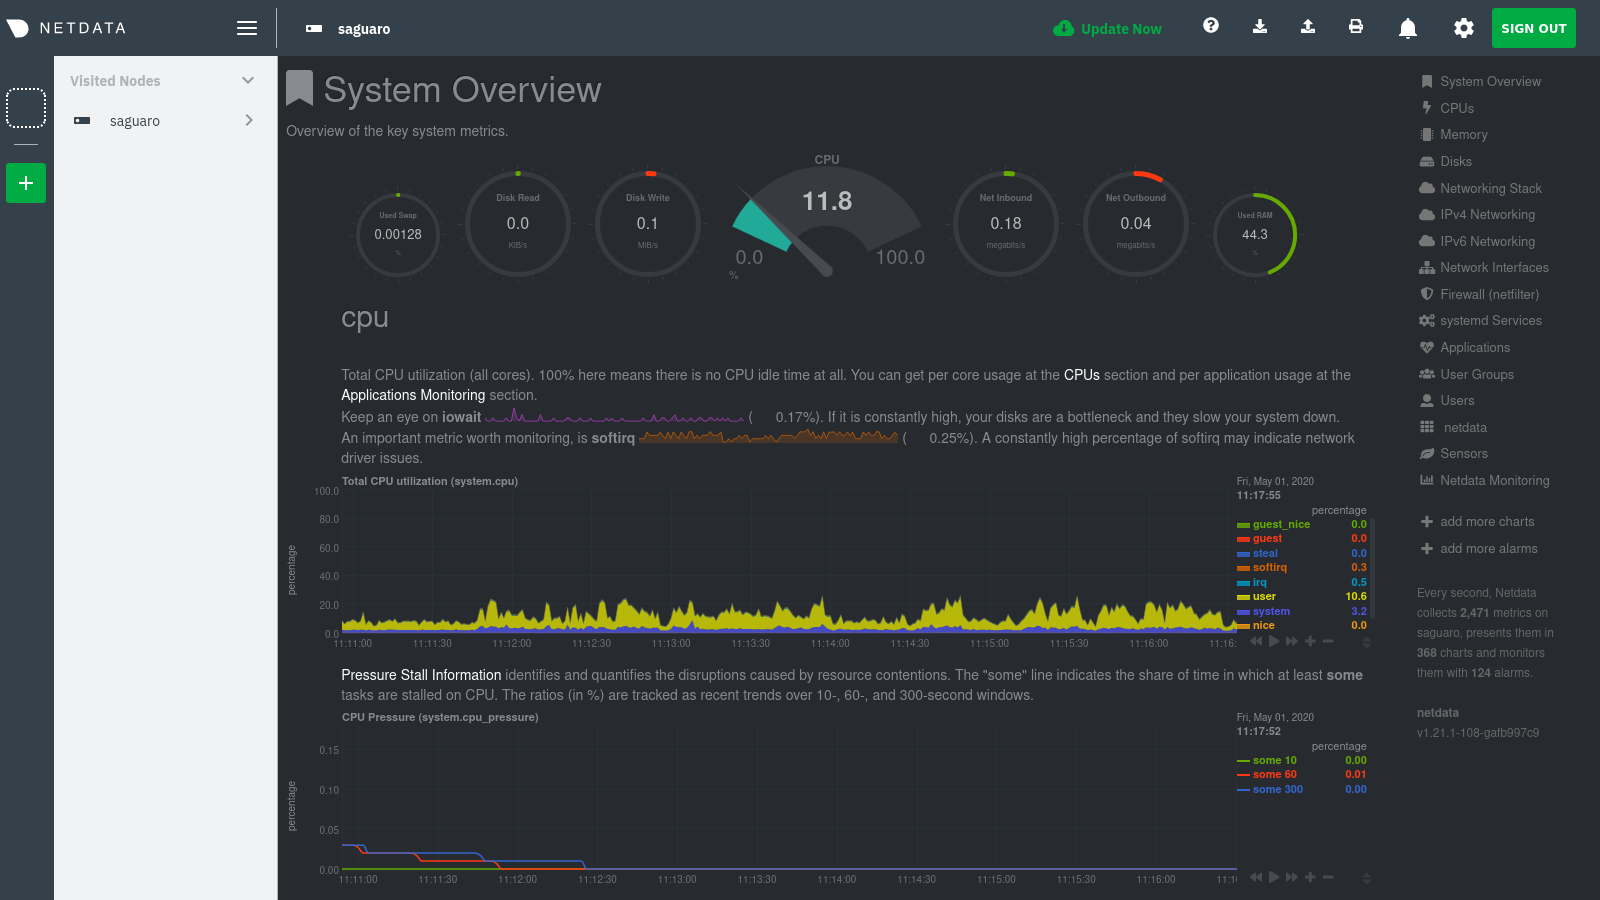 + +If you previously went through the Cloud onboarding process to create a Space and War Room, you will also see these +alongside your visited nodes. You can click on your Space or any of your War Rooms to navigate to Netdata Cloud and +continue monitoring your infrastructure from there. + +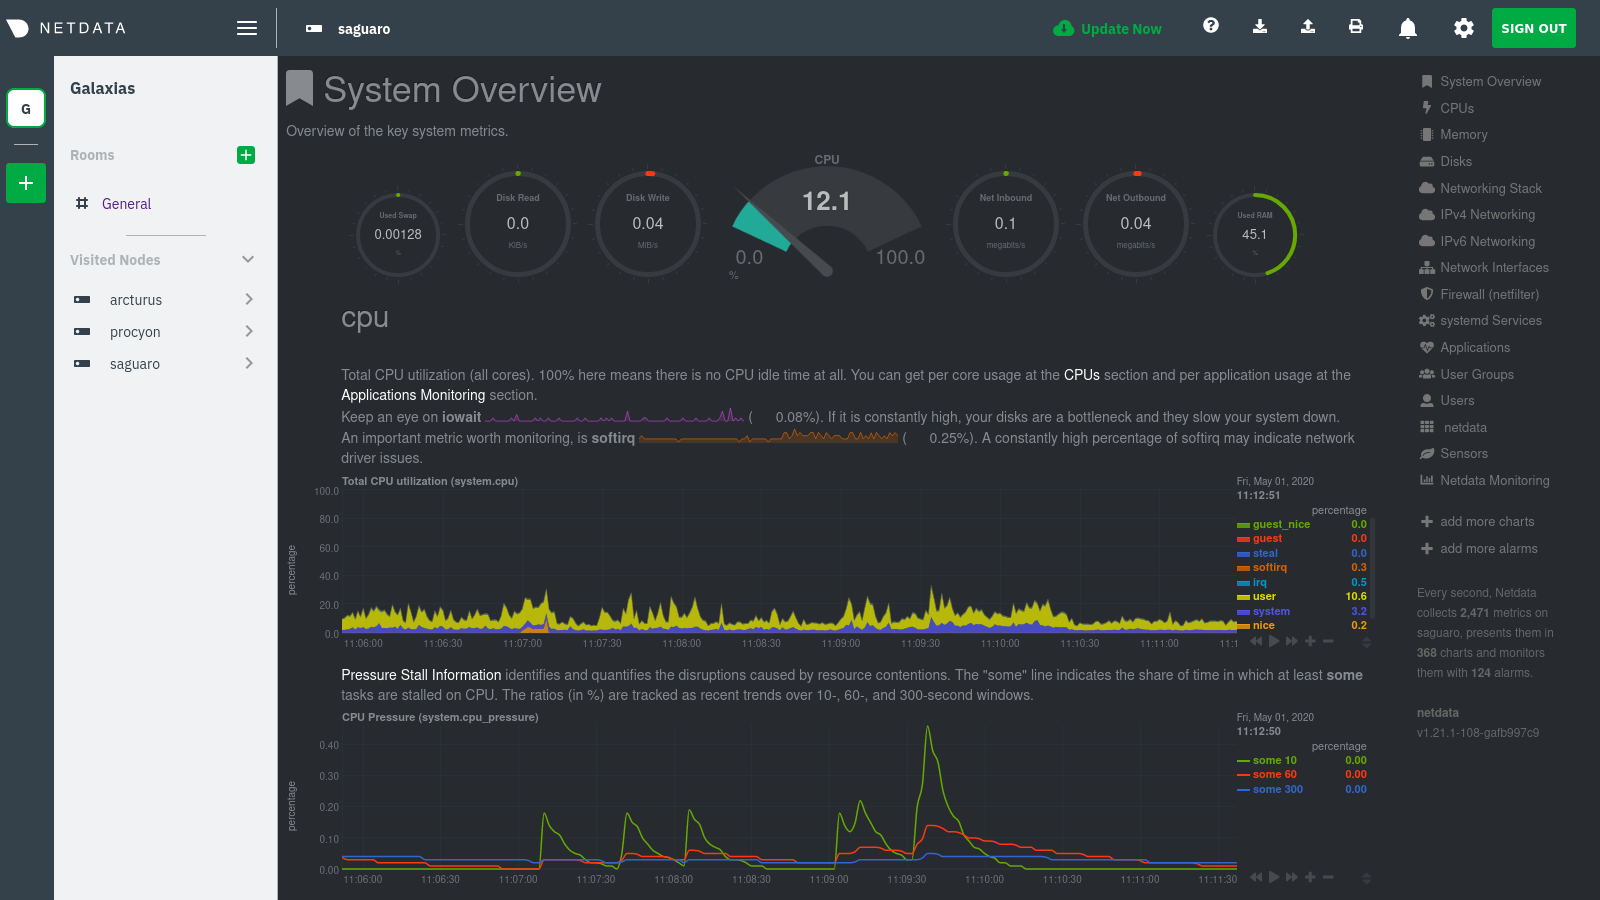 + +To add other visited nodes, navigate to their dashboard and sign in to Cloud by clicking on the **Sign in** button. This +process connects that node to your Cloud account and further populates the menu. + +Once you've added more than one node, you can use the menu to switch between various dashboards without remembering IP +addresses or hostnames or saving bookmarks for every node you want to monitor. + + + +## What's next? + +Now that you have a Netdata Cloud account with a claimed node (or a few!) and can navigate between your dashboards with +Visited nodes, it's time to learn more about how you can configure Netdata to your liking. From there, you'll be able to +customize your Netdata experience to your exact infrastructure and the information you need. + +[Next: The basics of configuring Netdata →](step-04.md) + +[](<>) diff --git a/docs/guides/step-by-step/step-04.md b/docs/guides/step-by-step/step-04.md new file mode 100644 index 000000000..0495145f4 --- /dev/null +++ b/docs/guides/step-by-step/step-04.md @@ -0,0 +1,144 @@ +<!-- +title: "Step 4. The basics of configuring Netdata" +date: 2020-03-31 +custom_edit_url: https://github.com/netdata/netdata/edit/master/docs/guides/step-by-step/step-04.md +--> + +# Step 4. The basics of configuring Netdata + +Welcome to the fourth step of the Netdata guide. + +Since the beginning, we've covered the building blocks of Netdata, dashboard basics, and how you can monitor many +individual systems using many distributed Netdata agents. + +Next up: configuration. + +## What you'll learn in this step + +We'll talk about Netdata's default configuration, and then you'll learn how to do the following: + +- [Find your `netdata.conf` file](#find-your-netdataconf-file) +- [Use edit-config to open `netdata.conf`](#use-edit-config-to-open-netdataconf) +- [Navigate the structure of `netdata.conf`](#the-structure-of-netdataconf) +- [Edit your `netdata.conf` file](#edit-your-netdataconf-file) + +## Find your `netdata.conf` file + +Netdata primarily uses the `netdata.conf` file to configure its core functionality. `netdata.conf` resides within your +**Netdata config directory**. + +The location of that directory and `netdata.conf` depends on your operating system and the method you used to install +Netdata. + +The most reliable method of finding your Netdata config directory is loading your `netdata.conf` on your browser. Open a +tab and navigate to `http://HOST:19999/netdata.conf`. Your browser will load a text document that looks like this: + +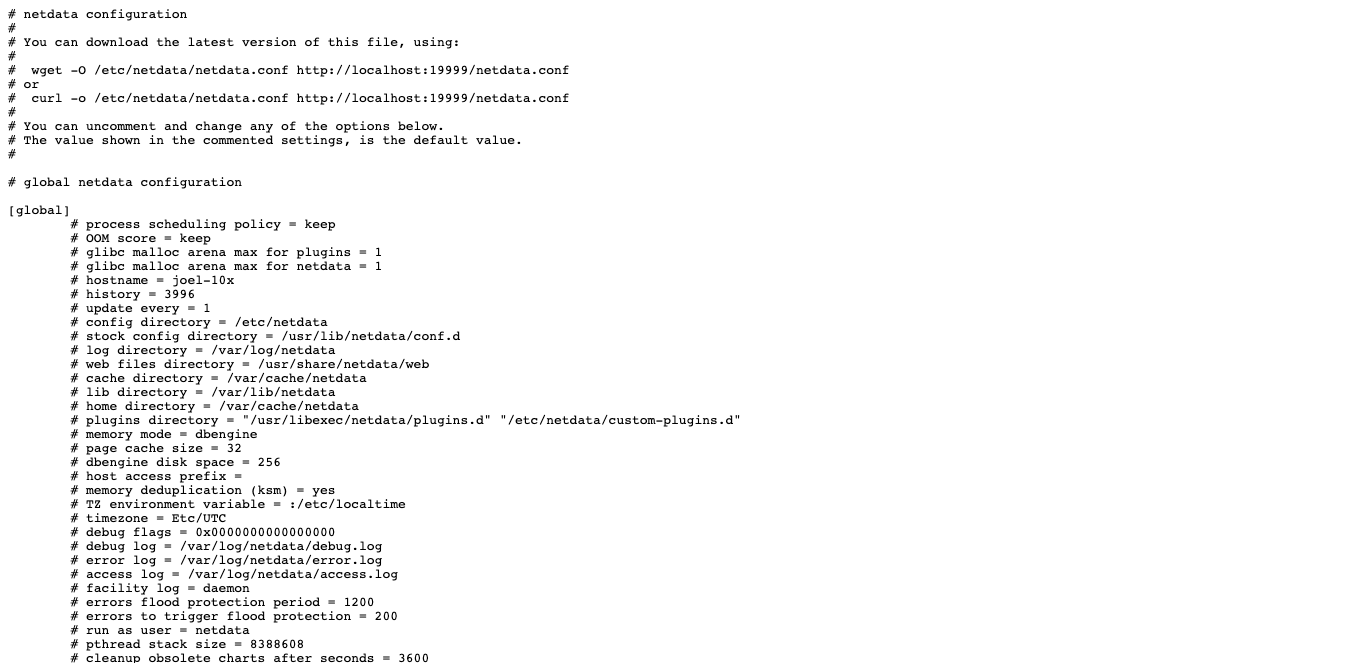 + +Look for the line that begins with `# config directory = `. The text after that will be the path to your Netdata config +directory. + +In the system represented by the screenshot, the line reads: `config directory = /etc/netdata`. That means +`netdata.conf`, and all the other configuration files, can be found at `/etc/netdata`. + +> For more details on where your Netdata config directory is, take a look at our [installation +> instructions](/packaging/installer/README.md). + +For the rest of this guide, we'll assume you're editing files or running scripts from _within_ your **Netdata +configuration directory**. + +## Use edit-config to open `netdata.conf` + +Inside your Netdata config directory, there is a helper scripted called `edit-config`. This script will open existing +Netdata configuration files using a text editor. Or, if the configuration file doesn't yet exist, the script will copy +an example file to your Netdata config directory and then allow you to edit it before saving it. + +> `edit-config` will use the `EDITOR` environment variable on your system to edit the file. On many systems, that is +> defaulted to `vim` or `nano`. We highly recommend `nano` for beginners. To change this variable for the current +> session (it will revert to the default when you reboot), export a new value: `export EDITOR=nano`. Or, [make the +> change permanent](https://stackoverflow.com/questions/13046624/how-to-permanently-export-a-variable-in-linux). + +Let's give it a shot. Navigate to your Netdata config directory. To use `edit-config` on `netdata.conf`, you need to +have permissions to edit the file. On Linux/macOS systems, you can usually use `sudo` to elevate your permissions. + +```bash +cd /etc/netdata # Replace this path with your Netdata config directory, if different as found in the steps above +sudo ./edit-config netdata.conf +``` + +You should now see `netdata.conf` your editor! Let's walk through how the file is structured. + +## The structure of `netdata.conf` + +There are two main parts of the file to note: **sections** and **options**. + +The `netdata.conf` file is broken up into various **sections**, such as `[global]`, `[web]`, and `[registry]`. Each +section contains the configuration options for some core component of Netdata. + +Each section also contains many **options**. Options have a name and a value. With the option `config directory = +/etc/netdata`, `config directory` is the name, and `/etc/netdata` is the value. + +Most lines are **commented**, in that they start with a hash symbol (`#`), and the value is set to a sane default. To +tell Netdata that you'd like to change any option from its default value, you must **uncomment** it by removing that +hash. + +### Edit your `netdata.conf` file + +Let's try editing the options in `netdata.conf` to see how the process works. + +First, add a fake option to show you how Netdata loads its configuration files. Add a `test` option under the `[global]` +section and give it the value of `1`. + +```conf +[global] + test = 1 +``` + +Restart Netdata with `service restart netdata` or the [appropriate +alternative](/docs/getting-started.md#start-stop-and-restart-netdata) for your system. + +Now, open up your browser and navigate to `http://HOST:19999/netdata.conf`. You'll see that Netdata has recognized +that our fake option isn't valid and added a notice that Netdata will ignore it. + +Here's the process in GIF form! + + + +Now, let's make a slightly more substantial edit to `netdata.conf`: change the Agent's name. + +If you edit the value of the `hostname` option, you can change the name of your Netdata Agent on the dashboard and a +handful of other places, like the Visited nodes menu _and_ Netdata Cloud. + +Use `edit-config` to change the `hostname` option to a name like `hello-world`. Be sure to uncomment it! + +```conf +[global] + hostname = hello-world +``` + +Once you're done, restart Netdata and refresh the dashboard. Say hello to your renamed agent! + + + +Netdata has dozens upon dozens of options you can change. To see them all, read our [daemon +configuration](/daemon/config/README.md), or hop into our popular guide on [increasing long-term metrics +storage](/docs/guides/longer-metrics-storage.md). + +## What's next? + +At this point, you should be comfortable with getting to your Netdata directory, opening and editing `netdata.conf`, and +seeing your changes reflected in the dashboard. + +Netdata has many more configuration files that you might want to change, but we'll cover those in the following steps of +this guide. + +In the next step, we're going to cover one of Netdata's core functions: monitoring the health of your systems via alarms +and notifications. You'll learn how to disable alarms, create new ones, and push notifications to the system of your +choosing. + +[Next: Health monitoring alarms and notifications →](step-05.md) + +[](<>) diff --git a/docs/guides/step-by-step/step-05.md b/docs/guides/step-by-step/step-05.md new file mode 100644 index 000000000..5e627632d --- /dev/null +++ b/docs/guides/step-by-step/step-05.md @@ -0,0 +1,343 @@ +<!-- +title: "Step 5. Health monitoring alarms and notifications" +custom_edit_url: https://github.com/netdata/netdata/edit/master/docs/guides/step-by-step/step-05.md +--> + +# Step 5. Health monitoring alarms and notifications + +In the fifth step of the Netdata guide, we're introducing you to one of our core features: **health monitoring**. + +To accurately monitor the health of your systems and applications, you need to know _immediately_ when there's something +strange going on. Netdata's alarm and notification systems are essential to keeping you informed. + +Netdata comes with hundreds of pre-configured alarms that don't require configuration. They were designed by our +community of system administrators to cover the most important parts of production systems, so, in many cases, you won't +need to edit them. + +Luckily, Netdata's alarm and notification system are incredibly adaptable to your infrastructure's unique needs. + +## What you'll learn in this step + +We'll talk about Netdata's default configuration, and then you'll learn how to do the following: + +- [Tune Netdata's pre-configured alarms](#tune-netdatas-pre-configured-alarms) +- [Write your first health entity](#write-your-first-health-entity) +- [Enable Netdata's notification systems](#enable-netdatas-notification-systems) + +## Tune Netdata's pre-configured alarms + +First, let's tune an alarm that came pre-configured with your Netdata installation. + +The first chart you see on any Netdata dashboard is the `system.cpu` chart, which shows the system's CPU utilization +across all cores. To figure out which file you need to edit to tune this alarm, click the **Alarms** button at the top +of the dashboard, click on the **All** tab, and find the **system - cpu** alarm entity. + +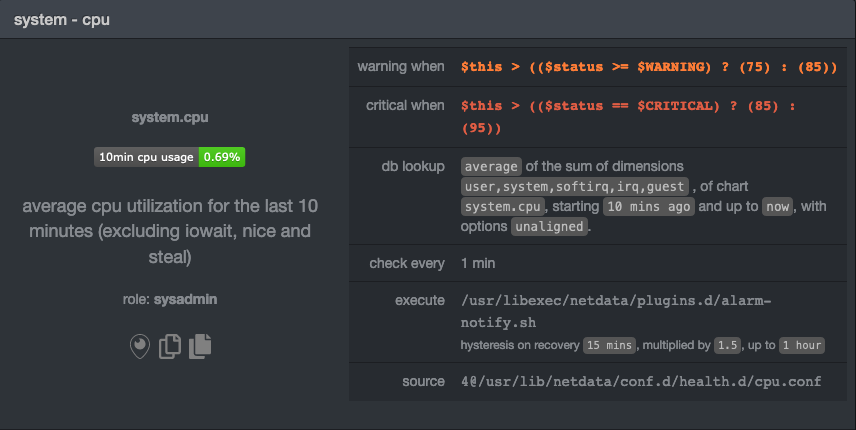 + +Look at the `source` row in the table. This means the `system.cpu` chart sources its health alarms from +`4@/usr/lib/netdata/conf.d/health.d/cpu.conf`. To tune these alarms, you'll need to edit the alarm file at +`health.d/cpu.conf`. Go to your [Netdata config directory](step-04.md#find-your-netdataconf-file) and use the +`edit-config` script. + +```bash +sudo ./edit-config health.d/cpu.conf +``` + +The first **health entity** in that file looks like this: + +```yaml +template: 10min_cpu_usage + on: system.cpu + os: linux + hosts: * + lookup: average -10m unaligned of user,system,softirq,irq,guest + units: % + every: 1m + warn: $this > (($status >= $WARNING) ? (75) : (85)) + crit: $this > (($status == $CRITICAL) ? (85) : (95)) + delay: down 15m multiplier 1.5 max 1h + info: average cpu utilization for the last 10 minutes (excluding iowait, nice and steal) + to: sysadmin +``` + +Let's say you want to tune this alarm to trigger warning and critical alarms at a lower CPU utilization. You can change +the `warn` and `crit` lines to the values of your choosing. For example: + +```yaml + warn: $this > (($status >= $WARNING) ? (60) : (75)) + crit: $this > (($status == $CRITICAL) ? (75) : (85)) +``` + +You _can_ [restart Netdata](/docs/getting-started.md#start-stop-and-restart-netdata) to enable your tune, but you can +also reload _only_ the health monitoring component using one of the available [methods](/health/QUICKSTART.md#reload-health-configuration). + +You can also tune any other aspect of the default alarms. To better understand how each line in a health entity works, +read our [health documentation](/health/README.md). + +### Silence an individual alarm + +Many Netdata users don't need all the default alarms enabled. Instead of disabling any given alarm, or even _all_ +alarms, you can silence individual alarms by changing one line in a given health entity. Let's look at that +`health/cpu.conf` file again. + +```yaml +template: 10min_cpu_usage + on: system.cpu + os: linux + hosts: * + lookup: average -10m unaligned of user,system,softirq,irq,guest + units: % + every: 1m + warn: $this > (($status >= $WARNING) ? (75) : (85)) + crit: $this > (($status == $CRITICAL) ? (85) : (95)) + delay: down 15m multiplier 1.5 max 1h + info: average cpu utilization for the last 10 minutes (excluding iowait, nice and steal) + to: sysadmin +``` + +To silence this alarm, change `sysadmin` to `silent`. + +```yaml + to: silent +``` + +Use `netdatacli reload-health` to reload your health configuration. You can add `to: silent` to any alarm you'd rather not +bother you with notifications. + +## Write your first health entity + +The best way to understand how health entities work is building your own and experimenting with the options. To start, +let's build a health entity that triggers an alarm when system RAM usage goes above 80%. + +The first line in a health entity will be `alarm:`. This is how you name your entity. You can give it any name you +choose, but the only symbols allowed are `.` and `_`. Let's call the alarm `ram_usage`. + +```yaml + alarm: ram_usage +``` + +> You'll see some funky indentation in the lines coming up. Don't worry about it too much! Indentation is not important +> to how Netdata processes entities, and it will make sense when you're done. + +Next, you need to specify which chart this entity listens via the `on:` line. You're declaring that you want this alarm +to check metrics on the `system.ram` chart. + +```yaml + on: system.ram +``` + +Now comes the `lookup`. This line specifies what metrics the alarm is looking for, what duration of time it's looking +at, and how to process the metrics into a more usable format. + +```yaml +lookup: average -1m percentage of used +``` + +Let's take a moment to break this line down. + +- `average`: Calculate the average of all the metrics collected. +- `-1m`: Use metrics from 1 minute ago until now to calculate that average. +- `percentage`: Clarify that you want to calculate a percentage of RAM usage. +- `of used`: Specify which dimension (`used`) on the `system.ram` chart you want to monitor with this entity. + +In other words, you're taking 1 minute's worth of metrics from the `used` dimension on the `system.ram` chart, +calculating their average, and returning it as a percentage. + +You can move on to the `units` line, which lets Netdata know that we're working with a percentage and not an absolute +unit. + +```yaml + units: % +``` + +Next, the `every` line tells Netdata how often to perform the calculation you specified in the `lookup` line. For +certain alarms, you might want to use a shorter duration, which you can specify using values like `10s`. + +```yaml + every: 1m +``` + +We'll put the next two lines—`warn` and `crit`—together. In these lines, you declare at which percentage you want to +trigger a warning or critical alarm. Notice the variable `$this`, which is the value calculated by the `lookup` line. +These lines will trigger a warning if that average RAM usage goes above 80%, and a critical alert if it's above 90%. + +```yaml + warn: $this > 80 + crit: $this > 90 +``` + +> ❗ Most default Netdata alarms come with more complicated `warn` and `crit` lines. You may have noticed the line `warn: +> $this > (($status >= $WARNING) ? (75) : (85))` in one of the health entity examples above, which is an example of +> using the [conditional operator for hysteresis](/health/REFERENCE.md#special-use-of-the-conditional-operator). +> Hysteresis is used to keep Netdata from triggering a ton of alerts if the metric being tracked quickly goes above and +> then falls below the threshold. For this very simple example, we'll skip hysteresis, but recommend implementing it in +> your future health entities. + +Finish off with the `info` line, which creates a description of the alarm that will then appear in any +[notification](#enable-netdatas-notification-systems) you set up. This line is optional, but it has value—think of it as +documentation for a health entity! + +```yaml + info: The percentage of RAM being used by the system. +``` + +Here's what the entity looks like in full. Now you can see why we indented the lines, too. + +```yaml + alarm: ram_usage + on: system.ram +lookup: average -1m percentage of used + units: % + every: 1m + warn: $this > 80 + crit: $this > 90 + info: The percentage of RAM being used by the system. +``` + +What about what it looks like on the Netdata dashboard? + +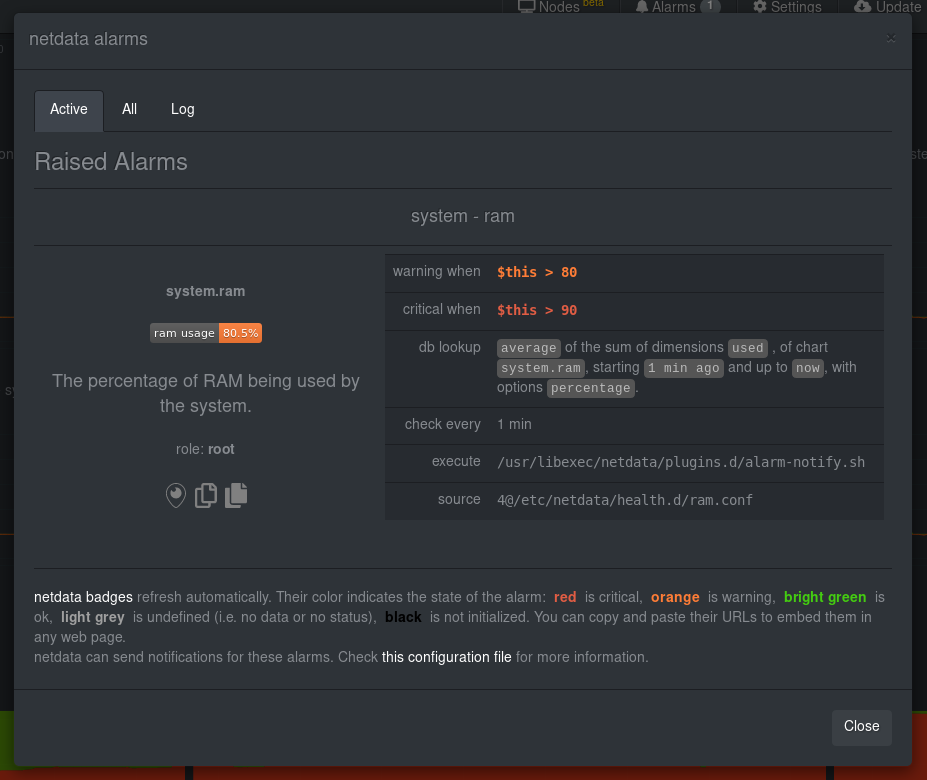 + +If you'd like to try this alarm on your system, you can install a small program called +[stress](http://manpages.ubuntu.com/manpages/disco/en/man1/stress.1.html) to create a synthetic load. Use the command +below, and change the `8G` value to a number that's appropriate for the amount of RAM on your system. + +```bash +stress -m 1 --vm-bytes 8G --vm-keep +``` + +Netdata is capable of understanding much more complicated entities. To better understand how they work, read the [health +documentation](/health/README.md), look at some [examples](/health/REFERENCE.md#example-alarms), and open the files +containing the default entities on your system. + +## Enable Netdata's notification systems + +Health alarms, while great on their own, are pretty useless without some way of you knowing they've been triggered. +That's why Netdata comes with a notification system that supports more than a dozen services, such as email, Slack, +Discord, PagerDuty, Twilio, Amazon SNS, and much more. + +To see all the supported systems, visit our [notifications documentation](/health/notifications/). + +We'll cover email and Slack notifications here, but with this knowledge you should be able to enable any other type of +notifications instead of or in addition to these. + +### Email notifications + +To use email notifications, you need `sendmail` or an equivalent installed on your system. Linux systems use `sendmail` +or similar programs to, unsurprisingly, send emails to any inbox. + +> Learn more about `sendmail` via its [documentation](http://www.postfix.org/sendmail.1.html). + +Edit the `health_alarm_notify.conf` file, which resides in your Netdata directory. + +```bash +sudo ./edit-config health_alarm_notify.conf +``` + +Look for the following lines: + +```conf +# if a role recipient is not configured, an email will be send to: +DEFAULT_RECIPIENT_EMAIL="root" +# to receive only critical alarms, set it to "root|critical" +``` + +Change the value of `DEFAULT_RECIPIENT_EMAIL` to the email address at which you'd like to receive notifications. + +```conf +# if a role recipient is not configured, an email will be sent to: +DEFAULT_RECIPIENT_EMAIL="me@example.com" +# to receive only critical alarms, set it to "root|critical" +``` + +Test email notifications system by first becoming the Netdata user and then asking Netdata to send a test alarm: + +```bash +sudo su -s /bin/bash netdata +/usr/libexec/netdata/plugins.d/alarm-notify.sh test +``` + +You should see output similar to this: + +```bash +# SENDING TEST WARNING ALARM TO ROLE: sysadmin +2019-10-17 18:23:38: alarm-notify.sh: INFO: sent email notification for: hostname test.chart.test_alarm is WARNING to 'me@example.com' +# OK + +# SENDING TEST CRITICAL ALARM TO ROLE: sysadmin +2019-10-17 18:23:38: alarm-notify.sh: INFO: sent email notification for: hostname test.chart.test_alarm is CRITICAL to 'me@example.com' +# OK + +# SENDING TEST CLEAR ALARM TO ROLE: sysadmin +2019-10-17 18:23:39: alarm-notify.sh: INFO: sent email notification for: hostname test.chart.test_alarm is CLEAR to 'me@example.com' +# OK +``` + +... and you should get three separate emails, one for each test alarm, in your inbox! (Be sure to check your spam +folder.) + +## Enable Slack notifications + +If you're one of the many who spend their workday getting pinged with GIFs by your colleagues, why not add Netdata +notifications to the mix? It's a great way to immediately see, collaborate around, and respond to anomalies in your +infrastructure. + +To get Slack notifications working, you first need to add an [incoming +webhook](https://slack.com/apps/A0F7XDUAZ-incoming-webhooks) to the channel of your choice. Click the green **Add to +Slack** button, choose the channel, and click the **Add Incoming WebHooks Integration** button. + +On the following page, you'll receive a **Webhook URL**. That's what you'll need to configure Netdata, so keep it handy. + +Time to dive back into your `health_alarm_notify.conf` file: + +```bash +sudo ./edit-config health_alarm_notify.conf +``` + +Look for the `SLACK_WEBHOOK_URL=" "` line and add the incoming webhook URL you got from Slack: + +```conf +SLACK_WEBHOOK_URL="https://hooks.slack.com/services/XXXXXXXXX/XXXXXXXXX/XXXXXXXXXXXX" +``` + +A few lines down, edit the `DEFAULT_RECIPIENT_SLACK` line to contain a single hash `#` character. This instructs Netdata +to send a notification to the channel you configured with the incoming webhook. + +```conf +DEFAULT_RECIPIENT_SLACK="#" +``` + +Time to test the notifications again! + +```bash +sudo su -s /bin/bash netdata +/usr/libexec/netdata/plugins.d/alarm-notify.sh test +``` + +You should receive three notifications in your Slack channel. + +Congratulations! You're set up with two awesome ways to get notified about any change in the health of your systems or +applications. + +To further configure your email or Slack notification setup, or to enable other notification systems, check out the +following documentation: + +- [Email notifications](/health/notifications/email/README.md) +- [Slack notifications](/health/notifications/slack/README.md) +- [Netdata's notification system](/health/notifications/README.md) + +## What's next? + +In this step, you learned the fundamentals of Netdata's health monitoring tools: alarms and notifications. You should be +able to tune default alarms, silence them, and understand some of the basics of writing health entities. And, if you so +chose, you'll now have both email and Slack notifications enabled. + +You're coming along quick! + +Next up, we're going to cover how Netdata collects its metrics, and how you can get Netdata to collect real-time metrics +from hundreds of services with almost no configuration on your part. Onward! + +[Next: Collect metrics from more services and apps →](step-06.md) + +[](<>) diff --git a/docs/guides/step-by-step/step-06.md b/docs/guides/step-by-step/step-06.md new file mode 100644 index 000000000..bb1f23494 --- /dev/null +++ b/docs/guides/step-by-step/step-06.md @@ -0,0 +1,122 @@ +<!-- +title: "Step 6. Collect metrics from more services and apps" +custom_edit_url: https://github.com/netdata/netdata/edit/master/guides/docs/step-by-step/step-06.md +--> + +# Step 6. Collect metrics from more services and apps + +When Netdata _starts_, it auto-detects dozens of **data sources**, such as database servers, web servers, and more. + +To auto-detect and collect metrics from a source you just installed, you need to [restart +Netdata](/docs/getting-started.md#start-stop-and-restart-netdata). + +However, auto-detection only works if you installed the source using its standard installation +procedure. If Netdata isn't collecting metrics after a restart, your source probably isn't configured +correctly. + +Check out the [collectors that come pre-installed with Netdata](/collectors/COLLECTORS.md) to find the module for the +source you want to monitor. + +## What you'll learn in this step + +We'll begin with an overview on Netdata's collector architecture, and then dive into the following: + +- [Netdata's collector architecture](#netdatas-collector-architecture) +- [Enable and disable plugins](#enable-and-disable-plugins) +- [Enable the Nginx collector as an example](#example-enable-the-nginx-collector) + +## Netdata's collector architecture + +Many Netdata users never have to configure collector or worry about which plugin orchestrator they want to use. + +But, if you want to configure collector or write a collector for your custom source, it's important to understand the +underlying architecture. + +By default, Netdata collects a lot of metrics every second using any number of discrete collector. Collectors, in turn, +are organized and manged by plugins. **Internal** plugins collect system metrics, **external** plugins collect +non-system metrics, and **orchestrator** plugins group individual collectors together based on the programming language +they were built in. + +These modules are primarily written in [Go](https://learn.netdata.cloud/docs/agent/collectors/go.d.plugin/) (`go.d`) and +[Python](/collectors/python.d.plugin/README.md), although some use [Bash](/collectors/charts.d.plugin/README.md) +(`charts.d`) or [Node.js](/collectors/node.d.plugin/README.md) (`node.d`). + +## Enable and disable plugins + +You don't need to explicitly enable plugins to auto-detect properly configured sources, but it's useful to know how to +enable or disable them. + +One reason you might want to _disable_ plugins is to improve Netdata's performance on low-resource systems, like +ephemeral nodes or edge devices. Disabling orchestrator plugins like `python.d` can save significant resources if you're +not using any of its data collector modules. + +You can enable or disable plugins in the `[plugin]` section of `netdata.conf`. This section features a list of all the +plugins with a boolean setting (`yes` or `no`) to enable or disable them. Be sure to uncomment the line by removing the +hash (`#`)! + +Enabled: + +```conf +[plugins] + # node.d = yes +``` + +Disabled: + +```conf +[plugins] + node.d = no +``` + +When you explicitly disable a plugin this way, it won't auto-collect metrics using its collectors. + +## Example: Enable the Nginx collector + +To help explain how the auto-detection process works, let's use an Nginx web server as an example. + +Even if you don't have Nginx installed on your system, we recommend you read through the following section so you can +apply the process to other data sources, such as Apache, Redis, Memcached, and more. + +The Nginx collector, which helps Netdata collect metrics from a running Nginx web server, is part of the +`python.d.plugin` external plugin _orchestrator_. + +In order for Netdata to auto-detect an Nginx web server, you need to enable `ngx_http_stub_status_module` and pass the +`stub_status` directive in the `location` block of your Nginx configuration file. + +You can confirm if the `stub_status` Nginx module is already enabled or not by using following command: + +```sh +nginx -V 2>&1 | grep -o with-http_stub_status_module +``` + +If this command returns nothing, you'll need to [enable this module](https://www.nginx.com/blog/monitoring-nginx/). + +Next, edit your `/etc/nginx/sites-enabled/default` file to include a `location` block with the following: + +```conf + location /stub_status { + stub_status; + } +``` + +Restart Netdata using `service netdata restart` or the [correct +alternative](/docs/getting-started.md#start-stop-and-restart-netdata) for your system, and Netdata will auto-detect +metrics from your Nginx web server! + +While not necessary for most auto-detection and collection purposes, you can also configure the Nginx collector itself +by editing its configuration file: + +```sh +./edit-config python.d/nginx.conf +``` + +After configuring any source, or changing the configuration files for their respective modules, always restart Netdata. + +## What's next? + +Now that you've learned the fundamentals behind configuring data sources for auto-detection, it's time to move back to +the dashboard to learn more about some of its more advanced features. + +[Next: Netdata's dashboard in depth →](step-07.md) + +[](<>) diff --git a/docs/guides/step-by-step/step-07.md b/docs/guides/step-by-step/step-07.md new file mode 100644 index 000000000..f2f665575 --- /dev/null +++ b/docs/guides/step-by-step/step-07.md @@ -0,0 +1,114 @@ +<!-- +title: "Step 7. Netdata's dashboard in depth" +date: 2020-05-04 +custom_edit_url: https://github.com/netdata/netdata/edit/master/docs/guides/step-by-step/step-07.md +--> + +# Step 7. Netdata's dashboard in depth + +Welcome to the seventh step of the Netdata guide! + +This step of the guide aims to get you more familiar with the features of the dashboard not previously mentioned in +[step 2](/docs/guides/step-by-step/step-02.md). + +## What you'll learn in this step + +In this step of the Netdata guide, you'll learn how to: + +- [Change the dashboard's settings](#change-the-dashboards-settings) +- [Check if there's an update to Netdata](#check-if-theres-an-update-to-netdata) +- [Export and import a snapshot](#export-and-import-a-snapshot) + +Let's get started! + +## Change the dashboard's settings + +The settings area at the top of your Netdata dashboard houses browser settings. These settings do not affect the +operation of your Netdata server/daemon. They take effect immediately and are permanently saved to browser local storage +(except the refresh on focus / always option). + +You can see the **Performance**, **Synchronization**, **Visual**, and **Locale** tabs on the dashboard settings modal. + + + +To change any setting, click on the toggle button. We recommend you spend some time reading the descriptions for each setting to understand them before making changes. + +Pay particular attention to the following settings, as they have dramatic impacts on the performance and appearance of +your Netdata dashboard: + +- When to refresh the charts? +- How to handle hidden charts? +- Which chart refresh policy to use? +- Which theme to use? +- Do you need help? + +Some settings are applied immediately, and others are only reflected after you refresh the page. + +## Check if there's an update to Netdata + +You can always check if there is an update available from the **Update** area of your Netdata dashboard. + + + +If an update is available, you'll see a modal similar to the one above. + +When you use the [automatic one-line installer script](/packaging/installer/README.md) attempt to update every day. If +you choose to update it manually, there are [several well-documented methods](/packaging/installer/UPDATE.md) to achieve +that. However, it is best practice for you to first go over the [changelog](/CHANGELOG.md). + +## Export and import a snapshot + +Netdata can export and import snapshots of the contents of your dashboard at a given time. Any Netdata agent can import +a snapshot created by any other Netdata agent. + +Snapshot files include all the information of the dashboard, including the URL of the origin server, its unique ID, and +chart data queries for the visible timeframe. While snapshots are not in real-time, and thus won't update with new +metrics, you can still pan, zoom, and highlight charts as you see fit. + +Snapshots can be incredibly useful for diagnosing anomalies after they've already happened. Let's say Netdata triggered +an alarm while you were sleeping. In the morning, you can look up the exact moment the alarm was raised, export a +snapshot, and send it to a colleague for further analysis. + +> ❗ Know how you shouldn't go around downloading software from suspicious-looking websites? Same policy goes for loading +> snapshots from untrusted or anonymous sources. Importing a snapshot loads quite a bit of data into your web browser, +> and so you should always err on the side of protecting your system. + +To export a snapshot, click on the **export** icon. + + + +Edit the snapshot file name and select your desired compression method. Click on **Export**. + +When the export is complete, your browser will prompt you to save the `.snapshot` file to your machine. You can now +share this file with any other Netdata user via email, Slack, or even to help describe your Netdata experience when +[filing an issue](https://github.com/netdata/netdata/issues/new/choose) on GitHub. + +To import a snapshot, click on the **import** icon. + + + +Select the Netdata snapshot file to import. Once the file is loaded, the dashboard will update with critical information +about the snapshot and the system from which it was taken. Click **import** to render it. + +Your Netdata dashboard will load data contained in the snapshot into charts. Because the snapshot only covers a certain +period, it won't update with new metrics. + +An imported snapshot is also temporary. If you reload your browser tab, Netdata will remove the snapshot data and +restore your real-time dashboard for your machine. + +## What's next? + +In this step of the Netdata guide, you learned how to: + +- Change the dashboard's settings +- Check if there's an update to Netdata +- Export or import a snapshot + +Next, you'll learn how to build your first custom dashboard! + +[Next: Build your first custom dashboard →](step-08.md) + +[](<>) diff --git a/docs/guides/step-by-step/step-08.md b/docs/guides/step-by-step/step-08.md new file mode 100644 index 000000000..76a1b0775 --- /dev/null +++ b/docs/guides/step-by-step/step-08.md @@ -0,0 +1,395 @@ +<!-- +title: "Step 8. Build your first custom dashboard" +custom_edit_url: https://github.com/netdata/netdata/edit/master/docs/guides/step-by-step/step-08.md +--> + +# Step 8. Build your first custom dashboard + +In previous steps of the guide, you have learned how several sections of the Netdata dashboard worked. + +This step will show you how to set up a custom dashboard to fit your unique needs. If nothing else, Netdata is really, +really flexible. 🤸 + +## What you'll learn in this step + +In this step of the Netdata guide, you'll learn: + +- [Why you might want a custom dashboard](#why-should-i-create-a-custom-dashboard) +- [How to create and prepare your `custom-dashboard.html` file](#create-and-prepare-your-custom-dashboardhtml-file) +- [Where to add `dashboard.js` to your custom dashboard file](#add-dashboardjs-to-your-custom-dashboard-file) +- [How to add basic styling](#add-some-basic-styling) +- [How to add charts of different types, shapes, and sizes](#creating-your-dashboards-charts) + +Let's get on with it! + +## Why should I create a custom dashboard? + +Because it's cool! + +But there are way more reasons than that, most of which will prove more valuable to you. + +You could use custom dashboards to aggregate real-time data from multiple Netdata agents in one place. Or, you could put +all the charts with metrics collected from your custom application via `statsd` and perform application performance +monitoring from a single dashboard. You could even use a custom dashboard and a standalone web server to create an +enriched public status page for your service, and give your users something fun to look at while they're waiting for the +503 errors to clear up! + +Netdata's custom dashboarding capability is meant to be as flexible as your ideas. We hope you can take these +fundamental ideas and turn them into something amazing. + +## Create and prepare your `custom-dashboard.html` file + +By default, Netdata stores its web server files at `/usr/share/netdata/web`. As with finding the location of your +`netdata.conf` file, you can double-check this location by loading up `http://HOST:19999/netdata.conf` in your browser +and finding the value of the `web files directory` option. + +To create your custom dashboard, create a file at `/usr/share/netdata/web/custom-dashboard.html` and copy in the +following: + +```html +<!DOCTYPE html> +<html lang="en"> +<head> + <title>My custom dashboard</title> + + <meta http-equiv="Content-Type" content="text/html; charset=utf-8" /> + <meta charset="utf-8"> + <meta http-equiv="X-UA-Compatible" content="IE=edge,chrome=1"> + <meta name="viewport" content="width=device-width, initial-scale=1"> + <meta name="apple-mobile-web-app-capable" content="yes"> + <meta name="apple-mobile-web-app-status-bar-style" content="black-translucent"> + + <!-- Add dashboard.js here! --> + +</head> +<body> + + <main class="container"> + + <h1>My custom dashboard</h1> + + <!-- Add charts here! --> + + </main> + +</body> +</html> +``` + +Try visiting `http://HOST:19999/custom-dashboard.html` in your browser. + +If you get a blank page with this text: `Access to file is not permitted: /usr/share/netdata/web/custom-dashboard.html`. +You can fix this error by changing the dashboard file's permissions to make it owned by the `netdata` user. + +```bash +sudo chown netdata:netdata /usr/share/netdata/web/custom-dashboard.html +``` + +Reload your browser, and you should see a blank page with the title: **Your custom dashboard**! + +## Add `dashboard.js` to your custom dashboard file + +You need to include the `dashboard.js` file of a Netdata agent to add Netdata charts. Add the following to the `<head>` +of your custom dashboard page and change `HOST` according to your setup. + +```html + <!-- Add dashboard.js here! --> + <script type="text/javascript" src="http://HOST:19999/dashboard.js"></script> +``` + +When you add `dashboard.js` to any web page, it loads several JavaScript and CSS files to create and style charts. It +also scans the page for elements that define charts, builds them, and refreshes with new metrics. + +> If you enabled SSL on your Netdata dashboard already, you'll need to use `https://` to grab the `dashboard.js` file. + +## Add some basic styling + +While not necessary, let's add some basic styling to make our dashboard look a little nicer. We're putting some +basic CSS into a `<style>` tag inside of the page's `<head>` element. + +```html + <!-- Add dashboard.js here! --> + <script type="text/javascript" src="http://HOST:19999/dashboard.js"></script> + + <style> + .wrap { + max-width: 1280px; + margin: 0 auto; + } + + h1 { + margin-bottom: 30px; + text-align: center; + } + + .charts { + display: flex; + flex-flow: row wrap; + justify-content: space-around; + } + </style> + +</head> +``` + +## Creating your dashboard's charts + +Time to create a chart! + +You need to create a `<div>` for each new chart. Each `<div>` element accepts a few `data-` attributes, some of which +are required and some of which are optional. + +Let's cover a few important ones. And while we do it, we'll create a custom dashboard that shows a few CPU-related +charts on a single page. + +### The chart unique ID (required) + +You need to specify the unique ID of a chart to show it on your custom dashboard. If you forgot how to find the unique +ID, head back over to [step 2](/docs/guides/step-by-step/step-02.md#understand-charts-dimensions-families-and-contexts) +for a re-introduction. + +You can then put this unique ID into a `<div>` element with the `data-netdata` attribute. Put this in the `<body>` of +your custom dashboard file beneath the helpful comment. + +```html +<body> + + <main class="wrap"> + + <h1>My custom dashboard</h1> + + <div class="charts"> + + <!-- Add charts here! --> + <div data-netdata="system.cpu"></div> + + </div> + + </main> + +</body> +``` + +Reload the page, and you should see a real-time `system.cpu` chart! + +... and a whole lot of white space. Let's fix that by adding a few more charts. + +```html + <!-- Add charts here! --> + <div data-netdata="system.cpu"></div> + <div data-netdata="apps.cpu"></div> + <div data-netdata="groups.cpu"></div> + <div data-netdata="users.cpu"></div> +``` + +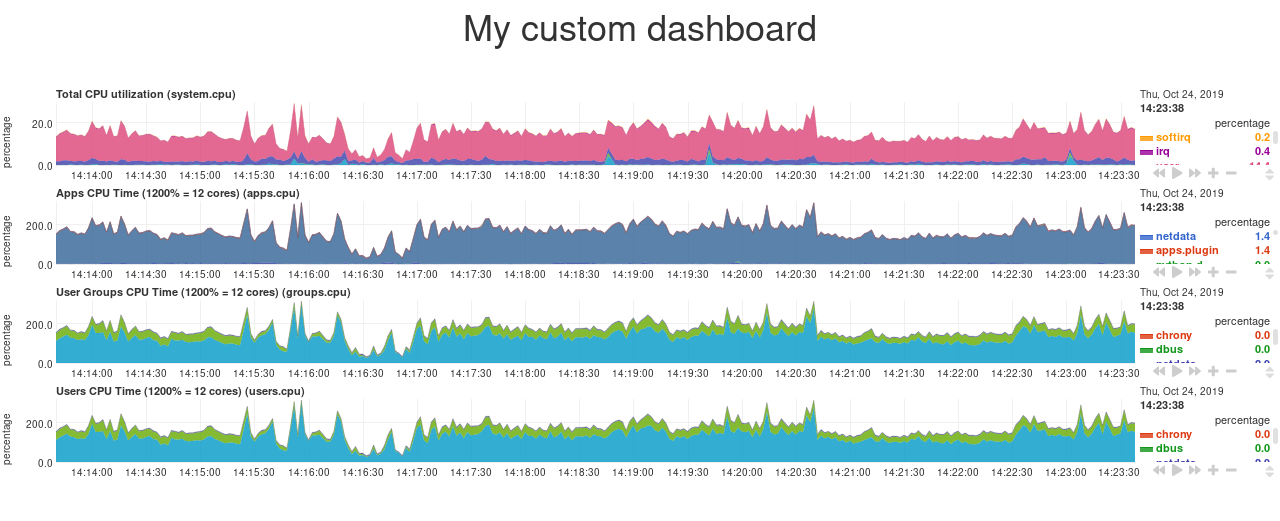 + +### Set chart duration + +By default, these charts visualize 10 minutes of Netdata metrics. Let's get a little more granular on this dashboard. To +do so, add a new `data-after=""` attribute to each chart. + +`data-after` takes a _relative_ number of seconds from _now_. So, by putting `-300` as the value, you're asking the +custom dashboard to display the _last 5 minutes_ (`5m * 60s = 300s`) of data. + +```html + <!-- Add charts here! --> + <div data-netdata="system.cpu" + data-after="-300"> + </div> + <div data-netdata="apps.cpu" + data-after="-300"> + </div> + <div data-netdata="groups.cpu" + data-after="-300"> + </div> + <div data-netdata="users.cpu" + data-after="-300"> + </div> +``` + +### Set chart size + +You can set the size of any chart using the `data-height=""` and `data-width=""` attributes. These attributes can be +anything CSS accepts for width and height (e.g. percentages, pixels, em/rem, calc, and so on). + +Let's make the charts a little taller and allow them to fit side-by-side for a more compact view. Add +`data-height="200px"` and `data-width="50%"` to each chart. + +```html + <div data-netdata="system.cpu" + data-after="-300" + data-height="250px" + data-width="50%"></div> + <div data-netdata="apps.cpu" + data-after="-300" + data-height="250px" + data-width="50%"></div> + <div data-netdata="groups.cpu" + data-after="-300" + data-height="250px" + data-width="50%"></div> + <div data-netdata="users.cpu" + data-after="-300" + data-height="250px" + data-width="50%"></div> +``` + +Now we're getting somewhere! + +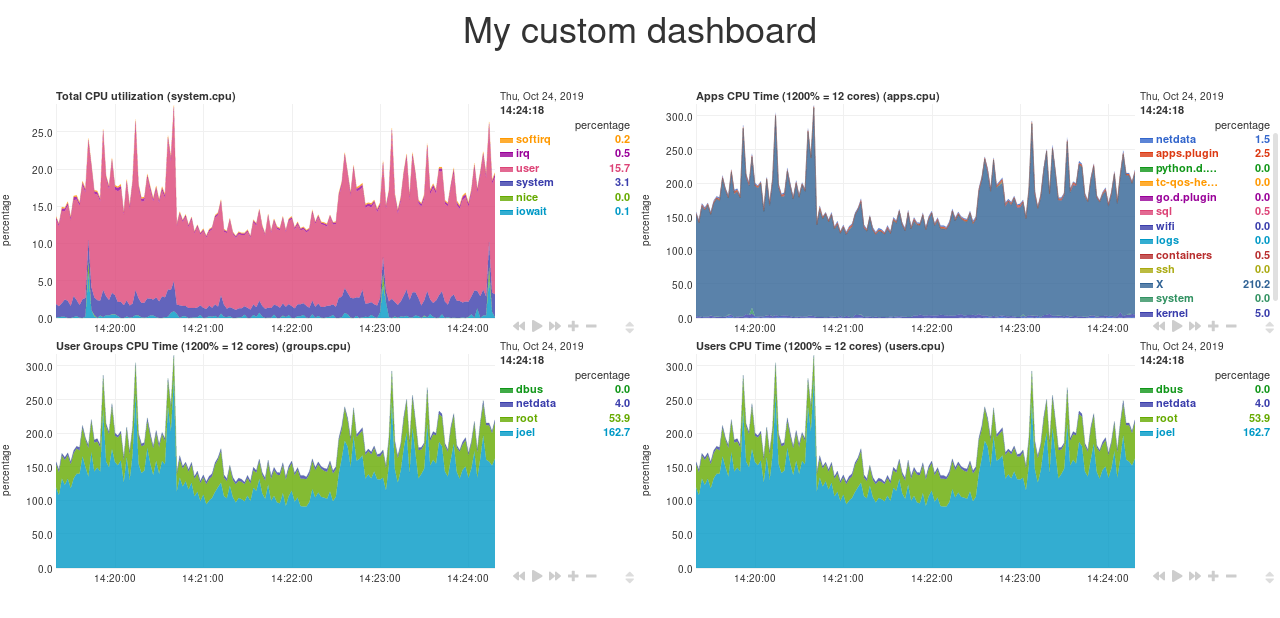 + +## Final touches + +While we already have a perfectly workable dashboard, let's add some final touches to make it a little more pleasant on +the eyes. + +First, add some extra CSS to create some vertical whitespace between the top and bottom row of charts. + +```html + <style> + ... + + .charts > div { + margin-bottom: 6rem; + } + </style> +``` + +To create horizontal whitespace, change the value of `data-width="50%"` to `data-width="calc(50% - 2rem)"`. + +```html + <div data-netdata="system.cpu" + data-after="-300" + data-height="250px" + data-width="calc(50% - 2rem)"></div> + <div data-netdata="apps.cpu" + data-after="-300" + data-height="250px" + data-width="calc(50% - 2rem)"></div> + <div data-netdata="groups.cpu" + data-after="-300" + data-height="250px" + data-width="calc(50% - 2rem)"></div> + <div data-netdata="users.cpu" + data-after="-300" + data-height="250px" + data-width="calc(50% - 2rem)"></div> +``` + +Told you the `data-width` and `data-height` attributes can take any CSS values! + +Prefer a dark theme? Add this to your `<head>` _above_ where you added `dashboard.js`: + +```html + <script> + var netdataTheme = 'slate'; + </script> + + <!-- Add dashboard.js here! --> + <script type="text/javascript" src="https://HOST/dashboard.js"></script> +``` + +Refresh the dashboard to give your eyes a break from all that blue light! + +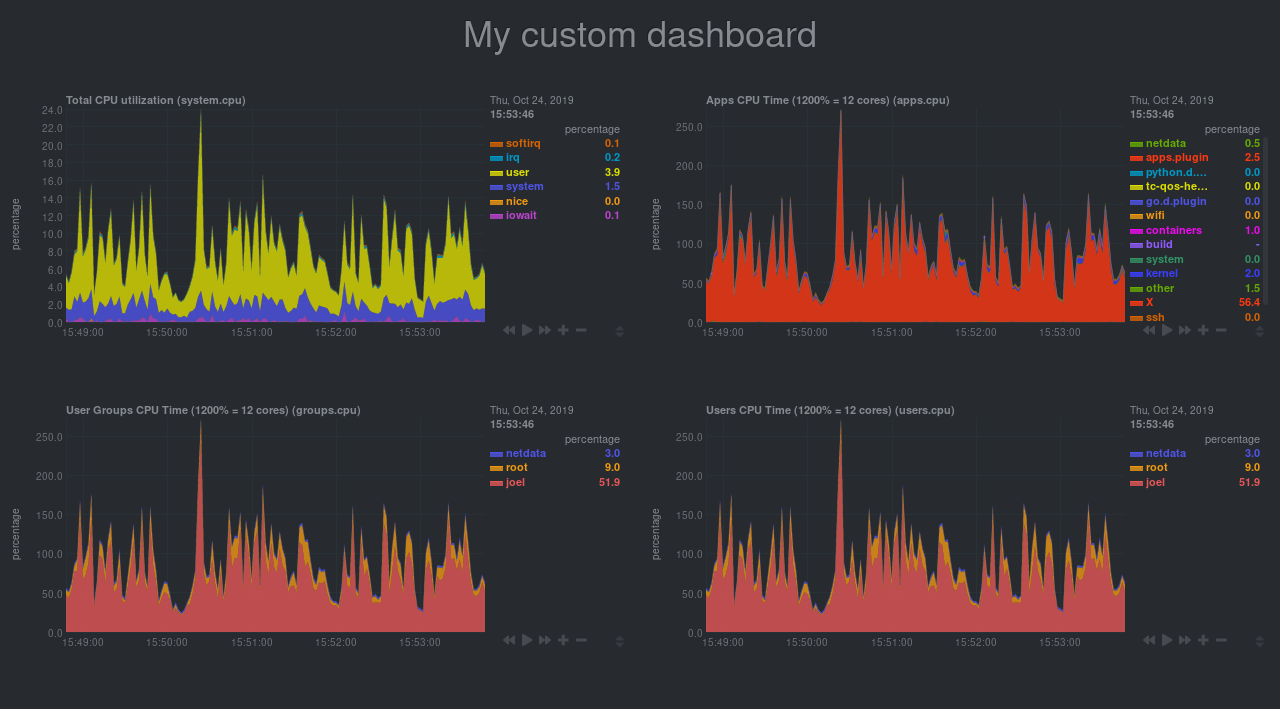 + +## The final `custom-dashboard.html` + +In case you got lost along the way, here's the final version of the `custom-dashboard.html` file: + +```html +<!DOCTYPE html> +<html lang="en"> +<head> + <title>My custom dashboard</title> + + <meta http-equiv="Content-Type" content="text/html; charset=utf-8" /> + <meta charset="utf-8"> + <meta http-equiv="X-UA-Compatible" content="IE=edge,chrome=1"> + <meta name="viewport" content="width=device-width, initial-scale=1"> + <meta name="apple-mobile-web-app-capable" content="yes"> + <meta name="apple-mobile-web-app-status-bar-style" content="black-translucent"> + + <script> + var netdataTheme = 'slate'; + </script> + + <!-- Add dashboard.js here! --> + <script type="text/javascript" src="http://localhost:19999/dashboard.js"></script> + + <style> + .wrap { + max-width: 1280px; + margin: 0 auto; + } + + h1 { + margin-bottom: 30px; + text-align: center; + } + + .charts { + display: flex; + flex-flow: row wrap; + justify-content: space-around; + } + + .charts > div { + margin-bottom: 6rem; + position: relative; + } + </style> + +</head> +<body> + + <main class="wrap"> + + <h1>My custom dashboard</h1> + + <div class="charts"> + + <!-- Add charts here! --> + <div data-netdata="system.cpu" + data-after="-300" + data-height="250px" + data-width="calc(50% - 2rem)"></div> + <div data-netdata="apps.cpu" + data-after="-300" + data-height="250px" + data-width="calc(50% - 2rem)"></div> + <div data-netdata="groups.cpu" + data-after="-300" + data-height="250px" + data-width="calc(50% - 2rem)"></div> + <div data-netdata="users.cpu" + data-after="-300" + data-height="250px" + data-width="calc(50% - 2rem)"></div> + + </div> + + </main> + +</body> +</html> +``` + +## What's next? + +In this guide, you learned the fundamentals of building a custom Netdata dashboard. You should now be able to add more +charts to your `custom-dashboard.html`, change the charts that are already there, and size them according to your needs. + +Of course, the custom dashboarding features covered here are just the beginning. Be sure to read up on our [custom +dashboard documentation](/web/gui/custom/README.md) for details on how you can use other chart libraries, pull metrics +from multiple Netdata agents, and choose which dimensions a given chart shows. + +Next, you'll learn how to store long-term historical metrics in Netdata! + +[Next: Long-term metrics storage →](/docs/guides/step-by-step/step-09.md) + +[](<>) diff --git a/docs/guides/step-by-step/step-09.md b/docs/guides/step-by-step/step-09.md new file mode 100644 index 000000000..636ffea1f --- /dev/null +++ b/docs/guides/step-by-step/step-09.md @@ -0,0 +1,164 @@ +<!-- +title: "Step 9. Long-term metrics storage" +custom_edit_url: https://github.com/netdata/netdata/edit/master/docs/guides/step-by-step/step-09.md +--> + +# Step 9. Long-term metrics storage + +By default, Netdata stores metrics in a custom database we call the [database engine](/database/engine/README.md), which +stores recent metrics in your system's RAM and "spills" historical metrics to disk. By using both RAM and disk, the +database engine helps you store a much larger dataset than the amount of RAM your system has. + +On a system that's collecting 2,000 metrics every second, the database engine's default configuration will store about +two day's worth of metrics in RAM and on disk. + +That's a lot of metrics. We're talking 345,600,000 individual data points. And the database engine does it with a tiny +a portion of the RAM available on most systems. + +To store _even more_ metrics, you have two options. First, you can tweak the database engine's options to expand the RAM +or disk it uses. Second, you can archive metrics to an external database. For that, we'll use MongoDB as examples. + +## What you'll learn in this step + +In this step of the Netdata guide, you'll learn how to: + +- [Tweak the database engine's settings](#tweak-the-database-engines-settings) +- [Archive metrics to an external database](#archive-metrics-to-an-external-database) + - [Use the MongoDB database](#archive-metrics-via-the-mongodb-exporting-connector) + +Let's get started! + +## Tweak the database engine's settings + +If you're using Netdata v1.18.0 or higher, and you haven't changed your `memory mode` settings before following this +guide, your Netdata agent is already using the database engine. + +Let's look at your `netdata.conf` file again. Under the `[global]` section, you'll find three connected options. + +```conf +[global] + # memory mode = dbengine + # page cache size = 32 + # dbengine disk space = 256 +``` + +The `memory mode` option is set, by default, to `dbengine`. `page cache size` determines the amount of RAM, in MiB, that +the database engine dedicates to caching the metrics it's collecting. `dbengine disk space` determines the amount of +disk space, in MiB, that the database engine will use to store these metrics once they've been "spilled" to disk.. + +You can uncomment and change either `page cache size` or `dbengine disk space` based on how much RAM and disk you want +the database engine to use. The higher those values, the more metrics Netdata will store. If you change them to 64 and +512, respectively, the database engine should store about four day's worth of data on a system collecting 2,000 metrics +every second. + +[**See our database engine calculator**](/docs/store/change-metrics-storage.md) to help you correctly set `dbengine disk +space` based on your needs. The calculator gives an accurate estimate based on how many child nodes you have, how many +metrics your Agent collects, and more. + +```conf +[global] + memory mode = dbengine + page cache size = 64 + dbengine disk space = 512 +``` + +After you've made your changes, [restart Netdata](/docs/getting-started.md#start-stop-and-restart-netdata). + +To confirm the database engine is working, go to your Netdata dashboard and click on the **Netdata Monitoring** menu on +the right-hand side. You can find `dbengine` metrics after `queries`. + +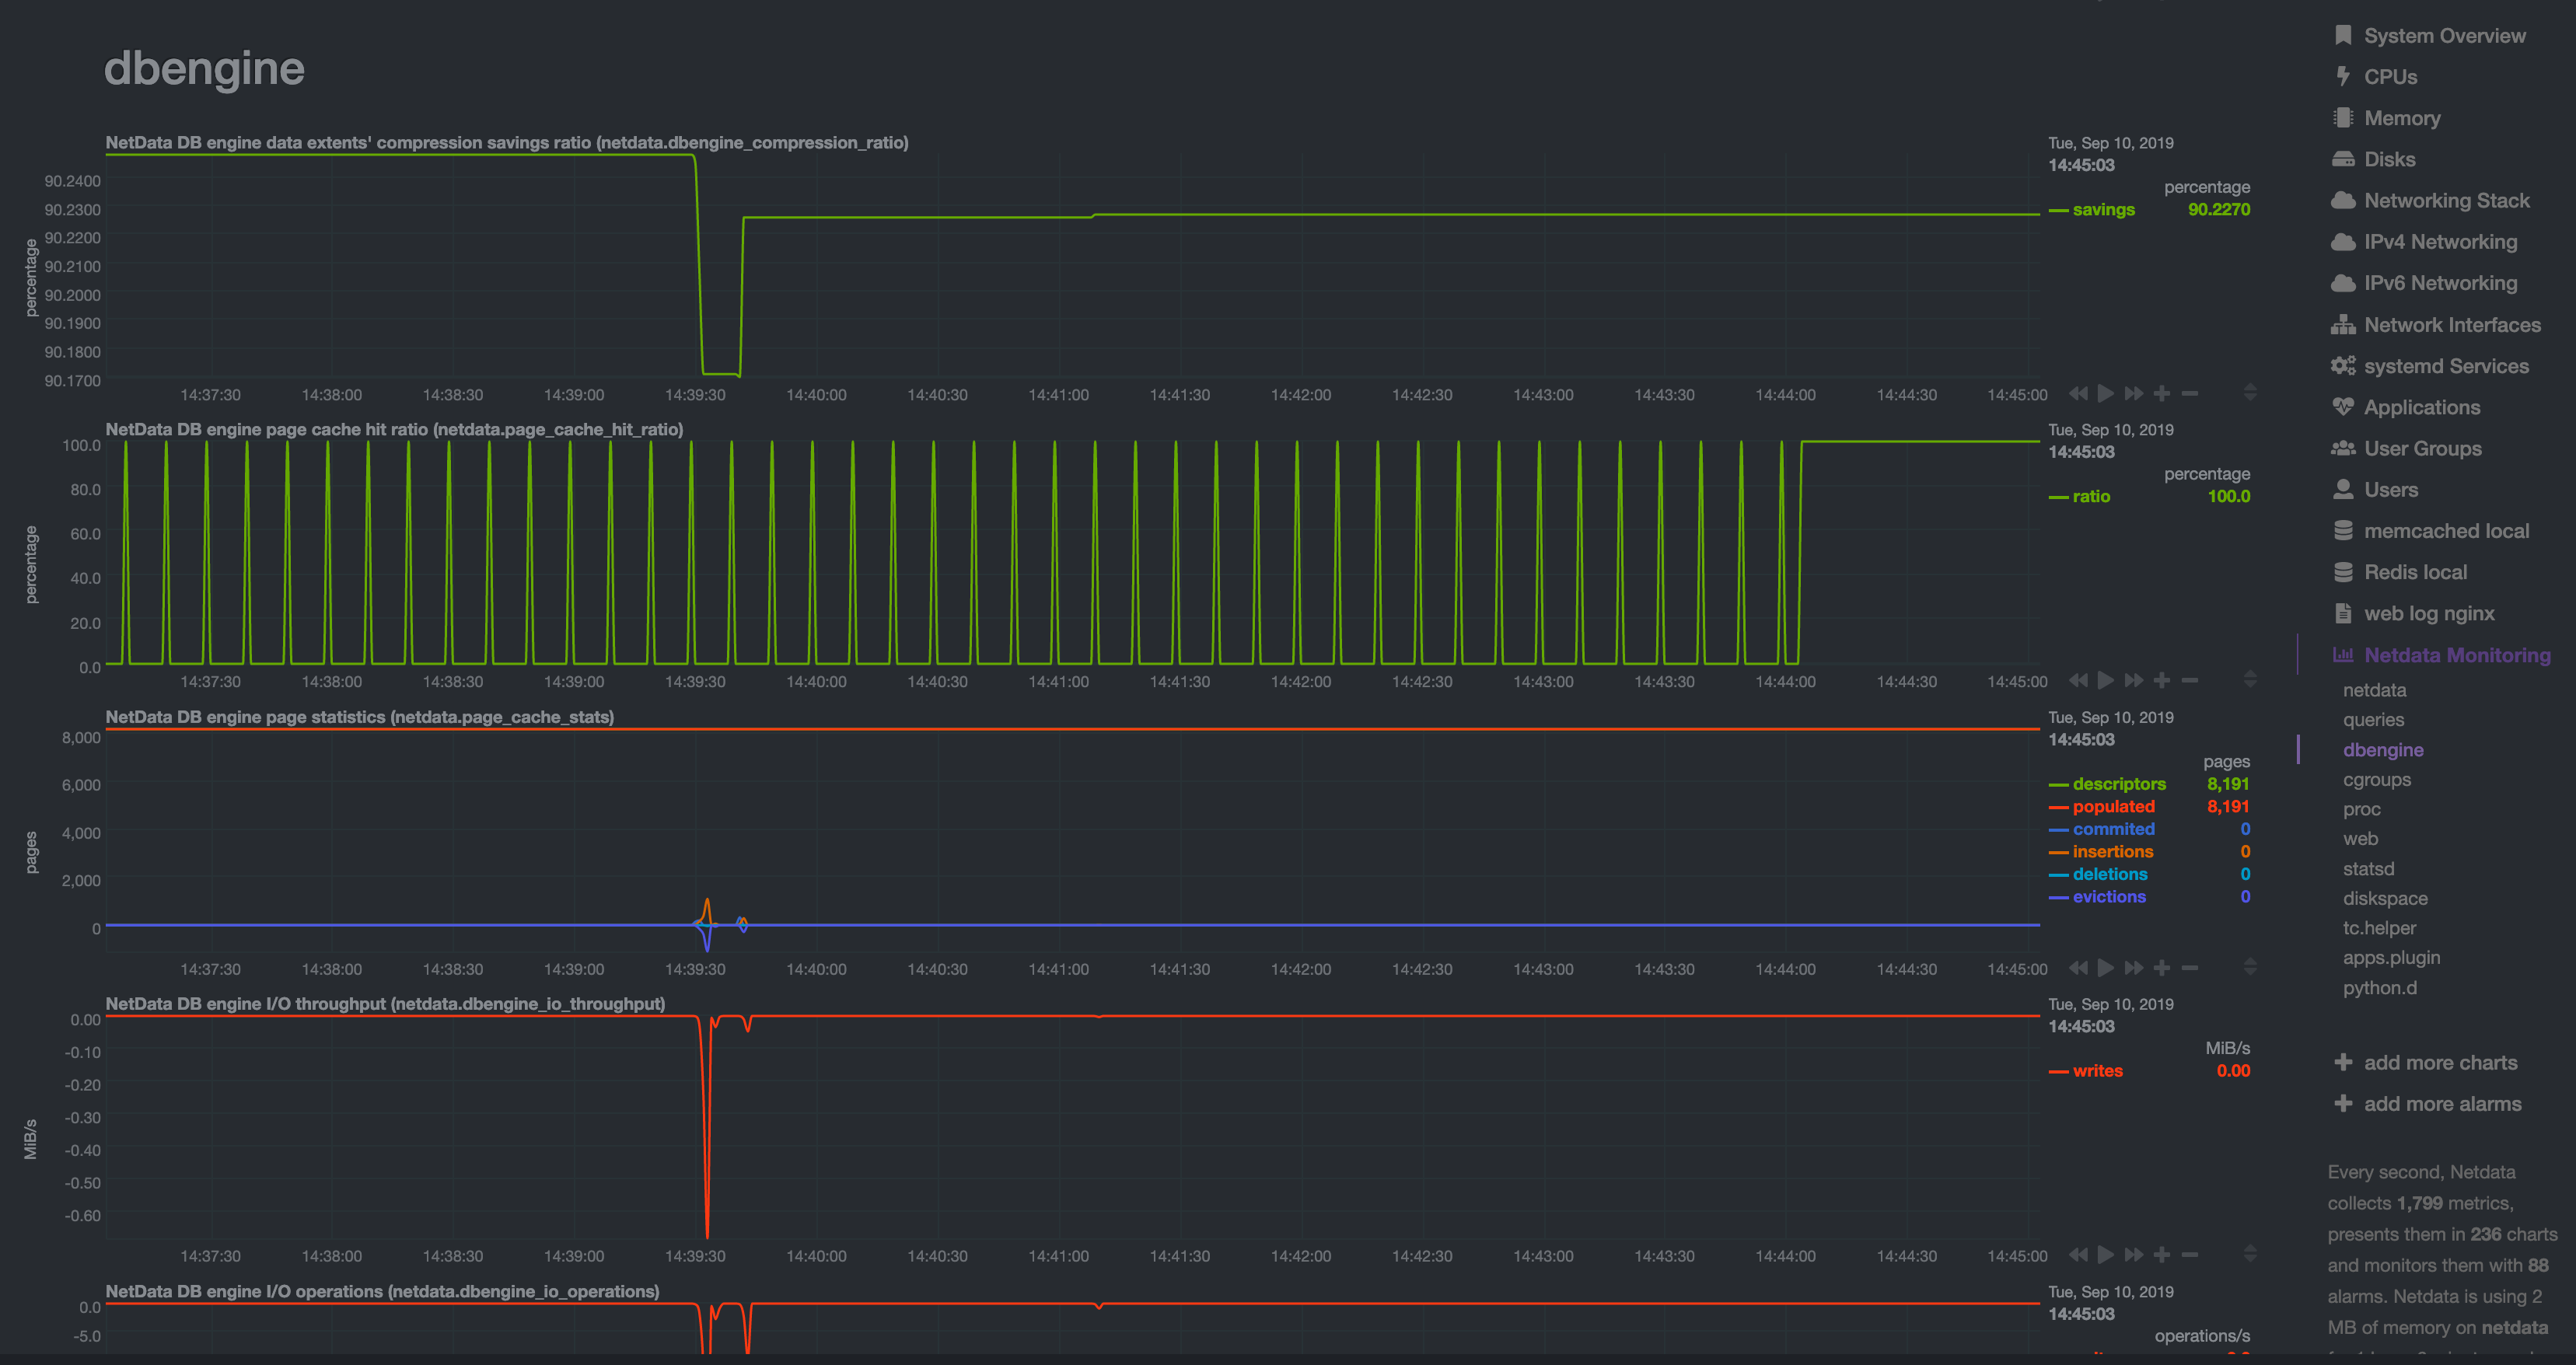 + +## Archive metrics to an external database + +You can archive all the metrics collected by Netdata to **external databases**. The supported databases and services +include Graphite, OpenTSDB, Prometheus, AWS Kinesis Data Streams, Google Cloud Pub/Sub, MongoDB, and the list is always +growing. + +As we said in [step 1](/docs/guides/step-by-step/step-01.md), we have only complimentary systems, not competitors! We're +happy to support these archiving methods and are always working to improve them. + +A lot of Netdata users archive their metrics to one of these databases for long-term storage or further analysis. Since +Netdata collects so many metrics every second, they can quickly overload small devices or even big servers that are +aggregating metrics streaming in from other Netdata agents. + +We even support resampling metrics during archiving. With resampling enabled, Netdata will archive only the average or +sum of every X seconds of metrics. This reduces the sheer amount of data, albeit with a little less accuracy. + +How you archive metrics, or if you archive metrics at all, is entirely up to you! But let's cover two easy archiving +methods, MongoDB and Prometheus remote write, to get you started. + +### Archive metrics via the MongoDB exporting connector + +Begin by installing MongoDB its dependencies via the correct package manager for your system. + +```bash +sudo apt-get install mongodb # Debian/Ubuntu +sudo dnf install mongodb # Fedora +sudo yum install mongodb # CentOS +``` + +Next, install the one essential dependency: v1.7.0 or higher of +[libmongoc](http://mongoc.org/libmongoc/current/installing.html). + +```bash +sudo apt-get install libmongoc-1.0-0 libmongoc-dev # Debian/Ubuntu +sudo dnf install mongo-c-driver mongo-c-driver-devel # Fedora +sudo yum install mongo-c-driver mongo-c-driver-devel # CentOS +``` + +Next, create a new MongoDB database and collection to store all these archived metrics. Use the `mongo` command to start +the MongoDB shell, and then execute the following command: + +```mongodb +use netdata +db.createCollection("netdata_metrics") +``` + +Next, Netdata needs to be [reinstalled](/packaging/installer/REINSTALL.md) in order to detect that the required +libraries to make this exporting connection exist. Since you most likely installed Netdata using the one-line installer +script, all you have to do is run that script again. Don't worry—any configuration changes you made along the way will +be retained! + +```bash +bash <(curl -Ss https://my-netdata.io/kickstart.sh) +``` + +Now, from your Netdata config directory, initialize and edit a `exporting.conf` file to tell Netdata where to find the +database you just created. + +```sh +./edit-config exporting.conf +``` + +Add the following section to the file: + +```conf +[mongodb:my_mongo_instance] + enabled = yes + destination = mongodb://localhost + database = netdata + collection = netdata_metrics +``` + +[Restart](/docs/getting-started.md#start-stop-and-restart-netdata) Netdata to enable the MongoDB exporting connector. +Click on the **Netdata Monitoring** menu and check out the **exporting my mongo instance** sub-menu. You should start +seeing these charts fill up with data about the exporting process! + +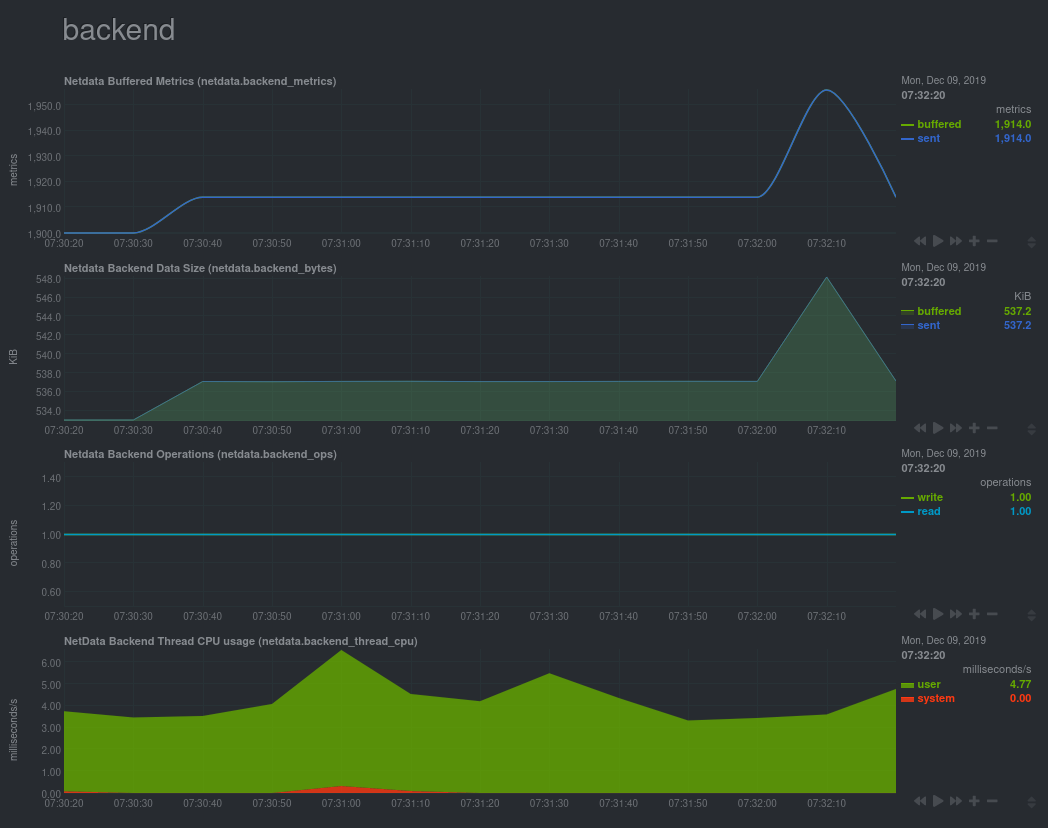 + +If you'd like to try connecting Netdata to another database, such as Prometheus or OpenTSDB, read our [exporting +documentation](/exporting/README.md). + +## What's next? + +You're getting close to the end! In this step, you learned how to make the most of the database engine, or archive +metrics to MongoDB for long-term storage. + +In the last step of this step-by-step guide, we'll put our sysadmin hat on and use Nginx to proxy traffic to and from +our Netdata dashboard. + +[Next: Set up a proxy →](/docs/guides/step-by-step/step-10.md) + +[](<>) diff --git a/docs/guides/step-by-step/step-10.md b/docs/guides/step-by-step/step-10.md new file mode 100644 index 000000000..28ab47c67 --- /dev/null +++ b/docs/guides/step-by-step/step-10.md @@ -0,0 +1,230 @@ +<!-- +title: "Step 10. Set up a proxy" +custom_edit_url: https://github.com/netdata/netdata/edit/master/docs/guides/step-by-step/step-10.md +--> + +# Step 10. Set up a proxy + +You're almost through! At this point, you should be pretty familiar with now Netdata works and how to configure it to +your liking. + +In this step of the guide, we're going to add a proxy in front of Netdata. We're doing this for both improved +performance and security, so we highly recommend following these steps. Doubly so if you installed Netdata on a +publicly-accessible remote server. + +> ❗ If you installed Netdata on the machine you're currently using (e.g. on `localhost`), and have been accessing +> Netdata at `http://localhost:19999`, you can skip this step of the guide. In most cases, there is no benefit to +> setting up a proxy for a service running locally. + +> ❗❗ This guide requires more advanced administration skills than previous parts. If you're still working on your +> Linux administration skills, and would rather get back to Netdata, you might want to [skip this +> step](step-99.md) for now and return to it later. + +## What you'll learn in this step + +In this step of the Netdata guide, you'll learn: + +- [What a proxy is and the benefits of using one](#wait-whats-a-proxy) +- [How to connect Netdata to Nginx](#connect-netdata-to-nginx) +- [How to enable HTTPS in Nginx](#enable-https-in-nginx) +- [How to secure your Netdata dashboard with a password](#secure-your-netdata-dashboard-with-a-password) + +Let's dive in! + +## Wait. What's a proxy? + +A proxy is a middleman between the internet and a service you're running on your system. Traffic from the internet at +large enters your system through the proxy, which then routes it to the service. + +A proxy is often used to enable encrypted HTTPS connections with your browser, but they're also useful for load +balancing, performance, and password-protection. + +We'll use [Nginx](https://nginx.org/en/) for this step of the guide, but you can also use +[Caddy](https://caddyserver.com/) as a simple proxy if you prefer. + +## Required before you start + +You need three things to run a proxy using Nginx: + +- Nginx and Certbot installed on your system +- A fully qualified domain name +- A subdomain for Netdata that points to your system + +### Nginx and Certbot + +This step of the guide assumes you can install Nginx on your system. Here are the easiest methods to do so on Debian, +Ubuntu, Fedora, and CentOS systems. + +```bash +sudo apt-get install nginx # Debian/Ubuntu +sudo dnf install nginx # Fedora +sudo yum install nginx # CentOS +``` + +Check out [Nginx's installation +instructions](https://docs.nginx.com/nginx/admin-guide/installing-nginx/installing-nginx-open-source/) for details on +other Linux distributions. + +Certbot is a tool to help you create and renew certificate+key pairs for your domain. Visit their +[instructions](https://certbot.eff.org/instructions) to get a detailed installation process for your operating system. + +### Fully qualified domain name + +The only other true prerequisite of using a proxy is a **fully qualified domain name** (FQDN). In other words, a domain +name like `example.com`, `netdata.cloud`, or `github.com`. + +If you don't have a domain name, you won't be able to use a proxy the way we'll describe here. + +Because we strongly recommend running Netdata behind a proxy, the cost of a domain name is worth the benefit. If you +don't have a preferred domain registrar, try [Google Domains](https://domains.google/), +[Cloudflare](https://www.cloudflare.com/products/registrar/), or [Namecheap](https://www.namecheap.com/). + +### Subdomain for Netdata + +Any of the three domain registrars mentioned above, and most registrars in general, will allow you to create new DNS +entries for your domain. + +To create a subdomain for Netdata, use your registrar's DNS settings to create an A record for a `netdata` subdomain. +Point the A record to the IP address of your system. + +Once finished with the steps below, you'll be able to access your dashboard at `http://netdata.example.com`. + +## Connect Netdata to Nginx + +The first part of enabling the proxy is to create a new server for Nginx. + +Use your favorite text editor to create a file at `/etc/nginx/sites-available/netdata`, copy in the following +configuration, and change the `server_name` line to match your domain. + +```nginx +upstream backend { + server 127.0.0.1:19999; + keepalive 64; +} + +server { + listen 80; + + # Change `example.com` to match your domain name. + server_name netdata.example.com; + + location / { + proxy_set_header X-Forwarded-Host $host; + proxy_set_header X-Forwarded-Server $host; + proxy_set_header X-Forwarded-For $proxy_add_x_forwarded_for; + proxy_pass http://backend; + proxy_http_version 1.1; + proxy_pass_request_headers on; + proxy_set_header Connection "keep-alive"; + proxy_store off; + } +} +``` + +Save and close the file. + +Test your configuration file by running `sudo nginx -t`. + +If that returns no errors, it's time to make your server available. Run the command to create a symbolic link in the +`sites-enabled` directory. + +```bash +sudo ln -s /etc/nginx/sites-available/netdata /etc/nginx/sites-enabled/netdata +``` + +Finally, restart Nginx to make your changes live. Open your browser and head to `http://netdata.example.com`. You should +see your proxied Netdata dashboard! + +## Enable HTTPS in Nginx + +All this proxying doesn't mean much if we can't take advantage of one of the biggest benefits: encrypted HTTPS +connections! Let's fix that. + +Certbot will automatically get a certificate, edit your Nginx configuration, and get HTTPS running in a single step. Run +the following: + +```bash +sudo certbot --nginx +``` + +> See this error after running `sudo certbot --nginx`? +> +> ``` +> Saving debug log to /var/log/letsencrypt/letsencrypt.log +> The requested nginx plugin does not appear to be installed` +> ``` +> +> You must install `python-certbox-nginx`. On Ubuntu or Debian systems, you can run `sudo apt-get install +> python-certbot-nginx` to download and install this package. + +You'll be prompted with a few questions. At the `Which names would you like to activate HTTPS for?` question, hit +`Enter`. Next comes this question: + +```bash +Please choose whether or not to redirect HTTP traffic to HTTPS, removing HTTP access. +- - - - - - - - - - - - - - - - - - - - - - - - - - - - - - - - - - - - - - - - +1: No redirect - Make no further changes to the webserver configuration. +2: Redirect - Make all requests redirect to secure HTTPS access. Choose this for +new sites, or if you're confident your site works on HTTPS. You can undo this +change by editing your web server's configuration. +- - - - - - - - - - - - - - - - - - - - - - - - - - - - - - - - - - - - - - - - +``` + +You _do_ want to force HTTPS, so hit `2` and then `Enter`. Nginx will now ensure all attempts to access +`netdata.example.com` use HTTPS. + +Certbot will automatically renew your certificate whenever it's needed, so you're done configuring your proxy. Open your +browser again and navigate to `https://netdata.example.com`, and you'll land on an encrypted, proxied Netdata dashboard! + +## Secure your Netdata dashboard with a password + +Finally, let's take a moment to put your Netdata dashboard behind a password. This step is optional, but you might not +want _anyone_ to access the metrics in your proxied dashboard. + +Run the below command after changing `user` to the username you want to use to log in to your dashboard. + +```bash +sudo sh -c "echo -n 'user:' >> /etc/nginx/.htpasswd" +``` + +Then run this command to create a password: + +```bash +sudo sh -c "openssl passwd -apr1 >> /etc/nginx/.htpasswd" +``` + +You'll be prompted to create a password. Next, open your Nginx configuration file at +`/etc/nginx/sites-available/netdata` and add these two lines under `location / {`: + +```nginx + location / { + auth_basic "Restricted Content"; + auth_basic_user_file /etc/nginx/.htpasswd; + ... +``` + +Save, exit, and restart Nginx. Then try visiting your dashboard one last time. You'll see a prompt for the username and +password you just created. + +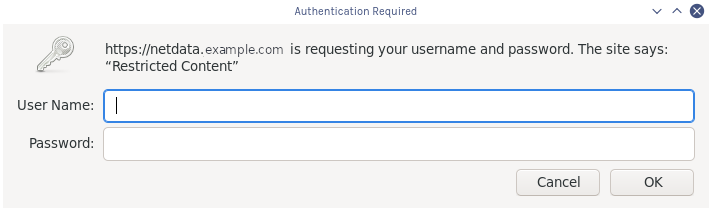 + +Your Netdata dashboard is now a touch more secure. + +## What's next? + +You're a real sysadmin now! + +If you want to configure your Nginx proxy further, check out the following: + +- [Running Netdata behind Nginx](/docs/Running-behind-nginx.md) +- [How to optimize Netdata's performance](/docs/guides/configure/performance.md) +- [Enabling TLS on Netdata's dashboard](/web/server/README.md#enabling-tls-support) + +And... you're _almost_ done with the Netdata guide. + +For some celebratory emoji and a clap on the back, head on over to our final step. + +[Next: The end. →](step-99.md) + +[](<>) diff --git a/docs/guides/step-by-step/step-99.md b/docs/guides/step-by-step/step-99.md new file mode 100644 index 000000000..3b893d5a3 --- /dev/null +++ b/docs/guides/step-by-step/step-99.md @@ -0,0 +1,51 @@ +<!-- +title: "Step ∞. You're finished!" +custom_edit_url: https://github.com/netdata/netdata/edit/master/docs/guides/step-by-step/step-99.md +--> + +# Step ∞. You're finished! + +Congratulations. 🎉 + +You've completed the step-by-step Netdata guide. That means you're well on your way to becoming an expert in using +our toolkit for health monitoring and performance troubleshooting. + +But, perhaps more importantly, also that much closer to being an expert in the _fundamental skills behind health +monitoring and performance troubleshooting_, which you can take with you to any job or project. + +And that is the entire point of this guide, and Netdata's [documentation](https://learn.netdata.cloud) as a +whole—give you every resource possible to help you build faster, more resilient systems, services, and applications. + +Along the way, you learned how to: + +- Navigate Netdata's dashboard and visually detect anomalies using its charts. +- Monitor multiple systems using Netdata agents connected together with your browser and Netdata Cloud. +- Edit your `netdata.conf` file to tweak Netdata to your liking. +- Tune existing alarms and create entirely new ones, plus get notifications about alarms on your favorite services. +- Take advantage of Netdata's auto-detection capabilities to ensure your applications/services are monitored with + little to no configuration. +- Use advanced features within Netdata's dashboard. +- Build a custom dashboard using `dashboard.js`. +- Save more historical metrics with the database engine or archive metrics to MongoDB. +- Put Netdata behind a proxy to enable HTTPS and improve performance. + +Seems like a lot, right? Well, we hope it felt manageable and, yes, even _fun_. + +## What's next? + +Now that you're at the end of our step-by-step Netdata guide, the next steps are entirely up to you. In fact, you're +just at the beginning of your journey into health monitoring and performance troubleshooting. + +Our documentation exists to put every Netdata resource in front of you as easily and coherently as we possibly can. +Click around, search, and find new mountains to climb. + +If that feels like too much possibility to you, why not one of these options: + +- Share your experience with Netdata and this guide. Be sure to [@mention](https://twitter.com/linuxnetdata) us on + Twitter! +- Contribute to what we do. Browse our [open issues](https://github.com/netdata/netdata/issues) and check out out + [contributions doc](/CONTRIBUTING.md) for ideas of how you can pitch in. + +We can't wait to see what you monitor next! Bon voyage! ⛵ + +[](<>) |