
diff options
Diffstat (limited to 'docs/guides/troubleshoot')
| -rw-r--r-- | docs/guides/troubleshoot/monitor-debug-applications-ebpf.md | 254 | ||||
| -rw-r--r-- | docs/guides/troubleshoot/troubleshooting-agent-with-cloud-connection.md | 147 |
2 files changed, 0 insertions, 401 deletions
diff --git a/docs/guides/troubleshoot/monitor-debug-applications-ebpf.md b/docs/guides/troubleshoot/monitor-debug-applications-ebpf.md deleted file mode 100644 index f393e8e0f..000000000 --- a/docs/guides/troubleshoot/monitor-debug-applications-ebpf.md +++ /dev/null @@ -1,254 +0,0 @@ -<!-- -title: "Monitor, troubleshoot, and debug applications with eBPF metrics" -sidebar_label: "Monitor, troubleshoot, and debug applications with eBPF metrics" -description: "Use Netdata's built-in eBPF metrics collector to monitor, troubleshoot, and debug your custom application using low-level kernel feedback." -image: /img/seo/guides/troubleshoot/monitor-debug-applications-ebpf.png -custom_edit_url: https://github.com/netdata/netdata/edit/master/docs/guides/troubleshoot/monitor-debug-applications-ebpf.md -learn_status: "Published" -learn_rel_path: "Operations" ---> - -# Monitor, troubleshoot, and debug applications with eBPF metrics - -When trying to troubleshoot or debug a finicky application, there's no such thing as too much information. At Netdata, -we developed programs that connect to the [_extended Berkeley Packet Filter_ (eBPF) virtual -machine](https://github.com/netdata/netdata/blob/master/collectors/ebpf.plugin/README.md) to help you see exactly how specific applications are interacting with the -Linux kernel. With these charts, you can root out bugs, discover optimizations, diagnose memory leaks, and much more. - -This means you can see exactly how often, and in what volume, the application creates processes, opens files, writes to -filesystem using virtual filesystem (VFS) functions, and much more. Even better, the eBPF collector gathers metrics at -an _event frequency_, which is even faster than Netdata's beloved 1-second granularity. When you troubleshoot and debug -applications with eBPF, rest assured you miss not even the smallest meaningful event. - -Using this guide, you'll learn the fundamentals of setting up Netdata to give you kernel-level metrics from your -application so that you can monitor, troubleshoot, and debug to your heart's content. - -## Configure `apps.plugin` to recognize your custom application - -To start troubleshooting an application with eBPF metrics, you need to ensure your Netdata dashboard collects and -displays those metrics independent from any other process. - -You can use the `apps_groups.conf` file to configure which applications appear in charts generated by -[`apps.plugin`](https://github.com/netdata/netdata/blob/master/collectors/apps.plugin/README.md). Once you edit this file and create a new group for the application -you want to monitor, you can see how it's interacting with the Linux kernel via real-time eBPF metrics. - -Let's assume you have an application that runs on the process `custom-app`. To monitor eBPF metrics for that application -separate from any others, you need to create a new group in `apps_groups.conf` and associate that process name with it. - -Open the `apps_groups.conf` file in your Netdata configuration directory. - -```bash -cd /etc/netdata # Replace this path with your Netdata config directory -sudo ./edit-config apps_groups.conf -``` - -Scroll down past the explanatory comments and stop when you see `# NETDATA processes accounting`. Above that, paste in -the following text, which creates a new `dev` group with the `custom-app` process. Replace `custom-app` with the name of -your application's process name. - -Your file should now look like this: - -```conf -... -# ----------------------------------------------------------------------------- -# Custom applications to monitor with apps.plugin and ebpf.plugin - -dev: custom-app - -# ----------------------------------------------------------------------------- -# NETDATA processes accounting -... -``` - -Restart Netdata with `sudo systemctl restart netdata`, or the [appropriate -method](https://github.com/netdata/netdata/blob/master/docs/configure/start-stop-restart.md) for your system, to begin seeing metrics for this particular -group+process. You can also add additional processes to the same group. - -You can set up `apps_groups.conf` to more show more precise eBPF metrics for any application or service running on your -system, even if it's a standard package like Redis, Apache, or any other [application/service Netdata collects -from](https://github.com/netdata/netdata/blob/master/collectors/COLLECTORS.md). - -```conf -# ----------------------------------------------------------------------------- -# Custom applications to monitor with apps.plugin and ebpf.plugin - -dev: custom-app -database: *redis* -apache: *apache* - -# ----------------------------------------------------------------------------- -# NETDATA processes accounting -... -``` - -Now that you have `apps_groups.conf` set up to monitor your application/service, you can also set up the eBPF collector -to show other charts that will help you debug and troubleshoot how it interacts with the Linux kernel. - -## Configure the eBPF collector to monitor errors - -The eBPF collector has [two possible modes](https://github.com/netdata/netdata/blob/master/collectors/ebpf.plugin/README.md#ebpf-load-mode): `entry` and `return`. The default -is `entry`, and only monitors calls to kernel functions, but the `return` also monitors and charts _whether these calls -return in error_. - -Let's turn on the `return` mode for more granularity when debugging Firefox's behavior. - -```bash -cd /etc/netdata # Replace this path with your Netdata config directory -sudo ./edit-config ebpf.d.conf -``` - -Replace `entry` with `return`: - -```conf -[global] - ebpf load mode = return - disable apps = no - -[ebpf programs] - process = yes - network viewer = yes -``` - -Restart Netdata with `sudo systemctl restart netdata`, or the [appropriate -method](https://github.com/netdata/netdata/blob/master/docs/configure/start-stop-restart.md) for your system. - -## Get familiar with per-application eBPF metrics and charts - -Visit the Netdata dashboard at `http://NODE:19999`, replacing `NODE` with the hostname or IP of the system you're using -to monitor this application. Scroll down to the **Applications** section. These charts now feature a `firefox` dimension -with metrics specific to that process. - -Pay particular attention to the charts in the **ebpf file**, **ebpf syscall**, **ebpf process**, and **ebpf net** -sub-sections. These charts are populated by low-level Linux kernel metrics thanks to eBPF, and showcase the volume of -calls to open/close files, call functions like `do_fork`, IO activity on the VFS, and much more. - -See the [eBPF collector documentation](https://github.com/netdata/netdata/blob/master/collectors/ebpf.plugin/README.md#integration-with-appsplugin) for the full list -of per-application charts. - -Let's show some examples of how you can first identify normal eBPF patterns, then use that knowledge to identify -anomalies in a few simulated scenarios. - -For example, the following screenshot shows the number of open files, failures to open files, and closed files on a -Debian 10 system. The first spike is from configuring/compiling a small C program, then from running Apache's `ab` tool -to benchmark an Apache web server. - -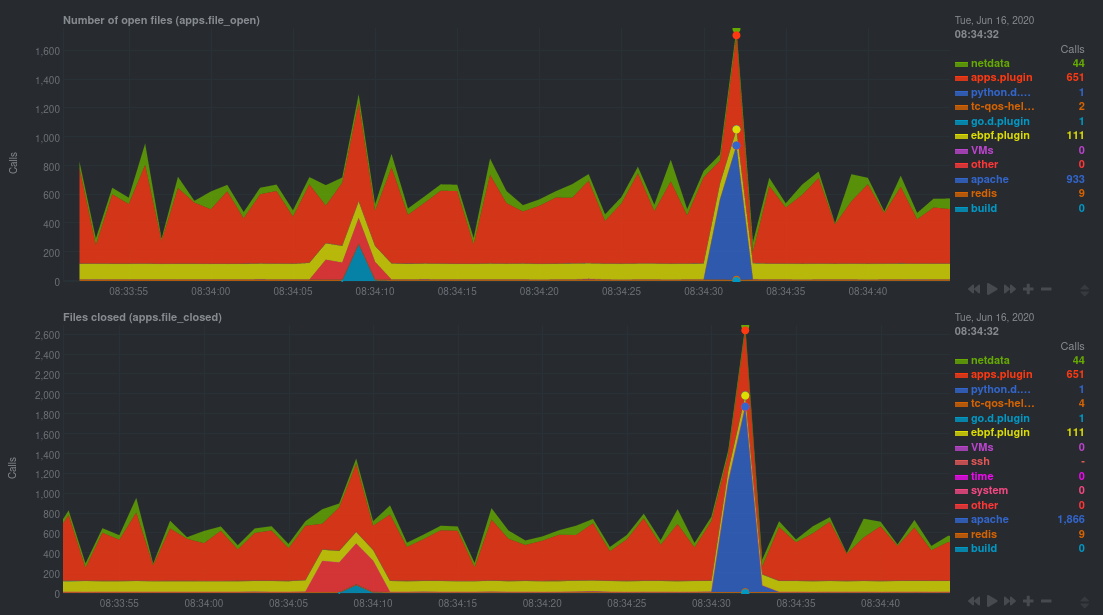 - -In these charts, you can see first a spike in syscalls to open and close files from the configure/build process, -followed by a similar spike from the Apache benchmark. - -> 👋 Don't forget that you can view chart data directly via Netdata's API! -> -> For example, open your browser and navigate to `http://NODE:19999/api/v1/data?chart=apps.file_open`, replacing `NODE` -> with the IP address or hostname of your Agent. The API returns JSON of that chart's dimensions and metrics, which you -> can use in other operations. -> -> To see other charts, replace `apps.file_open` with the context of the chart you want to see data for. -> -> To see all the API options, visit our [Swagger -> documentation](https://editor.swagger.io/?url=https://raw.githubusercontent.com/netdata/netdata/master/web/api/netdata-swagger.yaml) -> and look under the **/data** section. - -## Troubleshoot and debug applications with eBPF - -The actual method of troubleshooting and debugging any application with Netdata's eBPF metrics depends on the -application, its place within your stack, and the type of issue you're trying to root cause. This guide won't be able to -explain how to troubleshoot _any_ application with eBPF metrics, but it should give you some ideas on how to start with -your own systems. - -The value of using Netdata to collect and visualize eBPF metrics is that you don't have to rely on existing (complex) -command line eBPF programs or, even worse, write your own eBPF program to get the information you need. - -Let's walk through some scenarios where you might find value in eBPF metrics. - -### Benchmark application performance - -You can use eBPF metrics to profile the performance of your applications, whether they're custom or a standard Linux -service, like a web server or database. - -For example, look at the charts below. The first spike represents running a Redis benchmark _without_ pipelining -(`redis-benchmark -n 1000000 -t set,get -q`). The second spike represents the same benchmark _with_ pipelining -(`redis-benchmark -n 1000000 -t set,get -q -P 16`). - -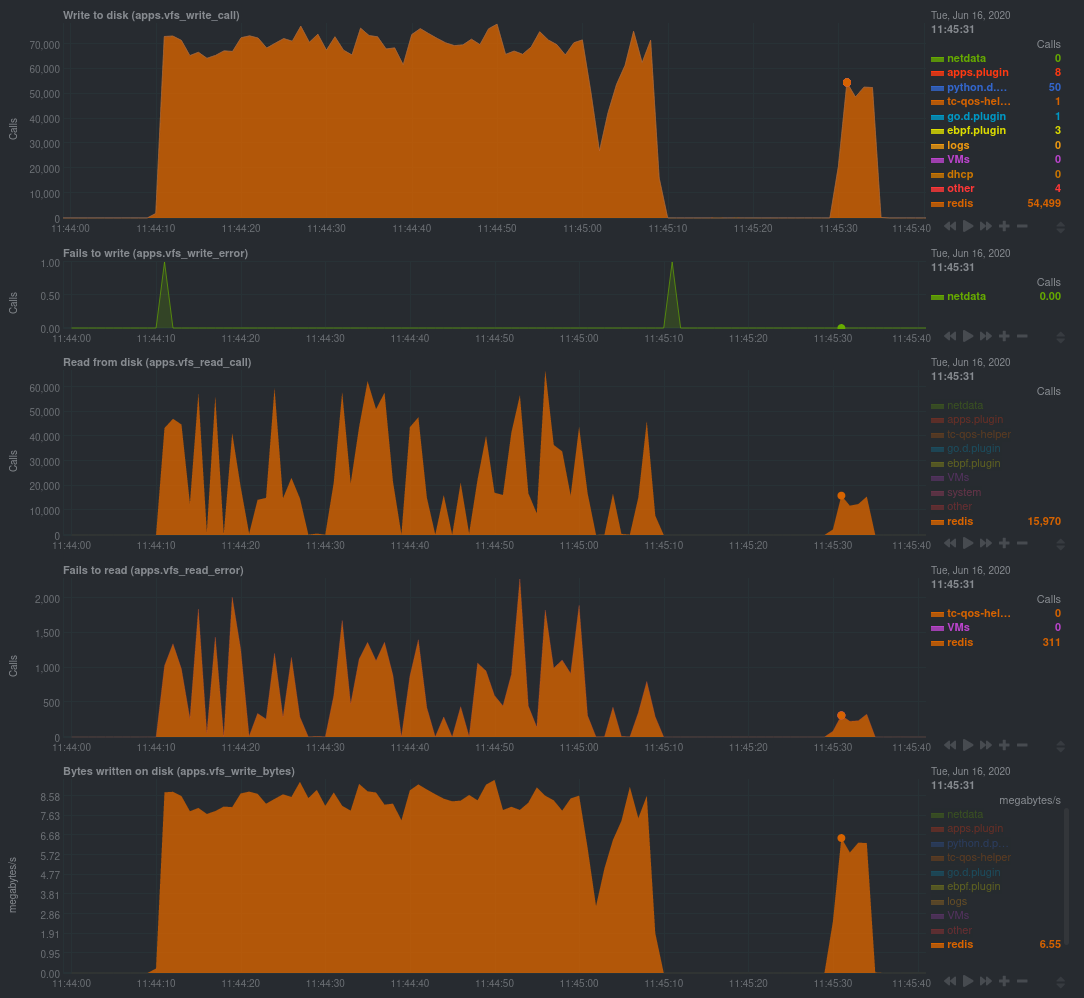 - -The performance optimization is clear from the speed at which the benchmark finished (the horizontal length of the -spike) and the reduced write/read syscalls and bytes written to disk. - -You can run similar performance benchmarks against any application, view the results on a Linux kernel level, and -continuously improve the performance of your infrastructure. - -### Inspect for leaking file descriptors - -If your application runs fine and then only crashes after a few hours, leaking file descriptors may be to blame. - -Check the **Number of open files (apps.file_open)** and **Files closed (apps.file_closed)** for discrepancies. These -metrics should be more or less equal. If they diverge, with more open files than closed, your application may not be -closing file descriptors properly. - -See, for example, the volume of files opened and closed by `apps.plugin` itself. Because the eBPF collector is -monitoring these syscalls at an event level, you can see at any given second that the open and closed numbers as equal. - -This isn't to say Netdata is _perfect_, but at least `apps.plugin` doesn't have a file descriptor problem. - -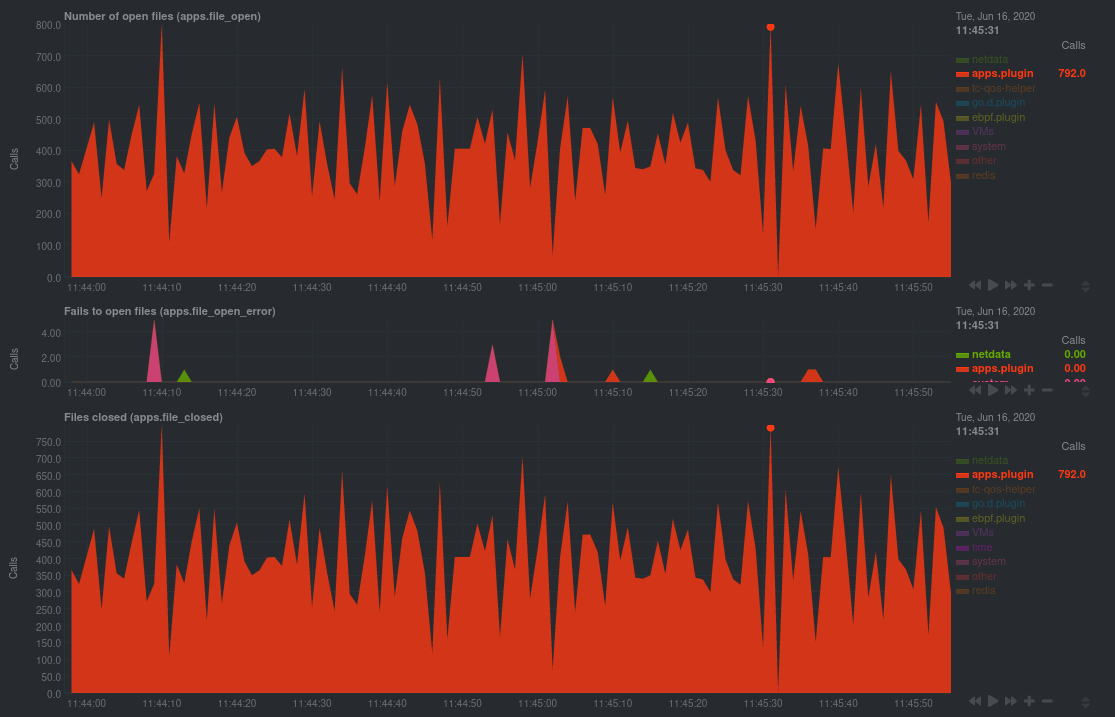 - -### Pin down syscall failures - -If you enabled the eBPF collector's `return` mode as mentioned [in a previous -step](#configure-the-ebpf-collector-to-monitor-errors), you can view charts related to how often a given application's -syscalls return in failure. - -By understanding when these failures happen, and when, you might be able to diagnose a bug in your application. - -To diagnose potential issues with an application, look at the **Fails to open files (apps.file_open_error)**, **Fails to -close files (apps.file_close_error)**, **Fails to write (apps.vfs_write_error)**, and **Fails to read -(apps.vfs_read_error)** charts for failed syscalls coming from your application. If you see any, look to the surrounding -charts for anomalies at the same time frame, or correlate with other activity in the application or on the system to get -closer to the root cause. - -### Investigate zombie processes - -Look for the trio of **Process started (apps.process_create)**, **Threads started (apps.thread_create)**, and **Tasks -closed (apps.task_close)** charts to investigate situations where an application inadvertently leaves [zombie -processes](https://en.wikipedia.org/wiki/Zombie_process). - -These processes, which are terminated and don't use up system resources, can still cause issues if your system runs out -of available PIDs to allocate. - -For example, the chart below demonstrates a [zombie factory -program](https://www.refining-linux.org/archives/7-Dr.-Frankenlinux-or-how-to-create-zombie-processes.html) in action. - -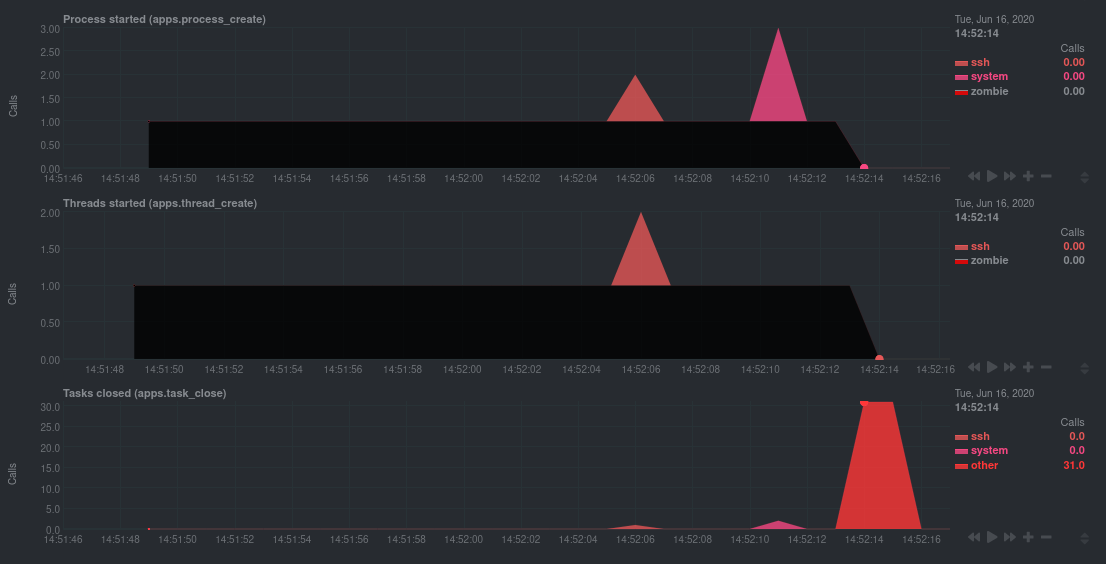 - -Starting at 14:51:49, Netdata sees the `zombie` group creating one new process every second, but no closed tasks. This -continues for roughly 30 seconds, at which point the factory program was killed with `SIGINT`, which results in the 31 -closed tasks in the subsequent second. - -Zombie processes may not be catastrophic, but if you're developing an application on Linux, you should eliminate them. -If a service in your stack creates them, you should consider filing a bug report. - -## View eBPF metrics in Netdata Cloud - -You can also show per-application eBPF metrics in Netdata Cloud. This could be particularly useful if you're running the -same application on multiple systems and want to correlate how it performs on each target, or if you want to share your -findings with someone else on your team. - -If you don't already have a Netdata Cloud account, go [sign in](https://app.netdata.cloud) and get started for free. -You can also read how to [monitor your infrastructure with Netdata Cloud](https://github.com/netdata/netdata/blob/master/docs/quickstart/infrastructure.md) to understand the key features that it has to offer. - -Once you've added one or more nodes to a Space in Netdata Cloud, you can see aggregated eBPF metrics in the [Overview -dashboard](https://github.com/netdata/netdata/blob/master/docs/visualize/overview-infrastructure.md) under the same **Applications** or **eBPF** sections that you -find on the local Agent dashboard. Or, [create new dashboards](https://github.com/netdata/netdata/blob/master/docs/cloud/visualize/dashboards.md) using eBPF metrics -from any number of distributed nodes to see how your application interacts with multiple Linux kernels on multiple Linux -systems. - -Now that you can see eBPF metrics in Netdata Cloud, you can [invite your -team](https://github.com/netdata/netdata/blob/master/docs/cloud/manage/organize-your-infrastrucutre-invite-your-team.md#invite-your-team) and share your findings with others. - - - diff --git a/docs/guides/troubleshoot/troubleshooting-agent-with-cloud-connection.md b/docs/guides/troubleshoot/troubleshooting-agent-with-cloud-connection.md deleted file mode 100644 index 9c69ee915..000000000 --- a/docs/guides/troubleshoot/troubleshooting-agent-with-cloud-connection.md +++ /dev/null @@ -1,147 +0,0 @@ -# Troubleshoot Agent-Cloud connectivity issues - -Learn how to troubleshoot connectivity issues leading to agents not appearing at all in Netdata Cloud, or -appearing with a status other than `live`. - -After installing an agent with the claiming token provided by Netdata Cloud, you should see charts from that node on -Netdata Cloud within seconds. If you don't see charts, check if the node appears in the list of nodes -(Nodes tab, top right Node filter, or Manage Nodes screen). If your node does not appear in the list, or it does appear with a status other than "Live", this guide will help you troubleshoot what's happening. - - The most common explanation for connectivity issues usually falls into one of the following three categories: - -- If the node does not appear at all in Netdata Cloud, [the claiming process was unsuccessful](#the-claiming-process-was-unsuccessful). -- If the node appears as in Netdata Cloud, but is in the "Unseen" state, [the Agent was claimed but can not connect](#the-agent-was-claimed-but-can-not-connect). -- If the node appears as in Netdata Cloud as "Offline" or "Stale", it is a [previously connected agent that can no longer connect](#previously-connected-agent-that-can-no-longer-connect). - -## The claiming process was unsuccessful - -If the claiming process fails, the node will not appear at all in Netdata Cloud. - -First ensure that you: -- Use the newest possible stable or nightly version of the agent (at least v1.32). -- Your node can successfully issue an HTTPS request to https://app.netdata.cloud - -Other possible causes differ between kickstart installations and Docker installations. - -### Verify your node can access Netdata Cloud - -If you run either `curl` or `wget` to do an HTTPS request to https://app.netdata.cloud, you should get -back a 404 response. If you do not, check your network connectivity, domain resolution, -and firewall settings for outbound connections. - -If your firewall is configured to completely prevent outbound connections, you need to whitelist `app.netdata.cloud` and `mqtt.netdata.cloud`. If you can't whitelist domains in your firewall, you can whitelist the IPs that the hostnames resolve to, but keep in mind that they can change without any notice. - -If you use an outbound proxy, you need to [take some extra steps]( https://github.com/netdata/netdata/blob/master/claim/README.md#connect-through-a-proxy). - -### Troubleshoot claiming with kickstart.sh - -Claiming is done by executing `netdata-claim.sh`, a script that is usually located under `${INSTALL_PREFIX}/netdata/usr/sbin/netdata-claim.sh`. Possible error conditions we have identified are: -- No script found at all in any of our search paths. -- The path where the claiming script should be does not exist. -- The path exists, but is not a file. -- The path is a file, but is not executable. -Check the output of the kickstart script for any reported errors claiming and verify that the claiming script exists -and can be executed. - -### Troubleshoot claiming with Docker - -First verify that the NETDATA_CLAIM_TOKEN parameter is correctly configured and then check for any errors during -initialization of the container. - -The most common issue we have seen claiming nodes in Docker is [running on older hosts with seccomp enabled](https://github.com/netdata/netdata/blob/master/claim/README.md#known-issues-on-older-hosts-with-seccomp-enabled). - -## The Agent was claimed but can not connect - -Agents that appear on the cloud with state "Unseen" have successfully been claimed, but have never -been able to successfully establish an ACLK connection. - -Agents that appear with state "Offline" or "Stale" were able to connect at some point, but are currently not -connected. The difference between the two is that "Stale" nodes had some of their data replicated to a -parent node that is still connected. - -### Verify that the agent is running - -#### Troubleshoot connection establishment with kickstart.sh - -The kickstart script will install/update your Agent and then try to claim the node to the Cloud -(if tokens are provided). To complete the second part, the Agent must be running. In some platforms, -the Netdata service cannot be enabled by default and you must do it manually, using the following steps: - -1. Check if the Agent is running: - - ```bash - systemctl status netdata - ``` - - The expected output should contain info like this: - - ```bash - Active: active (running) since Wed 2022-07-06 12:25:02 EEST; 1h 40min ago - ``` - -2. Enable and start the Netdata Service. - - ```bash - systemctl enable netdata - systemctl start netdata - ``` - -3. Retry the kickstart claiming process. - -> ### Note -> -> In some cases a simple restart of the Agent can fix the issue. -> Read more about [Starting, Stopping and Restarting the Agent](https://github.com/netdata/netdata/blob/master/docs/configure/start-stop-restart.md). - -#### Troubleshoot connection establishment with Docker - -If a Netdata container exits or is killed before it properly starts, it may be able to complete the claiming -process, but not have enough time to establish the ACLK connection. - -### Verify that your firewall allows websockets - -The agent initiates an SSL connection to `app.netdata.cloud` and then upgrades that connection to use secure -websockets. Some firewalls completely prevent the use of websockets, even for outbound connections. - -## Previously connected agent that can no longer connect - -The states "Offline" and "Stale" suggest that the agent was able to connect at some point in the past, but -that it is currently not connected. - -### Verify that network connectivity is still possible - -Verify that you can still issue HTTPS requests to app.netdata.cloud and that no firewall or proxy changes were made. - -### Verify that the claiming info is persisted - -If you use Docker, verify that the contents of `/var/lib/netdata` are preserved across container restarts, using a persistent volume. - -### Verify that the claiming info is not cloned - -A relatively common case we have seen especially with VMs is two or more nodes sharing the same credentials. -This happens if you claim a node in a VM and then create an image based on that node. Netdata can't properly -work this way, as we have unique node identification information under `/var/lib/netdata`. - -### Verify that your IP is not blocked by Netdata Cloud - -Most of the nodes change IPs dynamically. It is possible that your current IP has been restricted from accessing `app.netdata.cloud` due to security concerns, usually because it was spamming Netdata Coud with too many -failed requests (old versions of the agent). - -To verify this: - -1. Check the Agent's `aclk-state`. - - ```bash - sudo netdatacli aclk-state | grep "Banned By Cloud" - ``` - - The output will contain a line indicating if the IP is banned from `app.netdata.cloud`: - - ```bash - Banned By Cloud: yes - ``` - -2. If your node's IP is banned, you can: - - - Contact our team to whitelist your IP by submitting a ticket in the [Netdata forum](https://community.netdata.cloud/) - - Change your node's IP |