
diff options
Diffstat (limited to 'docs/monitor/view-active-alarms.md')
| -rw-r--r-- | docs/monitor/view-active-alarms.md | 75 |
1 files changed, 75 insertions, 0 deletions
diff --git a/docs/monitor/view-active-alarms.md b/docs/monitor/view-active-alarms.md new file mode 100644 index 000000000..8837e48ad --- /dev/null +++ b/docs/monitor/view-active-alarms.md @@ -0,0 +1,75 @@ +<!-- +title: "View active health alarms" +description: "View active alarms and their rich data to discover and resolve anomalies and performance issues across your infrastructure." +custom_edit_url: https://github.com/netdata/netdata/edit/master/docs/monitor/view-active-alarms.md +--> + +# View active health alarms + +Every Netdata Agent comes with hundreds of pre-installed health alarms designed to notify you when an anomaly or +performance issue affects your node or the applications it runs. + +As soon as you launch a Netdata Agent and [claim it](/docs/get/README.md#claim-your-node-on-netdata-cloud), you can view +active alarms in both the local dashboard and Netdata Cloud. + +## View active alarms in Netdata Cloud + +You can see active alarms from any node in your infrastructure in two ways: Click on the bell 🔔 icon in the top +navigation, or click on the first column of any node's row in Nodes. This column's color changes based on the node's +[health status](/health/REFERENCE.md#alarm-statuses): gray is `CLEAR`, yellow is `WARNING`, and red is `CRITICAL`. + +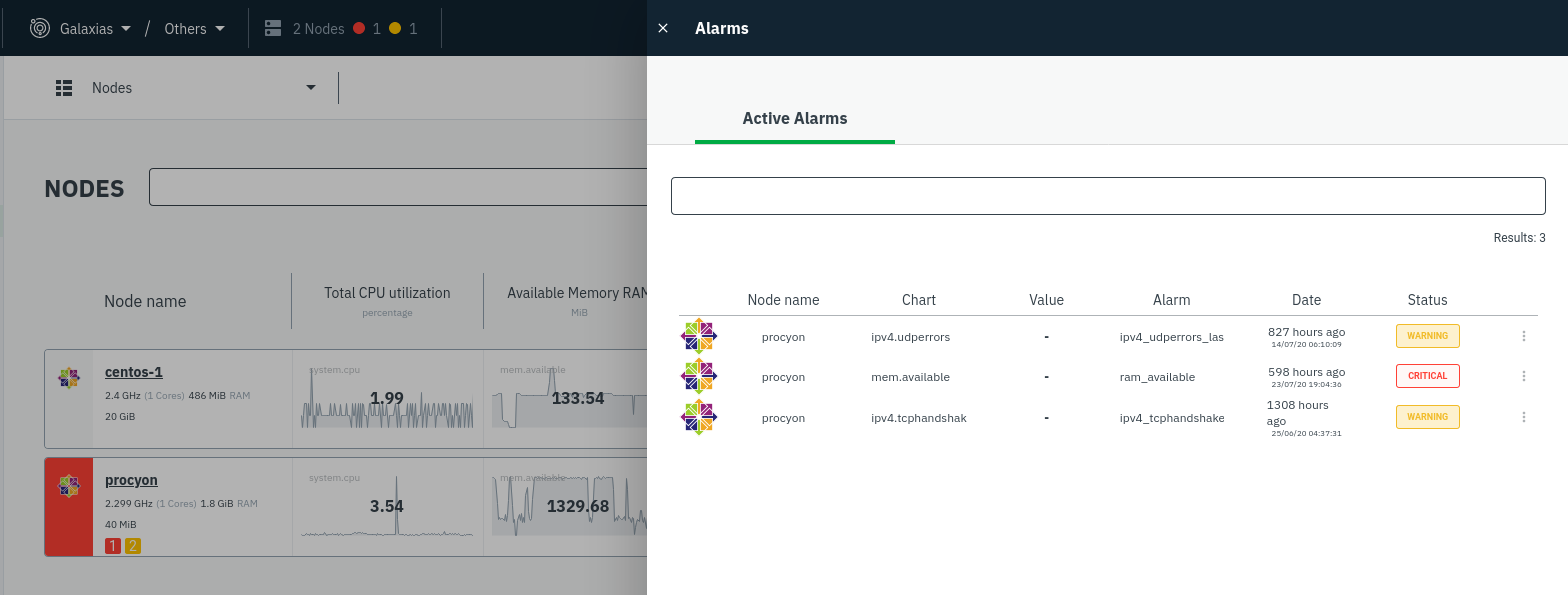 + +The Alarms panel lists all active alarms for nodes within that War Room, and tells you which chart triggered the alarm, +what that chart's current value is, the alarm that triggered it, and when the alarm status first began. + +Use the input field in the Alarms panel to filter active alarms. You can sort by the node's name, alarm, status, chart +that triggered the alarm, or the operating system. Read more about the [filtering +syntax](https://learn.netdata.cloud/docs/cloud/war-rooms#node-filter) to build valuable filters for your infrastructure. + +Click on the 3-dot icon (`⋮`) to view active alarm information or navigate directly to the offending chart in that +node's Cloud dashboard with the **Go to chart** button. + +The active alarm information gives you details about the alarm that's been triggered. You can see the alarm's +configuration, how it calculates warning or critical alarms, and which configuration file you could edit on that node if +you want to tweak or disable the alarm to better suit your needs. + +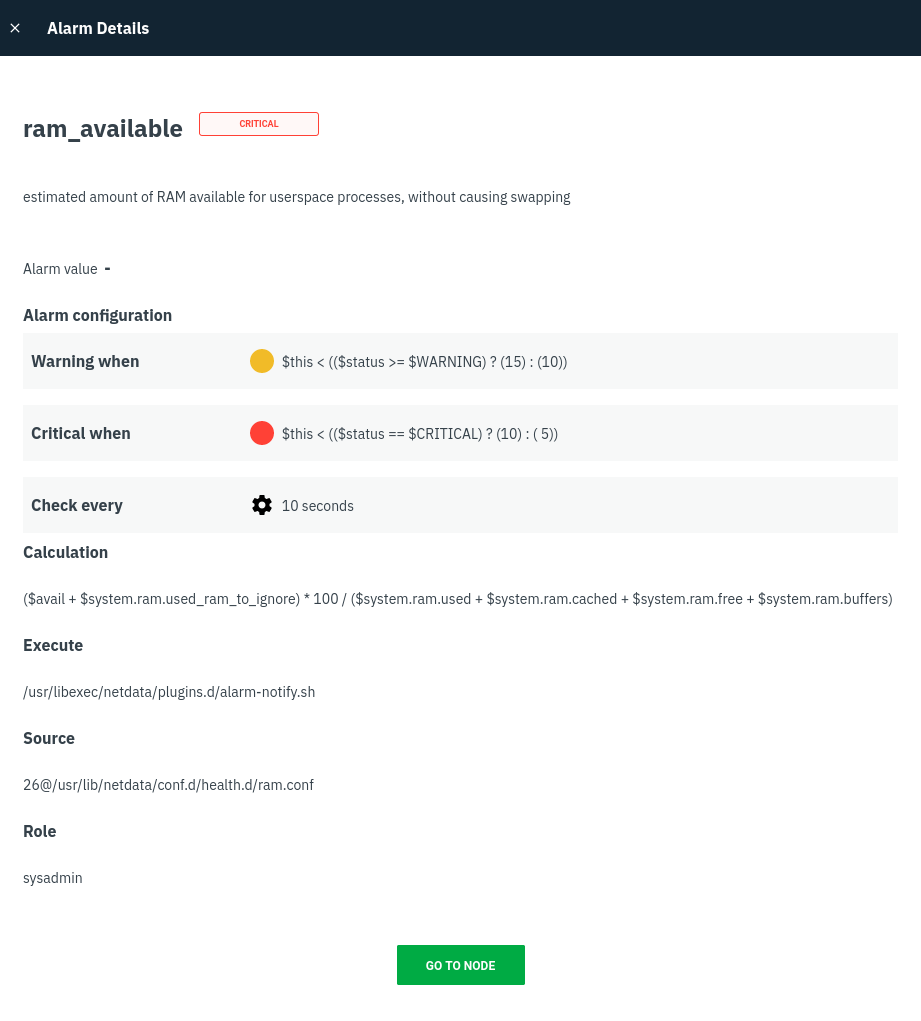 + +## View active alarms in the Netdata Agent + +Find the bell 🔔 icon in the top navigation to bring up a modal that shows currently raised alarms, all running alarms, +and the alarms log. Here is an example of a raised `system.cpu` alarm, followed by the full list and alarm log: + + + +And a static screenshot of the raised CPU alarm: + + + +The alarm itself is named **system - cpu**, and its context is `system.cpu`. Beneath that is an auto-updating badge that +shows the latest value of the chart that triggered the alarm. + +With the three icons beneath that and the **role** designation, you can: + +1. Scroll to the chart associated with this raised alarm. +2. Copy a link to the badge to your clipboard. +3. Copy the code to embed the badge onto another web page using an `<embed>` element. + +The table on the right-hand side displays information about the health entity that triggered the alarm, which you can +use as a reference to [configure alarms](/docs/monitor/configure-alarms.md). + +## What's next? + +With the information that appears on Netdata Cloud and the local dashboard about active alarms, you can [configure +alarms](/docs/monitor/configure-alarms.md) to match your infrastructure's needs or your team's goals. + +If you're happy with the pre-configured alarms, skip ahead to [enable +notifications](/docs/monitor/enable-notifications.md) to use Netdata Cloud's centralized alarm notifications and/or +per-node notifications to endpoints like Slack, PagerDuty, Twilio, and more. + +[](<>) |