
diff options
Diffstat (limited to 'docs/monitor')
| -rw-r--r-- | docs/monitor/configure-alarms.md | 148 | ||||
| -rw-r--r-- | docs/monitor/enable-notifications.md | 144 | ||||
| -rw-r--r-- | docs/monitor/view-active-alarms.md | 75 |
3 files changed, 367 insertions, 0 deletions
diff --git a/docs/monitor/configure-alarms.md b/docs/monitor/configure-alarms.md new file mode 100644 index 000000000..2a977955b --- /dev/null +++ b/docs/monitor/configure-alarms.md @@ -0,0 +1,148 @@ +<!-- +title: "Configure health alarms" +description: "Netdata's health monitoring watchdog is incredibly adaptable to your infrastructure's unique needs, with configurable health alarms." +custom_edit_url: https://github.com/netdata/netdata/edit/master/docs/monitor/configure-alarms.md +--> + +# Configure health alarms + +Netdata's health watchdog is highly configurable, with support for dynamic thresholds, hysteresis, alarm templates, and +more. You can tweak any of the existing alarms based on your infrastructure's topology or specific monitoring needs, or +create new entities. + +You can use health alarms in conjunction with any of Netdata's [collectors](/docs/collect/how-collectors-work.md) (see +the [supported collector list](/collectors/COLLECTORS.md)) to monitor the health of your systems, containers, and +applications in real time. + +While you can see active alarms both on the local dashboard and Netdata Cloud, all health alarms are configured _per +node_ via individual Netdata Agents. If you want to deploy a new alarm across your +[infrastructure](/docs/quickstart/infrastructure.md), you must configure each node with the same health configuration +files. + +## Edit health configuration files + +All of Netdata's [health configuration files](/health/REFERENCE.md#health-configuration-files) are in Netdata's config +directory, inside the `health.d/` directory. Navigate to your [Netdata config directory](/docs/configure/nodes.md) and +use `edit-config` to make changes to any of these files. + +For example, to edit the `cpu.conf` health configuration file, run: + +```bash +sudo ./edit-config health.d/cpu.conf +``` + +Each health configuration file contains one or more health _entities_, which always begin with `alarm:` or `template:`. +For example, here is the first health entity in `health.d/cpu.conf`: + +```yaml +template: 10min_cpu_usage + on: system.cpu + os: linux + hosts: * + lookup: average -10m unaligned of user,system,softirq,irq,guest + units: % + every: 1m + warn: $this > (($status >= $WARNING) ? (75) : (85)) + crit: $this > (($status == $CRITICAL) ? (85) : (95)) + delay: down 15m multiplier 1.5 max 1h + info: average cpu utilization for the last 10 minutes (excluding iowait, nice and steal) + to: sysadmin +``` + +To tune this alarm to trigger warning and critical alarms at a lower CPU utilization, change the `warn` and `crit` lines +to the values of your choosing. For example: + +```yaml + warn: $this > (($status >= $WARNING) ? (60) : (75)) + crit: $this > (($status == $CRITICAL) ? (75) : (85)) +``` + +Save the file and [reload Netdata's health configuration](#reload-health-configuration) to make your changes live. + +### Silence an individual alarm + +Instead of disabling an alarm altogether, or even disabling _all_ alarms, you can silence individual alarms by changing +one line in a given health entity. To silence any single alarm, change the `to:` line in its entity to `silent`. + +```yaml + to: silent +``` + +## Write a new health entity + +While tuning existing alarms may work in some cases, you may need to write entirely new health entities based on how +your systems, containers, and applications work. + +Read Netdata's [health reference](/health/REFERENCE.md#health-entity-reference) for a full listing of the format, +syntax, and functionality of health entities. + +To write a new health entity into a new file, navigate to your [Netdata config directory](/docs/configure/nodes.md), +then use `touch` to create a new file in the `health.d/` directory. Use `edit-config` to start editing the file. + +As an example, let's create a `ram-usage.conf` file. + +```bash +sudo touch health.d/ram-usage.conf +sudo ./edit-config health.d/ram-usage.conf +``` + +For example, here is a health entity that triggers a warning alarm when a node's RAM usage rises above 80%, and a +critical alarm above 90%: + +```yaml + alarm: ram_usage + on: system.ram +lookup: average -1m percentage of used + units: % + every: 1m + warn: $this > 80 + crit: $this > 90 + info: The percentage of RAM being used by the system. +``` + +Let's look into each of the lines to see how they create a working health entity. + +- `alarm`: The name for your new entity. The name needs to follow these requirements: + - Any alphabet letter or number. + - The symbols `.` and `_`. + - Cannot be `chart name`, `dimension name`, `family name`, or `chart variable names`. +- `on`: Which chart the entity listens to. +- `lookup`: Which metrics the alarm monitors, the duration of time to monitor, and how to process the metrics into a + usable format. + - `average`: Calculate the average of all the metrics collected. + - `-1m`: Use metrics from 1 minute ago until now to calculate that average. + - `percentage`: Clarify that we're calculating a percentage of RAM usage. + - `of used`: Specify which dimension (`used`) on the `system.ram` chart you want to monitor with this entity. +- `units`: Use percentages rather than absolute units. +- `every`: How often to perform the `lookup` calculation to decide whether or not to trigger this alarm. +- `warn`/`crit`: The value at which Netdata should trigger a warning or critical alarm. This example uses simple + syntax, but most pre-configured health entities use + [hysteresis](/health/REFERENCE.md#special-usage-of-the-conditional-operator) to avoid superfluous notifications. +- `info`: A description of the alarm, which will appear in the dashboard and notifications. + +In human-readable format: + +> This health entity, named **ram_usage**, watches the **system.ram** chart. It looks up the last **1 minute** of +> metrics from the **used** dimension and calculates the **average** of all those metrics in a **percentage** format, +> using a **% unit**. The entity performs this lookup **every minute**. +> +> If the average RAM usage percentage over the last 1 minute is **more than 80%**, the entity triggers a warning alarm. +> If the usage is **more than 90%**, the entity triggers a critical alarm. + +When you finish writing this new health entity, [reload Netdata's health configuration](#reload-health-configuration) to +see it live on the local dashboard or Netdata Cloud. + +## Reload health configuration + +To make any changes to your health configuration live, you must reload Netdata's health monitoring system. To do that +without restarting all of Netdata, run `netdatacli reload-health` or `killall -USR2 netdata`. + +## What's next? + +With your health entities configured properly, it's time to [enable +notifications](/docs/monitor/enable-notifications.md) to get notified whenever a node reaches a warning or critical +state. + +To build complex, dynamic alarms, read our guide on [dimension templates](/docs/guides/monitor/dimension-templates.md). + +[](<>) diff --git a/docs/monitor/enable-notifications.md b/docs/monitor/enable-notifications.md new file mode 100644 index 000000000..68beba53e --- /dev/null +++ b/docs/monitor/enable-notifications.md @@ -0,0 +1,144 @@ +<!-- +title: "Enable alarm notifications" +description: "Send Netdata alarms from a centralized place with Netdata Cloud, or configure nodes individually, to enable incident response and faster resolution." +custom_edit_url: https://github.com/netdata/netdata/edit/master/docs/monitor/enable-notifications.md +--> + +# Enable alarm notifications + +Netdata offers two ways to receive alarm notifications on external platforms. These methods work independently _or_ in +parallel, which means you can enable both at the same time to send alarm notifications to any number of endpoints. + +Both methods use a node's health alarms to generate the content of alarm notifications. Read the doc on [configuring +alarms](/docs/monitor/configure-alarms.md) to change the preconfigured thresholds or to create tailored alarms for your +infrastructure. + +Netdata Cloud offers [centralized alarm notifications](#netdata-cloud) via email, which leverages the health status +information already streamed to Netdata Cloud from claimed nodes to send notifications to those who have enabled them. + +The Netdata Agent has a [notification system](#netdata-agent) that supports more than a dozen services, such as email, +Slack, PagerDuty, Twilio, Amazon SNS, Discord, and much more. + +For example, use centralized alarm notifications in Netdata Cloud for immediate, zero-configuration alarm notifications +for your team, then configure individual nodes send notifications to a PagerDuty endpoint for an automated incident +response process. + +## Netdata Cloud + +Netdata Cloud's [centralized alarm notifications](https://learn.netdata.cloud/docs/cloud/monitoring/notifications/) is a +zero-configuration way to get notified when an anomaly or incident strikes any node or application in your +infrastructure. The advantage of using centralized alarm notifications from Netdata Cloud is that you don't have to +worry about configuring each node in your infrastructure. + +To enable centralized alarm notifications for a Space, click on **Manage Space** in the left-hand menu, then click on +the **Notifications** tab. Click the toggle switch next to **E-mail** to enable this notification method. + +Next, enable notifications on a user level by clicking on your profile icon, then **Profile** in the dropdown. The +**Notifications** tab reveals rich management settings, including the ability to enable/disable methods entirely or +choose what types of notifications to receive from each War Room. + + + +See the [centralized alarm notifications](https://learn.netdata.cloud/docs/cloud/monitoring/notifications/) reference +doc for further details about what information is conveyed in an email notification, flood protection, and more. + +## Netdata Agent + +The Netdata Agent's [notification system](/health/notifications/README.md) runs on every node and dispatches +notifications based on configured endpoints and roles. You can enable multiple endpoints on any one node _and_ use Agent +notifications in parallel with centralized alarm notifications in Netdata Cloud. + +> ❗ If you want to enable notifications from multiple nodes in your infrastructure, each running the Netdata Agent, you +> must configure each node individually. + +Below, we'll use [Slack notifications](#enable-slack-notifications) as an example of the process of enabling any +notification platform. + +### Supported notification endpoints + +- [**alerta.io**](/health/notifications/alerta/README.md) +- [**Amazon SNS**](/health/notifications/awssns/README.md) +- [**Custom endpoint**](/health/notifications/custom/README.md) +- [**Discord**](/health/notifications/discord/README.md) +- [**Dynatrace**](/health/notifications/dynatrace/README.md) +- [**Email**](/health/notifications/email/README.md) +- [**Flock**](/health/notifications/flock/README.md) +- [**Google Hangouts**](/health/notifications/hangouts/README.md) +- [**IRC**](/health/notifications/irc/README.md) +- [**Kavenegar**](/health/notifications/kavenegar/README.md) +- [**Matrix**](/health/notifications/matrix/README.md) +- [**Messagebird**](/health/notifications/messagebird/README.md) +- [**Netdata Agent dashboard**](/health/notifications/web/README.md) +- [**Opsgenie**](/health/notifications/opsgenie/README.md) +- [**PagerDuty**](/health/notifications/pagerduty/README.md) +- [**Prowl**](/health/notifications/prowl/README.md) +- [**PushBullet**](/health/notifications/pushbullet/README.md) +- [**PushOver**](/health/notifications/pushover/README.md) +- [**Rocket.Chat**](/health/notifications/rocketchat/README.md) +- [**Slack**](/health/notifications/slack/README.md) +- [**SMS Server Tools 3**](/health/notifications/smstools3/README.md) +- [**StackPulse**](/health/notifications/stackpulse/README.md) +- [**Syslog**](/health/notifications/syslog/README.md) +- [**Telegram**](/health/notifications/telegram/README.md) +- [**Twilio**](/health/notifications/twilio/README.md) + +### Enable Slack notifications + +First, [Add an incoming webhook](https://slack.com/apps/A0F7XDUAZ-incoming-webhooks) in Slack for the channel where you +want to see alarm notifications from Netdata. Click the green **Add to Slack** button, choose the channel, and click the +**Add Incoming WebHooks Integration** button. + +On the following page, you'll receive a **Webhook URL**. That's what you'll need to configure Netdata, so keep it handy. + +Navigate to your [Netdata config directory](/docs/configure/nodes.md#netdata-config-directory) and use `edit-config` to +open the `health_alarm_notify.conf` file: + +```bash +sudo ./edit-config health_alarm_notify.conf +``` + +Look for the `SLACK_WEBHOOK_URL=" "` line and add the incoming webhook URL you got from Slack: + +```conf +SLACK_WEBHOOK_URL="https://hooks.slack.com/services/XXXXXXXXX/XXXXXXXXX/XXXXXXXXXXXX" +``` + +A few lines down, edit the `DEFAULT_RECIPIENT_SLACK` line to contain a single hash `#` character. This instructs Netdata +to send a notification to the channel you configured with the incoming webhook. + +```conf +DEFAULT_RECIPIENT_SLACK="#" +``` + +To test Slack notifications, switch to the Netdata user. + +```bash +sudo su -s /bin/bash netdata +``` + +Next, run the `alarm-notify` script using the `test` option. + +```bash +/usr/libexec/netdata/plugins.d/alarm-notify.sh test +``` + +You should receive three notifications in your Slack channel for each health status change: `WARNING`, `CRITICAL`, and +`CLEAR`. + +See the [Agent Slack notifications](/health/notifications/slack/README.md) doc for more options and information. + +## What's next? + +Now that you have health entities configured to your infrastructure's needs and notifications to inform you of anomalies +or incidents, your health monitoring setup is complete. + +To make your dashboards most useful during root cause analysis, use Netdata's [distributed data +architecture](/docs/store/distributed-data-architecture.md) for the best-in-class performance and scalability. + +### Related reference documentation + +- [Netdata Cloud · Alarm notifications](https://learn.netdata.cloud/docs/cloud/monitoring/notifications/) +- [Netdata Agent · Notifications](/health/notifications/README.md) + +[](<>) diff --git a/docs/monitor/view-active-alarms.md b/docs/monitor/view-active-alarms.md new file mode 100644 index 000000000..8837e48ad --- /dev/null +++ b/docs/monitor/view-active-alarms.md @@ -0,0 +1,75 @@ +<!-- +title: "View active health alarms" +description: "View active alarms and their rich data to discover and resolve anomalies and performance issues across your infrastructure." +custom_edit_url: https://github.com/netdata/netdata/edit/master/docs/monitor/view-active-alarms.md +--> + +# View active health alarms + +Every Netdata Agent comes with hundreds of pre-installed health alarms designed to notify you when an anomaly or +performance issue affects your node or the applications it runs. + +As soon as you launch a Netdata Agent and [claim it](/docs/get/README.md#claim-your-node-on-netdata-cloud), you can view +active alarms in both the local dashboard and Netdata Cloud. + +## View active alarms in Netdata Cloud + +You can see active alarms from any node in your infrastructure in two ways: Click on the bell 🔔 icon in the top +navigation, or click on the first column of any node's row in Nodes. This column's color changes based on the node's +[health status](/health/REFERENCE.md#alarm-statuses): gray is `CLEAR`, yellow is `WARNING`, and red is `CRITICAL`. + +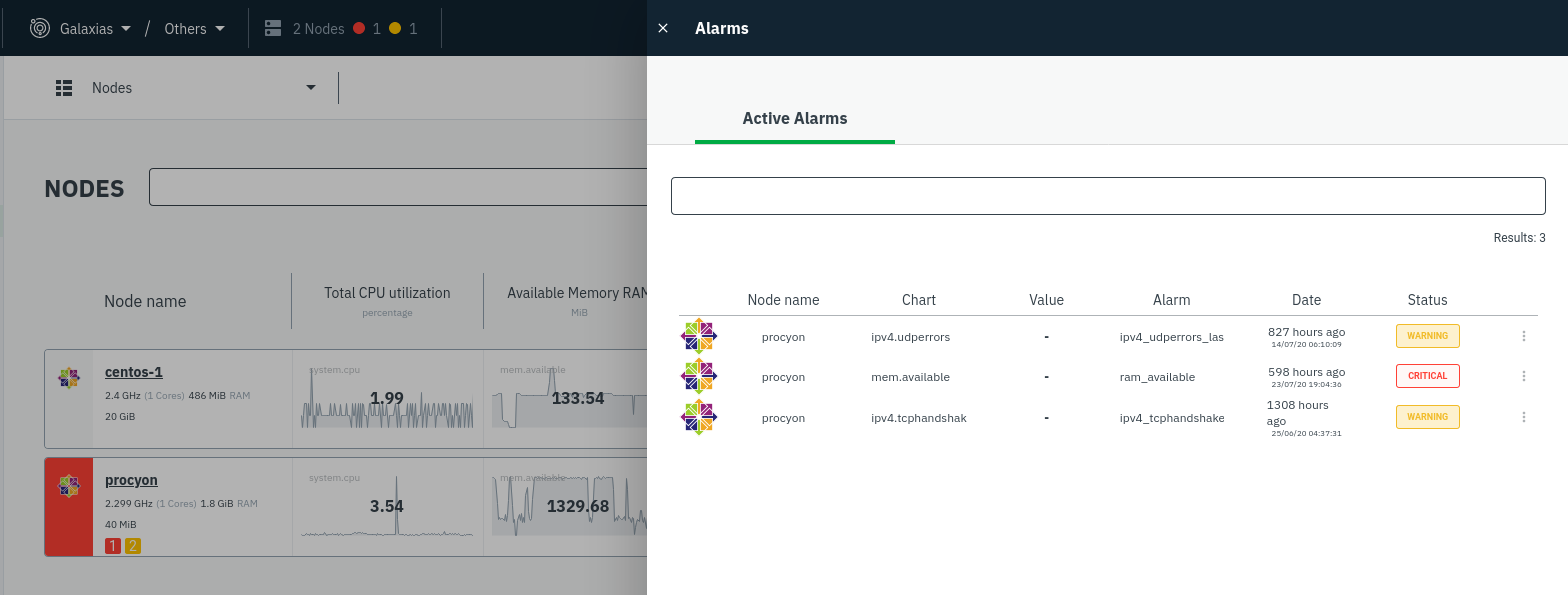 + +The Alarms panel lists all active alarms for nodes within that War Room, and tells you which chart triggered the alarm, +what that chart's current value is, the alarm that triggered it, and when the alarm status first began. + +Use the input field in the Alarms panel to filter active alarms. You can sort by the node's name, alarm, status, chart +that triggered the alarm, or the operating system. Read more about the [filtering +syntax](https://learn.netdata.cloud/docs/cloud/war-rooms#node-filter) to build valuable filters for your infrastructure. + +Click on the 3-dot icon (`⋮`) to view active alarm information or navigate directly to the offending chart in that +node's Cloud dashboard with the **Go to chart** button. + +The active alarm information gives you details about the alarm that's been triggered. You can see the alarm's +configuration, how it calculates warning or critical alarms, and which configuration file you could edit on that node if +you want to tweak or disable the alarm to better suit your needs. + +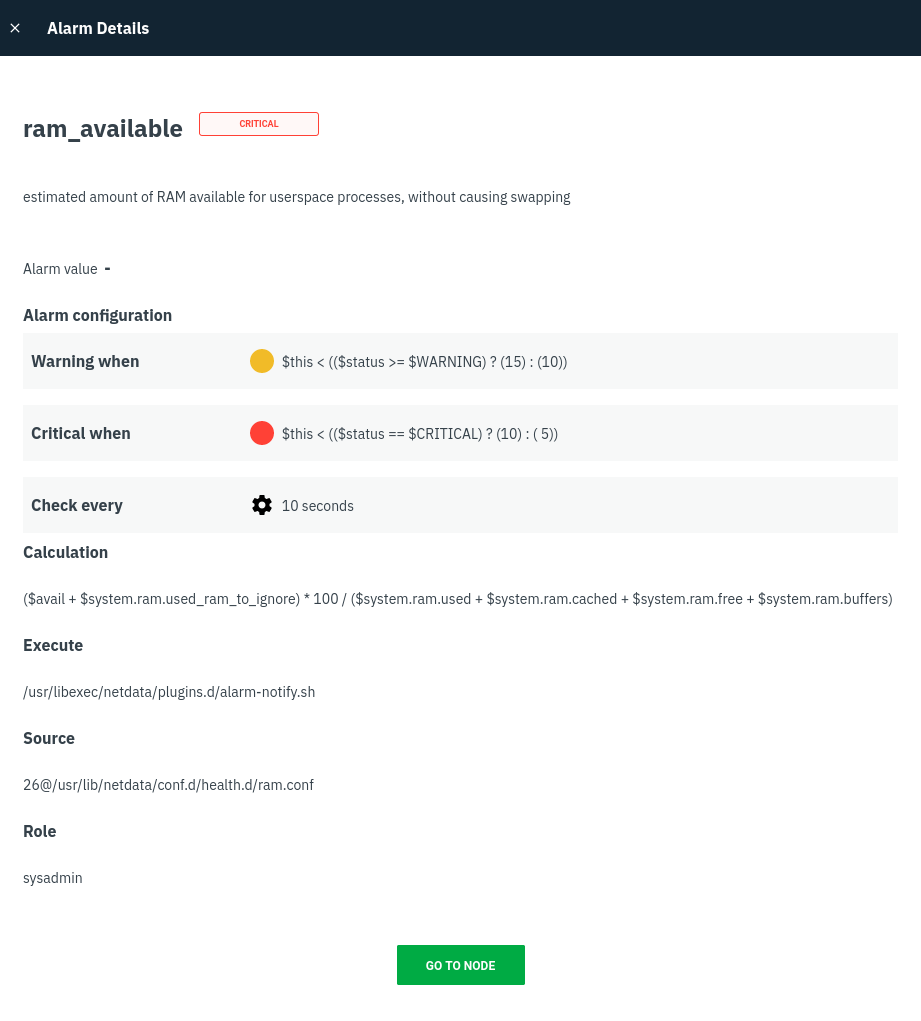 + +## View active alarms in the Netdata Agent + +Find the bell 🔔 icon in the top navigation to bring up a modal that shows currently raised alarms, all running alarms, +and the alarms log. Here is an example of a raised `system.cpu` alarm, followed by the full list and alarm log: + + + +And a static screenshot of the raised CPU alarm: + + + +The alarm itself is named **system - cpu**, and its context is `system.cpu`. Beneath that is an auto-updating badge that +shows the latest value of the chart that triggered the alarm. + +With the three icons beneath that and the **role** designation, you can: + +1. Scroll to the chart associated with this raised alarm. +2. Copy a link to the badge to your clipboard. +3. Copy the code to embed the badge onto another web page using an `<embed>` element. + +The table on the right-hand side displays information about the health entity that triggered the alarm, which you can +use as a reference to [configure alarms](/docs/monitor/configure-alarms.md). + +## What's next? + +With the information that appears on Netdata Cloud and the local dashboard about active alarms, you can [configure +alarms](/docs/monitor/configure-alarms.md) to match your infrastructure's needs or your team's goals. + +If you're happy with the pre-configured alarms, skip ahead to [enable +notifications](/docs/monitor/enable-notifications.md) to use Netdata Cloud's centralized alarm notifications and/or +per-node notifications to endpoints like Slack, PagerDuty, Twilio, and more. + +[](<>) |