
diff options
Diffstat (limited to 'docs/overview')
| -rw-r--r-- | docs/overview/netdata-monitoring-stack.md | 62 | ||||
| -rw-r--r-- | docs/overview/what-is-netdata.md | 76 | ||||
| -rw-r--r-- | docs/overview/why-netdata.md | 63 |
3 files changed, 201 insertions, 0 deletions
diff --git a/docs/overview/netdata-monitoring-stack.md b/docs/overview/netdata-monitoring-stack.md new file mode 100644 index 000000000..1504d5f2b --- /dev/null +++ b/docs/overview/netdata-monitoring-stack.md @@ -0,0 +1,62 @@ +<!-- +title: "Use Netdata standalone or as part of your monitoring stack" +description: "Netdata can run independently or as part of a larger monitoring stack thanks to its flexibility, interoperable core, and exporting features." +custom_edit_url: https://github.com/netdata/netdata/edit/master/docs/overview/netdata-monitoring-stack.md +--> + +# Use Netdata standalone or as part of your monitoring stack + +Netdata is an extremely powerful monitoring, visualization, and troubleshooting platform. While you can use it as an +effective standalone tool, we also designed it to be open and interoperable with other tools you might already be using. + +Netdata helps you collect everything and scales to infrastructure of any size, but it doesn't lock-in data or force you +to use specific tools or methodologies. Each feature is extensible and interoperable so they can work in parallel with +other tools. For example, you can use Netdata to collect metrics, visualize metrics with a second open-source program, +and centralize your metrics in a cloud-based time-series database solution for long-term storage or further analysis. + +You can build a new monitoring stack, including Netdata, or integrate Netdata's metrics with your existing monitoring +stack. No matter which route you take, Netdata helps you monitor infrastructure of any size. + +Here are a few ways to enrich your existing monitoring and troubleshooting stack with Netdata: + +## Collect metrics from Prometheus endpoints + +Netdata automatically detects 600 popular endpoints and collects per-second metrics from them via the [generic +Prometheus collector](https://learn.netdata.cloud/docs/agent/collectors/go.d.plugin/modules/prometheus). This even +includes support for Windows 10 via [`windows_exporter`](https://github.com/prometheus-community/windows_exporter). + +This collector is installed and enabled on all Agent installations by default, so you don't need to waste time +configuring Netdata. Netdata will detect these Prometheus metrics endpoints and collect even more granular metrics than +your existing solutions. You can now use all of Netdata's meaningfully-visualized charts to diagnose issues and +troubleshoot anomalies. + +## Export metrics to external time-series databases + +Netdata can send its per-second metrics to external time-series databases, such as InfluxDB, Prometheus, Graphite, +TimescaleDB, ElasticSearch, AWS Kinesis Data Streams, Google Cloud Pub/Sub Service, and many others. + +To [export metrics to external time-series databases](/docs/export/external-databases.md), you configure an [exporting +_connector_](/docs/export/enable-connector.md). These connectors support filtering and resampling for granular control +over which metrics you export, and at what volume. You can export resampled metrics as collected, as averages, or the +sum of interpolated values based on your needs and other monitoring tools. + +Once you have Netdata's metrics in a secondary time-series database, you can use them however you'd like, such as +additional visualization/dashboarding tools or aggregation of data from multiple sources. + +## Visualize metrics with Grafana + +One popular monitoring stack is Netdata, Graphite, and Grafana. Netdata acts as the stack's metrics collection +powerhouse, Graphite the time-series database, and Grafana the visualization platform. With Netdata at the core, you can +be confident that your monitoring stack is powered by all possible metrics, from all possible sources, from every node +in your infrastructure. + +Of course, just because you export or visualize metrics elsewhere, it doesn't mean Netdata's equivalent features +disappear. You can always build new dashboards in Netdata Cloud, drill down into per-second metrics using Netdata's +charts, or use Netdata's health watchdog to send notifications whenever an anomaly strikes. + +## What's next? + +Whether you're using Netdata standalone or as part of a larger monitoring stack, the next step is the same: [**Get +Netdata**](/docs/get/README.md). + +[](<>) diff --git a/docs/overview/what-is-netdata.md b/docs/overview/what-is-netdata.md new file mode 100644 index 000000000..8ee0db410 --- /dev/null +++ b/docs/overview/what-is-netdata.md @@ -0,0 +1,76 @@ +<!-- +title: "What is Netdata?" +description: "Netdata is distributed, real-time performance and health monitoring for systems and applications on a single node or an entire infrastructure." +custom_edit_url: https://github.com/netdata/netdata/edit/master/docs/overview/what-is-netdata.md +--> + +# What is Netdata? + +Netdata helps sysadmins, SREs, DevOps engineers, and IT professionals collect all possible metrics from systems and +applications, visualize these metrics in real-time, and troubleshoot complex performance problems. + +Netdata's solution uses two components, the Netdata Agent and Netdata Cloud, to deliver real-time performance and health +monitoring for both single nodes and entire infrastructure. + +## Netdata Agent + +Netdata's distributed monitoring Agent collects thousands of metrics from systems, hardware, and applications with zero +configuration. It runs permanently on all your physical/virtual servers, containers, cloud deployments, and edge/IoT +devices. + +You can [install](/docs/get/README.md#install-the-netdata-agent) Netdata on most Linux distributions (Ubuntu, Debian, +CentOS, and more), container/microservice platforms (Kubernetes clusters, Docker), and many other operating systems +(FreeBSD, macOS), with no `sudo` required. + +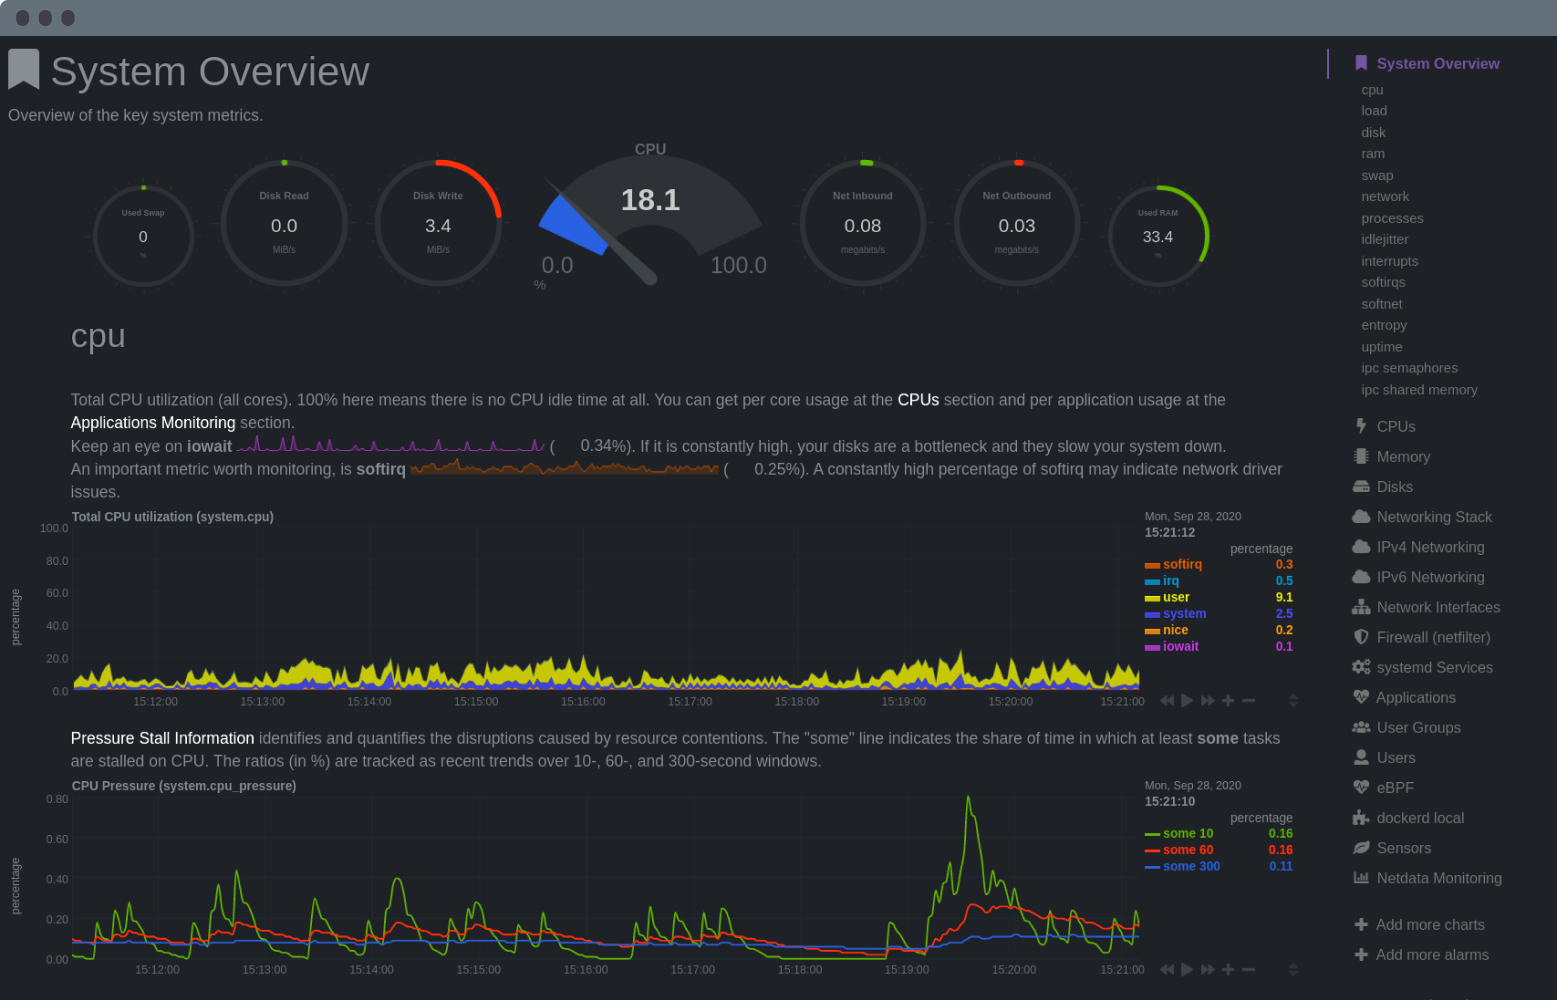 + +## Netdata Cloud + +Netdata Cloud is a web application that gives you real-time visibility for your entire infrastructure. With Netdata +Cloud, you can view key metrics, insightful charts, and active alarms from all your nodes in a single web interface. +When an anomaly strikes, seamlessly navigate to any node to troubleshoot and discover the root cause with the familiar +Netdata dashboard. + +**[Netdata Cloud is +free](https://learn.netdata.cloud/docs/cloud/faq-glossary#how-much-does-netdata-cost-how-and-why-is-it-free)**! You can +add an entire infrastructure of nodes, invite all your colleagues, and visualize any number of metrics, charts, and +alarms entirely for free. + +While Netdata Cloud offers a centralized method of monitoring your Agents, your metrics data is not stored or +centralized in any way. Metrics data remains with your nodes and is only streamed to your browser, through Cloud, when +you're viewing the Netdata Cloud interface. + +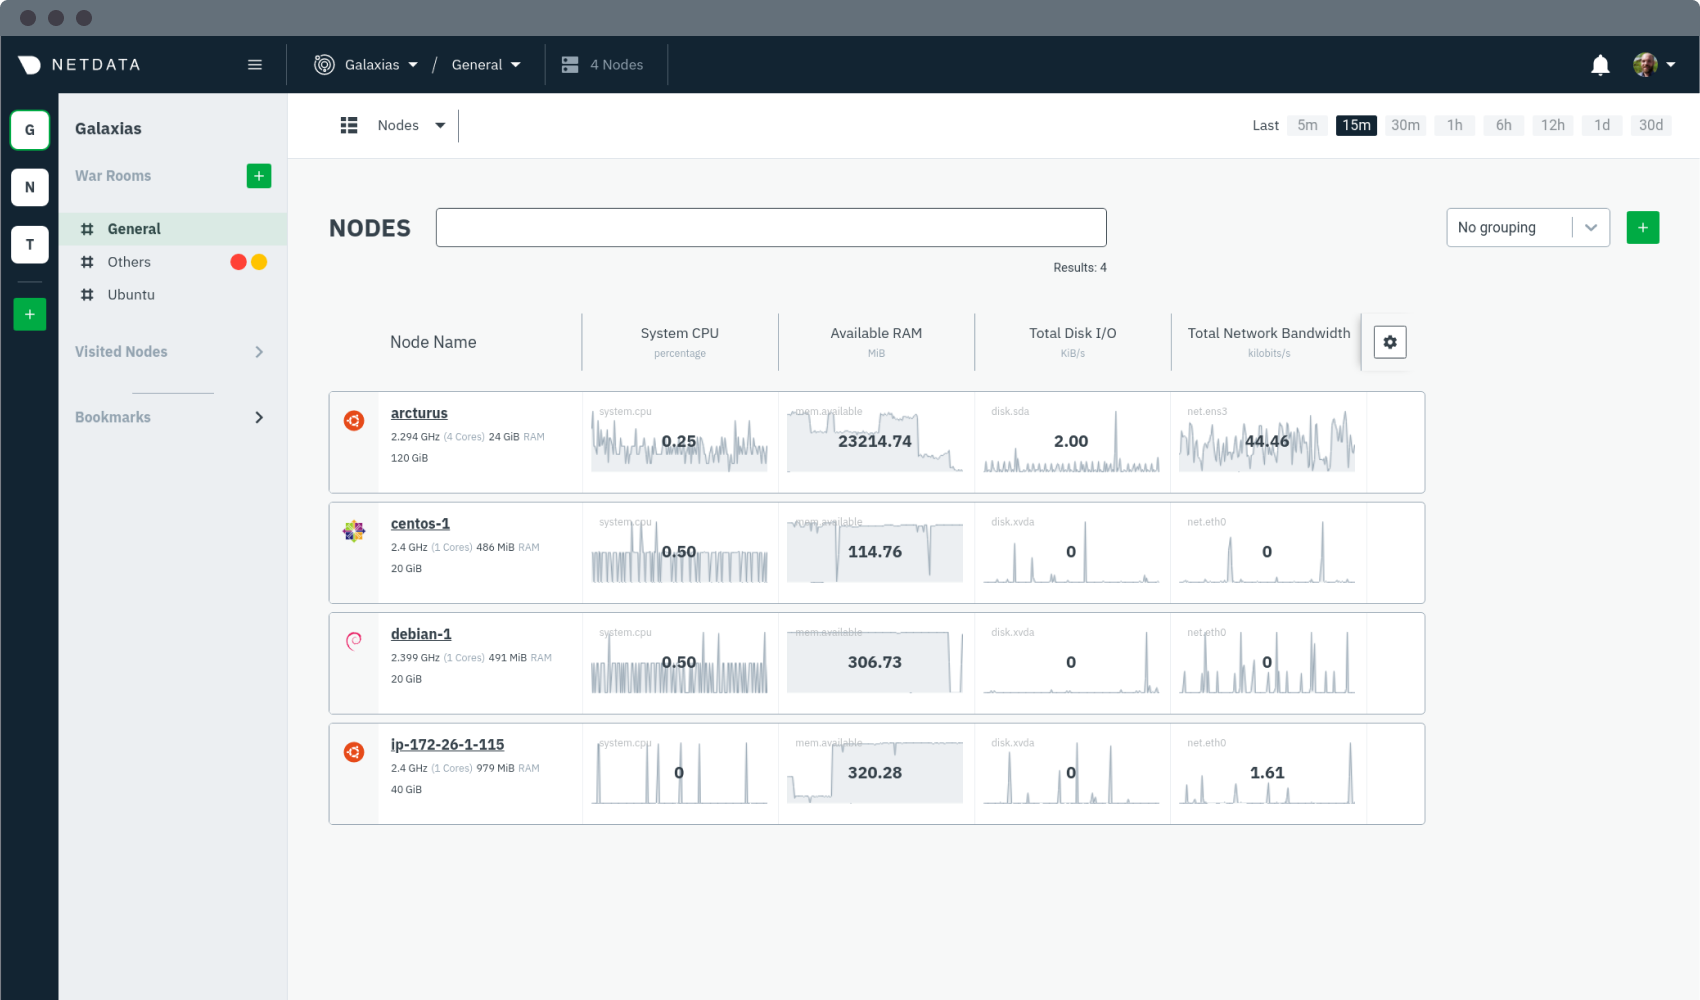 + +## What you can do with Netdata + +Netdata is designed to be both simple to use and flexible for every monitoring, visualization, and troubleshooting use +case: + +- **Collect**: Netdata collects all available metrics from your system and applications with 300+ collectors, + Kubernetes service discovery, and in-depth container monitoring, all while using only 1% CPU and a few MB of RAM. It + even collects metrics from Windows machines. +- **Visualize**: The dashboard meaningfully presents charts to help you understand the relationships between your + hardware, operating system, running apps/services, and the rest of your infrastructure. Add nodes to Netdata Cloud + for a complete view of your infrastructure from a single pane of glass. +- **Monitor**: Netdata's health watchdog uses hundreds of preconfigured alarms to notify you via Slack, email, + PagerDuty and more when an anomaly strikes. Customize with dynamic thresholds, hysteresis, alarm templates, and + role-based notifications. +- **Troubleshoot**: 1s granularity helps you detect analyze anomalies other monitoring platforms might have missed. + Interactive visualizations reduce your reliance on the console, and historical metrics help you trace issues back to + their root cause. +- **Store**: Netdata's efficient database engine efficiently stores per-second metrics for days, weeks, or even + months. Every distributed node stores metrics locally, simplifying deployment, slashing costs, and enriching + Netdata's interactive dashboards. +- **Export**: Integrate per-second metrics with other time-series databases like Graphite, Prometheus, InfluxDB, + TimescaleDB, and more with Netdata's interoperable and extensible core. +- **Stream**: Aggregate metrics from any number of distributed nodes in one place for in-depth analysis, including + ephemeral nodes in a Kubernetes cluster. + +## What's next? + +Learn more about [why you should use Netdata](/docs/overview/why-netdata.md), or [how Netdata works with your existing +monitoring stack](/docs/overview/netdata-monitoring-stack.md). + +[](<>) diff --git a/docs/overview/why-netdata.md b/docs/overview/why-netdata.md new file mode 100644 index 000000000..27a30a4c6 --- /dev/null +++ b/docs/overview/why-netdata.md @@ -0,0 +1,63 @@ +<!-- +title: "Why use Netdata?" +description: "Netdata is simple to deploy, scalable, and optimized for troubleshooting. Cut the complexity and expense out of your monitoring stack." +custom_edit_url: https://github.com/netdata/netdata/edit/master/docs/overview/why-netdata.md +--> + +# Why use Netdata? + +Netdata takes a different approach to helping people build extraordinary infrastructure. It was built out of frustration +with existing monitoring tools that are too complex, too expensive, and don't help their users actually troubleshoot +complex performance and health issues. + +Netdata is: + +## Simple to deploy + +- **One-line deployment** for Linux distributions, plus support for Kubernetes/Docker infrastructures. +- **Zero configuration and maintenance** required to collect thousands of metrics, every second, from the underlying + OS and running applications. +- **Prebuilt charts and alarms** alert you to common anomalies and performance issues without manual configuration. +- **Distributed storage** to simplify the cost and complexity of storing metrics data from any number of nodes. + +## Powerful and scalable + +- **1% CPU utilization, a few MB of RAM, and minimal disk I/O** to run the monitoring Agent on bare metal, virtual + machines, containers, and even IoT devices. +- **Per-second granularity** for an unlimited number of metrics based on the hardware and applications you're running + on your nodes. +- **Interoperable exporters** let you connect Netdata's per-second metrics with an existing monitoring stack and other + time-series databases. + +## Optimized for troubleshooting + +- **Visual anomaly detection** with a UI/UX that emphasizes the relationships between charts. +- **Customizable dashboards** to pinpoint correlated metrics, respond to incidents, and help you streamline your + workflows. +- **Distributed metrics in a centralized interface** to assist users or teams trace complex issues between distributed + nodes. + +## Comparison with other monitoring solutions + +Netdata offers many benefits over the existing monitoring landscape, whether they're expensive SaaS products or other +open-source tools. + +| Netdata | Others (open-source and commercial) | +| :-------------------------------------------------------------- | :--------------------------------------------------------------- | +| **High resolution metrics** (1s granularity) | Low resolution metrics (10s granularity at best) | +| Collects **thousands of metrics per node** | Collects just a few metrics | +| Fast UI optimized for **anomaly detection** | UI is good for just an abstract view | +| **Long-term, autonomous storage** at one-second granularity | Centralized metrics in an expensive data lake at 10s granularity | +| **Meaningful presentation**, to help you understand the metrics | You have to know the metrics before you start | +| Install and get results **immediately** | Long sales process and complex installation process | +| Use it for **troubleshooting** performance problems | Only gathers _statistics of past performance_ | +| **Kills the console** for tracing performance issues | The console is always required for troubleshooting | +| Requires **zero dedicated resources** | Require large dedicated resources | + +## What's next? + +Whether you already have a monitoring stack you want to integrate Netdata into, or are building something from the +ground-up, you should read more on how Netdata can work either [standalone or as an interoperable part of a monitoring +stack](/docs/overview/netdata-monitoring-stack.md). + +[](<>) |