
diff options
Diffstat (limited to 'docs/visualize')
| -rw-r--r-- | docs/visualize/create-dashboards.md | 17 | ||||
| -rw-r--r-- | docs/visualize/interact-dashboards-charts.md | 38 | ||||
| -rw-r--r-- | docs/visualize/overview-infrastructure.md | 32 |
3 files changed, 46 insertions, 41 deletions
diff --git a/docs/visualize/create-dashboards.md b/docs/visualize/create-dashboards.md index 696cd1a74..f4306f335 100644 --- a/docs/visualize/create-dashboards.md +++ b/docs/visualize/create-dashboards.md @@ -14,16 +14,18 @@ In the War Room you want to monitor with this dashboard, click on your War Room' Add** button next to **Dashboards**. In the panel, give your new dashboard a name, and click **+ Add**. Click the **Add Chart** button to add your first chart card. From the dropdown, select the node you want to add the -chart from, then the context. Netdata Cloud shows you a preview of the chart before you finish adding it. +chart from, then the context. Netdata Cloud shows you a preview of the chart before you finish adding it. The **Add Text** button creates a new card with user-defined text, which you can use to describe or document a particular dashboard's meaning and purpose. Enrich the dashboards you create with documentation or procedures on how to -respond +respond 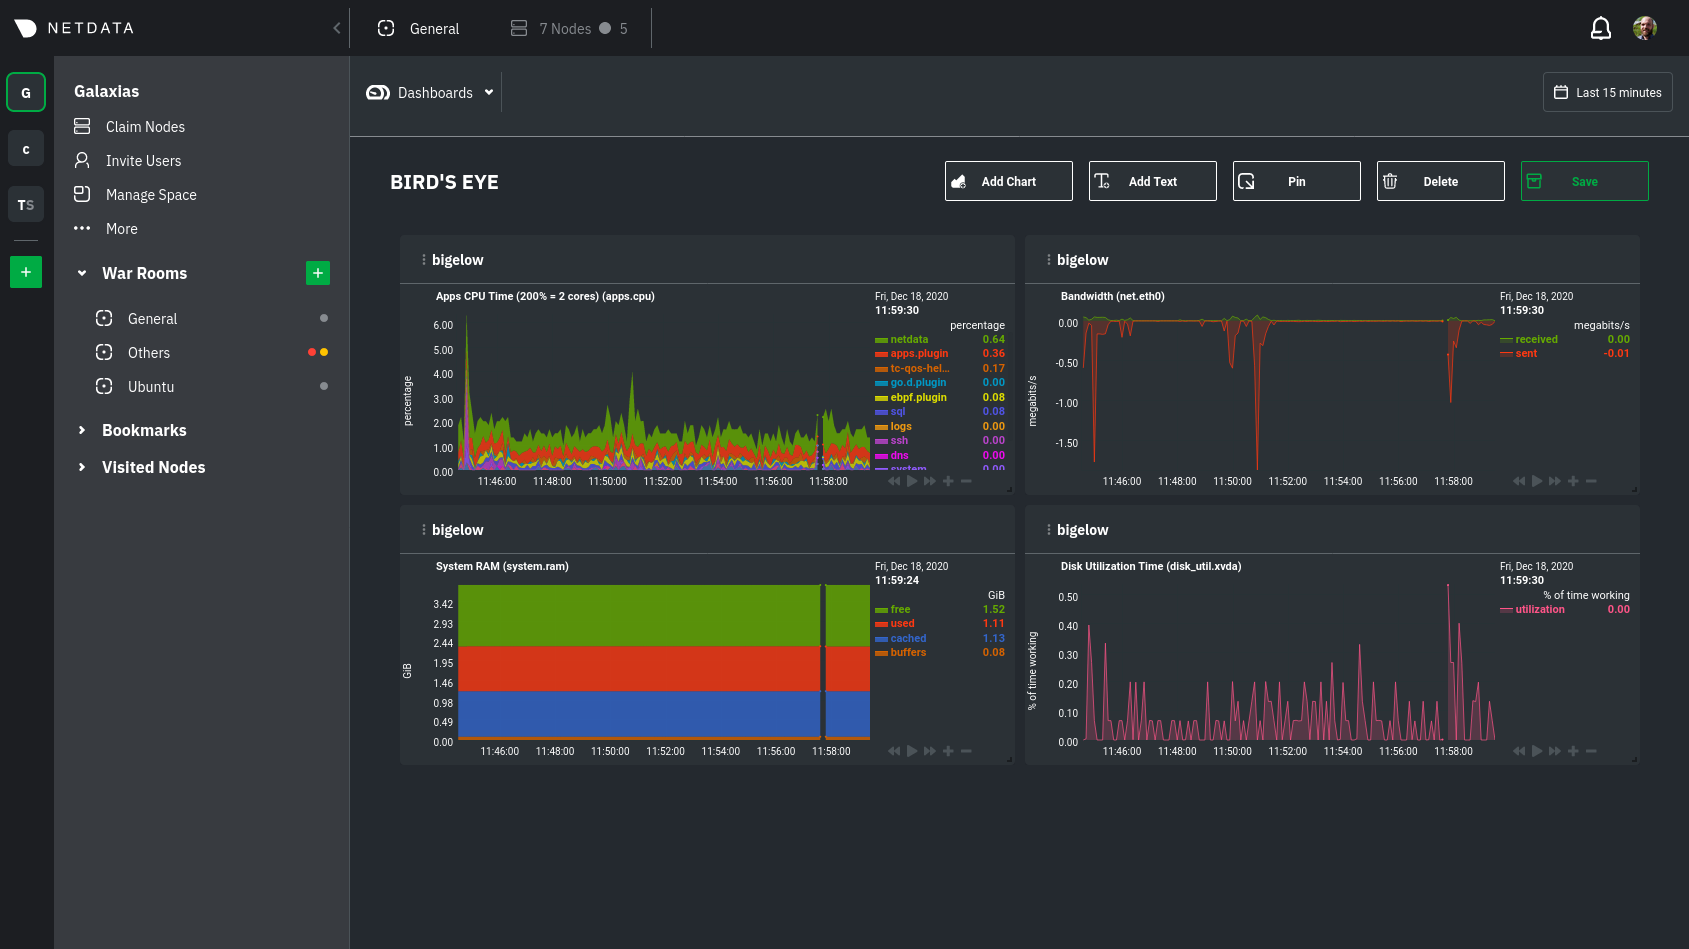 -Charts in dashboards are [fully interactive](/docs/visualize/interact-dashboards-charts.md) and synchronized. You can +Charts in dashboards +are [fully interactive](https://github.com/netdata/netdata/blob/master/docs/visualize/interact-dashboards-charts.md) and +synchronized. You can pan through time, zoom, highlight specific timeframes, and more. Move any card by clicking on their top panel and dragging them to a new location. Other cards re-sort to the grid system @@ -38,7 +40,8 @@ more detail when troubleshooting an issue. Quickly jump to any node's dashboard of any card to open a menu. Hit the **Go to Chart** item. Netdata Cloud takes you to the same chart on that node's dashboard. You can now navigate all that node's metrics and -[interact with charts](/docs/visualize/interact-dashboards-charts.md) to further investigate anomalies or troubleshoot +[interact with charts](https://github.com/netdata/netdata/blob/master/docs/visualize/interact-dashboards-charts.md) to +further investigate anomalies or troubleshoot complex performance problems. When viewing a single-node Cloud dashboard, you can also click on the add to dashboard icon <img @@ -58,7 +61,9 @@ faster. ## What's next? While it's useful to see real-time metrics on flexible dashboards, you need ways to know precisely when an anomaly -strikes. Every Netdata Agent comes with a health watchdog that uses [alarms](/docs/monitor/configure-alarms.md) and -[notifications](/docs/monitor/enable-notifications.md) to notify you of issues seconds after they strike. +strikes. Every Netdata Agent comes with a health watchdog that +uses [alarms](https://github.com/netdata/netdata/blob/master/docs/monitor/configure-alarms.md) and +[notifications](https://github.com/netdata/netdata/blob/master/docs/monitor/enable-notifications.md) to notify you of +issues seconds after they strike. diff --git a/docs/visualize/interact-dashboards-charts.md b/docs/visualize/interact-dashboards-charts.md index 5dbbf19ab..bf6d7a01f 100644 --- a/docs/visualize/interact-dashboards-charts.md +++ b/docs/visualize/interact-dashboards-charts.md @@ -6,30 +6,30 @@ custom_edit_url: https://github.com/netdata/netdata/edit/master/docs/visualize/i # Interact with dashboards and charts -> ⚠️ There is a new version of charts that is currently **only** available on [Netdata Cloud](https://learn.netdata.cloud/docs/cloud/visualize/interact-new-charts). We didn't +> ⚠️ There is a new version of charts that is currently **only** available on [Netdata Cloud](https://github.com/netdata/netdata/blob/master/docs/cloud/visualize/interact-new-charts.md). We didn't > want to keep this valuable feature from you, so after we get this into your hands on the Cloud, we will collect and implement your feedback to make sure we are providing the best possible version of the feature on the Netdata Agent dashboard as quickly as possible. You can find Netdata's dashboards in two places: locally served at `http://NODE:19999` by the Netdata Agent, and in Netdata Cloud. While you access these dashboards differently, they have similar interfaces, identical charts and metrics, and you interact with both of them the same way. -> If you're not sure which option is best for you, see our [single-node](/docs/quickstart/single-node.md) and -> [infrastructure](/docs/quickstart/infrastructure.md) quickstart guides. +> If you're not sure which option is best for you, see our [single-node](https://github.com/netdata/netdata/blob/master/docs/quickstart/single-node.md) and +> [infrastructure](https://github.com/netdata/netdata/blob/master/docs/quickstart/infrastructure.md) quickstart guides. Netdata dashboards are single, scrollable pages with many charts stacked on top of one another. As you scroll up or down, charts appearing in your browser's viewport automatically load and update every second. The dashboard is broken up into multiple **sections**, such as **System Overview**, **CPU**, **Disk**, which are -automatically generated based on which [collectors](/docs/collect/how-collectors-work.md) begin collecting metrics when +automatically generated based on which [collectors](https://github.com/netdata/netdata/blob/master/docs/collect/how-collectors-work.md) begin collecting metrics when Netdata starts up. Sections also appear in the right-hand **menu**, along with submenus based on the contexts and families Netdata creates for your node. ## Choose timeframes to visualize Both the local Agent dashboard and Netdata Cloud feature time & date pickers to help you visualize specific points in -time. In Netdata Cloud, the picker appears in the [Overview](/docs/visualize/overview-infrastructure.md), [Nodes -view](https://learn.netdata.cloud/docs/cloud/visualize/nodes), [new -dashboards](https://learn.netdata.cloud/docs/cloud/visualize/dashboards), and any single-node dashboards you visit. +time. In Netdata Cloud, the picker appears in the [Overview](https://github.com/netdata/netdata/blob/master/docs/visualize/overview-infrastructure.md), [Nodes +view](https://github.com/netdata/netdata/blob/master/docs/cloud/visualize/nodes.md), [new +dashboards](https://github.com/netdata/netdata/blob/master/docs/cloud/visualize/dashboards.md), and any single-node dashboards you visit. Local Agent dashboard: @@ -45,8 +45,8 @@ Their behavior is identical. Use the Quick Selector to visualize generic timefra select days, hours, minutes or seconds. Click **Apply** to re-render all visualizations with new metrics data, or **Clear** to restore the default timeframe. -See reference documentation for the [local Agent dashboard](/web/gui/README.md#time--date-picker) and [Netdata -Cloud](https://learn.netdata.cloud/docs/cloud/war-rooms#time--date-picker) for additional context about how the time & +See reference documentation for the [local Agent dashboard](https://github.com/netdata/netdata/blob/master/web/gui/README.md#time--date-picker) and [Netdata +Cloud](https://github.com/netdata/netdata/blob/master/docs/cloud/war-rooms.md#time--date-picker) for additional context about how the time & date picker behaves in each environment. ## Charts, dimensions, families, and contexts @@ -68,7 +68,7 @@ A **context** groups several charts based on the types of metrics being collecte this context to create individual charts and then groups them by family. You can always see the context of any chart by looking at its name or hovering over the chart's date. -See our [dashboard docs](/web/README.md#charts-contexts-families) for more information about the above distinctions +See our [dashboard docs](https://github.com/netdata/netdata/blob/master/web/README.md#charts-contexts-families) for more information about the above distinctions and how they're used across Netdata to meaningfully organize and present metrics. ## Interact with charts @@ -107,25 +107,25 @@ height](https://user-images.githubusercontent.com/1153921/102652691-24b25c00-412 Netdata Cloud now supports composite charts in the Overview interface. Composite charts come with a few additional UI elements and varied interactions, such as the location of dimensions and a utility bar for configuring the state of individual composite charts. All of these details are covered in the [Overview -reference](https://learn.netdata.cloud/docs/cloud/visualize/overview) doc. +reference](https://github.com/netdata/netdata/blob/master/docs/cloud/visualize/overview.md) doc. ## What's next? -Netdata Cloud users can [build new dashboards](/docs/visualize/create-dashboards.md) in just a few clicks. By +Netdata Cloud users can [build new dashboards](https://github.com/netdata/netdata/blob/master/docs/visualize/create-dashboards.md) in just a few clicks. By aggregating relevant metrics from any number of nodes onto a single interface, you can respond faster to anomalies, perform more targeted troubleshooting, or keep tabs on a bird's eye view of your infrastructure. If you're finished with dashboards for now, skip to Netdata's health watchdog for information on [creating or -configuring](/docs/monitor/configure-alarms.md) alarms, and [send notifications](/docs/monitor/enable-notifications.md) +configuring](https://github.com/netdata/netdata/blob/master/docs/monitor/configure-alarms.md) alarms, and [send notifications](https://github.com/netdata/netdata/blob/master/docs/monitor/enable-notifications.md) to get informed when something goes wrong in your infrastructure. ### Related reference documentation -- [Netdata Agent · Web dashboards overview](/web/README.md) -- [Netdata Cloud · Interact with new charts](https://learn.netdata.cloud/docs/cloud/visualize/interact-new-charts) -- [Netdata Cloud · War Rooms](https://learn.netdata.cloud/docs/cloud/war-rooms) -- [Netdata Cloud · Overview](https://learn.netdata.cloud/docs/cloud/visualize/overview) -- [Netdata Cloud · Nodes](https://learn.netdata.cloud/docs/cloud/visualize/nodes) -- [Netdata Cloud · Build new dashboards](https://learn.netdata.cloud/docs/cloud/visualize/dashboards) +- [Netdata Agent · Web dashboards overview](https://github.com/netdata/netdata/blob/master/web/README.md) +- [Netdata Cloud · Interact with new charts](https://github.com/netdata/netdata/blob/master/docs/cloud/visualize/interact-new-charts.md) +- [Netdata Cloud · War Rooms](https://github.com/netdata/netdata/blob/master/docs/cloud/war-rooms.md) +- [Netdata Cloud · Overview](https://github.com/netdata/netdata/blob/master/docs/cloud/visualize/overview.md) +- [Netdata Cloud · Nodes](https://github.com/netdata/netdata/blob/master/docs/cloud/visualize/nodes.md) +- [Netdata Cloud · Build new dashboards](https://github.com/netdata/netdata/blob/master/docs/cloud/visualize/dashboards.md) diff --git a/docs/visualize/overview-infrastructure.md b/docs/visualize/overview-infrastructure.md index 4edbb0f3a..0daddd97a 100644 --- a/docs/visualize/overview-infrastructure.md +++ b/docs/visualize/overview-infrastructure.md @@ -7,7 +7,7 @@ custom_edit_url: https://github.com/netdata/netdata/edit/master/docs/visualize/o # See an overview of your infrastructure In Netdata Cloud, your nodes are organized into War Rooms. One of the two available views for a War Room is the -[**Overview**](https://learn.netdata.cloud/docs/cloud/visualize/overview), which uses composite charts to display +[**Overview**](https://github.com/netdata/netdata/blob/master/docs/cloud/visualize/overview.md), which uses composite charts to display real-time, aggregated metrics from all the nodes (or a filtered selection) in a given War Room. With Overview's composite charts, you can see your infrastructure from a single pane of glass, discover trends or @@ -15,7 +15,7 @@ anomalies, then drill down with filtering or single-node dashboards to see more. each chart visualizes average or sum metrics values from across 5 distributed nodes. Netdata also supports robust Kubernetes monitoring using the Overview. Read our [deployment -doc](/packaging/installer/methods/kubernetes.md) for details on visualizing Kubernetes metrics in Netdata Cloud. +doc](https://github.com/netdata/netdata/blob/master/packaging/installer/methods/kubernetes.md) for details on visualizing Kubernetes metrics in Netdata Cloud. 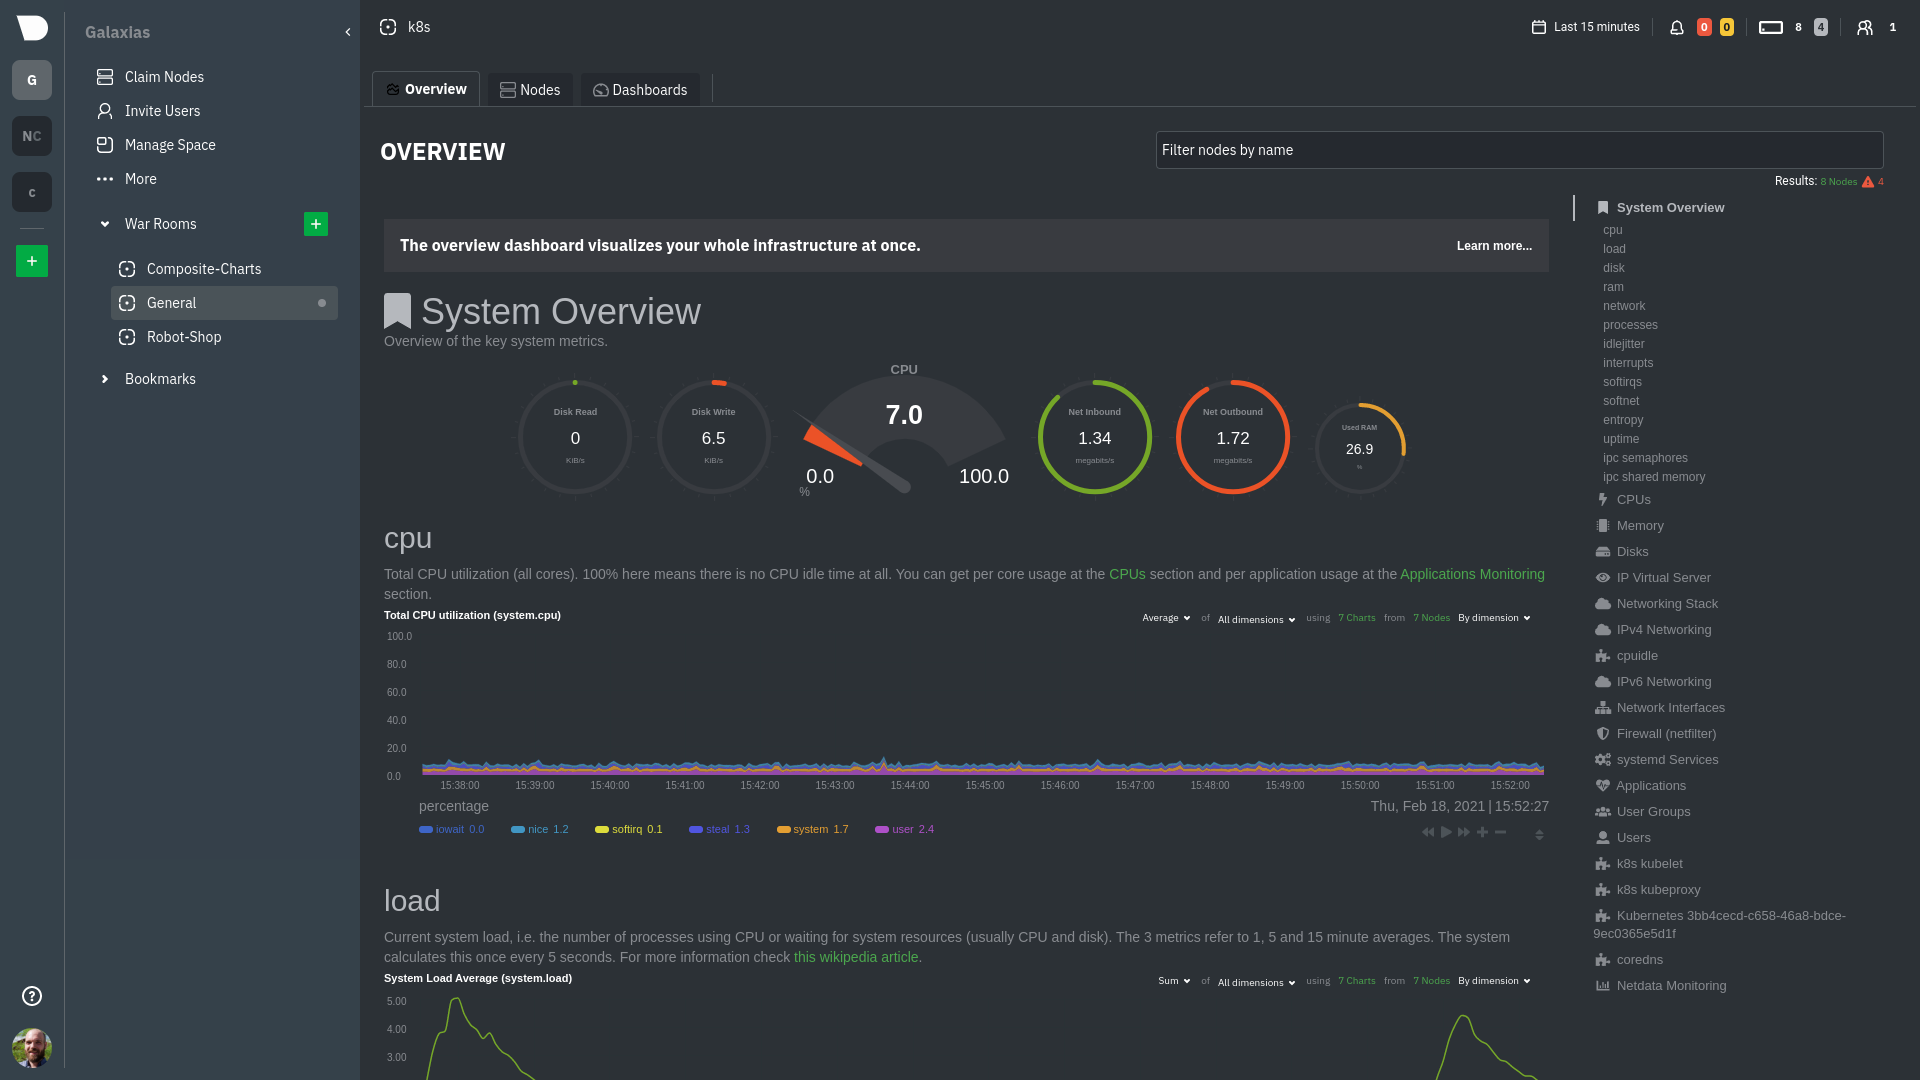 @@ -32,8 +32,8 @@ Let's walk through some examples of using the Overview to monitor and troublesho ### Filter nodes and pick relevant times While not exclusive to Overview, you can use two important features, [node -filtering](https://learn.netdata.cloud/docs/cloud/war-rooms#node-filter) and the [time & date -picker](https://learn.netdata.cloud/docs/cloud/war-rooms#time--date-picker), to widen or narrow your infrastructure +filtering](https://github.com/netdata/netdata/blob/master/docs/cloud/war-rooms.md#node-filter) and the [time & date +picker](https://github.com/netdata/netdata/blob/master/docs/cloud/war-rooms.md#time--date-picker), to widen or narrow your infrastructure monitoring focus. By default, the Overview shows composite charts aggregated from every node in the War Room, but you can change that @@ -48,7 +48,7 @@ establishing a baseline of infrastructure performance or targeted root cause ana For example, use the **Quick Selector** options to pick the 12-hour option first thing in the morning to check your infrastructure for any odd behavior overnight. Use the 7-day option to observe trends between various days of the week. -See the [War Rooms](https://learn.netdata.cloud/docs/cloud/war-rooms) docs for more details on both features. +See the [War Rooms](https://github.com/netdata/netdata/blob/master/docs/cloud/war-rooms.md) docs for more details on both features. ### Configure composite charts to identify problems @@ -60,7 +60,7 @@ affects a single node, a subset of nodes, or an entire infrastructure. 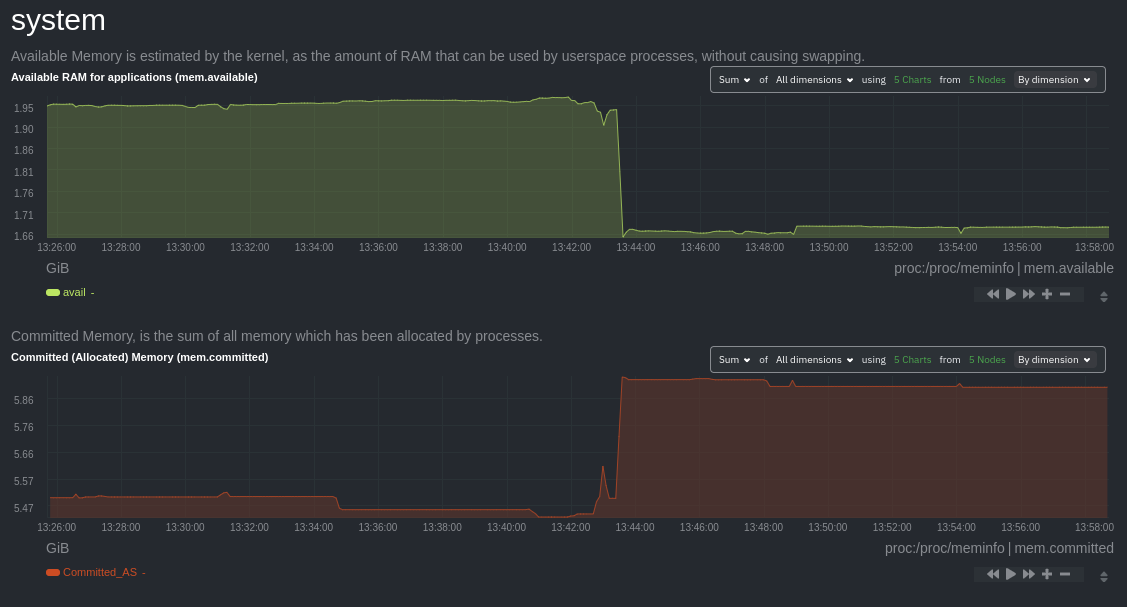 -Use [_group by node_](https://learn.netdata.cloud/docs/cloud/visualize/overview#group-by-dimension-or-node) to visualize +Use [_group by node_](https://github.com/netdata/netdata/blob/master/docs/cloud/visualize/overview.md#group-by-dimension-or-node) to visualize a single metric across all contributing nodes. If the composite chart has 5 contributing nodes, there will be 5 lines/areas, one for the most relevant dimension from each node. @@ -80,32 +80,32 @@ given node to quickly _jump to the same chart in that node's single-node dashboa You can use single-node dashboards in Netdata Cloud to drill down on specific issues, scrub backward in time to investigate historical data, and see like metrics presented meaningfully to help you troubleshoot performance problems. -All of the familiar [interactions](/docs/visualize/interact-dashboards-charts.md) are available, as is adding any chart -to a [new dashboard](/docs/visualize/create-dashboards.md). +All of the familiar [interactions](https://github.com/netdata/netdata/blob/master/docs/visualize/interact-dashboards-charts.md) are available, as is adding any chart +to a [new dashboard](https://github.com/netdata/netdata/blob/master/docs/visualize/create-dashboards.md). ## Nodes view You can also use the **Nodes view** to monitor the health status and user-configurable key metrics from multiple nodes -in a War Room. Read the [Nodes view doc](https://learn.netdata.cloud/docs/cloud/visualize/nodes) for details. +in a War Room. Read the [Nodes view doc](https://github.com/netdata/netdata/blob/master/docs/cloud/visualize/nodes.md) for details. 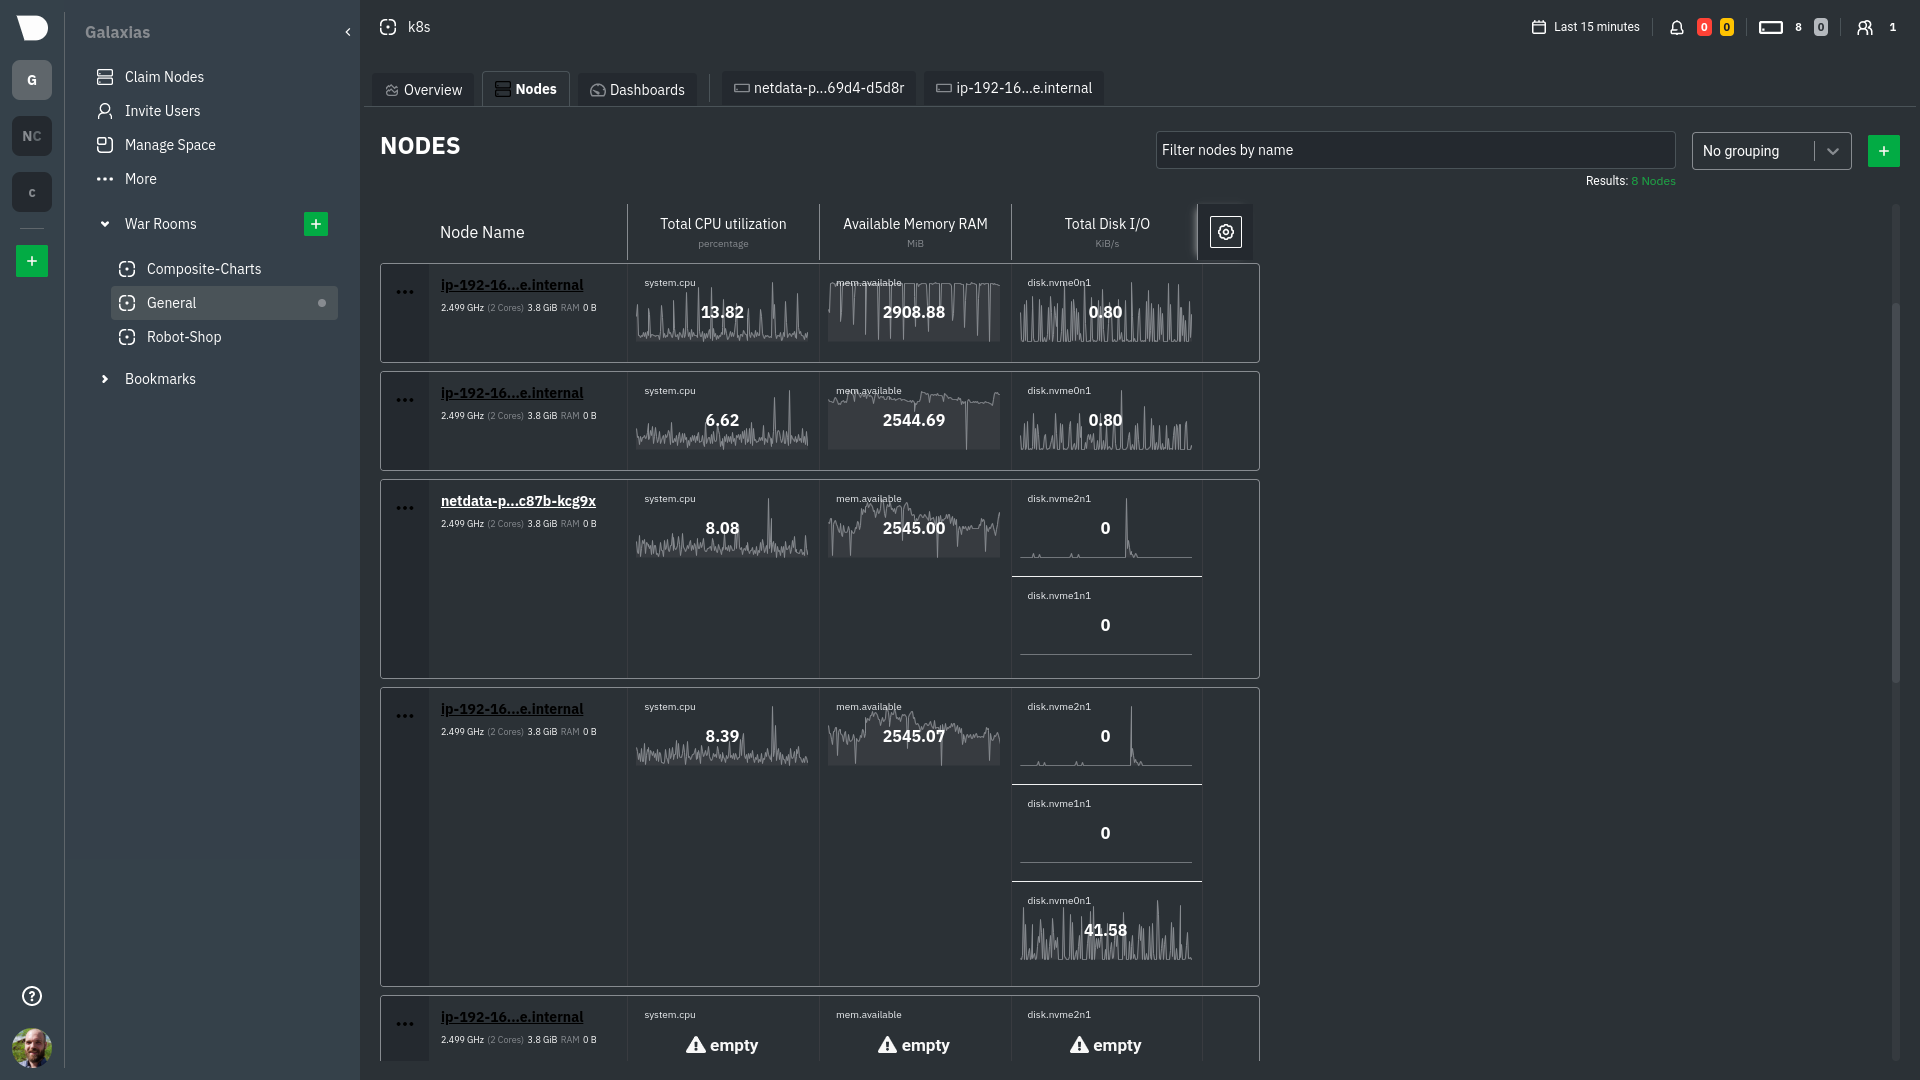 ## What's next? To troubleshoot complex performance issues using Netdata, you need to understand how to interact with its meaningful -visualizations. Learn more about [interaction](/docs/visualize/interact-dashboards-charts.md) to see historical metrics, +visualizations. Learn more about [interaction](https://github.com/netdata/netdata/blob/master/docs/visualize/interact-dashboards-charts.md) to see historical metrics, highlight timeframes for targeted analysis, and more. If you're a Kubernetes user, read about Netdata's [Kubernetes -visualizations](https://learn.netdata.cloud/docs/cloud/visualize/kubernetes) for details about the health map and +visualizations](https://github.com/netdata/netdata/blob/master/docs/cloud/visualize/kubernetes.md) for details about the health map and time-series k8s charts, and our tutorial, [_Kubernetes monitoring with Netdata: Overview and -visualizations_](/docs/guides/monitor/kubernetes-k8s-netdata.md), for a full walkthrough. +visualizations_](https://github.com/netdata/netdata/blob/master/docs/guides/monitor/kubernetes-k8s-netdata.md), for a full walkthrough. ### Related reference documentation -- [Netdata Cloud · War Rooms](https://learn.netdata.cloud/docs/cloud/war-rooms) -- [Netdata Cloud · Overview](https://learn.netdata.cloud/docs/cloud/visualize/overview) -- [Netdata Cloud · Nodes view](https://learn.netdata.cloud/docs/cloud/visualize/nodes) -- [Netdata Cloud · Kubernetes visualizations](https://learn.netdata.cloud/docs/cloud/visualize/kubernetes) +- [Netdata Cloud · War Rooms](https://github.com/netdata/netdata/blob/master/docs/cloud/war-rooms.md) +- [Netdata Cloud · Overview](https://github.com/netdata/netdata/blob/master/docs/cloud/visualize/overview.md) +- [Netdata Cloud · Nodes view](https://github.com/netdata/netdata/blob/master/docs/cloud/visualize/nodes.md) +- [Netdata Cloud · Kubernetes visualizations](https://github.com/netdata/netdata/blob/master/docs/cloud/visualize/kubernetes.md) |