
diff options
Diffstat (limited to 'exporting/graphite')
| l---------[-rw-r--r--] | exporting/graphite/README.md | 129 | ||||
| -rw-r--r-- | exporting/graphite/integrations/blueflood.md | 172 | ||||
| -rw-r--r-- | exporting/graphite/integrations/graphite.md | 172 | ||||
| -rw-r--r-- | exporting/graphite/integrations/influxdb.md | 172 | ||||
| -rw-r--r-- | exporting/graphite/integrations/kairosdb.md | 172 |
5 files changed, 689 insertions, 128 deletions
diff --git a/exporting/graphite/README.md b/exporting/graphite/README.md index 2ef436cf5..15f360d17 100644..120000 --- a/exporting/graphite/README.md +++ b/exporting/graphite/README.md @@ -1,128 +1 @@ -# Export metrics to Graphite providers - -You can use the Graphite connector for -the [exporting engine](https://github.com/netdata/netdata/blob/master/exporting/README.md) to archive your agent's -metrics to Graphite providers for long-term storage, further analysis, or correlation with data from other sources. - -## Prerequisites - -You have already [installed Netdata](https://github.com/netdata/netdata/edit/master/packaging/installer/README.md) and -Graphite. - -## Configuration - -Begin by using `edit-config` to open the `exporting.conf` file. - -```bash -cd /etc/netdata # Replace this path with your Netdata config directory -sudo ./edit-config exporting.conf -``` - -Enable the exporting engine by setting `enabled` to `yes` in the `[exporting:global]` section. - -```conf -[exporting:global] - enabled = yes -``` - -Next, configure the connector. Find the `[graphite:my_graphite_instance]` example section and uncomment the line. -Set the `destination` setting to `localhost:2003`. By default, the Docker image for Graphite listens on port `2003` for -incoming metrics. If you installed Graphite a different way, you may need to change the port accordingly. - -```conf -[graphite:netdata] - enabled = yes - destination = localhost:2003 - ... -``` - -Add `:http` or `:https` modifiers to the connector type if you need to use other than a plaintext protocol. For -example: `graphite:http:my_graphite_instance`, -`graphite:https:my_graphite_instance`. You can set basic HTTP authentication credentials using - -```conf - username = my_username - password = my_password -``` - -The final result for a remote, secured host should be the following: - -```conf -[graphite:https:netdata] - enabled = yes - username = my_username - password = my_password - destination = remote_host_url:2003 - # data source = average - # prefix = netdata - # hostname = my_hostname - # update every = 10 - # buffer on failures = 10 - # timeout ms = 20000 - # send names instead of ids = yes - # send charts matching = * - # send hosts matching = localhost * -``` - -We'll not worry about the [rest of the settings](https://github.com/netdata/netdata/blob/master/exporting/README.md#options) - for now. Restart the Agent using `sudo systemctl restart netdata`, or the -[appropriate method](https://github.com/netdata/netdata/blob/master/docs/configure/start-stop-restart.md) for your -system, to spin up the exporting engine. - -## See and organize Netdata metrics in Graphite - -Head back to the Graphite interface again, then click on the **Dashboard** link to get started with Netdata's exported -metrics. You can also navigate directly to `http://NODE/dashboard`. - -Let's switch the interface to help you understand which metrics Netdata is exporting to Graphite. Click on **Dashboard** -and **Configure UI**, then choose the **Tree** option. Refresh your browser to change the UI. - -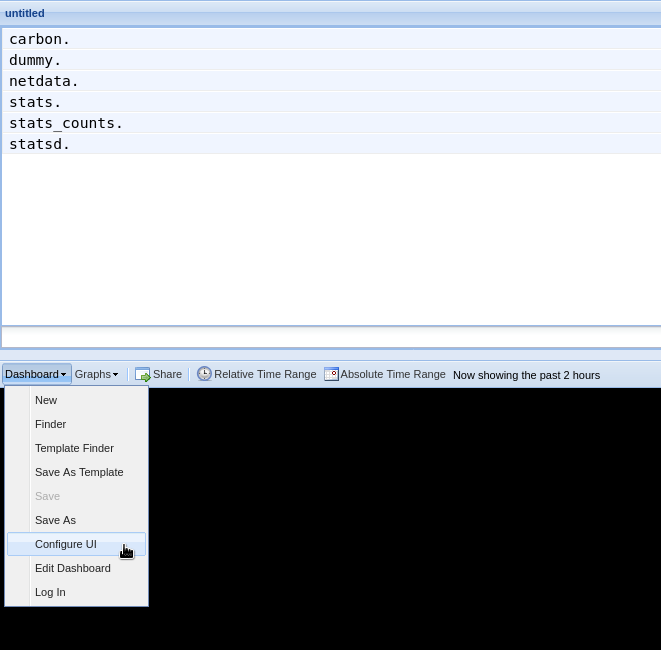 - -You should now see a tree of available contexts, including one that matches the hostname of the Agent exporting metrics. -In this example, the Agent's hostname is `arcturus`. - -Let's add some system CPU charts so you can monitor the long-term health of your system. Click through the tree to find -**hostname → system → cpu** metrics, then click on the **user** context. A chart with metrics from that context appears -in the dashboard. Add a few other system CPU charts to flesh things out. - -Next, let's combine one or two of these charts. Click and drag one chart onto the other, and wait until the green **Drop -to merge** dialog appears. Release to merge the charts. - -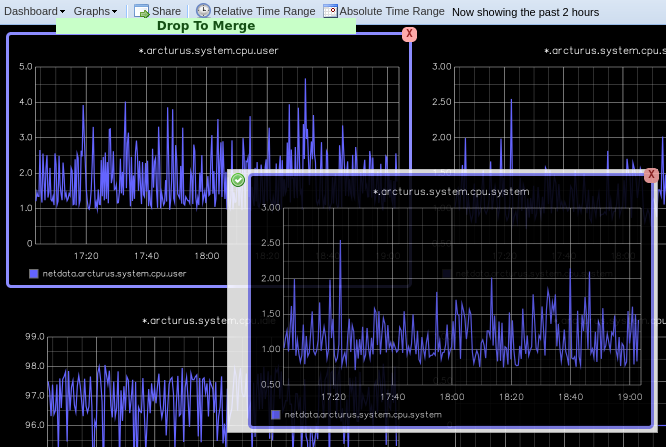 - -Finally, save your dashboard. Click **Dashboard**, then **Save As**, then choose a name. Your dashboard is now saved. - -Of course, this is just the beginning of the customization you can do with Graphite. You can change the time range, -share your dashboard with others, or use the composer to customize the size and appearance of specific charts. Learn -more about adding, modifying, and combining graphs in -the [Graphite docs](https://graphite.readthedocs.io/en/latest/dashboard.html). - -## Monitor the exporting engine - -As soon as the exporting engine begins, Netdata begins reporting metrics about the system's health and performance. - -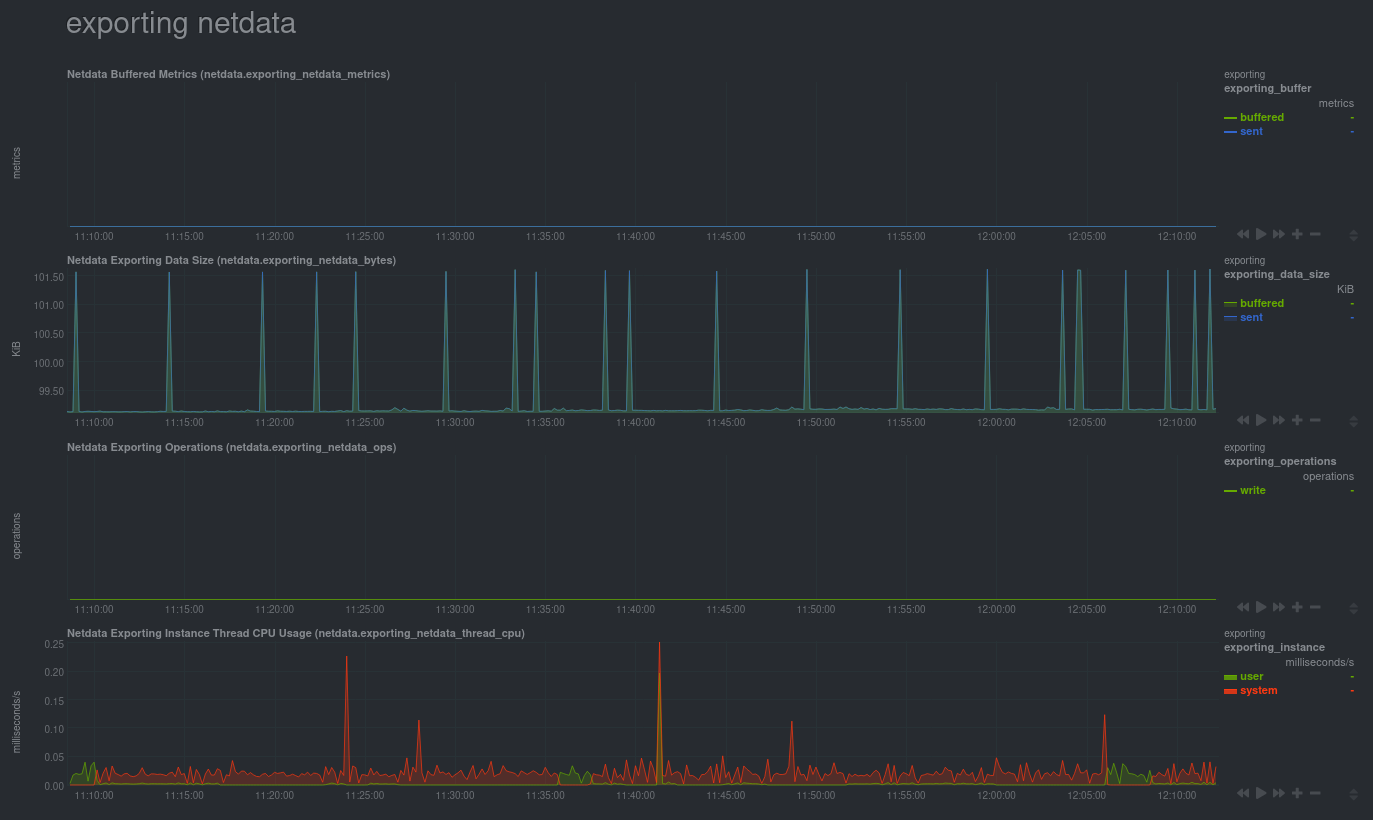 - -You can use these charts to verify that Netdata is properly exporting metrics to Graphite. You can even add these -exporting charts to your Graphite dashboard! - -### Add exporting charts to Netdata Cloud - -You can also show these exporting engine metrics on Netdata Cloud. If you don't have an account already, -go [sign in](https://app.netdata.cloud) and get started for free. - -Add more metrics to a War Room's Nodes tab by clicking on the **Add metric** button, then typing `exporting` into the -context field. Choose the exporting contexts you want to add, then click **Add**. You'll see these charts alongside any -others you've customized in Netdata Cloud. - -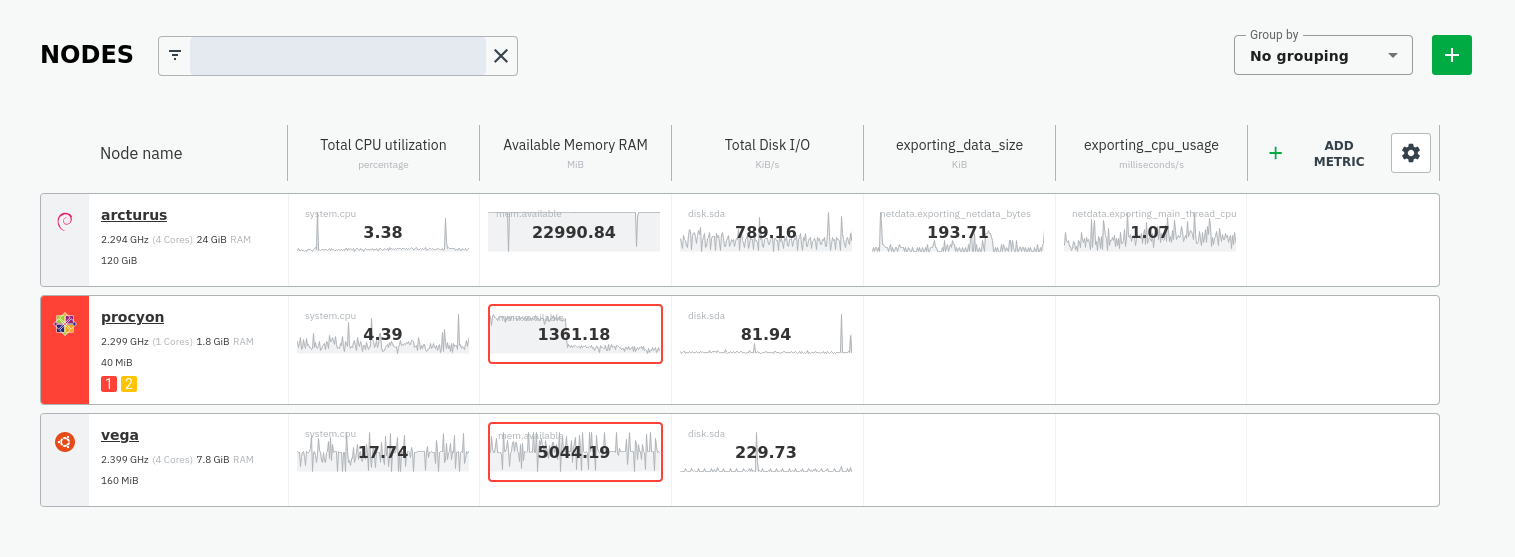 - -## What's next - -What you do with your exported metrics is entirely up to you, but as you might have seen in the Graphite connector -configuration block, there are many other ways to tweak and customize which metrics you export to Graphite and how -often. - -For full details about each configuration option and what it does, see -the [exporting reference guide](https://github.com/netdata/netdata/blob/master/exporting/README.md). +integrations/graphite.md
\ No newline at end of file diff --git a/exporting/graphite/integrations/blueflood.md b/exporting/graphite/integrations/blueflood.md new file mode 100644 index 000000000..3494045a5 --- /dev/null +++ b/exporting/graphite/integrations/blueflood.md @@ -0,0 +1,172 @@ +<!--startmeta +custom_edit_url: "https://github.com/netdata/netdata/edit/master/exporting/graphite/integrations/blueflood.md" +meta_yaml: "https://github.com/netdata/netdata/edit/master/exporting/graphite/metadata.yaml" +sidebar_label: "Blueflood" +learn_status: "Published" +learn_rel_path: "Exporting" +message: "DO NOT EDIT THIS FILE DIRECTLY, IT IS GENERATED BY THE EXPORTER'S metadata.yaml FILE" +endmeta--> + +# Blueflood + + +<img src="https://netdata.cloud/img/blueflood.png" width="150"/> + + +Use the Graphite connector for the exporting engine to archive your Netdata metrics to Graphite providers for long-term storage, +further analysis, or correlation with data from other sources. + + + +<img src="https://img.shields.io/badge/maintained%20by-Netdata-%2300ab44" /> + +## Setup + +### Prerequisites + +#### + +- You have already installed Netdata and Graphite. + + + +### Configuration + +#### File + +The configuration file name for this integration is `exporting.conf`. + + +You can edit the configuration file using the `edit-config` script from the +Netdata [config directory](https://github.com/netdata/netdata/blob/master/docs/configure/nodes.md#the-netdata-config-directory). + +```bash +cd /etc/netdata 2>/dev/null || cd /opt/netdata/etc/netdata +sudo ./edit-config exporting.conf +``` +#### Options + +The following options can be defined for this exporter. + +<details><summary>Config options</summary> + +| Name | Description | Default | Required | +|:----|:-----------|:-------|:--------:| +| enabled | Enables or disables an exporting connector instance (yes/no). | no | True | +| destination | Accepts a space separated list of hostnames, IPs (IPv4 and IPv6) and ports to connect to. Netdata will use the first available to send the metrics. | no | True | +| username | Username for HTTP authentication | my_username | False | +| password | Password for HTTP authentication | my_password | False | +| data source | Selects the kind of data that will be sent to the external database. (as collected/average/sum) | | False | +| hostname | The hostname to be used for sending data to the external database server. | [global].hostname | False | +| prefix | The prefix to add to all metrics. | netdata | False | +| update every | Frequency of sending sending data to the external database, in seconds. | 10 | False | +| buffer on failures | The number of iterations (`update every` seconds) to buffer data, when the external database server is not available. | 10 | False | +| timeout ms | The timeout in milliseconds to wait for the external database server to process the data. | 20000 | False | +| send hosts matching | Hosts filter. Determines which hosts will be sent to the external database. The syntax is [simple patterns](https://github.com/netdata/netdata/tree/master/libnetdata/simple_pattern#simple-patterns). | localhost * | False | +| send charts matching | One or more space separated patterns (use * as wildcard) checked against both chart id and chart name. | * | False | +| send names instead of ids | Controls the metric names Netdata should send to the external database (yes/no). | | False | +| send configured labels | Controls if host labels defined in the `[host labels]` section in `netdata.conf` should be sent to the external database (yes/no). | | False | +| send automatic labels | Controls if automatically created labels, like `_os_name` or `_architecture` should be sent to the external database (yes/no). | | False | + +##### destination + +The format of each item in this list, is: [PROTOCOL:]IP[:PORT]. +- PROTOCOL can be udp or tcp. tcp is the default and only supported by the current exporting engine. +- IP can be XX.XX.XX.XX (IPv4), or [XX:XX...XX:XX] (IPv6). For IPv6 you can to enclose the IP in [] to separate it from the port. +- PORT can be a number of a service name. If omitted, the default port for the exporting connector will be used. + +Example IPv4: + ```yaml + destination = 10.11.14.2:2003 10.11.14.3:4242 10.11.14.4:2003 + ``` +Example IPv6 and IPv4 together: +```yaml +destination = [ffff:...:0001]:2003 10.11.12.1:2003 +``` +When multiple servers are defined, Netdata will try the next one when the previous one fails. + + +##### update every + +Netdata will add some randomness to this number, to prevent stressing the external server when many Netdata servers +send data to the same database. This randomness does not affect the quality of the data, only the time they are sent. + + +##### buffer on failures + +If the server fails to receive the data after that many failures, data loss on the connector instance is expected (Netdata will also log it). + + +##### send hosts matching + +Includes one or more space separated patterns, using * as wildcard (any number of times within each pattern). +The patterns are checked against the hostname (the localhost is always checked as localhost), allowing us to +filter which hosts will be sent to the external database when this Netdata is a central Netdata aggregating multiple hosts. + +A pattern starting with `!` gives a negative match. So to match all hosts named `*db*` except hosts containing `*child*`, +use `!*child* *db*` (so, the order is important: the first pattern matching the hostname will be used - positive or negative). + + +##### send charts matching + +A pattern starting with ! gives a negative match. So to match all charts named apps.* except charts ending in *reads, +use !*reads apps.* (so, the order is important: the first pattern matching the chart id or the chart name will be used, +positive or negative). There is also a URL parameter filter that can be used while querying allmetrics. The URL parameter +has a higher priority than the configuration option. + + +##### send names instead of ids + +Netdata supports names and IDs for charts and dimensions. Usually IDs are unique identifiers as read by the system and names +are human friendly labels (also unique). Most charts and metrics have the same ID and name, but in several cases they are +different : disks with device-mapper, interrupts, QoS classes, statsd synthetic charts, etc. + + +</details> + +#### Examples + +##### Example configuration + +Basic configuration + +```yaml +[graphite:netdata] + enabled = yes + destination = localhost:2003 + +``` +##### Configuration with HTTPS and HTTP authentication + +Add `:https` modifier to the connector type if you need to use the TLS/SSL protocol. For example: `remote_write:https:my_instance`. + +```yaml +[graphite:netdata] + enabled = yes + destination = localhost:2003 + username = my_username + password = my_password + +``` +##### Detailed Configuration for a remote, secure host + +Add `:https` modifier to the connector type if you need to use the TLS/SSL protocol. For example: `remote_write:https:my_instance`. + +```yaml +[graphite:https:netdata] + enabled = yes + username = my_username + password = my_password + destination = 10.10.1.114:2003 + # data source = average + # prefix = netdata + # hostname = my_hostname + # update every = 10 + # buffer on failures = 10 + # timeout ms = 20000 + # send names instead of ids = yes + # send charts matching = * + # send hosts matching = localhost * + +``` + diff --git a/exporting/graphite/integrations/graphite.md b/exporting/graphite/integrations/graphite.md new file mode 100644 index 000000000..b550aa3f4 --- /dev/null +++ b/exporting/graphite/integrations/graphite.md @@ -0,0 +1,172 @@ +<!--startmeta +custom_edit_url: "https://github.com/netdata/netdata/edit/master/exporting/graphite/integrations/graphite.md" +meta_yaml: "https://github.com/netdata/netdata/edit/master/exporting/graphite/metadata.yaml" +sidebar_label: "Graphite" +learn_status: "Published" +learn_rel_path: "Exporting" +message: "DO NOT EDIT THIS FILE DIRECTLY, IT IS GENERATED BY THE EXPORTER'S metadata.yaml FILE" +endmeta--> + +# Graphite + + +<img src="https://netdata.cloud/img/graphite.png" width="150"/> + + +Use the Graphite connector for the exporting engine to archive your Netdata metrics to Graphite providers for long-term storage, +further analysis, or correlation with data from other sources. + + + +<img src="https://img.shields.io/badge/maintained%20by-Netdata-%2300ab44" /> + +## Setup + +### Prerequisites + +#### + +- You have already installed Netdata and Graphite. + + + +### Configuration + +#### File + +The configuration file name for this integration is `exporting.conf`. + + +You can edit the configuration file using the `edit-config` script from the +Netdata [config directory](https://github.com/netdata/netdata/blob/master/docs/configure/nodes.md#the-netdata-config-directory). + +```bash +cd /etc/netdata 2>/dev/null || cd /opt/netdata/etc/netdata +sudo ./edit-config exporting.conf +``` +#### Options + +The following options can be defined for this exporter. + +<details><summary>Config options</summary> + +| Name | Description | Default | Required | +|:----|:-----------|:-------|:--------:| +| enabled | Enables or disables an exporting connector instance (yes/no). | no | True | +| destination | Accepts a space separated list of hostnames, IPs (IPv4 and IPv6) and ports to connect to. Netdata will use the first available to send the metrics. | no | True | +| username | Username for HTTP authentication | my_username | False | +| password | Password for HTTP authentication | my_password | False | +| data source | Selects the kind of data that will be sent to the external database. (as collected/average/sum) | | False | +| hostname | The hostname to be used for sending data to the external database server. | [global].hostname | False | +| prefix | The prefix to add to all metrics. | netdata | False | +| update every | Frequency of sending sending data to the external database, in seconds. | 10 | False | +| buffer on failures | The number of iterations (`update every` seconds) to buffer data, when the external database server is not available. | 10 | False | +| timeout ms | The timeout in milliseconds to wait for the external database server to process the data. | 20000 | False | +| send hosts matching | Hosts filter. Determines which hosts will be sent to the external database. The syntax is [simple patterns](https://github.com/netdata/netdata/tree/master/libnetdata/simple_pattern#simple-patterns). | localhost * | False | +| send charts matching | One or more space separated patterns (use * as wildcard) checked against both chart id and chart name. | * | False | +| send names instead of ids | Controls the metric names Netdata should send to the external database (yes/no). | | False | +| send configured labels | Controls if host labels defined in the `[host labels]` section in `netdata.conf` should be sent to the external database (yes/no). | | False | +| send automatic labels | Controls if automatically created labels, like `_os_name` or `_architecture` should be sent to the external database (yes/no). | | False | + +##### destination + +The format of each item in this list, is: [PROTOCOL:]IP[:PORT]. +- PROTOCOL can be udp or tcp. tcp is the default and only supported by the current exporting engine. +- IP can be XX.XX.XX.XX (IPv4), or [XX:XX...XX:XX] (IPv6). For IPv6 you can to enclose the IP in [] to separate it from the port. +- PORT can be a number of a service name. If omitted, the default port for the exporting connector will be used. + +Example IPv4: + ```yaml + destination = 10.11.14.2:2003 10.11.14.3:4242 10.11.14.4:2003 + ``` +Example IPv6 and IPv4 together: +```yaml +destination = [ffff:...:0001]:2003 10.11.12.1:2003 +``` +When multiple servers are defined, Netdata will try the next one when the previous one fails. + + +##### update every + +Netdata will add some randomness to this number, to prevent stressing the external server when many Netdata servers +send data to the same database. This randomness does not affect the quality of the data, only the time they are sent. + + +##### buffer on failures + +If the server fails to receive the data after that many failures, data loss on the connector instance is expected (Netdata will also log it). + + +##### send hosts matching + +Includes one or more space separated patterns, using * as wildcard (any number of times within each pattern). +The patterns are checked against the hostname (the localhost is always checked as localhost), allowing us to +filter which hosts will be sent to the external database when this Netdata is a central Netdata aggregating multiple hosts. + +A pattern starting with `!` gives a negative match. So to match all hosts named `*db*` except hosts containing `*child*`, +use `!*child* *db*` (so, the order is important: the first pattern matching the hostname will be used - positive or negative). + + +##### send charts matching + +A pattern starting with ! gives a negative match. So to match all charts named apps.* except charts ending in *reads, +use !*reads apps.* (so, the order is important: the first pattern matching the chart id or the chart name will be used, +positive or negative). There is also a URL parameter filter that can be used while querying allmetrics. The URL parameter +has a higher priority than the configuration option. + + +##### send names instead of ids + +Netdata supports names and IDs for charts and dimensions. Usually IDs are unique identifiers as read by the system and names +are human friendly labels (also unique). Most charts and metrics have the same ID and name, but in several cases they are +different : disks with device-mapper, interrupts, QoS classes, statsd synthetic charts, etc. + + +</details> + +#### Examples + +##### Example configuration + +Basic configuration + +```yaml +[graphite:netdata] + enabled = yes + destination = localhost:2003 + +``` +##### Configuration with HTTPS and HTTP authentication + +Add `:https` modifier to the connector type if you need to use the TLS/SSL protocol. For example: `remote_write:https:my_instance`. + +```yaml +[graphite:netdata] + enabled = yes + destination = localhost:2003 + username = my_username + password = my_password + +``` +##### Detailed Configuration for a remote, secure host + +Add `:https` modifier to the connector type if you need to use the TLS/SSL protocol. For example: `remote_write:https:my_instance`. + +```yaml +[graphite:https:netdata] + enabled = yes + username = my_username + password = my_password + destination = 10.10.1.114:2003 + # data source = average + # prefix = netdata + # hostname = my_hostname + # update every = 10 + # buffer on failures = 10 + # timeout ms = 20000 + # send names instead of ids = yes + # send charts matching = * + # send hosts matching = localhost * + +``` + diff --git a/exporting/graphite/integrations/influxdb.md b/exporting/graphite/integrations/influxdb.md new file mode 100644 index 000000000..f365f26e1 --- /dev/null +++ b/exporting/graphite/integrations/influxdb.md @@ -0,0 +1,172 @@ +<!--startmeta +custom_edit_url: "https://github.com/netdata/netdata/edit/master/exporting/graphite/integrations/influxdb.md" +meta_yaml: "https://github.com/netdata/netdata/edit/master/exporting/graphite/metadata.yaml" +sidebar_label: "InfluxDB" +learn_status: "Published" +learn_rel_path: "Exporting" +message: "DO NOT EDIT THIS FILE DIRECTLY, IT IS GENERATED BY THE EXPORTER'S metadata.yaml FILE" +endmeta--> + +# InfluxDB + + +<img src="https://netdata.cloud/img/influxdb.svg" width="150"/> + + +Use the Graphite connector for the exporting engine to archive your Netdata metrics to Graphite providers for long-term storage, +further analysis, or correlation with data from other sources. + + + +<img src="https://img.shields.io/badge/maintained%20by-Netdata-%2300ab44" /> + +## Setup + +### Prerequisites + +#### + +- You have already installed Netdata and Graphite. + + + +### Configuration + +#### File + +The configuration file name for this integration is `exporting.conf`. + + +You can edit the configuration file using the `edit-config` script from the +Netdata [config directory](https://github.com/netdata/netdata/blob/master/docs/configure/nodes.md#the-netdata-config-directory). + +```bash +cd /etc/netdata 2>/dev/null || cd /opt/netdata/etc/netdata +sudo ./edit-config exporting.conf +``` +#### Options + +The following options can be defined for this exporter. + +<details><summary>Config options</summary> + +| Name | Description | Default | Required | +|:----|:-----------|:-------|:--------:| +| enabled | Enables or disables an exporting connector instance (yes/no). | no | True | +| destination | Accepts a space separated list of hostnames, IPs (IPv4 and IPv6) and ports to connect to. Netdata will use the first available to send the metrics. | no | True | +| username | Username for HTTP authentication | my_username | False | +| password | Password for HTTP authentication | my_password | False | +| data source | Selects the kind of data that will be sent to the external database. (as collected/average/sum) | | False | +| hostname | The hostname to be used for sending data to the external database server. | [global].hostname | False | +| prefix | The prefix to add to all metrics. | netdata | False | +| update every | Frequency of sending sending data to the external database, in seconds. | 10 | False | +| buffer on failures | The number of iterations (`update every` seconds) to buffer data, when the external database server is not available. | 10 | False | +| timeout ms | The timeout in milliseconds to wait for the external database server to process the data. | 20000 | False | +| send hosts matching | Hosts filter. Determines which hosts will be sent to the external database. The syntax is [simple patterns](https://github.com/netdata/netdata/tree/master/libnetdata/simple_pattern#simple-patterns). | localhost * | False | +| send charts matching | One or more space separated patterns (use * as wildcard) checked against both chart id and chart name. | * | False | +| send names instead of ids | Controls the metric names Netdata should send to the external database (yes/no). | | False | +| send configured labels | Controls if host labels defined in the `[host labels]` section in `netdata.conf` should be sent to the external database (yes/no). | | False | +| send automatic labels | Controls if automatically created labels, like `_os_name` or `_architecture` should be sent to the external database (yes/no). | | False | + +##### destination + +The format of each item in this list, is: [PROTOCOL:]IP[:PORT]. +- PROTOCOL can be udp or tcp. tcp is the default and only supported by the current exporting engine. +- IP can be XX.XX.XX.XX (IPv4), or [XX:XX...XX:XX] (IPv6). For IPv6 you can to enclose the IP in [] to separate it from the port. +- PORT can be a number of a service name. If omitted, the default port for the exporting connector will be used. + +Example IPv4: + ```yaml + destination = 10.11.14.2:2003 10.11.14.3:4242 10.11.14.4:2003 + ``` +Example IPv6 and IPv4 together: +```yaml +destination = [ffff:...:0001]:2003 10.11.12.1:2003 +``` +When multiple servers are defined, Netdata will try the next one when the previous one fails. + + +##### update every + +Netdata will add some randomness to this number, to prevent stressing the external server when many Netdata servers +send data to the same database. This randomness does not affect the quality of the data, only the time they are sent. + + +##### buffer on failures + +If the server fails to receive the data after that many failures, data loss on the connector instance is expected (Netdata will also log it). + + +##### send hosts matching + +Includes one or more space separated patterns, using * as wildcard (any number of times within each pattern). +The patterns are checked against the hostname (the localhost is always checked as localhost), allowing us to +filter which hosts will be sent to the external database when this Netdata is a central Netdata aggregating multiple hosts. + +A pattern starting with `!` gives a negative match. So to match all hosts named `*db*` except hosts containing `*child*`, +use `!*child* *db*` (so, the order is important: the first pattern matching the hostname will be used - positive or negative). + + +##### send charts matching + +A pattern starting with ! gives a negative match. So to match all charts named apps.* except charts ending in *reads, +use !*reads apps.* (so, the order is important: the first pattern matching the chart id or the chart name will be used, +positive or negative). There is also a URL parameter filter that can be used while querying allmetrics. The URL parameter +has a higher priority than the configuration option. + + +##### send names instead of ids + +Netdata supports names and IDs for charts and dimensions. Usually IDs are unique identifiers as read by the system and names +are human friendly labels (also unique). Most charts and metrics have the same ID and name, but in several cases they are +different : disks with device-mapper, interrupts, QoS classes, statsd synthetic charts, etc. + + +</details> + +#### Examples + +##### Example configuration + +Basic configuration + +```yaml +[graphite:netdata] + enabled = yes + destination = localhost:2003 + +``` +##### Configuration with HTTPS and HTTP authentication + +Add `:https` modifier to the connector type if you need to use the TLS/SSL protocol. For example: `remote_write:https:my_instance`. + +```yaml +[graphite:netdata] + enabled = yes + destination = localhost:2003 + username = my_username + password = my_password + +``` +##### Detailed Configuration for a remote, secure host + +Add `:https` modifier to the connector type if you need to use the TLS/SSL protocol. For example: `remote_write:https:my_instance`. + +```yaml +[graphite:https:netdata] + enabled = yes + username = my_username + password = my_password + destination = 10.10.1.114:2003 + # data source = average + # prefix = netdata + # hostname = my_hostname + # update every = 10 + # buffer on failures = 10 + # timeout ms = 20000 + # send names instead of ids = yes + # send charts matching = * + # send hosts matching = localhost * + +``` + diff --git a/exporting/graphite/integrations/kairosdb.md b/exporting/graphite/integrations/kairosdb.md new file mode 100644 index 000000000..605cc8289 --- /dev/null +++ b/exporting/graphite/integrations/kairosdb.md @@ -0,0 +1,172 @@ +<!--startmeta +custom_edit_url: "https://github.com/netdata/netdata/edit/master/exporting/graphite/integrations/kairosdb.md" +meta_yaml: "https://github.com/netdata/netdata/edit/master/exporting/graphite/metadata.yaml" +sidebar_label: "KairosDB" +learn_status: "Published" +learn_rel_path: "Exporting" +message: "DO NOT EDIT THIS FILE DIRECTLY, IT IS GENERATED BY THE EXPORTER'S metadata.yaml FILE" +endmeta--> + +# KairosDB + + +<img src="https://netdata.cloud/img/kairos.png" width="150"/> + + +Use the Graphite connector for the exporting engine to archive your Netdata metrics to Graphite providers for long-term storage, +further analysis, or correlation with data from other sources. + + + +<img src="https://img.shields.io/badge/maintained%20by-Netdata-%2300ab44" /> + +## Setup + +### Prerequisites + +#### + +- You have already installed Netdata and Graphite. + + + +### Configuration + +#### File + +The configuration file name for this integration is `exporting.conf`. + + +You can edit the configuration file using the `edit-config` script from the +Netdata [config directory](https://github.com/netdata/netdata/blob/master/docs/configure/nodes.md#the-netdata-config-directory). + +```bash +cd /etc/netdata 2>/dev/null || cd /opt/netdata/etc/netdata +sudo ./edit-config exporting.conf +``` +#### Options + +The following options can be defined for this exporter. + +<details><summary>Config options</summary> + +| Name | Description | Default | Required | +|:----|:-----------|:-------|:--------:| +| enabled | Enables or disables an exporting connector instance (yes/no). | no | True | +| destination | Accepts a space separated list of hostnames, IPs (IPv4 and IPv6) and ports to connect to. Netdata will use the first available to send the metrics. | no | True | +| username | Username for HTTP authentication | my_username | False | +| password | Password for HTTP authentication | my_password | False | +| data source | Selects the kind of data that will be sent to the external database. (as collected/average/sum) | | False | +| hostname | The hostname to be used for sending data to the external database server. | [global].hostname | False | +| prefix | The prefix to add to all metrics. | netdata | False | +| update every | Frequency of sending sending data to the external database, in seconds. | 10 | False | +| buffer on failures | The number of iterations (`update every` seconds) to buffer data, when the external database server is not available. | 10 | False | +| timeout ms | The timeout in milliseconds to wait for the external database server to process the data. | 20000 | False | +| send hosts matching | Hosts filter. Determines which hosts will be sent to the external database. The syntax is [simple patterns](https://github.com/netdata/netdata/tree/master/libnetdata/simple_pattern#simple-patterns). | localhost * | False | +| send charts matching | One or more space separated patterns (use * as wildcard) checked against both chart id and chart name. | * | False | +| send names instead of ids | Controls the metric names Netdata should send to the external database (yes/no). | | False | +| send configured labels | Controls if host labels defined in the `[host labels]` section in `netdata.conf` should be sent to the external database (yes/no). | | False | +| send automatic labels | Controls if automatically created labels, like `_os_name` or `_architecture` should be sent to the external database (yes/no). | | False | + +##### destination + +The format of each item in this list, is: [PROTOCOL:]IP[:PORT]. +- PROTOCOL can be udp or tcp. tcp is the default and only supported by the current exporting engine. +- IP can be XX.XX.XX.XX (IPv4), or [XX:XX...XX:XX] (IPv6). For IPv6 you can to enclose the IP in [] to separate it from the port. +- PORT can be a number of a service name. If omitted, the default port for the exporting connector will be used. + +Example IPv4: + ```yaml + destination = 10.11.14.2:2003 10.11.14.3:4242 10.11.14.4:2003 + ``` +Example IPv6 and IPv4 together: +```yaml +destination = [ffff:...:0001]:2003 10.11.12.1:2003 +``` +When multiple servers are defined, Netdata will try the next one when the previous one fails. + + +##### update every + +Netdata will add some randomness to this number, to prevent stressing the external server when many Netdata servers +send data to the same database. This randomness does not affect the quality of the data, only the time they are sent. + + +##### buffer on failures + +If the server fails to receive the data after that many failures, data loss on the connector instance is expected (Netdata will also log it). + + +##### send hosts matching + +Includes one or more space separated patterns, using * as wildcard (any number of times within each pattern). +The patterns are checked against the hostname (the localhost is always checked as localhost), allowing us to +filter which hosts will be sent to the external database when this Netdata is a central Netdata aggregating multiple hosts. + +A pattern starting with `!` gives a negative match. So to match all hosts named `*db*` except hosts containing `*child*`, +use `!*child* *db*` (so, the order is important: the first pattern matching the hostname will be used - positive or negative). + + +##### send charts matching + +A pattern starting with ! gives a negative match. So to match all charts named apps.* except charts ending in *reads, +use !*reads apps.* (so, the order is important: the first pattern matching the chart id or the chart name will be used, +positive or negative). There is also a URL parameter filter that can be used while querying allmetrics. The URL parameter +has a higher priority than the configuration option. + + +##### send names instead of ids + +Netdata supports names and IDs for charts and dimensions. Usually IDs are unique identifiers as read by the system and names +are human friendly labels (also unique). Most charts and metrics have the same ID and name, but in several cases they are +different : disks with device-mapper, interrupts, QoS classes, statsd synthetic charts, etc. + + +</details> + +#### Examples + +##### Example configuration + +Basic configuration + +```yaml +[graphite:netdata] + enabled = yes + destination = localhost:2003 + +``` +##### Configuration with HTTPS and HTTP authentication + +Add `:https` modifier to the connector type if you need to use the TLS/SSL protocol. For example: `remote_write:https:my_instance`. + +```yaml +[graphite:netdata] + enabled = yes + destination = localhost:2003 + username = my_username + password = my_password + +``` +##### Detailed Configuration for a remote, secure host + +Add `:https` modifier to the connector type if you need to use the TLS/SSL protocol. For example: `remote_write:https:my_instance`. + +```yaml +[graphite:https:netdata] + enabled = yes + username = my_username + password = my_password + destination = 10.10.1.114:2003 + # data source = average + # prefix = netdata + # hostname = my_hostname + # update every = 10 + # buffer on failures = 10 + # timeout ms = 20000 + # send names instead of ids = yes + # send charts matching = * + # send hosts matching = localhost * + +``` + |