
diff options
Diffstat (limited to 'web/gui/README.md')
| -rw-r--r-- | web/gui/README.md | 165 |
1 files changed, 0 insertions, 165 deletions
diff --git a/web/gui/README.md b/web/gui/README.md deleted file mode 100644 index 2b73ad268..000000000 --- a/web/gui/README.md +++ /dev/null @@ -1,165 +0,0 @@ -# Legacy Agent dashboard - -> ⚠️ You're checking the documentation for the legacy Agent dashboard. For the current version please check [Accessing Netdata Dashboards](https://github.com/netdata/netdata/blob/master/docs/category-overview-pages/accessing-netdata-dashboards.md). - - -The local Netdata Agent dashboard is the heart of Netdata's performance troubleshooting toolkit. You've probably seen it -before: - - - -Learn more about how dashboards work and how they're populated using the `dashboards.js` file in our [web dashboards -overview](https://github.com/netdata/netdata/blob/master/web/README.md). - -By default, Netdata starts a web server for its dashboard at port `19999`. Open up your web browser of choice and -navigate to `http://NODE:19999`, replacing `NODE` with the IP address or hostname of your Agent. If installed on localhost, -you can access it through `http://localhost:19999`. - -Netdata uses an [internal, static-threaded web server](https://github.com/netdata/netdata/blob/master/web/server/README.md) to host the HTML, CSS, and JavaScript -files that make up the local Agent dashboard. You don't have to configure anything to access it, although you can adjust -[your settings](https://github.com/netdata/netdata/blob/master/web/server/README.md#other-netdataconf-web-section-options) in the `netdata.conf` file, or run Netdata -behind an [Nginx proxy](https://github.com/netdata/netdata/blob/master/docs/Running-behind-nginx.md), and so on. - -## Navigating the local dashboard - -Beyond charts, the local dashboard can be broken down into three key areas: - -- [Local Agent dashboard](#local-agent-dashboard) - - [Navigating the local dashboard](#navigating-the-local-dashboard) - - [Sections](#sections) - - [Time \& date picker](#time--date-picker) - - [Metrics menus](#metrics-menus) - - [Cloud menus (Spaces, War Rooms, and Visited nodes)](#cloud-menus-spaces-war-rooms-and-visited-nodes) - - [Customizing the local dashboard](#customizing-the-local-dashboard) - - [Custom dashboards](#custom-dashboards) - -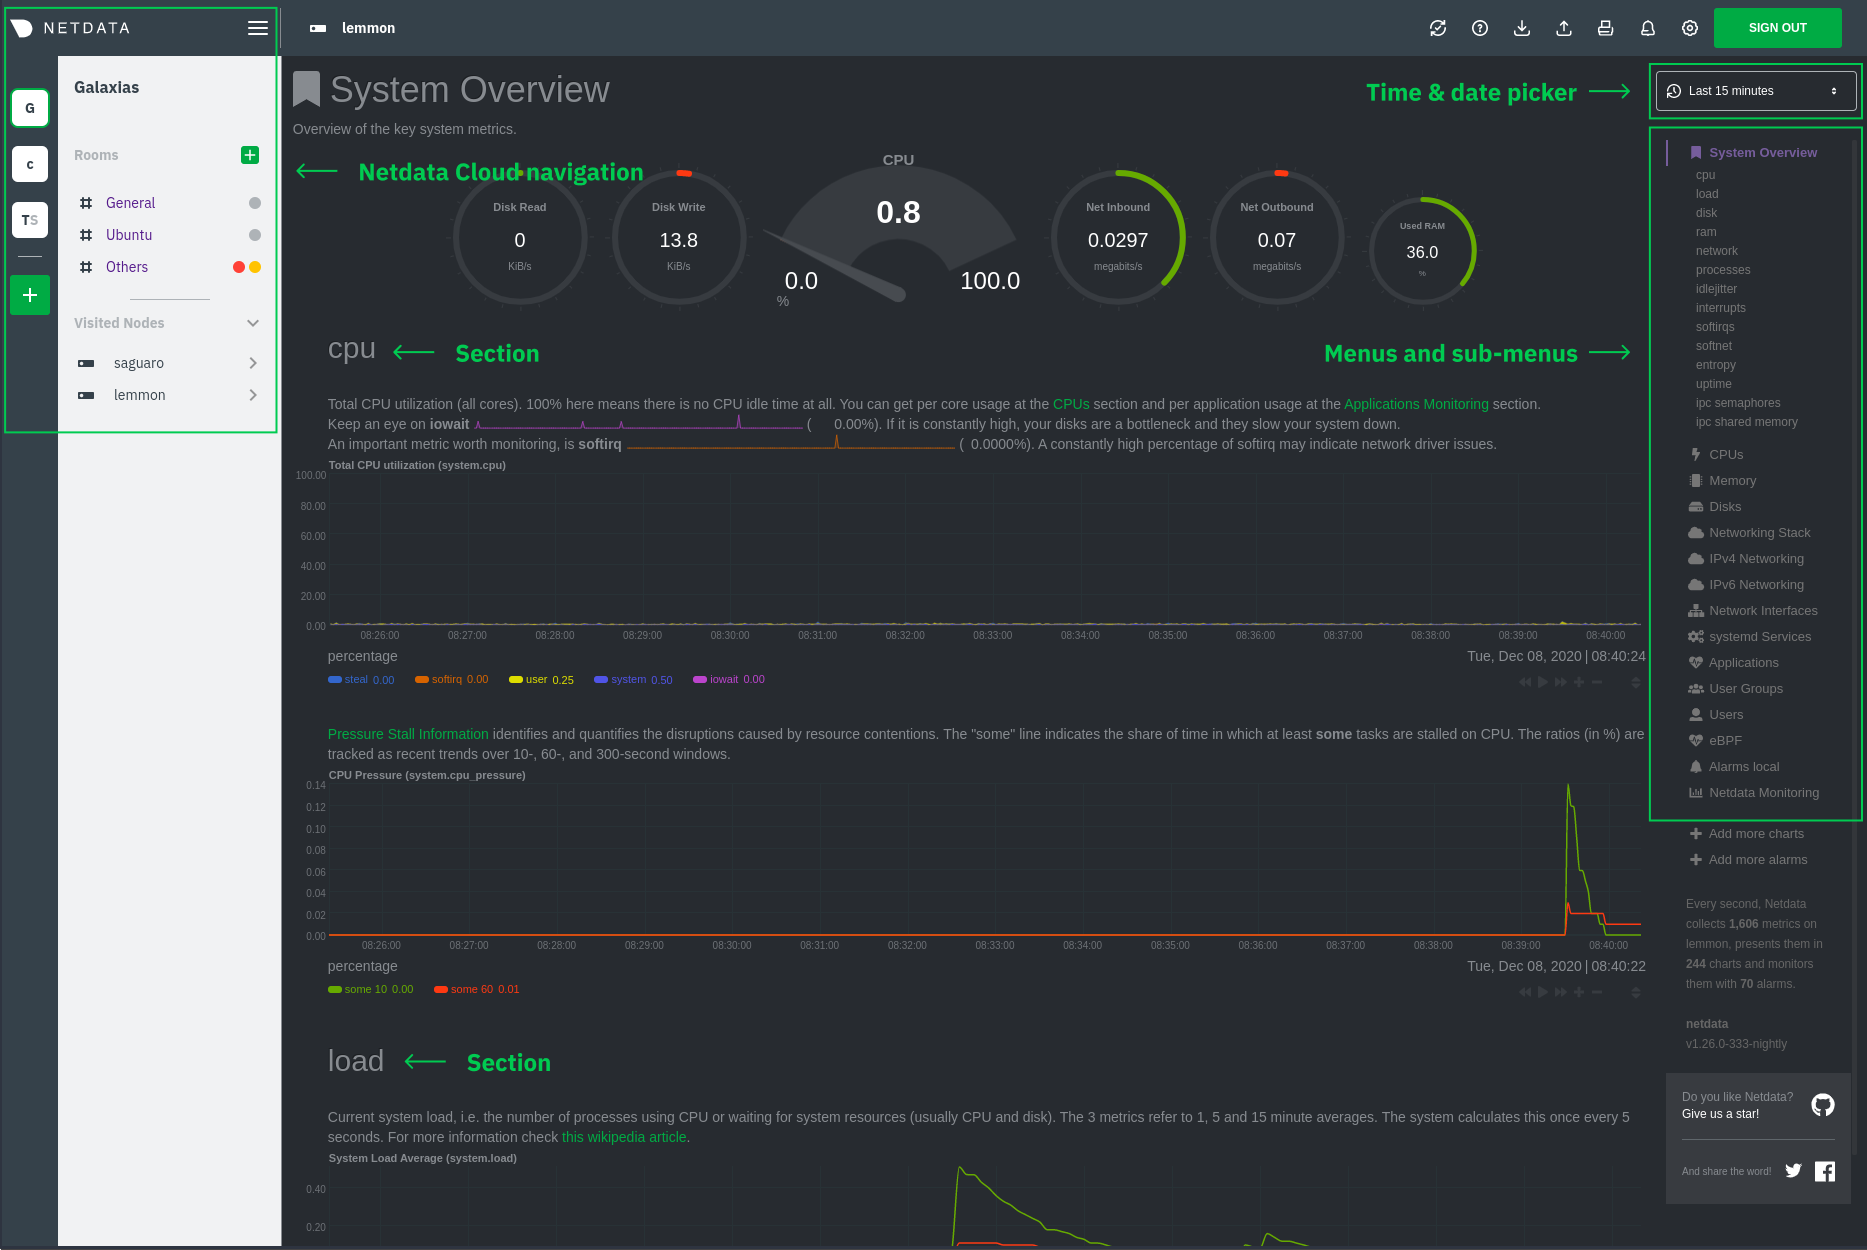 - -### Sections - -Netdata is broken up into multiple **sections**, such as **System Overview**, -**CPU**, **Disk**, and more. Inside each section you'll find a number of charts, -broken down into [contexts](https://github.com/netdata/netdata/blob/master/web/README.md#contexts) and -[families](https://github.com/netdata/netdata/blob/master/web/README.md#families). - -An example of the **Memory** section on a Linux desktop system. - -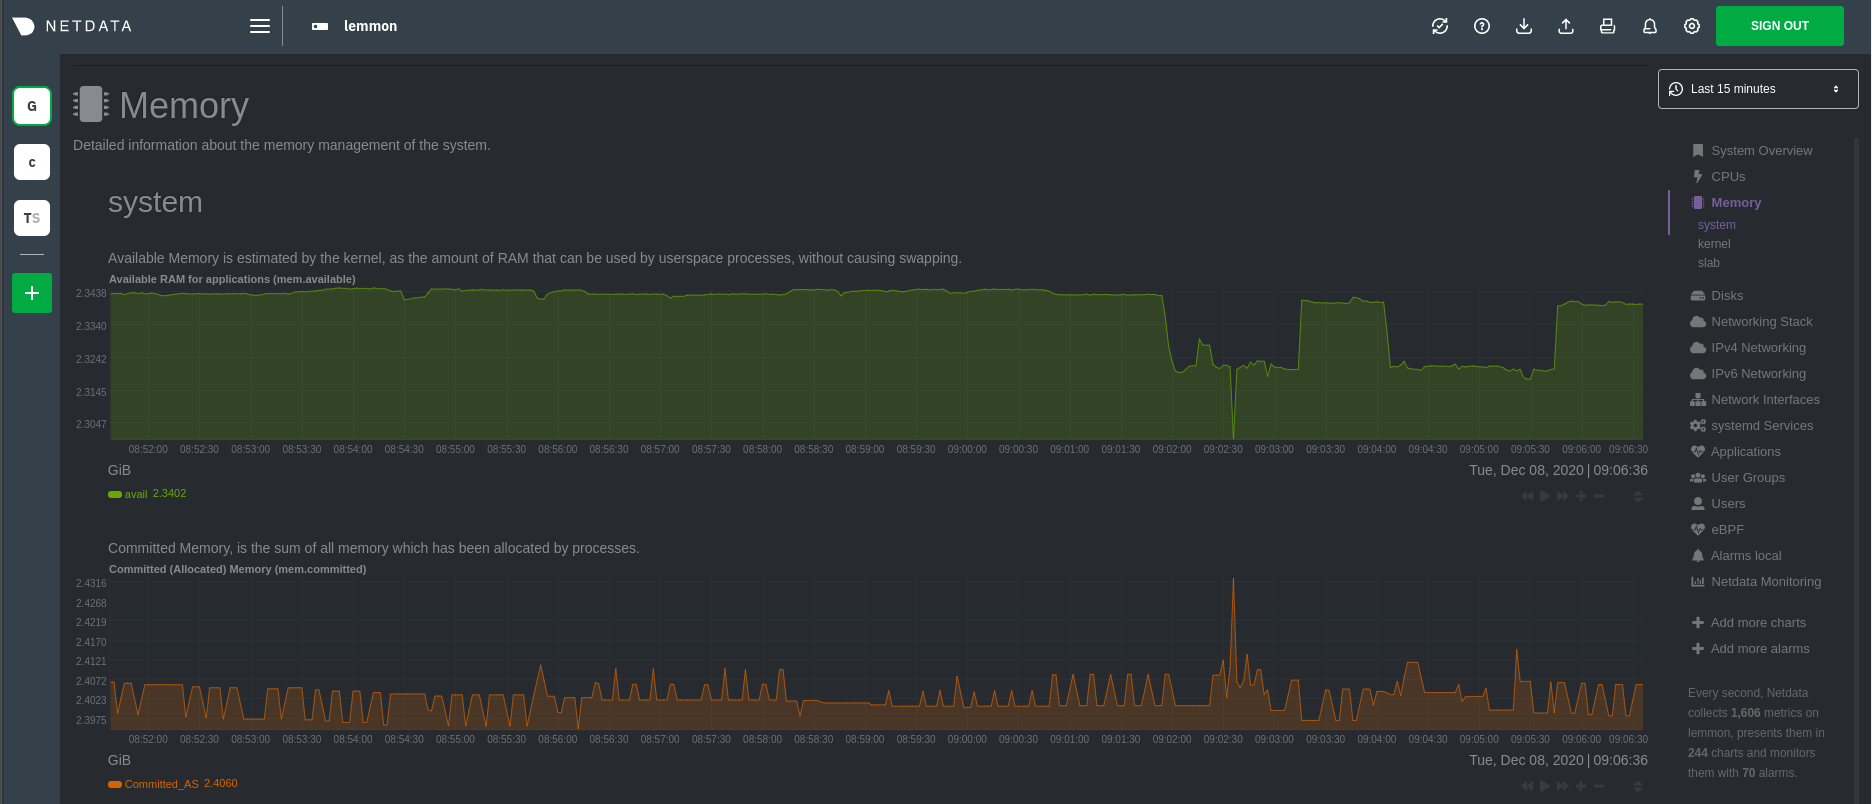 - -All sections and their associated charts appear on a single page, so all you need to do to view different sections is -scroll up and down. But it's usually quicker to use the [menus](#metrics-menus). - -### Time & date picker - -The local dashboard features a time & date picker to help you visualize specific timeframes of historical metrics. The -picker chooses an appropriate default to always show per-second granularity based on the width of your browser's -viewport. - -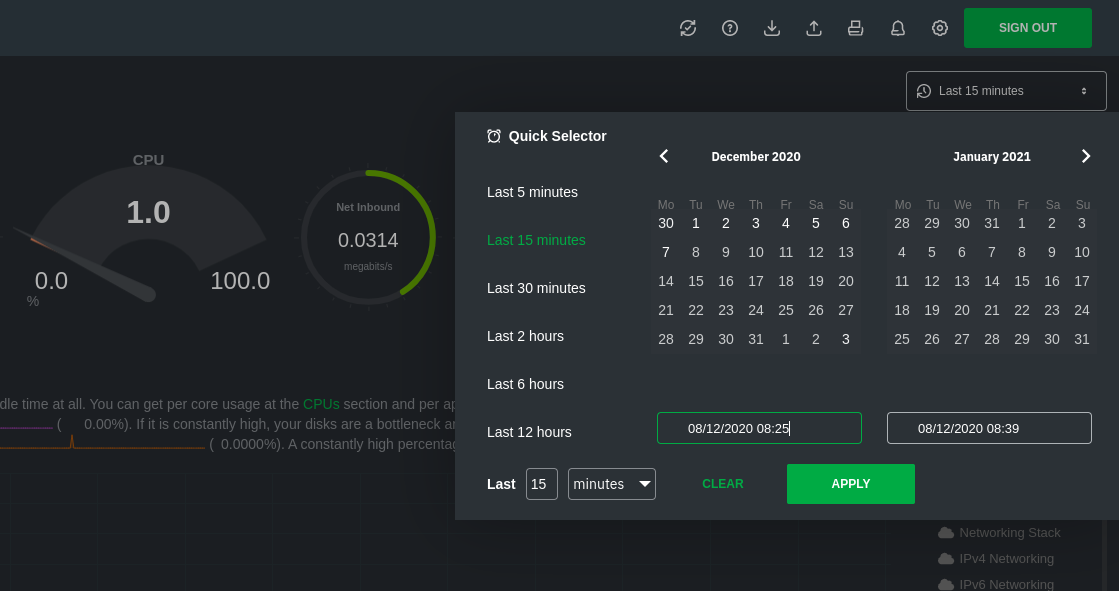 - -Use the Quick Selector to show metrics from the last 5 minutes, 15 minutes, 30 minutes, 2 hours, 6 hours, or 12 hours. - -Beneath the Quick Selector is an input field and dropdown you use in combination to select a specific timeframe of -minutes, hours, days, or months. Enter a number and choose the appropriate unit of time. - -Use the calendar to select multiple days. Click on a date to begin the timeframe selection, then an ending date. - -Click **Apply** to re-render all visualizations with new metrics data, or **Clear** to restore the default timeframe. - -[Increase the metrics retention policy](https://github.com/netdata/netdata/blob/master/docs/store/change-metrics-storage.md) for your node to see more historical -timeframes. - -### Metrics menus - -**Metrics menus** appears on the right-hand side of the local Agent dashboard. Netdata generates a menu for each -section, and menus link to the section they're associated with. - -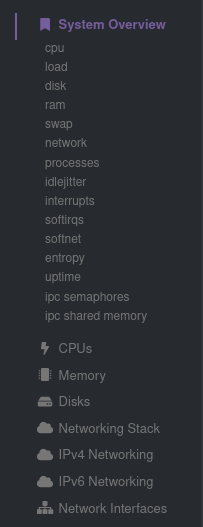 - -Most metrics menu items will contain several **submenu** entries, which represent any -[families](https://github.com/netdata/netdata/blob/master/web/README.md#families) from that section. Netdata automatically -generates these submenu entries. - -Here's a **Disks** menu with several submenu entries for each disk drive and -partition Netdata recognizes. - -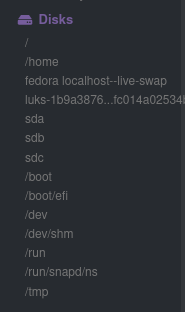 - -### Cloud menus (Spaces, War Rooms, and Visited nodes) - -The dashboard also features a menu related to Netdata Cloud functionality. You can view your existing Spaces or create -new ones via the left vertical column of boxes. This menu also displays the name of your current Space, shows a list of -any War Rooms you've added you your Space, and lists any notes you recently visited via their Agent dashboards. Click on -a War Room's name to jump to the Netdata Cloud web interface. - -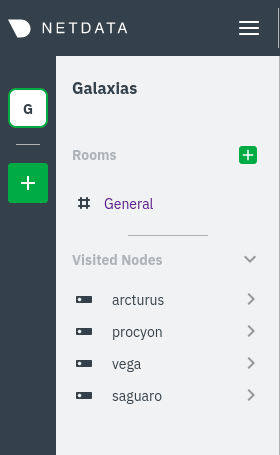 - -## Customizing the local dashboard - -Netdata stores information about individual charts in the `dashboard_info.js` -file. This file includes section and subsection headings, descriptions, colors, -titles, tooltips, and other information for Netdata to render on the dashboard. - -For example, here is how `dashboard_info.js` defines the **System Overview** -section. - -```javascript -netdataDashboard.menu = { - 'system': { - title: 'System Overview', - icon: '<i class="fas fa-bookmark"></i>', - info: 'Overview of the key system metrics.' - }, -``` - -If you want to customize this information, you should avoid editing -`dashboard_info.js` directly. These changes are not persistent; Netdata will -overwrite the file when it's updated. Instead, you should create a new file with -your customizations. - -We created an example file at `dashboard_info_custom_example.js`. You can -copy this to a new file with a name of your choice in the `web/` directory. This -directory changes based on your operating system and installation method. If -you're on a Linux system, it should be at `/usr/share/netdata/web/`. - -```shell -cd /usr/share/netdata/web/ -sudo cp dashboard_info_custom_example.js your_dashboard_info_file.js -``` - -Edit the file with your customizations. For example: - -```javascript -customDashboard.menu = { - system: { - title: "Testing, testing, 1 2 3", - icon: '<i class="fas fa-thumbs-up"></i>', - info: "This is overwritten info for the system overview section!" - } -}; -``` - -Finally, tell Netdata where you placed your customization file by replacing -`your_dashboard_info_file.js` below. - -```conf -[web] - custom dashboard_info.js = your_dashboard_info_file.js -``` - -Once you restart Netdata, refresh the dashboard to find your custom -configuration: - -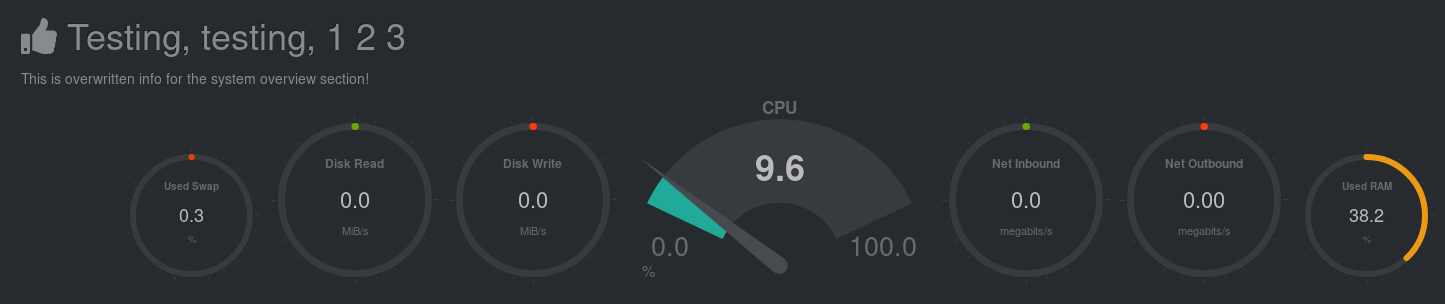 - -## Custom dashboards - -For information on creating custom dashboards from scratch, see the [custom dashboards](https://github.com/netdata/netdata/blob/master/web/gui/custom/README.md) or -[Atlassian Confluence dashboards](https://github.com/netdata/netdata/blob/master/web/gui/confluence/README.md) guides. |