
diff options
Diffstat (limited to 'web/gui')
22 files changed, 1266 insertions, 419 deletions
diff --git a/web/gui/Makefile.in b/web/gui/Makefile.in new file mode 100644 index 000000000..265440bdc --- /dev/null +++ b/web/gui/Makefile.in @@ -0,0 +1,914 @@ +# Makefile.in generated by automake 1.15.1 from Makefile.am. +# @configure_input@ + +# Copyright (C) 1994-2017 Free Software Foundation, Inc. + +# This Makefile.in is free software; the Free Software Foundation +# gives unlimited permission to copy and/or distribute it, +# with or without modifications, as long as this notice is preserved. + +# This program is distributed in the hope that it will be useful, +# but WITHOUT ANY WARRANTY, to the extent permitted by law; without +# even the implied warranty of MERCHANTABILITY or FITNESS FOR A +# PARTICULAR PURPOSE. + +@SET_MAKE@ + +VPATH = @srcdir@ +am__is_gnu_make = { \ + if test -z '$(MAKELEVEL)'; then \ + false; \ + elif test -n '$(MAKE_HOST)'; then \ + true; \ + elif test -n '$(MAKE_VERSION)' && test -n '$(CURDIR)'; then \ + true; \ + else \ + false; \ + fi; \ +} +am__make_running_with_option = \ + case $${target_option-} in \ + ?) ;; \ + *) echo "am__make_running_with_option: internal error: invalid" \ + "target option '$${target_option-}' specified" >&2; \ + exit 1;; \ + esac; \ + has_opt=no; \ + sane_makeflags=$$MAKEFLAGS; \ + if $(am__is_gnu_make); then \ + sane_makeflags=$$MFLAGS; \ + else \ + case $$MAKEFLAGS in \ + *\\[\ \ ]*) \ + bs=\\; \ + sane_makeflags=`printf '%s\n' "$$MAKEFLAGS" \ + | sed "s/$$bs$$bs[$$bs $$bs ]*//g"`;; \ + esac; \ + fi; \ + skip_next=no; \ + strip_trailopt () \ + { \ + flg=`printf '%s\n' "$$flg" | sed "s/$$1.*$$//"`; \ + }; \ + for flg in $$sane_makeflags; do \ + test $$skip_next = yes && { skip_next=no; continue; }; \ + case $$flg in \ + *=*|--*) continue;; \ + -*I) strip_trailopt 'I'; skip_next=yes;; \ + -*I?*) strip_trailopt 'I';; \ + -*O) strip_trailopt 'O'; skip_next=yes;; \ + -*O?*) strip_trailopt 'O';; \ + -*l) strip_trailopt 'l'; skip_next=yes;; \ + -*l?*) strip_trailopt 'l';; \ + -[dEDm]) skip_next=yes;; \ + -[JT]) skip_next=yes;; \ + esac; \ + case $$flg in \ + *$$target_option*) has_opt=yes; break;; \ + esac; \ + done; \ + test $$has_opt = yes +am__make_dryrun = (target_option=n; $(am__make_running_with_option)) +am__make_keepgoing = (target_option=k; $(am__make_running_with_option)) +pkgdatadir = $(datadir)/@PACKAGE@ +pkgincludedir = $(includedir)/@PACKAGE@ +pkglibdir = $(libdir)/@PACKAGE@ +pkglibexecdir = $(libexecdir)/@PACKAGE@ +am__cd = CDPATH="$${ZSH_VERSION+.}$(PATH_SEPARATOR)" && cd +install_sh_DATA = $(install_sh) -c -m 644 +install_sh_PROGRAM = $(install_sh) -c +install_sh_SCRIPT = $(install_sh) -c +INSTALL_HEADER = $(INSTALL_DATA) +transform = $(program_transform_name) +NORMAL_INSTALL = : +PRE_INSTALL = : +POST_INSTALL = : +NORMAL_UNINSTALL = : +PRE_UNINSTALL = : +POST_UNINSTALL = : +build_triplet = @build@ +host_triplet = @host@ +subdir = web/gui +ACLOCAL_M4 = $(top_srcdir)/aclocal.m4 +am__aclocal_m4_deps = $(top_srcdir)/build/m4/ax_c___atomic.m4 \ + $(top_srcdir)/build/m4/ax_c__generic.m4 \ + $(top_srcdir)/build/m4/ax_c_lto.m4 \ + $(top_srcdir)/build/m4/ax_c_mallinfo.m4 \ + $(top_srcdir)/build/m4/ax_c_mallopt.m4 \ + $(top_srcdir)/build/m4/ax_check_compile_flag.m4 \ + $(top_srcdir)/build/m4/ax_gcc_func_attribute.m4 \ + $(top_srcdir)/build/m4/ax_pthread.m4 \ + $(top_srcdir)/build/m4/jemalloc.m4 \ + $(top_srcdir)/build/m4/tcmalloc.m4 $(top_srcdir)/configure.ac +am__configure_deps = $(am__aclocal_m4_deps) $(CONFIGURE_DEPENDENCIES) \ + $(ACLOCAL_M4) +DIST_COMMON = $(srcdir)/Makefile.am $(dist_noinst_DATA) \ + $(dist_web_DATA) $(dist_webcss_DATA) $(dist_webdnt_DATA) \ + $(dist_webfonts_DATA) $(dist_webimages_DATA) \ + $(dist_weblib_DATA) $(dist_webstatic_DATA) \ + $(dist_webwellknown_DATA) $(am__DIST_COMMON) +mkinstalldirs = $(install_sh) -d +CONFIG_HEADER = $(top_builddir)/config.h +CONFIG_CLEAN_FILES = +CONFIG_CLEAN_VPATH_FILES = +AM_V_P = $(am__v_P_@AM_V@) +am__v_P_ = $(am__v_P_@AM_DEFAULT_V@) +am__v_P_0 = false +am__v_P_1 = : +AM_V_GEN = $(am__v_GEN_@AM_V@) +am__v_GEN_ = $(am__v_GEN_@AM_DEFAULT_V@) +am__v_GEN_0 = @echo " GEN " $@; +am__v_GEN_1 = +AM_V_at = $(am__v_at_@AM_V@) +am__v_at_ = $(am__v_at_@AM_DEFAULT_V@) +am__v_at_0 = @ +am__v_at_1 = +SOURCES = +DIST_SOURCES = +am__can_run_installinfo = \ + case $$AM_UPDATE_INFO_DIR in \ + n|no|NO) false;; \ + *) (install-info --version) >/dev/null 2>&1;; \ + esac +am__vpath_adj_setup = srcdirstrip=`echo "$(srcdir)" | sed 's|.|.|g'`; +am__vpath_adj = case $$p in \ + $(srcdir)/*) f=`echo "$$p" | sed "s|^$$srcdirstrip/||"`;; \ + *) f=$$p;; \ + esac; +am__strip_dir = f=`echo $$p | sed -e 's|^.*/||'`; +am__install_max = 40 +am__nobase_strip_setup = \ + srcdirstrip=`echo "$(srcdir)" | sed 's/[].[^$$\\*|]/\\\\&/g'` +am__nobase_strip = \ + for p in $$list; do echo "$$p"; done | sed -e "s|$$srcdirstrip/||" +am__nobase_list = $(am__nobase_strip_setup); \ + for p in $$list; do echo "$$p $$p"; done | \ + sed "s| $$srcdirstrip/| |;"' / .*\//!s/ .*/ ./; s,\( .*\)/[^/]*$$,\1,' | \ + $(AWK) 'BEGIN { files["."] = "" } { files[$$2] = files[$$2] " " $$1; \ + if (++n[$$2] == $(am__install_max)) \ + { print $$2, files[$$2]; n[$$2] = 0; files[$$2] = "" } } \ + END { for (dir in files) print dir, files[dir] }' +am__base_list = \ + sed '$$!N;$$!N;$$!N;$$!N;$$!N;$$!N;$$!N;s/\n/ /g' | \ + sed '$$!N;$$!N;$$!N;$$!N;s/\n/ /g' +am__uninstall_files_from_dir = { \ + test -z "$$files" \ + || { test ! -d "$$dir" && test ! -f "$$dir" && test ! -r "$$dir"; } \ + || { echo " ( cd '$$dir' && rm -f" $$files ")"; \ + $(am__cd) "$$dir" && rm -f $$files; }; \ + } +am__installdirs = "$(DESTDIR)$(webdir)" "$(DESTDIR)$(webcssdir)" \ + "$(DESTDIR)$(webdntdir)" "$(DESTDIR)$(webfontsdir)" \ + "$(DESTDIR)$(webimagesdir)" "$(DESTDIR)$(weblibdir)" \ + "$(DESTDIR)$(webstaticdir)" "$(DESTDIR)$(webwellknowndir)" +DATA = $(dist_noinst_DATA) $(dist_web_DATA) $(dist_webcss_DATA) \ + $(dist_webdnt_DATA) $(dist_webfonts_DATA) \ + $(dist_webimages_DATA) $(dist_weblib_DATA) \ + $(dist_webstatic_DATA) $(dist_webwellknown_DATA) +am__tagged_files = $(HEADERS) $(SOURCES) $(TAGS_FILES) $(LISP) +am__DIST_COMMON = $(srcdir)/Makefile.in +DISTFILES = $(DIST_COMMON) $(DIST_SOURCES) $(TEXINFOS) $(EXTRA_DIST) +ACLOCAL = @ACLOCAL@ +AMTAR = @AMTAR@ +AM_DEFAULT_VERBOSITY = @AM_DEFAULT_VERBOSITY@ +AUTOCONF = @AUTOCONF@ +AUTOHEADER = @AUTOHEADER@ +AUTOMAKE = @AUTOMAKE@ +AWK = @AWK@ +CC = @CC@ +CCDEPMODE = @CCDEPMODE@ +CFLAGS = @CFLAGS@ +CPP = @CPP@ +CPPFLAGS = @CPPFLAGS@ +CUPSCONFIG = @CUPSCONFIG@ +CXX = @CXX@ +CXXDEPMODE = @CXXDEPMODE@ +CXXFLAGS = @CXXFLAGS@ +CXX_BINARY = @CXX_BINARY@ +CYGPATH_W = @CYGPATH_W@ +DEFS = @DEFS@ +DEPDIR = @DEPDIR@ +ECHO_C = @ECHO_C@ +ECHO_N = @ECHO_N@ +ECHO_T = @ECHO_T@ +EGREP = @EGREP@ +EXEEXT = @EXEEXT@ +GREP = @GREP@ +INSTALL = @INSTALL@ +INSTALL_DATA = @INSTALL_DATA@ +INSTALL_PROGRAM = @INSTALL_PROGRAM@ +INSTALL_SCRIPT = @INSTALL_SCRIPT@ +INSTALL_STRIP_PROGRAM = @INSTALL_STRIP_PROGRAM@ +IPMIMONITORING_CFLAGS = @IPMIMONITORING_CFLAGS@ +IPMIMONITORING_LIBS = @IPMIMONITORING_LIBS@ +JSON_CFLAGS = @JSON_CFLAGS@ +JSON_LIBS = @JSON_LIBS@ +LDFLAGS = @LDFLAGS@ +LIBCAP_CFLAGS = @LIBCAP_CFLAGS@ +LIBCAP_LIBS = @LIBCAP_LIBS@ +LIBCRYPTO_CFLAGS = @LIBCRYPTO_CFLAGS@ +LIBCRYPTO_LIBS = @LIBCRYPTO_LIBS@ +LIBCURL_CFLAGS = @LIBCURL_CFLAGS@ +LIBCURL_LIBS = @LIBCURL_LIBS@ +LIBMNL_CFLAGS = @LIBMNL_CFLAGS@ +LIBMNL_LIBS = @LIBMNL_LIBS@ +LIBMONGOC_CFLAGS = @LIBMONGOC_CFLAGS@ +LIBMONGOC_LIBS = @LIBMONGOC_LIBS@ +LIBOBJS = @LIBOBJS@ +LIBS = @LIBS@ +LIBSSL_CFLAGS = @LIBSSL_CFLAGS@ +LIBSSL_LIBS = @LIBSSL_LIBS@ +LTLIBOBJS = @LTLIBOBJS@ +MAINT = @MAINT@ +MAKEINFO = @MAKEINFO@ +MATH_CFLAGS = @MATH_CFLAGS@ +MATH_LIBS = @MATH_LIBS@ +MKDIR_P = @MKDIR_P@ +NFACCT_CFLAGS = @NFACCT_CFLAGS@ +NFACCT_LIBS = @NFACCT_LIBS@ +OBJEXT = @OBJEXT@ +OPTIONAL_CUPS_CFLAGS = @OPTIONAL_CUPS_CFLAGS@ +OPTIONAL_CUPS_LIBS = @OPTIONAL_CUPS_LIBS@ +OPTIONAL_IPMIMONITORING_CFLAGS = @OPTIONAL_IPMIMONITORING_CFLAGS@ +OPTIONAL_IPMIMONITORING_LIBS = @OPTIONAL_IPMIMONITORING_LIBS@ +OPTIONAL_JSONC_LIBS = @OPTIONAL_JSONC_LIBS@ +OPTIONAL_JUDY_LIBS = @OPTIONAL_JUDY_LIBS@ +OPTIONAL_KINESIS_CFLAGS = @OPTIONAL_KINESIS_CFLAGS@ +OPTIONAL_KINESIS_LIBS = @OPTIONAL_KINESIS_LIBS@ +OPTIONAL_LIBCAP_CFLAGS = @OPTIONAL_LIBCAP_CFLAGS@ +OPTIONAL_LIBCAP_LIBS = @OPTIONAL_LIBCAP_LIBS@ +OPTIONAL_LZ4_LIBS = @OPTIONAL_LZ4_LIBS@ +OPTIONAL_MATH_CFLAGS = @OPTIONAL_MATH_CFLAGS@ +OPTIONAL_MATH_LIBS = @OPTIONAL_MATH_LIBS@ +OPTIONAL_MONGOC_CFLAGS = @OPTIONAL_MONGOC_CFLAGS@ +OPTIONAL_MONGOC_LIBS = @OPTIONAL_MONGOC_LIBS@ +OPTIONAL_NFACCT_CFLAGS = @OPTIONAL_NFACCT_CFLAGS@ +OPTIONAL_NFACCT_LIBS = @OPTIONAL_NFACCT_LIBS@ +OPTIONAL_PROMETHEUS_REMOTE_WRITE_CFLAGS = @OPTIONAL_PROMETHEUS_REMOTE_WRITE_CFLAGS@ +OPTIONAL_PROMETHEUS_REMOTE_WRITE_LIBS = @OPTIONAL_PROMETHEUS_REMOTE_WRITE_LIBS@ +OPTIONAL_SSL_LIBS = @OPTIONAL_SSL_LIBS@ +OPTIONAL_UUID_CFLAGS = @OPTIONAL_UUID_CFLAGS@ +OPTIONAL_UUID_LIBS = @OPTIONAL_UUID_LIBS@ +OPTIONAL_UV_LIBS = @OPTIONAL_UV_LIBS@ +OPTIONAL_XENSTAT_CFLAGS = @OPTIONAL_XENSTAT_CFLAGS@ +OPTIONAL_XENSTAT_LIBS = @OPTIONAL_XENSTAT_LIBS@ +OPTIONAL_ZLIB_CFLAGS = @OPTIONAL_ZLIB_CFLAGS@ +OPTIONAL_ZLIB_LIBS = @OPTIONAL_ZLIB_LIBS@ +PACKAGE = @PACKAGE@ +PACKAGE_BUGREPORT = @PACKAGE_BUGREPORT@ +PACKAGE_NAME = @PACKAGE_NAME@ +PACKAGE_RPM_VERSION = @PACKAGE_RPM_VERSION@ +PACKAGE_STRING = @PACKAGE_STRING@ +PACKAGE_TARNAME = @PACKAGE_TARNAME@ +PACKAGE_URL = @PACKAGE_URL@ +PACKAGE_VERSION = @PACKAGE_VERSION@ +PATH_SEPARATOR = @PATH_SEPARATOR@ +PKG_CONFIG = @PKG_CONFIG@ +PKG_CONFIG_LIBDIR = @PKG_CONFIG_LIBDIR@ +PKG_CONFIG_PATH = @PKG_CONFIG_PATH@ +PROTOBUF_CFLAGS = @PROTOBUF_CFLAGS@ +PROTOBUF_LIBS = @PROTOBUF_LIBS@ +PROTOC = @PROTOC@ +PTHREAD_CC = @PTHREAD_CC@ +PTHREAD_CFLAGS = @PTHREAD_CFLAGS@ +PTHREAD_LIBS = @PTHREAD_LIBS@ +SET_MAKE = @SET_MAKE@ +SHELL = @SHELL@ +SSE_CANDIDATE = @SSE_CANDIDATE@ +STRIP = @STRIP@ +UUID_CFLAGS = @UUID_CFLAGS@ +UUID_LIBS = @UUID_LIBS@ +VERSION = @VERSION@ +XENLIGHT_CFLAGS = @XENLIGHT_CFLAGS@ +XENLIGHT_LIBS = @XENLIGHT_LIBS@ +YAJL_CFLAGS = @YAJL_CFLAGS@ +YAJL_LIBS = @YAJL_LIBS@ +ZLIB_CFLAGS = @ZLIB_CFLAGS@ +ZLIB_LIBS = @ZLIB_LIBS@ +abs_builddir = @abs_builddir@ +abs_srcdir = @abs_srcdir@ +abs_top_builddir = @abs_top_builddir@ +abs_top_srcdir = @abs_top_srcdir@ +ac_ct_CC = @ac_ct_CC@ +ac_ct_CXX = @ac_ct_CXX@ +am__include = @am__include@ +am__leading_dot = @am__leading_dot@ +am__quote = @am__quote@ +am__tar = @am__tar@ +am__untar = @am__untar@ +ax_pthread_config = @ax_pthread_config@ +bindir = @bindir@ +build = @build@ +build_alias = @build_alias@ +build_cpu = @build_cpu@ +build_os = @build_os@ +build_target = @build_target@ +build_vendor = @build_vendor@ +builddir = @builddir@ +cachedir = @cachedir@ +chartsdir = @chartsdir@ +configdir = @configdir@ +datadir = @datadir@ +datarootdir = @datarootdir@ +docdir = @docdir@ +dvidir = @dvidir@ +exec_prefix = @exec_prefix@ +has_jemalloc = @has_jemalloc@ +has_tcmalloc = @has_tcmalloc@ +host = @host@ +host_alias = @host_alias@ +host_cpu = @host_cpu@ +host_os = @host_os@ +host_vendor = @host_vendor@ +htmldir = @htmldir@ +includedir = @includedir@ +infodir = @infodir@ +install_sh = @install_sh@ +libconfigdir = @libconfigdir@ +libdir = @libdir@ +libexecdir = @libexecdir@ +localedir = @localedir@ +localstatedir = @localstatedir@ +logdir = @logdir@ +mandir = @mandir@ +mkdir_p = @mkdir_p@ +nodedir = @nodedir@ +oldincludedir = @oldincludedir@ +pdfdir = @pdfdir@ +pluginsdir = @pluginsdir@ +prefix = @prefix@ +program_transform_name = @program_transform_name@ +psdir = @psdir@ +pythondir = @pythondir@ +registrydir = @registrydir@ +runstatedir = @runstatedir@ +sbindir = @sbindir@ +sharedstatedir = @sharedstatedir@ +srcdir = @srcdir@ +sysconfdir = @sysconfdir@ +target_alias = @target_alias@ +top_build_prefix = @top_build_prefix@ +top_builddir = @top_builddir@ +top_srcdir = @top_srcdir@ +varlibdir = @varlibdir@ +webdir = @webdir@ + +# +# Copyright (C) 2015 Alon Bar-Lev <alon.barlev@gmail.com> +# SPDX-License-Identifier: GPL-3.0-or-later +# +MAINTAINERCLEANFILES = $(srcdir)/Makefile.in +CLEANFILES = \ + version.txt \ + $(NULL) + +DASHBOARD_JS_FILES = \ + src/dashboard.js/prologue.js.inc \ + src/dashboard.js/utils.js \ + src/dashboard.js/server-detection.js \ + src/dashboard.js/dependencies.js \ + src/dashboard.js/error-handling.js \ + src/dashboard.js/compatibility.js \ + src/dashboard.js/xss.js \ + src/dashboard.js/colors.js \ + src/dashboard.js/units-conversion.js \ + src/dashboard.js/options.js \ + src/dashboard.js/localstorage.js \ + src/dashboard.js/timeout.js \ + src/dashboard.js/themes.js \ + src/dashboard.js/charting/dygraph.js \ + src/dashboard.js/charting/sparkline.js \ + src/dashboard.js/charting/google-charts.js \ + src/dashboard.js/charting/gauge.js \ + src/dashboard.js/charting/easy-pie-chart.js \ + src/dashboard.js/charting/d3pie.js \ + src/dashboard.js/charting/d3.js \ + src/dashboard.js/charting/peity.js \ + src/dashboard.js/charting/textonly.js \ + src/dashboard.js/charting.js \ + src/dashboard.js/chart-registry.js \ + src/dashboard.js/common.js \ + src/dashboard.js/main.js \ + src/dashboard.js/alarms.js \ + src/dashboard.js/registry.js \ + src/dashboard.js/boot.js \ + src/dashboard.js/epilogue.js.inc \ + $(NULL) + +dist_noinst_DATA = \ + README.md \ + $(DASHBOARD_JS_FILES) \ + $(NULL) + +dist_web_DATA = \ + demo.html \ + demo2.html \ + demosites.html \ + demosites2.html \ + dashboard.html \ + dashboard.js \ + dashboard_info.js \ + dashboard_info_custom_example.js \ + dashboard.css \ + dashboard.slate.css \ + favicon.ico \ + goto-host-from-alarm.html \ + index.html \ + main.css \ + main.js \ + console.html \ + infographic.html \ + robots.txt \ + refresh-badges.js \ + sitemap.xml \ + tv.html \ + version.txt \ + $(NULL) + +webstaticdir = $(webdir)/static/img +dist_webstatic_DATA = \ + static/img/netdata-logomark.svg \ + $(NULL) + +weblibdir = $(webdir)/lib +dist_weblib_DATA = \ + lib/bootstrap-3.3.7.min.js \ + lib/bootstrap-slider-10.0.0.min.js \ + lib/bootstrap-table-1.11.0.min.js \ + lib/bootstrap-table-export-1.11.0.min.js \ + lib/bootstrap-toggle-2.2.2.min.js \ + lib/clipboard-polyfill-be05dad.js \ + lib/d3-4.12.2.min.js \ + lib/d3pie-0.2.1-netdata-3.js \ + lib/dygraph-c91c859.min.js \ + lib/dygraph-smooth-plotter-c91c859.js \ + lib/fontawesome-all-5.0.1.min.js \ + lib/gauge-1.3.2.min.js \ + lib/jquery-2.2.4.min.js \ + lib/jquery.easypiechart-97b5824.min.js \ + lib/jquery.peity-3.2.0.min.js \ + lib/jquery.sparkline-2.1.2.min.js \ + lib/lz-string-1.4.4.min.js \ + lib/pako-1.0.6.min.js \ + lib/perfect-scrollbar-0.6.15.min.js \ + lib/tableExport-1.6.0.min.js \ + $(NULL) + +webcssdir = $(webdir)/css +dist_webcss_DATA = \ + css/morris-0.5.1.css \ + css/bootstrap-3.3.7.css \ + css/bootstrap-theme-3.3.7.min.css \ + css/bootstrap-slate-flat-3.3.7.css \ + css/bootstrap-slider-10.0.0.min.css \ + css/bootstrap-toggle-2.2.2.min.css \ + css/c3-0.4.18.min.css \ + $(NULL) + +webfontsdir = $(webdir)/fonts +dist_webfonts_DATA = \ + fonts/glyphicons-halflings-regular.eot \ + fonts/glyphicons-halflings-regular.svg \ + fonts/glyphicons-halflings-regular.ttf \ + fonts/glyphicons-halflings-regular.woff \ + fonts/glyphicons-halflings-regular.woff2 \ + $(NULL) + +webimagesdir = $(webdir)/images +dist_webimages_DATA = \ + images/netdata-logomark.svg \ + images/alert-128-orange.png \ + images/alert-128-red.png \ + images/alert-multi-size-orange.ico \ + images/alert-multi-size-red.ico \ + images/animated.gif \ + images/check-mark-2-128-green.png \ + images/check-mark-2-multi-size-green.ico \ + images/netdata.svg \ + images/post.png \ + images/android-icon-36x36.png \ + images/android-icon-48x48.png \ + images/android-icon-72x72.png \ + images/android-icon-96x96.png \ + images/android-icon-144x144.png \ + images/android-icon-192x192.png \ + images/apple-icon-57x57.png \ + images/apple-icon-60x60.png \ + images/apple-icon-72x72.png \ + images/apple-icon-76x76.png \ + images/apple-icon-114x114.png \ + images/apple-icon-120x120.png \ + images/apple-icon-144x144.png \ + images/apple-icon-152x152.png \ + images/apple-icon-180x180.png \ + images/apple-icon-precomposed.png \ + images/apple-icon.png \ + images/favicon-16x16.png \ + images/favicon-32x32.png \ + images/favicon-96x96.png \ + images/favicon.ico \ + images/ms-icon-70x70.png \ + images/ms-icon-144x144.png \ + images/ms-icon-150x150.png \ + images/ms-icon-310x310.png \ + images/banner-icon-144x144.png \ + $(NULL) + +webwellknowndir = $(webdir)/.well-known +dist_webwellknown_DATA = \ + $(NULL) + +webdntdir = $(webdir)/.well-known/dnt +dist_webdnt_DATA = \ + .well-known/dnt/cookies \ + $(NULL) + +all: all-am + +.SUFFIXES: +$(srcdir)/Makefile.in: @MAINTAINER_MODE_TRUE@ $(srcdir)/Makefile.am $(am__configure_deps) + @for dep in $?; do \ + case '$(am__configure_deps)' in \ + *$$dep*) \ + ( cd $(top_builddir) && $(MAKE) $(AM_MAKEFLAGS) am--refresh ) \ + && { if test -f $@; then exit 0; else break; fi; }; \ + exit 1;; \ + esac; \ + done; \ + echo ' cd $(top_srcdir) && $(AUTOMAKE) --gnu web/gui/Makefile'; \ + $(am__cd) $(top_srcdir) && \ + $(AUTOMAKE) --gnu web/gui/Makefile +Makefile: $(srcdir)/Makefile.in $(top_builddir)/config.status + @case '$?' in \ + *config.status*) \ + cd $(top_builddir) && $(MAKE) $(AM_MAKEFLAGS) am--refresh;; \ + *) \ + echo ' cd $(top_builddir) && $(SHELL) ./config.status $(subdir)/$@ $(am__depfiles_maybe)'; \ + cd $(top_builddir) && $(SHELL) ./config.status $(subdir)/$@ $(am__depfiles_maybe);; \ + esac; + +$(top_builddir)/config.status: $(top_srcdir)/configure $(CONFIG_STATUS_DEPENDENCIES) + cd $(top_builddir) && $(MAKE) $(AM_MAKEFLAGS) am--refresh + +$(top_srcdir)/configure: @MAINTAINER_MODE_TRUE@ $(am__configure_deps) + cd $(top_builddir) && $(MAKE) $(AM_MAKEFLAGS) am--refresh +$(ACLOCAL_M4): @MAINTAINER_MODE_TRUE@ $(am__aclocal_m4_deps) + cd $(top_builddir) && $(MAKE) $(AM_MAKEFLAGS) am--refresh +$(am__aclocal_m4_deps): +install-dist_webDATA: $(dist_web_DATA) + @$(NORMAL_INSTALL) + @list='$(dist_web_DATA)'; test -n "$(webdir)" || list=; \ + if test -n "$$list"; then \ + echo " $(MKDIR_P) '$(DESTDIR)$(webdir)'"; \ + $(MKDIR_P) "$(DESTDIR)$(webdir)" || exit 1; \ + fi; \ + for p in $$list; do \ + if test -f "$$p"; then d=; else d="$(srcdir)/"; fi; \ + echo "$$d$$p"; \ + done | $(am__base_list) | \ + while read files; do \ + echo " $(INSTALL_DATA) $$files '$(DESTDIR)$(webdir)'"; \ + $(INSTALL_DATA) $$files "$(DESTDIR)$(webdir)" || exit $$?; \ + done + +uninstall-dist_webDATA: + @$(NORMAL_UNINSTALL) + @list='$(dist_web_DATA)'; test -n "$(webdir)" || list=; \ + files=`for p in $$list; do echo $$p; done | sed -e 's|^.*/||'`; \ + dir='$(DESTDIR)$(webdir)'; $(am__uninstall_files_from_dir) +install-dist_webcssDATA: $(dist_webcss_DATA) + @$(NORMAL_INSTALL) + @list='$(dist_webcss_DATA)'; test -n "$(webcssdir)" || list=; \ + if test -n "$$list"; then \ + echo " $(MKDIR_P) '$(DESTDIR)$(webcssdir)'"; \ + $(MKDIR_P) "$(DESTDIR)$(webcssdir)" || exit 1; \ + fi; \ + for p in $$list; do \ + if test -f "$$p"; then d=; else d="$(srcdir)/"; fi; \ + echo "$$d$$p"; \ + done | $(am__base_list) | \ + while read files; do \ + echo " $(INSTALL_DATA) $$files '$(DESTDIR)$(webcssdir)'"; \ + $(INSTALL_DATA) $$files "$(DESTDIR)$(webcssdir)" || exit $$?; \ + done + +uninstall-dist_webcssDATA: + @$(NORMAL_UNINSTALL) + @list='$(dist_webcss_DATA)'; test -n "$(webcssdir)" || list=; \ + files=`for p in $$list; do echo $$p; done | sed -e 's|^.*/||'`; \ + dir='$(DESTDIR)$(webcssdir)'; $(am__uninstall_files_from_dir) +install-dist_webdntDATA: $(dist_webdnt_DATA) + @$(NORMAL_INSTALL) + @list='$(dist_webdnt_DATA)'; test -n "$(webdntdir)" || list=; \ + if test -n "$$list"; then \ + echo " $(MKDIR_P) '$(DESTDIR)$(webdntdir)'"; \ + $(MKDIR_P) "$(DESTDIR)$(webdntdir)" || exit 1; \ + fi; \ + for p in $$list; do \ + if test -f "$$p"; then d=; else d="$(srcdir)/"; fi; \ + echo "$$d$$p"; \ + done | $(am__base_list) | \ + while read files; do \ + echo " $(INSTALL_DATA) $$files '$(DESTDIR)$(webdntdir)'"; \ + $(INSTALL_DATA) $$files "$(DESTDIR)$(webdntdir)" || exit $$?; \ + done + +uninstall-dist_webdntDATA: + @$(NORMAL_UNINSTALL) + @list='$(dist_webdnt_DATA)'; test -n "$(webdntdir)" || list=; \ + files=`for p in $$list; do echo $$p; done | sed -e 's|^.*/||'`; \ + dir='$(DESTDIR)$(webdntdir)'; $(am__uninstall_files_from_dir) +install-dist_webfontsDATA: $(dist_webfonts_DATA) + @$(NORMAL_INSTALL) + @list='$(dist_webfonts_DATA)'; test -n "$(webfontsdir)" || list=; \ + if test -n "$$list"; then \ + echo " $(MKDIR_P) '$(DESTDIR)$(webfontsdir)'"; \ + $(MKDIR_P) "$(DESTDIR)$(webfontsdir)" || exit 1; \ + fi; \ + for p in $$list; do \ + if test -f "$$p"; then d=; else d="$(srcdir)/"; fi; \ + echo "$$d$$p"; \ + done | $(am__base_list) | \ + while read files; do \ + echo " $(INSTALL_DATA) $$files '$(DESTDIR)$(webfontsdir)'"; \ + $(INSTALL_DATA) $$files "$(DESTDIR)$(webfontsdir)" || exit $$?; \ + done + +uninstall-dist_webfontsDATA: + @$(NORMAL_UNINSTALL) + @list='$(dist_webfonts_DATA)'; test -n "$(webfontsdir)" || list=; \ + files=`for p in $$list; do echo $$p; done | sed -e 's|^.*/||'`; \ + dir='$(DESTDIR)$(webfontsdir)'; $(am__uninstall_files_from_dir) +install-dist_webimagesDATA: $(dist_webimages_DATA) + @$(NORMAL_INSTALL) + @list='$(dist_webimages_DATA)'; test -n "$(webimagesdir)" || list=; \ + if test -n "$$list"; then \ + echo " $(MKDIR_P) '$(DESTDIR)$(webimagesdir)'"; \ + $(MKDIR_P) "$(DESTDIR)$(webimagesdir)" || exit 1; \ + fi; \ + for p in $$list; do \ + if test -f "$$p"; then d=; else d="$(srcdir)/"; fi; \ + echo "$$d$$p"; \ + done | $(am__base_list) | \ + while read files; do \ + echo " $(INSTALL_DATA) $$files '$(DESTDIR)$(webimagesdir)'"; \ + $(INSTALL_DATA) $$files "$(DESTDIR)$(webimagesdir)" || exit $$?; \ + done + +uninstall-dist_webimagesDATA: + @$(NORMAL_UNINSTALL) + @list='$(dist_webimages_DATA)'; test -n "$(webimagesdir)" || list=; \ + files=`for p in $$list; do echo $$p; done | sed -e 's|^.*/||'`; \ + dir='$(DESTDIR)$(webimagesdir)'; $(am__uninstall_files_from_dir) +install-dist_weblibDATA: $(dist_weblib_DATA) + @$(NORMAL_INSTALL) + @list='$(dist_weblib_DATA)'; test -n "$(weblibdir)" || list=; \ + if test -n "$$list"; then \ + echo " $(MKDIR_P) '$(DESTDIR)$(weblibdir)'"; \ + $(MKDIR_P) "$(DESTDIR)$(weblibdir)" || exit 1; \ + fi; \ + for p in $$list; do \ + if test -f "$$p"; then d=; else d="$(srcdir)/"; fi; \ + echo "$$d$$p"; \ + done | $(am__base_list) | \ + while read files; do \ + echo " $(INSTALL_DATA) $$files '$(DESTDIR)$(weblibdir)'"; \ + $(INSTALL_DATA) $$files "$(DESTDIR)$(weblibdir)" || exit $$?; \ + done + +uninstall-dist_weblibDATA: + @$(NORMAL_UNINSTALL) + @list='$(dist_weblib_DATA)'; test -n "$(weblibdir)" || list=; \ + files=`for p in $$list; do echo $$p; done | sed -e 's|^.*/||'`; \ + dir='$(DESTDIR)$(weblibdir)'; $(am__uninstall_files_from_dir) +install-dist_webstaticDATA: $(dist_webstatic_DATA) + @$(NORMAL_INSTALL) + @list='$(dist_webstatic_DATA)'; test -n "$(webstaticdir)" || list=; \ + if test -n "$$list"; then \ + echo " $(MKDIR_P) '$(DESTDIR)$(webstaticdir)'"; \ + $(MKDIR_P) "$(DESTDIR)$(webstaticdir)" || exit 1; \ + fi; \ + for p in $$list; do \ + if test -f "$$p"; then d=; else d="$(srcdir)/"; fi; \ + echo "$$d$$p"; \ + done | $(am__base_list) | \ + while read files; do \ + echo " $(INSTALL_DATA) $$files '$(DESTDIR)$(webstaticdir)'"; \ + $(INSTALL_DATA) $$files "$(DESTDIR)$(webstaticdir)" || exit $$?; \ + done + +uninstall-dist_webstaticDATA: + @$(NORMAL_UNINSTALL) + @list='$(dist_webstatic_DATA)'; test -n "$(webstaticdir)" || list=; \ + files=`for p in $$list; do echo $$p; done | sed -e 's|^.*/||'`; \ + dir='$(DESTDIR)$(webstaticdir)'; $(am__uninstall_files_from_dir) +install-dist_webwellknownDATA: $(dist_webwellknown_DATA) + @$(NORMAL_INSTALL) + @list='$(dist_webwellknown_DATA)'; test -n "$(webwellknowndir)" || list=; \ + if test -n "$$list"; then \ + echo " $(MKDIR_P) '$(DESTDIR)$(webwellknowndir)'"; \ + $(MKDIR_P) "$(DESTDIR)$(webwellknowndir)" || exit 1; \ + fi; \ + for p in $$list; do \ + if test -f "$$p"; then d=; else d="$(srcdir)/"; fi; \ + echo "$$d$$p"; \ + done | $(am__base_list) | \ + while read files; do \ + echo " $(INSTALL_DATA) $$files '$(DESTDIR)$(webwellknowndir)'"; \ + $(INSTALL_DATA) $$files "$(DESTDIR)$(webwellknowndir)" || exit $$?; \ + done + +uninstall-dist_webwellknownDATA: + @$(NORMAL_UNINSTALL) + @list='$(dist_webwellknown_DATA)'; test -n "$(webwellknowndir)" || list=; \ + files=`for p in $$list; do echo $$p; done | sed -e 's|^.*/||'`; \ + dir='$(DESTDIR)$(webwellknowndir)'; $(am__uninstall_files_from_dir) +tags TAGS: + +ctags CTAGS: + +cscope cscopelist: + + +distdir: $(DISTFILES) + @srcdirstrip=`echo "$(srcdir)" | sed 's/[].[^$$\\*]/\\\\&/g'`; \ + topsrcdirstrip=`echo "$(top_srcdir)" | sed 's/[].[^$$\\*]/\\\\&/g'`; \ + list='$(DISTFILES)'; \ + dist_files=`for file in $$list; do echo $$file; done | \ + sed -e "s|^$$srcdirstrip/||;t" \ + -e "s|^$$topsrcdirstrip/|$(top_builddir)/|;t"`; \ + case $$dist_files in \ + */*) $(MKDIR_P) `echo "$$dist_files" | \ + sed '/\//!d;s|^|$(distdir)/|;s,/[^/]*$$,,' | \ + sort -u` ;; \ + esac; \ + for file in $$dist_files; do \ + if test -f $$file || test -d $$file; then d=.; else d=$(srcdir); fi; \ + if test -d $$d/$$file; then \ + dir=`echo "/$$file" | sed -e 's,/[^/]*$$,,'`; \ + if test -d "$(distdir)/$$file"; then \ + find "$(distdir)/$$file" -type d ! -perm -700 -exec chmod u+rwx {} \;; \ + fi; \ + if test -d $(srcdir)/$$file && test $$d != $(srcdir); then \ + cp -fpR $(srcdir)/$$file "$(distdir)$$dir" || exit 1; \ + find "$(distdir)/$$file" -type d ! -perm -700 -exec chmod u+rwx {} \;; \ + fi; \ + cp -fpR $$d/$$file "$(distdir)$$dir" || exit 1; \ + else \ + test -f "$(distdir)/$$file" \ + || cp -p $$d/$$file "$(distdir)/$$file" \ + || exit 1; \ + fi; \ + done +check-am: all-am +check: check-am +all-am: Makefile $(DATA) +installdirs: + for dir in "$(DESTDIR)$(webdir)" "$(DESTDIR)$(webcssdir)" "$(DESTDIR)$(webdntdir)" "$(DESTDIR)$(webfontsdir)" "$(DESTDIR)$(webimagesdir)" "$(DESTDIR)$(weblibdir)" "$(DESTDIR)$(webstaticdir)" "$(DESTDIR)$(webwellknowndir)"; do \ + test -z "$$dir" || $(MKDIR_P) "$$dir"; \ + done +install: install-am +install-exec: install-exec-am +install-data: install-data-am +uninstall: uninstall-am + +install-am: all-am + @$(MAKE) $(AM_MAKEFLAGS) install-exec-am install-data-am + +installcheck: installcheck-am +install-strip: + if test -z '$(STRIP)'; then \ + $(MAKE) $(AM_MAKEFLAGS) INSTALL_PROGRAM="$(INSTALL_STRIP_PROGRAM)" \ + install_sh_PROGRAM="$(INSTALL_STRIP_PROGRAM)" INSTALL_STRIP_FLAG=-s \ + install; \ + else \ + $(MAKE) $(AM_MAKEFLAGS) INSTALL_PROGRAM="$(INSTALL_STRIP_PROGRAM)" \ + install_sh_PROGRAM="$(INSTALL_STRIP_PROGRAM)" INSTALL_STRIP_FLAG=-s \ + "INSTALL_PROGRAM_ENV=STRIPPROG='$(STRIP)'" install; \ + fi +mostlyclean-generic: + +clean-generic: + -test -z "$(CLEANFILES)" || rm -f $(CLEANFILES) + +distclean-generic: + -test -z "$(CONFIG_CLEAN_FILES)" || rm -f $(CONFIG_CLEAN_FILES) + -test . = "$(srcdir)" || test -z "$(CONFIG_CLEAN_VPATH_FILES)" || rm -f $(CONFIG_CLEAN_VPATH_FILES) + +maintainer-clean-generic: + @echo "This command is intended for maintainers to use" + @echo "it deletes files that may require special tools to rebuild." + -test -z "$(MAINTAINERCLEANFILES)" || rm -f $(MAINTAINERCLEANFILES) +clean: clean-am + +clean-am: clean-generic mostlyclean-am + +distclean: distclean-am + -rm -f Makefile +distclean-am: clean-am distclean-generic + +dvi: dvi-am + +dvi-am: + +html: html-am + +html-am: + +info: info-am + +info-am: + +install-data-am: install-dist_webDATA install-dist_webcssDATA \ + install-dist_webdntDATA install-dist_webfontsDATA \ + install-dist_webimagesDATA install-dist_weblibDATA \ + install-dist_webstaticDATA install-dist_webwellknownDATA + +install-dvi: install-dvi-am + +install-dvi-am: + +install-exec-am: + +install-html: install-html-am + +install-html-am: + +install-info: install-info-am + +install-info-am: + +install-man: + +install-pdf: install-pdf-am + +install-pdf-am: + +install-ps: install-ps-am + +install-ps-am: + +installcheck-am: + +maintainer-clean: maintainer-clean-am + -rm -f Makefile +maintainer-clean-am: distclean-am maintainer-clean-generic + +mostlyclean: mostlyclean-am + +mostlyclean-am: mostlyclean-generic + +pdf: pdf-am + +pdf-am: + +ps: ps-am + +ps-am: + +uninstall-am: uninstall-dist_webDATA uninstall-dist_webcssDATA \ + uninstall-dist_webdntDATA uninstall-dist_webfontsDATA \ + uninstall-dist_webimagesDATA uninstall-dist_weblibDATA \ + uninstall-dist_webstaticDATA uninstall-dist_webwellknownDATA + +.MAKE: install-am install-strip + +.PHONY: all all-am check check-am clean clean-generic cscopelist-am \ + ctags-am distclean distclean-generic distdir dvi dvi-am html \ + html-am info info-am install install-am install-data \ + install-data-am install-dist_webDATA install-dist_webcssDATA \ + install-dist_webdntDATA install-dist_webfontsDATA \ + install-dist_webimagesDATA install-dist_weblibDATA \ + install-dist_webstaticDATA install-dist_webwellknownDATA \ + install-dvi install-dvi-am install-exec install-exec-am \ + install-html install-html-am install-info install-info-am \ + install-man install-pdf install-pdf-am install-ps \ + install-ps-am install-strip installcheck installcheck-am \ + installdirs maintainer-clean maintainer-clean-generic \ + mostlyclean mostlyclean-generic pdf pdf-am ps ps-am tags-am \ + uninstall uninstall-am uninstall-dist_webDATA \ + uninstall-dist_webcssDATA uninstall-dist_webdntDATA \ + uninstall-dist_webfontsDATA uninstall-dist_webimagesDATA \ + uninstall-dist_weblibDATA uninstall-dist_webstaticDATA \ + uninstall-dist_webwellknownDATA + +.PRECIOUS: Makefile + + +dashboard.js: $(DASHBOARD_JS_FILES) + if test -f $@; then rm -f $@; fi + cat $(DASHBOARD_JS_FILES) > $@.tmp && mv $@.tmp $@ + +version.txt: + if test -d "$(top_srcdir)/.git"; then \ + git --git-dir="$(top_srcdir)/.git" log -n 1 --format=%H; \ + fi > $@.tmp + test -s $@.tmp || echo 0 > $@.tmp + mv $@.tmp $@ + +# regenerate these files, even if they are up to date +.PHONY: version.txt dashboard.js + +# Tell versions [3.59,3.63) of GNU make to not export all variables. +# Otherwise a system limit (for SysV at least) may be exceeded. +.NOEXPORT: diff --git a/web/gui/README.md b/web/gui/README.md index 9be9ffc9c..26ef59bc5 100644 --- a/web/gui/README.md +++ b/web/gui/README.md @@ -17,15 +17,15 @@ For information on creating custom dashboards, see **[Custom Dashboards](custom/ ## Supported chart libraries -- Dygraph -- jQuery Sparkline -- Peity -- Google Charts -- Morris -- EasyPieChart -- Gauge.js -- D3 -- C3 +- Dygraph +- jQuery Sparkline +- Peity +- Google Charts +- Morris +- EasyPieChart +- Gauge.js +- D3 +- C3 ### Dygraph @@ -46,20 +46,25 @@ TBD #### Value Range You can set the max value of the chart using the following snippet: + ```html <div data-netdata="unique.id" data-chart-library="easypiechart" data-easypiechart-max-value="40" ></div> ``` + Be aware that values that exceed the max value will get expanded (e.g. "41" is still 100%). Similar for the minimum: + ```html <div data-netdata="unique.id" data-chart-library="easypiechart" data-easypiechart-min-value="20" ></div> ``` + If you specify both minimum and maximum, the rendering behavior changes. Instead of displaying the `value` based from zero, it is now based on the range that is provided by the snippet: + ```html <div data-netdata="unique.id" data-chart-library="easypiechart" @@ -67,24 +72,28 @@ If you specify both minimum and maximum, the rendering behavior changes. Instead data-easypiechart-max-value="40" ></div> ``` -In the first example, a value of `30`, without specifying the minimum, fills the chart bar to `75%` (100% / 40 * 30). However, in this example the range is now `20` (40 - 20 = 20). The value `30` will fill the chart to **`50%`**, since it's in the middle between 20 and 40. + +In the first example, a value of `30`, without specifying the minimum, fills the chart bar to `75%` (100% / 40 \* 30). However, in this example the range is now `20` (40 - 20 = 20). The value `30` will fill the chart to **`50%`**, since it's in the middle between 20 and 40. This szenario is useful if you have metrics that change only within a specific range, e.g. temperatures that are very unlikely to fall out of range. In these cases it is more useful to have the chart render the values between the given min and max, to better highlight the changes within them. #### Negative Values EasyPieCharts can render negative values with the following flag: + ```html <div data-netdata="unique.id" data-chart-library="easypiechart" data-override-options="signed" ></div> ``` + Negative values are rendered counter-clockwise. #### Full example This is a chart that displays the hotwater temperature in the given range of 40 to 50. + ```html <div data-netdata="stiebeleltron_system.hotwater.hotwatertemp" data-title="Hot Water Temperature" @@ -103,6 +112,7 @@ This is a chart that displays the hotwater temperature in the given range of 40 data-common-min="netdata-hotwater-min" ></div> ``` +  -[]() +[](<>) diff --git a/web/gui/browserconfig.xml b/web/gui/browserconfig.xml deleted file mode 100644 index 32f47595e..000000000 --- a/web/gui/browserconfig.xml +++ /dev/null @@ -1,2 +0,0 @@ -<?xml version="1.0" encoding="utf-8"?> -<browserconfig><msapplication><tile><square70x70logo src="images/ms-icon-70x70.png"/><square150x150logo src="images/ms-icon-150x150.png"/><square310x310logo src="images/ms-icon-310x310.png"/><TileColor>#ffffff</TileColor></tile></msapplication></browserconfig> diff --git a/web/gui/confluence/README.md b/web/gui/confluence/README.md index 3d7eda6a1..221948357 100644 --- a/web/gui/confluence/README.md +++ b/web/gui/confluence/README.md @@ -1,20 +1,20 @@ # Atlassian Confluence dashboards -With netdata you can build **live, interactive, monitoring dashboards** directly on Atlassian's **Confluence** pages. +With Netdata you can build **live, interactive, monitoring dashboards** directly on Atlassian's **Confluence** pages. I see you already asking "why should I do this?" Well... think a bit of it.... confluence is the perfect place for something like that: -1. All the employees of your company already have access to it. +1. All the employees of your company already have access to it. -2. Most probably you have already several spaces on confluence, one for each project or service. Adding live monitoring information there is ideal: everything in one place. Your users will just click on the page and instantly the monitoring page they need will appear with only the information they need to know. +2. Most probably you have already several spaces on confluence, one for each project or service. Adding live monitoring information there is ideal: everything in one place. Your users will just click on the page and instantly the monitoring page they need will appear with only the information they need to know. -3. You can create monitoring pages for very specific purposes, hiding all the information that is too detailed for most users, or explaining in detail things that are difficult for them to understand. +3. You can create monitoring pages for very specific purposes, hiding all the information that is too detailed for most users, or explaining in detail things that are difficult for them to understand. -So, what can we expect? What can netdata do on confluence? +So, what can we expect? What can Netdata do on confluence? -You will be surprised! **Everything a netdata dashboard does!**. Example: +You will be surprised! **Everything a Netdata dashboard does!**. Example:  @@ -24,16 +24,16 @@ Let me show you how. ### Before you begin -Most likely your confluence is accessible via HTTPS. So, you need to proxy your netdata servers via an apache or nginx to make them HTTPS too. If your Confluence is HTTPS but your netdata are not, you will not be able to fetch the netdata content from the confluence page. The netdata wiki has many examples for proxying netdata through another web server. +Most likely your confluence is accessible via HTTPS. So, you need to proxy your Netdata servers via an apache or nginx to make them HTTPS too. If your Confluence is HTTPS but your Netdata are not, you will not be able to fetch the Netdata content from the confluence page. The Netdata wiki has many examples for proxying Netdata through another web server. -> So, make sure netdata and confluence can be accessed with the same protocol (**http**, or **https**). +> So, make sure Netdata and Confluence can be accessed with the same protocol (**http**, or **https**). For our example, I will use these 2 servers: -server|url -----|---- -Server 1 | https://london.my-netdata.io -Server 2 | https://frankfurt.my-netdata.io +| server | url | +|------|---| +| Server 1 | <https://london.my-netdata.io> | +| Server 2 | <https://frankfurt.my-netdata.io> | I will use the first server for the static dashboard javascript files. @@ -41,7 +41,7 @@ I will use the first server for the static dashboard javascript files. Then, you need to enable the `html` plugin of confluence. We will add some plain html content on that page, and this plugin is required. -### Create a new page +### Create a new page Create a new confluence page and paste this into an `html` box: @@ -64,7 +64,7 @@ like this (type `{html` for the html box to appear - you need the confluence htm ### Add a few badges -Then, go to your netdata and copy an alarm badge (the `<embed>` version of it): +Then, go to your Netdata and copy an alarm badge (the `<embed>` version of it): 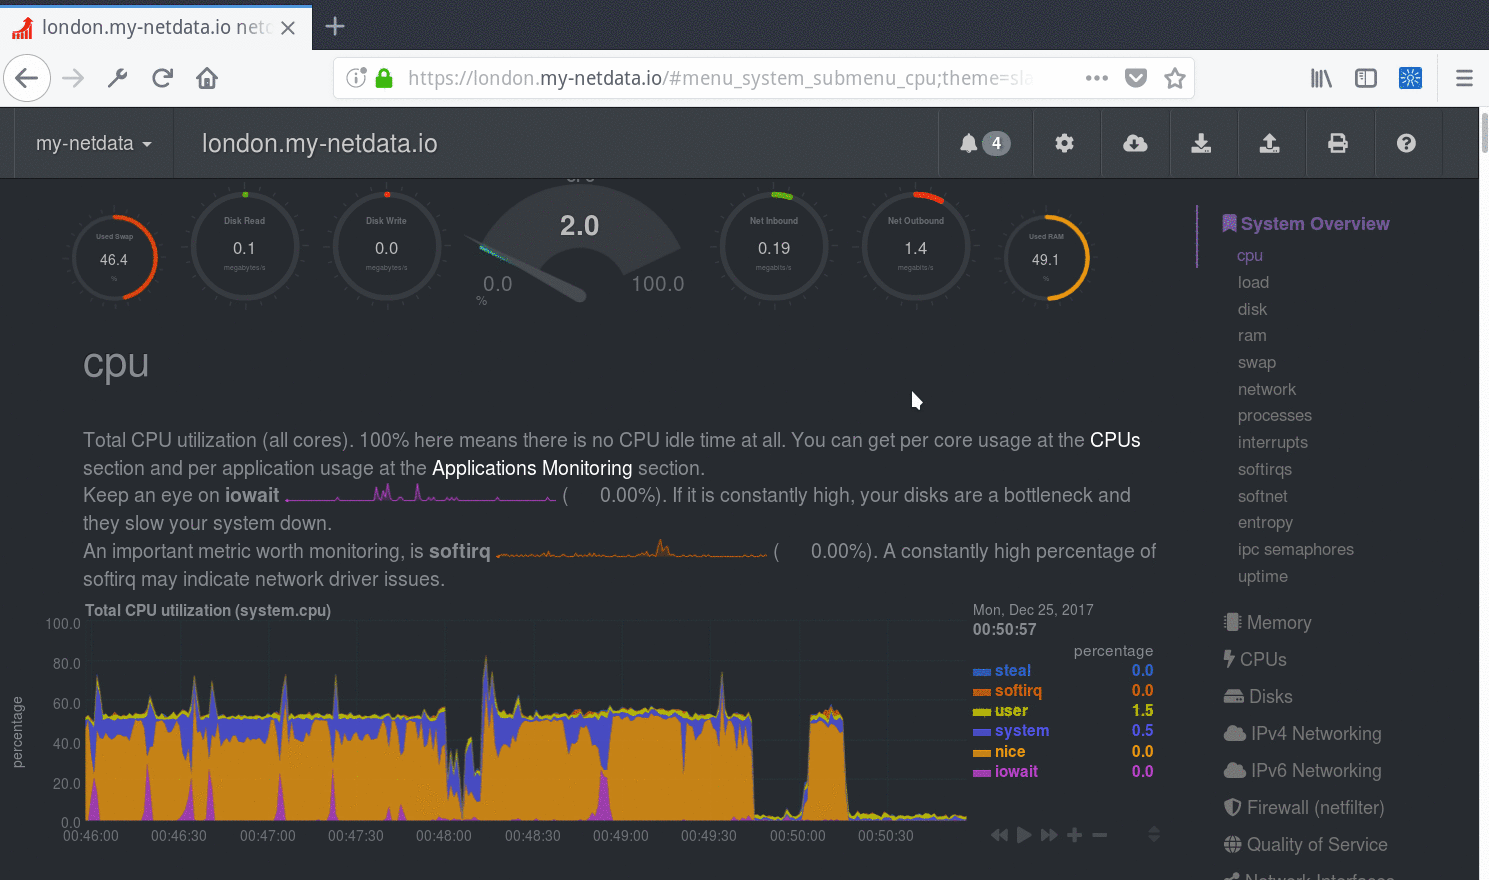 @@ -78,7 +78,7 @@ Hit **update** and you will get this: This badge is now auto-refreshing. It will update itself based on the update frequency of the alarm. -> Keep in mind you can add badges with custom netdata queries too. netdata automatically creates badges for all the alarms, but every chart, every dimension on every chart, can be used for a badge. And netdata badges are quite powerful! Check [Creating Badges](../../api/badges/) for more information on badges. +> Keep in mind you can add badges with custom Netdata queries too. Netdata automatically creates badges for all the alarms, but every chart, every dimension on every chart, can be used for a badge. And Netdata badges are quite powerful! Check [Creating Badges](../../api/badges/) for more information on badges. So, let's create a table and add this badge for both our web servers: @@ -88,7 +88,7 @@ Now we get this:  -### Add a netdata chart +### Add a Netdata chart The simplest form of a chart is this (it adds the chart `web_log_nginx_netdata.response_statuses`, using 100% of the width, 150px height, and the last 10 minutes of data): @@ -110,7 +110,7 @@ And you will get this: 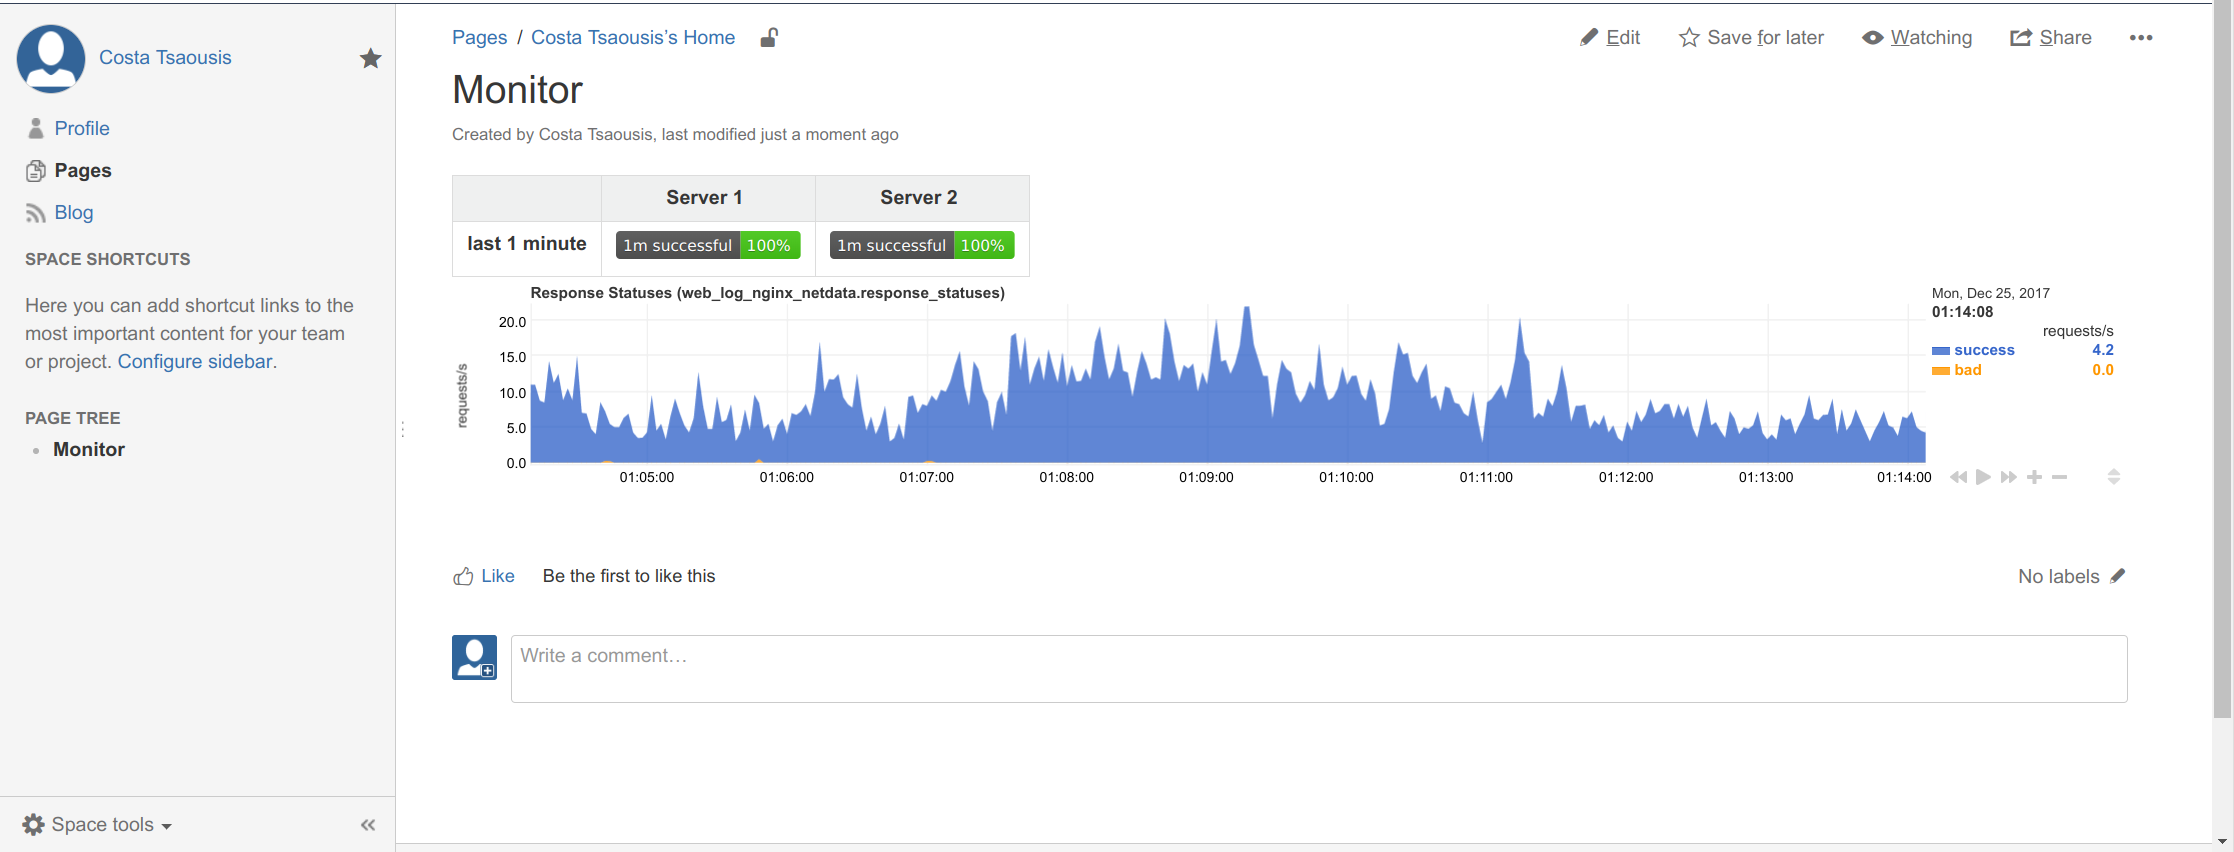 -> This chart is **alive**, fully interactive. You can drag it, pan it, zoom it, etc like you do on netdata dashboards! +> This chart is **alive**, fully interactive. You can drag it, pan it, zoom it, etc like you do on Netdata dashboards! Of course this too big. We need something smaller to add inside the table. Let's try this: @@ -128,7 +128,7 @@ Of course this too big. We need something smaller to add inside the table. Let's ></div> ``` -The chart name is shown on all netdata charts, so just copy it from a netdata dashboard. +The chart name is shown on all Netdata charts, so just copy it from a Netdata dashboard. We will fetch the same chart from both servers. To define the server we also added `data-host=` with the URL of each server, like this (we also added `<br/>` for a newline between the badge and the chart): @@ -138,8 +138,7 @@ Which gives us this: 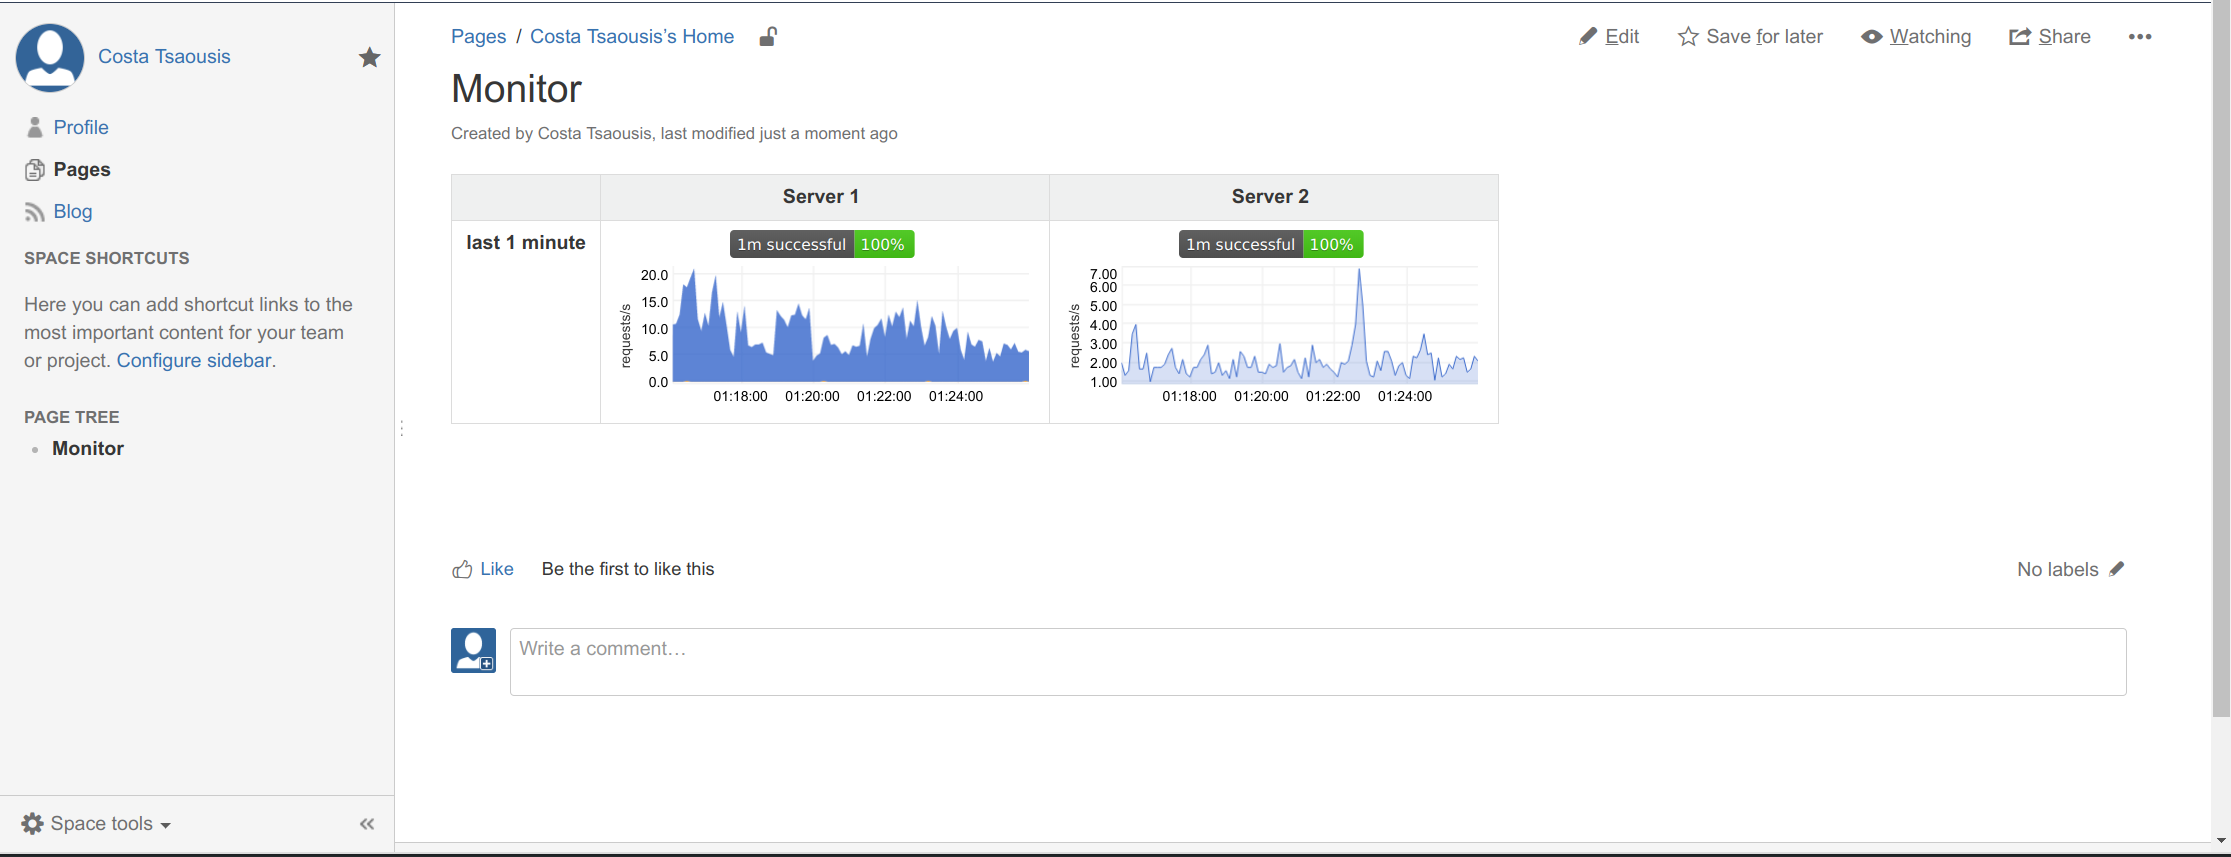 -Note the color difference. This is because netdata automatically hides dimensions that are just zero (the frankfurt server has only successful requests). To instruct netdata to disable this feature, we need to add another html fragment at the bottom of the page (make sure this is added after loading `dashboard.js`). So we edit the first block we added, and append a new `<script>` section to it: - +Note the color difference. This is because Netdata automatically hides dimensions that are just zero (the frankfurt server has only successful requests). To instruct Netdata to disable this feature, we need to add another html fragment at the bottom of the page (make sure this is added after loading `dashboard.js`). So we edit the first block we added, and append a new `<script>` section to it: ```html <script> @@ -165,7 +164,7 @@ Now they match: #### more options -If you want to change the colors append `data-colors="#001122 #334455 #667788"`. The colors will be used for the dimensions top to bottom, as shown on a netdata dashboard. Keep in mind the default netdata dashboards hide by default all dimensions that are just zero, so enable them at the dashboard settings to see them all. +If you want to change the colors append `data-colors="#001122 #334455 #667788"`. The colors will be used for the dimensions top to bottom, as shown on a Netdata dashboard. Keep in mind the default Netdata dashboards hide by default all dimensions that are just zero, so enable them at the dashboard settings to see them all. You can get a percentage chart, by adding these on these charts: @@ -177,7 +176,7 @@ You can get a percentage chart, by adding these on these charts: data-units="%" ``` -The first line instructs netdata to calculate the percentage of each dimension, the second strips any fractional digits, the third instructs the charting library to size the chart from 0 to 100, the next one instructs it to include 0 in the chart and the last changes the units of the chart to `%`. This is how it will look: +The first line instructs Netdata to calculate the percentage of each dimension, the second strips any fractional digits, the third instructs the charting library to size the chart from 0 to 100, the next one instructs it to include 0 in the chart and the last changes the units of the chart to `%`. This is how it will look: 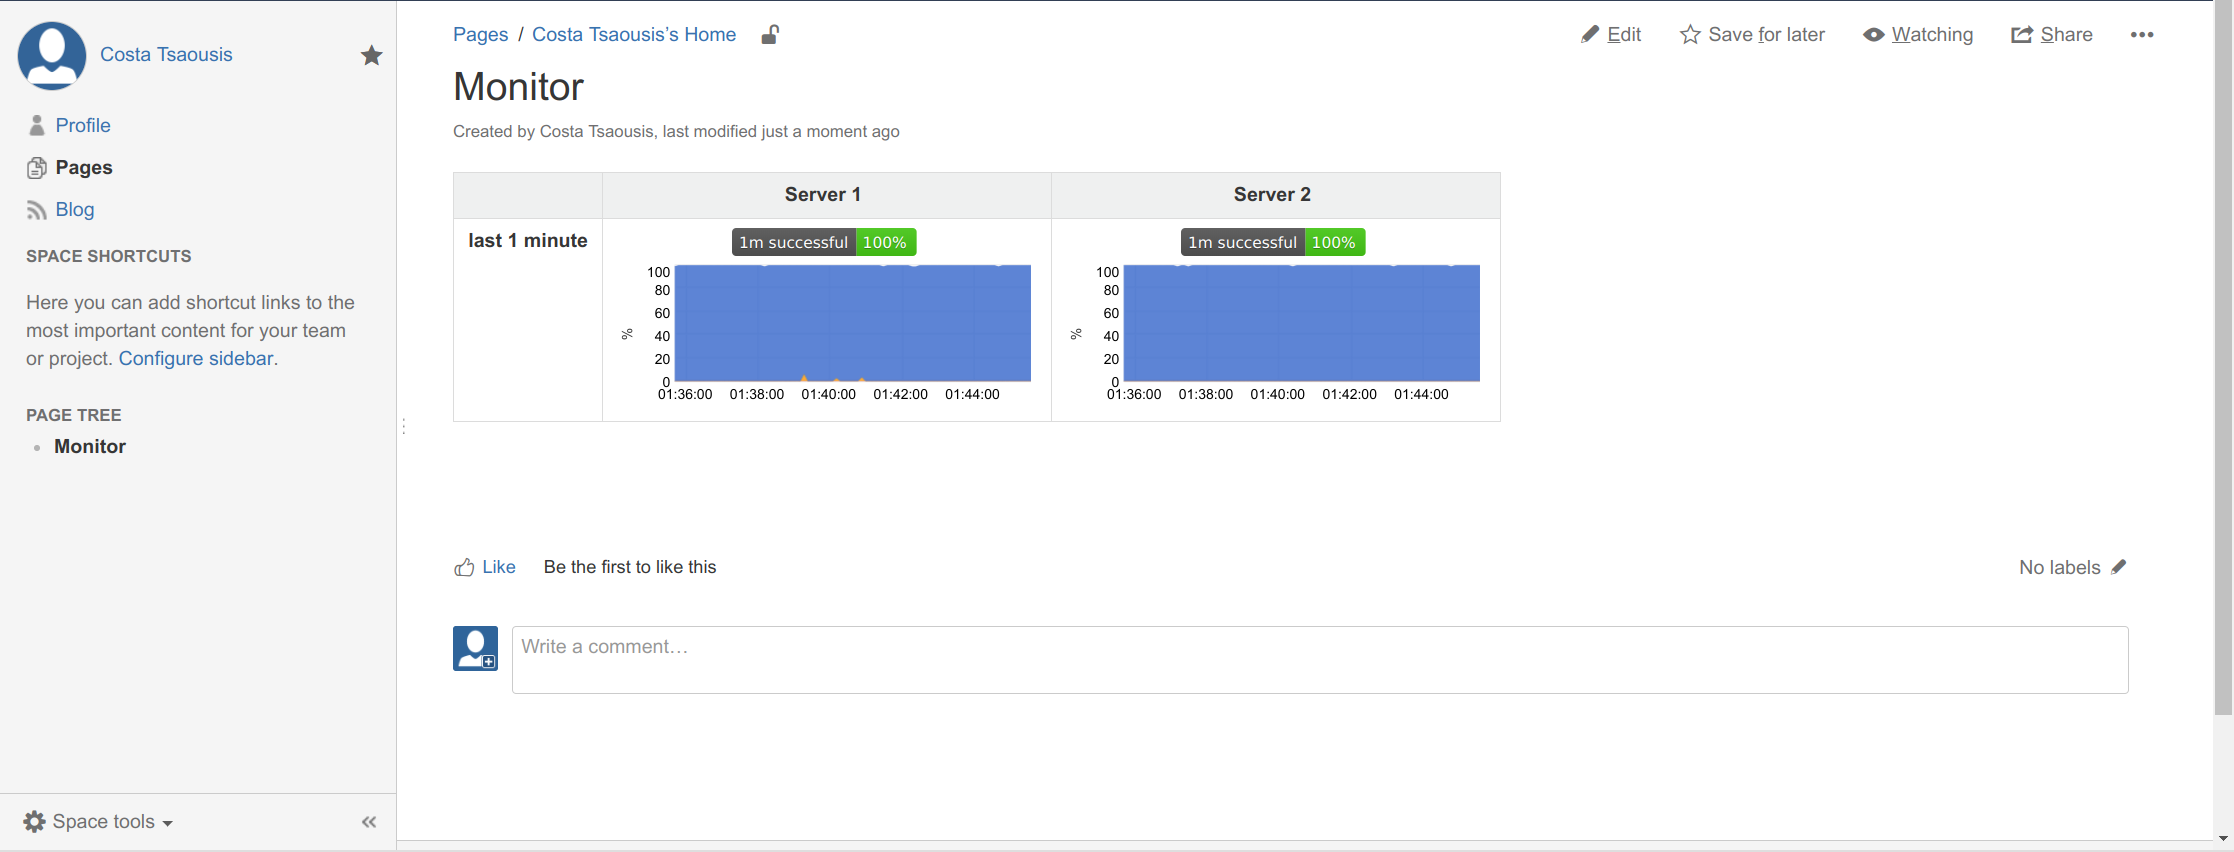 @@ -189,8 +188,8 @@ Let's now add a few gauges. The chart we added has several dimensions: `success` Let's say we want to add 2 gauges: -1. `success` and `redirect` together, in blue -2. `error`, `bad` and `other` together, in orange +1. `success` and `redirect` together, in blue +2. `error`, `bad` and `other` together, in orange We will add the following for each server. We have enclosed them in another a `<div>` because Confluence will wrap them if the page width is not enough to fit them. With that additional `<div>` they will always be next to each other. @@ -234,7 +233,6 @@ Adding the above will give you this: 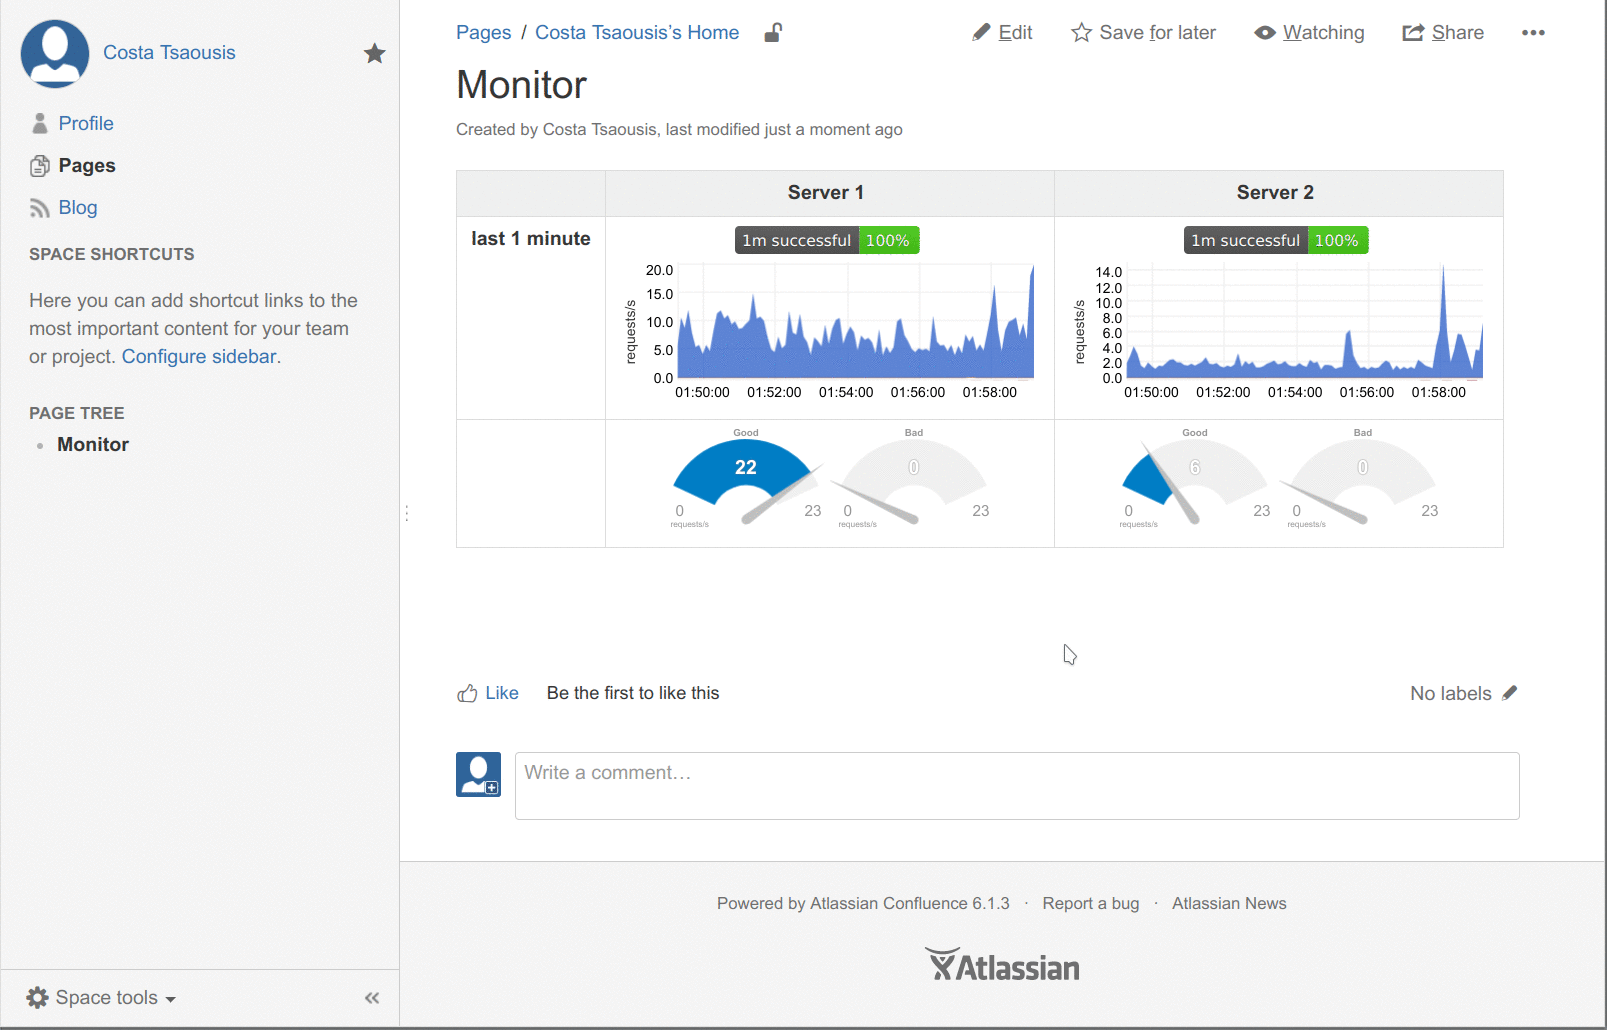 - ### Final source - for the confluence source editor If you enable the source editor of Confluence, you can paste the whole example (implementing the first image on this post and demonstrating everything discussed on this page): @@ -1011,4 +1009,4 @@ NETDATA.options.current.eliminate_zero_dimensions = false; </div> ``` -[]() +[](<>) diff --git a/web/gui/custom/README.md b/web/gui/custom/README.md index f9ffd2550..68d8bbb56 100644 --- a/web/gui/custom/README.md +++ b/web/gui/custom/README.md @@ -2,12 +2,12 @@ You can: -- create your own dashboards using simple HTML (no javascript is required for basic dashboards) -- utilizing any or all of the available chart libraries, on the same dashboard -- using data from one or more netdata servers, on the same dashboard -- host your dashboard HTML page on any web server, anywhere +- create your own dashboards using simple HTML (no javascript is required for basic dashboards) +- utilizing any or all of the available chart libraries, on the same dashboard +- using data from one or more Netdata servers, on the same dashboard +- host your dashboard HTML page on any web server, anywhere -netdata charts can also be added to existing web pages. +Netdata charts can also be added to existing web pages. Check this **[very simple working example of a custom dashboard](http://netdata.firehol.org/demo.html)**, and its **[html source](../demo.html)**. @@ -17,11 +17,10 @@ If you plan to put the dashboard on TV, check **[tv.html](../tv.html)**. This is  -- - ## Web directory -All of the mentioned examples are available on your local netdata installation (e.g. `http://myhost:19999/dashboard.html`). The default web root directory with the HTML and JS code is `/usr/share/netdata/web`. The main dashboard is also in that directory and called `index.html`. +All of the mentioned examples are available on your local Netdata installation (e.g. `http://myhost:19999/dashboard.html`). The default web root directory with the HTML and JS code is `/usr/share/netdata/web`. The main dashboard is also in that directory and called `index.html`.\ Note: index.html has a different syntax. Don't use it as a template for simple custom dashboards. ## Example empty dashboard @@ -52,12 +51,11 @@ If you need to create a new dashboard on an empty page, we suggest the following </html> ``` - ## dashboard.js -To add netdata charts to any web page (dedicated to netdata or not), you need to include the `/dashboard.js` file of a netdata server. +To add Netdata charts to any web page (dedicated to Netdata or not), you need to include the `/dashboard.js` file of a Netdata server. -For example, if your netdata server listens at `http://box:19999/`, you will need to add the following to the `head` section of your web page: +For example, if your Netdata server listens at `http://box:19999/`, you will need to add the following to the `head` section of your web page: ```html <script type="text/javascript" src="http://box:19999/dashboard.js"></script> @@ -67,23 +65,23 @@ For example, if your netdata server listens at `http://box:19999/`, you will nee `dashboard.js` will automatically load the following: -1. `dashboard.css`, required for the netdata charts +1. `dashboard.css`, required for the Netdata charts -2. `jquery.min.js`, (only if jquery is not already loaded for this web page) +2. `jquery.min.js`, (only if jquery is not already loaded for this web page) -3. `bootstrap.min.js` (only if bootstrap is not already loaded) and `bootstrap.min.css`. +3. `bootstrap.min.js` (only if bootstrap is not already loaded) and `bootstrap.min.css`. - You can disable this by adding the following before loading `dashboard.js`: + You can disable this by adding the following before loading `dashboard.js`: ```html <script>var netdataNoBootstrap = true;</script> ``` -4. `jquery.nanoscroller.min.js`, required for the scrollbar of the chart legends. +4. `jquery.nanoscroller.min.js`, required for the scrollbar of the chart legends. -5. `bootstrap-toggle.min.js` and `bootstrap-toggle.min.css`, required for the settings toggle buttons. +5. `bootstrap-toggle.min.js` and `bootstrap-toggle.min.css`, required for the settings toggle buttons. -6. `font-awesome.min.css`, for icons. +6. `font-awesome.min.css`, for icons. When `dashboard.js` loads will scan the page for elements that define charts (see below) and immediately start refreshing them. Keep in mind more javascript modules may be loaded (every chart library is a different javascript file, that is loaded on first use). @@ -117,11 +115,11 @@ NETDATA.pause(function() { }); ``` -### The default netdata server +### The default Netdata server -`dashboard.js` will attempt to auto-detect the URL of the netdata server it is loaded from, and set this server as the default netdata server for all charts. +`dashboard.js` will attempt to auto-detect the URL of the Netdata server it is loaded from, and set this server as the default Netdata server for all charts. -If you need to set any other URL as the default netdata server for all charts that do not specify a netdata server, add this before loading `dashboard.js`: +If you need to set any other URL as the default Netdata server for all charts that do not specify a Netdata server, add this before loading `dashboard.js`: ```html <script type="text/javascript">var netdataServer = "http://your.netdata.server:19999";</script> @@ -129,13 +127,13 @@ If you need to set any other URL as the default netdata server for all charts th --- -# Adding charts +## Adding charts To add charts, you need to add a `div` for each of them. Each of these `div` elements accept a few `data-` attributes: ### The chart unique ID -The unique ID of a chart is shown at the title of the chart of the default netdata dashboard. You can also find all the charts available at your netdata server with this URL: `http://your.netdata.server:19999/api/v1/charts` ([example](http://netdata.firehol.org/api/v1/charts)). +The unique ID of a chart is shown at the title of the chart of the default Netdata dashboard. You can also find all the charts available at your Netdata server with this URL: `http://your.netdata.server:19999/api/v1/charts` ([example](http://netdata.firehol.org/api/v1/charts)). To specify the unique id, use this: @@ -160,9 +158,9 @@ You can specify the duration of the chart (how much time of data it will show) u The can be either: -- **absolute** unix timestamps (in javascript terms, they are `new Date().getTime() / 1000`. Using absolute timestamps you can have a chart showing always the same time-frame. +- **absolute** unix timestamps (in javascript terms, they are `new Date().getTime() / 1000`. Using absolute timestamps you can have a chart showing always the same time-frame. -- **relative** number of seconds to now. To show the last 10 minutes of data, `AFTER_SECONDS` must be `-600` (relative to now) and `BEFORE_SECONDS` must be `0` (meaning: now). If you want the chart to auto-refresh the current values, you need to specify **relative** values. +- **relative** number of seconds to now. To show the last 10 minutes of data, `AFTER_SECONDS` must be `-600` (relative to now) and `BEFORE_SECONDS` must be `0` (meaning: now). If you want the chart to auto-refresh the current values, you need to specify **relative** values. ### Chart sizes @@ -182,7 +180,7 @@ If you want `dashboard.js` to remember permanently (browser local storage) the d ### Netdata server -Each chart can get data from a different netdata server. You can give per chart the netdata server using: +Each chart can get data from a different Netdata server. You can give per chart the Netdata server using: ```html <div data-netdata="unique.id" @@ -197,6 +195,7 @@ If you have ephemeral monitoring setup ([More info here](../../../streaming/#mon data-host="http://yournetdata.server:19999/host/reported-hostname" ></div> ``` + ### Chart library The default chart library is `dygraph`. You set a different chart library per chart using this: @@ -209,21 +208,20 @@ The default chart library is `dygraph`. You set a different chart library per ch Each chart library may support more chart-library specific settings. Please refer to the documentation of the chart library you are interested, in this wiki or the source code: -- options `data-dygraph-XXX` [here](https://github.com/netdata/netdata/blob/643cfe20a8d8beba0ed31ec6afaade80853fd310/web/dashboard.js#L6251-L6361) -- options `data-easypiechart-XXX` [here](https://github.com/netdata/netdata/blob/643cfe20a8d8beba0ed31ec6afaade80853fd310/web/dashboard.js#L7954-L7966) -- options `data-gauge-XXX` [here](https://github.com/netdata/netdata/blob/643cfe20a8d8beba0ed31ec6afaade80853fd310/web/dashboard.js#L8182-L8189) -- options `data-d3pie-XXX` [here](https://github.com/netdata/netdata/blob/643cfe20a8d8beba0ed31ec6afaade80853fd310/web/dashboard.js#L7394-L7561) -- options `data-sparkline-XXX` [here](https://github.com/netdata/netdata/blob/643cfe20a8d8beba0ed31ec6afaade80853fd310/web/dashboard.js#L5940-L5985) -- options `data-peity-XXX` [here](https://github.com/netdata/netdata/blob/643cfe20a8d8beba0ed31ec6afaade80853fd310/web/dashboard.js#L5892) - +- options `data-dygraph-XXX` [here](https://github.com/netdata/netdata/blob/643cfe20a8d8beba0ed31ec6afaade80853fd310/web/dashboard.js#L6251-L6361) +- options `data-easypiechart-XXX` [here](https://github.com/netdata/netdata/blob/643cfe20a8d8beba0ed31ec6afaade80853fd310/web/dashboard.js#L7954-L7966) +- options `data-gauge-XXX` [here](https://github.com/netdata/netdata/blob/643cfe20a8d8beba0ed31ec6afaade80853fd310/web/dashboard.js#L8182-L8189) +- options `data-d3pie-XXX` [here](https://github.com/netdata/netdata/blob/643cfe20a8d8beba0ed31ec6afaade80853fd310/web/dashboard.js#L7394-L7561) +- options `data-sparkline-XXX` [here](https://github.com/netdata/netdata/blob/643cfe20a8d8beba0ed31ec6afaade80853fd310/web/dashboard.js#L5940-L5985) +- options `data-peity-XXX` [here](https://github.com/netdata/netdata/blob/643cfe20a8d8beba0ed31ec6afaade80853fd310/web/dashboard.js#L5892) ### Data points For the time-frame requested, `dashboard.js` will use the chart dimensions and the settings of the chart library to find out how many data points it can show. -For example, most line chart libraries are using 3 pixels per data point. If the chart shows 10 minutes of data (600 seconds), its update frequency is 1 second, and the chart width is 1800 pixels, then `dashboard.js` will request from the netdata server: 10 minutes of data, represented in 600 points, and the chart will be refreshed per second. If the user resizes the window so that the chart becomes 600 pixels wide, then `dashboard.js` will request the same 10 minutes of data, represented in 200 points and the chart will be refreshed once every 3 seconds. +For example, most line chart libraries are using 3 pixels per data point. If the chart shows 10 minutes of data (600 seconds), its update frequency is 1 second, and the chart width is 1800 pixels, then `dashboard.js` will request from the Netdata server: 10 minutes of data, represented in 600 points, and the chart will be refreshed per second. If the user resizes the window so that the chart becomes 600 pixels wide, then `dashboard.js` will request the same 10 minutes of data, represented in 200 points and the chart will be refreshed once every 3 seconds. -If you need to have a fixed number of points in the data source retrieved from the netdata server, you can set: +If you need to have a fixed number of points in the data source retrieved from the Netdata server, you can set: ```html <div data-netdata="unique.id" @@ -245,7 +243,7 @@ Where `PIXELS_PER_POINT` is the number of pixels each data point should occupy. ### Data grouping method -Netdata supports **average** (the default), **sum** and **max** grouping methods. The grouping method is used when the netdata server is requested to return fewer points for a time-frame, compared to the number of points available. +Netdata supports **average** (the default), **sum** and **max** grouping methods. The grouping method is used when the Netdata server is requested to return fewer points for a time-frame, compared to the number of points available. You can give it per chart, using: @@ -270,9 +268,9 @@ Netdata can change the rate of charts on the fly. So a charts that shows values The above will provide the average rate per minute (60 seconds). Use 60 for `/minute`, 3600 for `/hour`, 86400 for `/day` (provided you have that many data). -- The `data-gtime` setting does not change the units of the chart. You have to change them yourself with `data-units`. -- This works only for `data-method="average"`. -- netdata may aggregate multiple points to satisfy the `data-points` setting. For example, you request `per minute` but the requested number of points to be returned are not enough to report every single minute. In this case netdata will sum the `per second` raw data of the database to find the `per minute` for every single minute and then **average** them to find the **average per minute rate of every X minutes**. So, it works as if the data collection frequency was per minute. +- The `data-gtime` setting does not change the units of the chart. You have to change them yourself with `data-units`. +- This works only for `data-method="average"`. +- Netdata may aggregate multiple points to satisfy the `data-points` setting. For example, you request `per minute` but the requested number of points to be returned are not enough to report every single minute. In this case Netdata will sum the `per second` raw data of the database to find the `per minute` for every single minute and then **average** them to find the **average per minute rate of every X minutes**. So, it works as if the data collection frequency was per minute. ### Selecting dimensions @@ -285,7 +283,7 @@ You can select specific dimensions using this: ></div> ``` -netdata supports coma (` , `) or pipe (` | `) separated [simple patterns](../../../libnetdata/simple_pattern/) for dimensions. By default it searches for both dimension IDs and dimension NAMEs. You can control the target of the match with: `data-append-options="match-ids"` or `data-append-options="match-names"`. Spaces in `data-dimensions=""` are matched in the dimension names and IDs. +Netdata supports coma (`,`) or pipe (`|`) separated [simple patterns](../../../libnetdata/simple_pattern/) for dimensions. By default it searches for both dimension IDs and dimension NAMEs. You can control the target of the match with: `data-append-options="match-ids"` or `data-append-options="match-names"`. Spaces in `data-dimensions=""` are matched in the dimension names and IDs. ### Chart title @@ -344,7 +342,7 @@ On charts that by default have a legend managed by `dashboard.js` you can remove ### API options -You can append netdata **[REST API v1](../../api)** data options, using this: +You can append Netdata **[REST API v1](../../api)** data options, using this: ```html <div data-netdata="unique.id" @@ -354,10 +352,10 @@ You can append netdata **[REST API v1](../../api)** data options, using this: A few useful options are: -- `absolute` to show all values are absolute (i.e. turn negative dimensions to positive) -- `percentage` to express the values as a percentage of the chart total (so, the values of the dimensions are added, and the sum of them if expressed as a percentage of the sum of all dimensions) -- `unaligned` to prevent netdata from aligning the charts (e.g. when requesting 60 seconds aggregation per point, netdata returns chart data aligned to XX:XX:00 to XX:XX:59 - similarly for hours, days, etc - the `unaligned` option disables this feature) -- `match-ids` or `match-names` is used to control what `data-dimensions=` will match. +- `absolute` to show all values are absolute (i.e. turn negative dimensions to positive) +- `percentage` to express the values as a percentage of the chart total (so, the values of the dimensions are added, and the sum of them if expressed as a percentage of the sum of all dimensions) +- `unaligned` to prevent Netdata from aligning the charts (e.g. when requesting 60 seconds aggregation per point, Netdata returns chart data aligned to XX:XX:00 to XX:XX:59 - similarly for hours, days, etc - the `unaligned` option disables this feature) +- `match-ids` or `match-names` is used to control what `data-dimensions=` will match. ### Chart library performance @@ -373,7 +371,7 @@ refreshed in <span id="measurement1"></span> milliseconds! ### Syncing charts y-range -If you give the same `data-common-max="NAME"` to 2+ charts, then all of them will share the same max value of their y-range. If one spikes, all of them will be aligned to have the same scale. This is done for the cpu interrupts and and cpu softnet charts at the dashboard and also for the `gauge` and `easypiecharts` of the netdata home page. +If you give the same `data-common-max="NAME"` to 2+ charts, then all of them will share the same max value of their y-range. If one spikes, all of them will be aligned to have the same scale. This is done for the cpu interrupts and and cpu softnet charts at the dashboard and also for the `gauge` and `easypiecharts` of the Netdata home page. ```html <div data-netdata="chart1" @@ -389,7 +387,7 @@ The same functionality exists for `data-common-min`. ### Syncing chart units -netdata dashboards support auto-scaling of units. So, `MB` can become `KB`, `GB`, etc dynamically, based on the value to be shown. +Netdata dashboards support auto-scaling of units. So, `MB` can become `KB`, `GB`, etc dynamically, based on the value to be shown. Giving the same `NAME` with `data-common-units="NAME"`, 2+ charts can be forced to always have the same units. @@ -413,5 +411,4 @@ Charts can be scaled to specific units with `data-desired-units="UNITS"`. If the ></div> ``` - -[]() +[](<>) diff --git a/web/gui/dashboard.css b/web/gui/dashboard.css index 8062497d0..674131a1d 100644 --- a/web/gui/dashboard.css +++ b/web/gui/dashboard.css @@ -737,3 +737,21 @@ body { .ps-container:hover > .ps-scrollbar-y-rail:hover > .ps-scrollbar-y { background-color: #999; /* scrollbar color on hover */ } + +.dygraph__history-tip { + position: absolute; + top: 50%; + transform: translateY(-50%); + display: none; /* overriden in js */ + margin-right: 25px; + direction: rtl; + overflow: hidden; + pointer-events: none; +} + +.dygraph__history-tip-content { + display: inline-block; + white-space: nowrap; + direction: ltr; + pointer-events: auto; +} diff --git a/web/gui/dashboard.js b/web/gui/dashboard.js index a32a29be7..0c379dc05 100644 --- a/web/gui/dashboard.js +++ b/web/gui/dashboard.js @@ -2281,8 +2281,28 @@ NETDATA.dygraphChartCreate = function (state, data) { NETDATA.globalSelectionSync.stop(); }, underlayCallback: function (canvas, area, g) { - // the chart is about to be drawn + + // update history_tip_element + if (state.tmp.dygraph_history_tip_element) { + const xHookRightSide = g.toDomXCoord(state.netdata_first); + if (xHookRightSide > area.x) { + state.tmp.dygraph_history_tip_element_displayed = true; + // group the styles for possible better performance + state.tmp.dygraph_history_tip_element.setAttribute( + 'style', + `display: block; left: ${area.x}px; right: calc(100% - ${xHookRightSide}px);` + ) + } else { + if (state.tmp.dygraph_history_tip_element_displayed) { + // additional check just for performance + // don't update the DOM when it's not needed + state.tmp.dygraph_history_tip_element.style.display = 'none'; + state.tmp.dygraph_history_tip_element_displayed = false; + } + } + } + // this function renders global highlighted time-frame if (NETDATA.globalChartUnderlay.isActive()) { @@ -2751,6 +2771,21 @@ NETDATA.dygraphChartCreate = function (state, data) { state.tmp.dygraph_instance = new Dygraph(state.element_chart, data.result.data, state.tmp.dygraph_options); + + state.tmp.dygraph_history_tip_element = document.createElement('div'); + state.tmp.dygraph_history_tip_element.innerHTML = ` + <span class="dygraph__history-tip-content"> + Want to extend your history of real-time metrics? + <br /> + <a href="https://docs.netdata.cloud/docs/configuration-guide/#increase-the-metrics-retention-period" target=_blank> + Configure Netdata's <b>history</b></a> + or use the <a href="https://docs.netdata.cloud/database/engine/" target=_blank>DB engine</a>. + </span> + `; + state.tmp.dygraph_history_tip_element.className = 'dygraph__history-tip'; + state.element_chart.appendChild(state.tmp.dygraph_history_tip_element); + + state.tmp.dygraph_force_zoom = false; state.tmp.dygraph_user_action = false; state.tmp.dygraph_last_rendered = Date.now(); diff --git a/web/gui/dashboard.slate.css b/web/gui/dashboard.slate.css index f1c9c4101..af3382521 100644 --- a/web/gui/dashboard.slate.css +++ b/web/gui/dashboard.slate.css @@ -755,3 +755,21 @@ code { .ps-container:hover > .ps-scrollbar-y-rail:hover > .ps-scrollbar-y { background-color: #999; /* scrollbar color on hover */ } + +.dygraph__history-tip { + position: absolute; + top: 50%; + transform: translateY(-50%); + display: none; /* overriden in js */ + margin-right: 25px; + direction: rtl; + overflow: hidden; + pointer-events: none; +} + +.dygraph__history-tip-content { + display: inline-block; + white-space: nowrap; + direction: ltr; + pointer-events: auto; +} diff --git a/web/gui/dashboard_info.js b/web/gui/dashboard_info.js index df9242646..130162be3 100644 --- a/web/gui/dashboard_info.js +++ b/web/gui/dashboard_info.js @@ -486,6 +486,12 @@ netdataDashboard.menu = { title: 'Perf Counters', icon: '<i class="fas fa-tachometer-alt"></i>', info: 'Performance Monitoring Counters (PMC). Data collected using <b>perf_event_open()</b> system call which utilises Hardware Performance Monitoring Units (PMU).' + }, + + 'vsphere': { + title: 'vSphere', + icon: '<i class="fas fa-server"></i>', + info: 'Performance statistics for ESXI hosts and virtual machines. Data collected from <a href="https://www.vmware.com/products/vcenter-server.html">VMware vCenter Server</a> using <code><a href="https://github.com/vmware/govmomi"> govmomi</a></code> library.' } }; @@ -826,6 +832,32 @@ netdataDashboard.context = { ] }, + 'mem.zram_usage': { + info: 'ZRAM total RAM usage metrics. ZRAM uses some memory to store metadata about stored memory pages, thus introducing an overhead which is proportional to disk size. It excludes same-element-filled-pages since no memory is allocated for them.' + }, + + 'mem.zram_savings': { + info: 'Displays original and compressed memory data sizes.' + }, + + 'mem.zram_ratio': { + heads: [ + netdataDashboard.gaugeChart('Compression Ratio', '12%', 'ratio', '#0099CC') + ], + info: 'Compression ratio, calculated as <code>100 * original_size / compressed_size</code>. More means better compression and more RAM savings.' + }, + + 'mem.zram_efficiency': { + heads: [ + netdataDashboard.gaugeChart('Efficiency', '12%', 'percent', NETDATA.colors[0]) + ], + commonMin: true, + commonMax: true, + valueRange: "[0, 100]", + info: 'Memory usage efficiency, calculated as <code>100 * compressed_size / total_mem_used</code>.' + }, + + 'mem.pgfaults': { info: 'A <a href="https://en.wikipedia.org/wiki/Page_fault" target="_blank">page fault</a> is a type of interrupt, called trap, raised by computer hardware when a running program accesses a memory page that is mapped into the virtual address space, but not actually loaded into main memory. If the page is loaded in memory at the time the fault is generated, but is not marked in the memory management unit as being loaded in memory, then it is called a <b>minor</b> or soft page fault. A <b>major</b> page fault is generated when the system needs to load the memory page from disk or swap memory.' }, @@ -953,6 +985,10 @@ netdataDashboard.context = { height: 2.0 }, + 'apps.uptime': { + info: 'Carried over process group uptime since the Netdata restart. The period of time within which at least one process in the group was running.' + }, + // ------------------------------------------------------------------------ // USERS @@ -976,6 +1012,10 @@ netdataDashboard.context = { height: 2.0 }, + 'users.uptime': { + info: 'Carried over process group uptime since the Netdata restart. The period of time within which at least one process in the group was running.' + }, + // ------------------------------------------------------------------------ // GROUPS @@ -988,7 +1028,7 @@ netdataDashboard.context = { }, 'groups.vmem': { - info: 'Virtual memory allocated per user group. Please check <a href="https://github.com/netdata/netdata/tree/master/daemon#virtual-memory" target="_blank">this article</a> for more information.' + info: 'Virtual memory allocated per user group since the Netdata restart. Please check <a href="https://github.com/netdata/netdata/tree/master/daemon#virtual-memory" target="_blank">this article</a> for more information.' }, 'groups.preads': { @@ -999,6 +1039,10 @@ netdataDashboard.context = { height: 2.0 }, + 'groups.uptime': { + info: 'Carried over process group uptime. The period of time within which at least one process in the group was running.' + }, + // ------------------------------------------------------------------------ // NETWORK QoS @@ -2296,7 +2340,7 @@ netdataDashboard.context = { }, 'spigotmc.users': { - info: 'THe number of currently connect users on the monitored Spigot server.' + info: 'The number of currently connect users on the monitored Spigot server.' }, 'unbound.queries': { @@ -2442,7 +2486,100 @@ netdataDashboard.context = { 'powersupply.voltage': { info: undefined - } + }, // ------------------------------------------------------------------------ + // VMware vSphere + + // Host specific + 'vsphere.host_mem_usage_percentage': { + info: 'Percentage of used machine memory: <code>consumed</code> / <code>machine-memory-size</code>.' + }, + + 'vsphere.host_mem_usage': { + info: + '<code>granted</code> is amount of machine memory that is mapped for a host, '+ + 'it equals sum of all granted metrics for all powered-on virtual machines, plus machine memory for vSphere services on the host. ' + + '<code>consumed</code> is amount of machine memory used on the host, it includes memory used by the Service Console, the VMkernel, vSphere services, plus the total consumed metrics for all running virtual machines. ' + + '<code>consumed</code> = <code>total host memory</code> - <code>free host memory</code>.' + + '<code>active</code> is sum of all active metrics for all powered-on virtual machines plus vSphere services (such as COS, vpxa) on the host.' + + '<code>shared</code> is sum of all shared metrics for all powered-on virtual machines, plus amount for vSphere services on the host. ' + + '<code>sharedcommon</code> is amount of machine memory that is shared by all powered-on virtual machines and vSphere services on the host. ' + + '<code>shared</code> - <code>sharedcommon</code> = machine memory (host memory) savings (KB). ' + + 'For details see <a href="https://docs.vmware.com/en/VMware-vSphere/6.5/com.vmware.vsphere.resmgmt.doc/GUID-BFDC988B-F53D-4E97-9793-A002445AFAE1.html">Measuring and Differentiating Types of Memory Usage</a> and ' + + '<a href="https://www.vmware.com/support/developer/converter-sdk/conv51_apireference/memory_counters.html">Memory Counters</a> articles.' + }, + + 'vsphere.host_mem_swap_rate': { + info: + 'This statistic refers to VMkernel swapping and not to guest OS swapping. ' + + '<code>in</code> is sum of <code>swapinRate</code> values for all powered-on virtual machines on the host.' + + '<code>swapinRate</code> is rate at which VMKernel reads data into machine memory from the swap file. ' + + '<code>out</code> is sum of <code>swapoutRate</code> values for all powered-on virtual machines on the host.' + + '<code>swapoutRate</code> is rate at which VMkernel writes to the virtual machine’s swap file from machine memory.' + }, + + // VM specific + 'vsphere.vm_mem_usage_percentage': { + info: 'Percentage of used virtual machine “physical” memory: <code>actvive</code> / <code>virtual machine configured size</code>.' + }, + + 'vsphere.vm_mem_usage': { + info: + '<code>granted</code> is amount of guest “physical” memory that is mapped to machine memory, it includes <code>shared</code> memory amount. ' + + '<code>consumed</code> is amount of guest “physical” memory consumed by the virtual machine for guest memory, ' + + '<code>consumed</code> = <code>granted</code> - <code>memory saved due to memory sharing</code>. ' + + '<code>active</code> is amount of memory that is actively used, as estimated by VMkernel based on recently touched memory pages. ' + + '<code>shared</code> is amount of guest “physical” memory shared with other virtual machines (through the VMkernel’s transparent page-sharing mechanism, a RAM de-duplication technique). ' + + 'For details see <a href="https://docs.vmware.com/en/VMware-vSphere/6.5/com.vmware.vsphere.resmgmt.doc/GUID-BFDC988B-F53D-4E97-9793-A002445AFAE1.html">Measuring and Differentiating Types of Memory Usage</a> and ' + + '<a href="https://www.vmware.com/support/developer/converter-sdk/conv51_apireference/memory_counters.html">Memory Counters</a> articles.' + + }, + + 'vsphere.vm_mem_swap_rate': { + info: + 'This statistic refers to VMkernel swapping and not to guest OS swapping. ' + + '<code>in</code> is rate at which VMKernel reads data into machine memory from the swap file. ' + + '<code>out</code> is rate at which VMkernel writes to the virtual machine’s swap file from machine memory.' + }, + + 'vsphere.vm_mem_swap': { + info: + 'This statistic refers to VMkernel swapping and not to guest OS swapping. ' + + '<code>swapped</code> is amount of guest physical memory swapped out to the virtual machine\'s swap file by the VMkernel. ' + + 'Swapped memory stays on disk until the virtual machine needs it.' + }, + + // Common + 'vsphere.cpu_usage_total': { + info: 'Summary CPU usage statistics across all CPUs/cores.' + }, + + 'vsphere.net_bandwidth_total': { + info: 'Summary receive/transmit statistics across all network interfaces.' + }, + + 'vsphere.net_packets_total': { + info: 'Summary receive/transmit statistics across all network interfaces.' + }, + + 'vsphere.net_errors_total': { + info: 'Summary receive/transmit statistics across all network interfaces.' + }, + + 'vsphere.net_drops_total': { + info: 'Summary receive/transmit statistics across all network interfaces.' + }, + + 'vsphere.disk_usage_total': { + info: 'Summary read/write statistics across all disks.' + }, + + 'vsphere.disk_max_latency': { + info: '<code>latency</code> is highest latency value across all disks.' + }, + + 'vsphere.overall_status': { + info: '<code>0</code> is unknown, <code>1</code> is OK, <code>2</code> is might have a problem, <code>3</code> is definitely has a problem.' + } }; diff --git a/web/gui/images/favicon-128.png b/web/gui/images/favicon-128.png Binary files differdeleted file mode 100644 index 5371f920c..000000000 --- a/web/gui/images/favicon-128.png +++ /dev/null diff --git a/web/gui/images/favicon-196x196.png b/web/gui/images/favicon-196x196.png Binary files differdeleted file mode 100644 index a208c27fa..000000000 --- a/web/gui/images/favicon-196x196.png +++ /dev/null diff --git a/web/gui/images/ms-icon-310x150.png b/web/gui/images/ms-icon-310x150.png Binary files differdeleted file mode 100644 index 5d4ac57b6..000000000 --- a/web/gui/images/ms-icon-310x150.png +++ /dev/null diff --git a/web/gui/images/ms-icon-36x36.png b/web/gui/images/ms-icon-36x36.png Binary files differdeleted file mode 100644 index e251302ed..000000000 --- a/web/gui/images/ms-icon-36x36.png +++ /dev/null diff --git a/web/gui/images/packaging-beta-tag.svg b/web/gui/images/packaging-beta-tag.svg deleted file mode 100644 index cebdc0847..000000000 --- a/web/gui/images/packaging-beta-tag.svg +++ /dev/null @@ -1,42 +0,0 @@ -<svg width="127" height="16" viewBox="0 0 127 16" fill="none" xmlns="http://www.w3.org/2000/svg"> -<rect width="127" height="16" rx="2" fill="url(#paint0_linear)"/> -<path d="M86 0H125C126.105 0 127 0.895431 127 2V14C127 15.1046 126.105 16 125 16H86V0Z" fill="url(#paint1_linear)"/> -<path d="M6.5 4V10" stroke="white" stroke-linecap="round" stroke-linejoin="round"/> -<path d="M12.5 7C13.3284 7 14 6.32843 14 5.5C14 4.67157 13.3284 4 12.5 4C11.6716 4 11 4.67157 11 5.5C11 6.32843 11.6716 7 12.5 7Z" stroke="white" stroke-linecap="round" stroke-linejoin="round"/> -<path d="M6.5 13C7.32843 13 8 12.3284 8 11.5C8 10.6716 7.32843 10 6.5 10C5.67157 10 5 10.6716 5 11.5C5 12.3284 5.67157 13 6.5 13Z" stroke="white" stroke-linecap="round" stroke-linejoin="round"/> -<path d="M12.5 7C12.5 8.19347 12.0259 9.33807 11.182 10.182C10.3381 11.0259 9.19347 11.5 8 11.5" stroke="white" stroke-linecap="round" stroke-linejoin="round"/> -<g filter="url(#filter0_d)"> -<path d="M23.939 7.93848V11H22.9077V3.17969H25.792C26.6478 3.17969 27.3174 3.39811 27.8008 3.83496C28.2878 4.27181 28.5312 4.8501 28.5312 5.56982C28.5312 6.32894 28.2931 6.91439 27.8169 7.32617C27.3442 7.73438 26.6657 7.93848 25.7812 7.93848H23.939ZM23.939 7.09521H25.792C26.3434 7.09521 26.766 6.96631 27.0596 6.7085C27.3532 6.4471 27.5 6.07113 27.5 5.58057C27.5 5.11507 27.3532 4.74268 27.0596 4.46338C26.766 4.18408 26.3631 4.03906 25.8511 4.02832H23.939V7.09521ZM33.6548 11C33.5976 10.8854 33.551 10.6813 33.5152 10.3877C33.0533 10.8675 32.5018 11.1074 31.8609 11.1074C31.288 11.1074 30.8171 10.9463 30.4483 10.624C30.0831 10.2982 29.9004 9.88639 29.9004 9.38867C29.9004 8.78353 30.1296 8.31445 30.5879 7.98145C31.0499 7.64486 31.698 7.47656 32.5323 7.47656H33.4991V7.02002C33.4991 6.67269 33.3952 6.39697 33.1876 6.19287C32.9799 5.98519 32.6737 5.88135 32.2691 5.88135C31.9146 5.88135 31.6174 5.97087 31.3775 6.1499C31.1376 6.32894 31.0176 6.54557 31.0176 6.7998H30.0186C30.0186 6.50977 30.1207 6.23047 30.3248 5.96191C30.5324 5.68978 30.8117 5.47493 31.1627 5.31738C31.5171 5.15983 31.9057 5.08105 32.3282 5.08105C32.9978 5.08105 33.5224 5.24935 33.9019 5.58594C34.2815 5.91895 34.4784 6.37907 34.4927 6.96631V9.64111C34.4927 10.1746 34.5608 10.599 34.6968 10.9141V11H33.6548ZM32.0059 10.2427C32.3174 10.2427 32.6129 10.1621 32.8921 10.001C33.1714 9.83984 33.3738 9.63037 33.4991 9.37256V8.18018H32.7203C31.5028 8.18018 30.8941 8.53646 30.8941 9.24902C30.8941 9.56055 30.9979 9.80404 31.2056 9.97949C31.4133 10.1549 31.6801 10.2427 32.0059 10.2427ZM38.8214 10.2964C39.1759 10.2964 39.4856 10.189 39.7506 9.97412C40.0156 9.75928 40.1624 9.49072 40.191 9.16846H41.131C41.1131 9.50146 40.9985 9.81836 40.7872 10.1191C40.576 10.4199 40.2931 10.6598 39.9386 10.8389C39.5877 11.0179 39.2153 11.1074 38.8214 11.1074C38.0301 11.1074 37.3999 10.8442 36.9308 10.3179C36.4653 9.78792 36.2325 9.06462 36.2325 8.14795V7.98145C36.2325 7.41569 36.3364 6.9126 36.5441 6.47217C36.7517 6.03174 37.0489 5.68978 37.4357 5.44629C37.826 5.2028 38.2861 5.08105 38.816 5.08105C39.4677 5.08105 40.0084 5.2762 40.4381 5.6665C40.8714 6.0568 41.1023 6.56348 41.131 7.18652H40.191C40.1624 6.81055 40.0192 6.5026 39.7613 6.2627C39.5071 6.01921 39.192 5.89746 38.816 5.89746C38.3112 5.89746 37.9191 6.08008 37.6398 6.44531C37.364 6.80697 37.2262 7.33154 37.2262 8.01904V8.20703C37.2262 8.87663 37.364 9.39225 37.6398 9.75391C37.9155 10.1156 38.3094 10.2964 38.8214 10.2964ZM44.3102 8.30908L43.6872 8.95898V11H42.6935V2.75H43.6872V7.73975L44.2189 7.10059L46.029 5.18848H47.2375L44.9762 7.61621L47.5007 11H46.3351L44.3102 8.30908ZM52.2913 11C52.234 10.8854 52.1874 10.6813 52.1516 10.3877C51.6897 10.8675 51.1383 11.1074 50.4973 11.1074C49.9244 11.1074 49.4535 10.9463 49.0847 10.624C48.7195 10.2982 48.5369 9.88639 48.5369 9.38867C48.5369 8.78353 48.766 8.31445 49.2244 7.98145C49.6863 7.64486 50.3344 7.47656 51.1687 7.47656H52.1355V7.02002C52.1355 6.67269 52.0316 6.39697 51.824 6.19287C51.6163 5.98519 51.3101 5.88135 50.9055 5.88135C50.551 5.88135 50.2538 5.97087 50.0139 6.1499C49.774 6.32894 49.654 6.54557 49.654 6.7998H48.655C48.655 6.50977 48.7571 6.23047 48.9612 5.96191C49.1689 5.68978 49.4482 5.47493 49.7991 5.31738C50.1536 5.15983 50.5421 5.08105 50.9646 5.08105C51.6342 5.08105 52.1588 5.24935 52.5383 5.58594C52.9179 5.91895 53.1148 6.37907 53.1291 6.96631V9.64111C53.1291 10.1746 53.1972 10.599 53.3332 10.9141V11H52.2913ZM50.6423 10.2427C50.9538 10.2427 51.2493 10.1621 51.5286 10.001C51.8079 9.83984 52.0102 9.63037 52.1355 9.37256V8.18018H51.3567C50.1392 8.18018 49.5305 8.53646 49.5305 9.24902C49.5305 9.56055 49.6343 9.80404 49.842 9.97949C50.0497 10.1549 50.3165 10.2427 50.6423 10.2427ZM54.8904 8.0459C54.8904 7.13997 55.0999 6.42025 55.5188 5.88672C55.9378 5.34961 56.4928 5.08105 57.1839 5.08105C57.8929 5.08105 58.4461 5.33171 58.8436 5.83301L58.8919 5.18848H59.7996V10.8604C59.7996 11.6123 59.5758 12.2049 59.1282 12.6382C58.6842 13.0715 58.0862 13.2881 57.3343 13.2881C56.9153 13.2881 56.5053 13.1986 56.1043 13.0195C55.7033 12.8405 55.3971 12.5952 55.1858 12.2837L55.7015 11.6875C56.1276 12.2139 56.6486 12.4771 57.2645 12.4771C57.7479 12.4771 58.1238 12.341 58.3924 12.0688C58.6645 11.7967 58.8006 11.4136 58.8006 10.9194V10.4199C58.4031 10.8783 57.8606 11.1074 57.1731 11.1074C56.4928 11.1074 55.9414 10.8335 55.5188 10.2856C55.0999 9.73779 54.8904 8.99121 54.8904 8.0459ZM55.8895 8.15869C55.8895 8.81396 56.0237 9.32959 56.2923 9.70557C56.5608 10.078 56.9368 10.2642 57.4202 10.2642C58.0468 10.2642 58.507 9.97949 58.8006 9.41016V6.75684C58.4962 6.20182 58.0397 5.92432 57.431 5.92432C56.9476 5.92432 56.5698 6.1123 56.2977 6.48828C56.0255 6.86426 55.8895 7.42106 55.8895 8.15869ZM62.8231 11H61.8295V5.18848H62.8231V11ZM61.7489 3.64697C61.7489 3.48584 61.7972 3.34977 61.8939 3.23877C61.9942 3.12777 62.141 3.07227 62.3343 3.07227C62.5277 3.07227 62.6745 3.12777 62.7748 3.23877C62.875 3.34977 62.9252 3.48584 62.9252 3.64697C62.9252 3.80811 62.875 3.94238 62.7748 4.0498C62.6745 4.15723 62.5277 4.21094 62.3343 4.21094C62.141 4.21094 61.9942 4.15723 61.8939 4.0498C61.7972 3.94238 61.7489 3.80811 61.7489 3.64697ZM65.7983 5.18848L65.8305 5.91895C66.2745 5.36035 66.8546 5.08105 67.5707 5.08105C68.7989 5.08105 69.4184 5.77393 69.4291 7.15967V11H68.4355V7.1543C68.4319 6.73535 68.3352 6.42562 68.1454 6.2251C67.9592 6.02458 67.6674 5.92432 67.2699 5.92432C66.9477 5.92432 66.6648 6.01025 66.4213 6.18213C66.1778 6.354 65.988 6.57959 65.852 6.85889V11H64.8583V5.18848H65.7983ZM71.1313 8.0459C71.1313 7.13997 71.3408 6.42025 71.7597 5.88672C72.1787 5.34961 72.7337 5.08105 73.4248 5.08105C74.1338 5.08105 74.687 5.33171 75.0845 5.83301L75.1328 5.18848H76.0405V10.8604C76.0405 11.6123 75.8167 12.2049 75.3691 12.6382C74.9251 13.0715 74.3271 13.2881 73.5752 13.2881C73.1562 13.2881 72.7462 13.1986 72.3452 13.0195C71.9442 12.8405 71.638 12.5952 71.4267 12.2837L71.9424 11.6875C72.3685 12.2139 72.8895 12.4771 73.5054 12.4771C73.9888 12.4771 74.3647 12.341 74.6333 12.0688C74.9054 11.7967 75.0415 11.4136 75.0415 10.9194V10.4199C74.644 10.8783 74.1015 11.1074 73.414 11.1074C72.7337 11.1074 72.1823 10.8335 71.7597 10.2856C71.3408 9.73779 71.1313 8.99121 71.1313 8.0459ZM72.1304 8.15869C72.1304 8.81396 72.2646 9.32959 72.5332 9.70557C72.8017 10.078 73.1777 10.2642 73.6611 10.2642C74.2877 10.2642 74.7479 9.97949 75.0415 9.41016V6.75684C74.7371 6.20182 74.2806 5.92432 73.6719 5.92432C73.1885 5.92432 72.8107 6.1123 72.5386 6.48828C72.2664 6.86426 72.1304 7.42106 72.1304 8.15869Z" fill="white"/> -</g> -<g filter="url(#filter1_d)"> -<path d="M93.7949 12V4.17969H96.4751C97.3595 4.17969 98.0327 4.35693 98.4946 4.71143C98.9565 5.06592 99.1875 5.59408 99.1875 6.2959C99.1875 6.65397 99.0908 6.97624 98.8975 7.2627C98.7041 7.54915 98.4212 7.77116 98.0488 7.92871C98.4714 8.04329 98.7972 8.25993 99.0264 8.57861C99.2591 8.89372 99.3755 9.27327 99.3755 9.71729C99.3755 10.4513 99.1392 11.0153 98.6665 11.4092C98.1974 11.8031 97.5243 12 96.647 12H93.7949ZM95.1538 8.47119V10.915H96.6631C97.0892 10.915 97.4222 10.8094 97.6621 10.5981C97.902 10.3869 98.022 10.0933 98.022 9.71729C98.022 8.90446 97.6066 8.4891 96.7759 8.47119H95.1538ZM95.1538 7.47217H96.4858C96.9084 7.47217 97.2378 7.37728 97.4741 7.1875C97.714 6.99414 97.834 6.72201 97.834 6.37109C97.834 5.98438 97.723 5.70508 97.501 5.5332C97.2826 5.36133 96.9406 5.27539 96.4751 5.27539H95.1538V7.47217ZM105.745 8.50879H102.533V10.915H106.288V12H101.174V4.17969H106.25V5.27539H102.533V7.43457H105.745V8.50879ZM113.592 5.27539H111.153V12H109.805V5.27539H107.388V4.17969H113.592V5.27539ZM118.796 10.1792H115.767L115.133 12H113.72L116.674 4.17969H117.894L120.853 12H119.435L118.796 10.1792ZM116.148 9.0835H118.415L117.281 5.83936L116.148 9.0835Z" fill="white"/> -</g> -<defs> -<filter id="filter0_d" x="21.9077" y="2.75" width="55.1328" height="12.5381" filterUnits="userSpaceOnUse" color-interpolation-filters="sRGB"> -<feFlood flood-opacity="0" result="BackgroundImageFix"/> -<feColorMatrix in="SourceAlpha" type="matrix" values="0 0 0 0 0 0 0 0 0 0 0 0 0 0 0 0 0 0 127 0"/> -<feOffset dy="1"/> -<feGaussianBlur stdDeviation="0.5"/> -<feColorMatrix type="matrix" values="0 0 0 0 0 0 0 0 0 0 0 0 0 0 0 0 0 0 0.5 0"/> -<feBlend mode="normal" in2="BackgroundImageFix" result="effect1_dropShadow"/> -<feBlend mode="normal" in="SourceGraphic" in2="effect1_dropShadow" result="shape"/> -</filter> -<filter id="filter1_d" x="92.7949" y="4.17969" width="29.0583" height="9.82031" filterUnits="userSpaceOnUse" color-interpolation-filters="sRGB"> -<feFlood flood-opacity="0" result="BackgroundImageFix"/> -<feColorMatrix in="SourceAlpha" type="matrix" values="0 0 0 0 0 0 0 0 0 0 0 0 0 0 0 0 0 0 127 0"/> -<feOffset dy="1"/> -<feGaussianBlur stdDeviation="0.5"/> -<feColorMatrix type="matrix" values="0 0 0 0 0 0 0 0 0 0 0 0 0 0 0 0 0 0 0.5 0"/> -<feBlend mode="normal" in2="BackgroundImageFix" result="effect1_dropShadow"/> -<feBlend mode="normal" in="SourceGraphic" in2="effect1_dropShadow" result="shape"/> -</filter> -<linearGradient id="paint0_linear" x1="63.5" y1="0" x2="63.5" y2="16" gradientUnits="userSpaceOnUse"> -<stop stop-color="#606060"/> -<stop offset="1" stop-color="#4D4D4D"/> -</linearGradient> -<linearGradient id="paint1_linear" x1="106.5" y1="0" x2="106.5" y2="16" gradientUnits="userSpaceOnUse"> -<stop stop-color="#BFBFBF"/> -<stop offset="1" stop-color="#7F7F7F"/> -</linearGradient> -</defs> -</svg> diff --git a/web/gui/images/seo-performance-128.png b/web/gui/images/seo-performance-128.png Binary files differdeleted file mode 100644 index 2a212a475..000000000 --- a/web/gui/images/seo-performance-128.png +++ /dev/null diff --git a/web/gui/main.js b/web/gui/main.js index 1214eba6f..6aebb8ed3 100644 --- a/web/gui/main.js +++ b/web/gui/main.js @@ -1788,7 +1788,19 @@ function renderPage(menus, data) { sidebar += '<li class="" style="padding-top:15px;"><a href="https://github.com/netdata/netdata/blob/master/docs/Add-more-charts-to-netdata.md#add-more-charts-to-netdata" target="_blank"><i class="fas fa-plus"></i> add more charts</a></li>'; sidebar += '<li class=""><a href="https://github.com/netdata/netdata/tree/master/health#Health-monitoring" target="_blank"><i class="fas fa-plus"></i> add more alarms</a></li>'; - sidebar += '<li class="" style="margin:20px;color:#666;"><small>netdata on <b>' + data.hostname.toString() + '</b>, collects every ' + ((data.update_every === 1) ? 'second' : data.update_every.toString() + ' seconds') + ' <b>' + data.dimensions_count.toLocaleString() + '</b> metrics, presented as <b>' + data.charts_count.toLocaleString() + '</b> charts and monitored by <b>' + data.alarms_count.toLocaleString() + '</b> alarms, using ' + Math.round(data.rrd_memory_bytes / 1024 / 1024).toLocaleString() + ' MB of memory for ' + NETDATA.seconds4human(data.update_every * data.history, { space: ' ' }) + ' of real-time history.<br/> <br/><b>netdata</b><br/>' + data.version.toString() + '</small></li>'; + sidebar += '<li class="" style="margin:20px;color:#666;"><small>Every ' + + ((data.update_every === 1) ? 'second' : data.update_every.toString() + ' seconds') + ', ' + + 'Netdata collects <b>' + data.dimensions_count.toLocaleString() + '</b> metrics, presents them in <b>' + + data.charts_count.toLocaleString() + '</b> charts and monitors them with <b>' + + data.alarms_count.toLocaleString() + '</b> alarms. Netdata is using ' + + Math.round(data.rrd_memory_bytes / 1024 / 1024).toLocaleString() + ' MB of memory on <b>' + + data.hostname.toString() + '</b> for ' + + NETDATA.seconds4human(data.update_every * data.history, { + minute: 'minute', minutes: 'minutes', second: 'second', seconds: 'seconds', space: ' ', + }) + + ' of real-time history.<br /> <br />' + 'Get more history by ' + + '<a href="https://docs.netdata.cloud/docs/configuration-guide/#increase-the-metrics-retention-period" target=_blank>configuring Netdata\'s <b>history</b></a> or using the <a href="https://docs.netdata.cloud/database/engine/" target=_blank>DB engine.</a>' + + '<br/> <br/><b>netdata</b><br/>' + data.version.toString() + '</small></li>'; sidebar += '</ul>'; div.innerHTML = html; document.getElementById('sidebar').innerHTML = sidebar; diff --git a/web/gui/manifest.json b/web/gui/manifest.json deleted file mode 100644 index 52cb4831c..000000000 --- a/web/gui/manifest.json +++ /dev/null @@ -1,41 +0,0 @@ -{ - "name": "App", - "icons": [ - { - "src": "images\/android-icon-36x36.png", - "sizes": "36x36", - "type": "image\/png", - "density": "0.75" - }, - { - "src": "images\/android-icon-48x48.png", - "sizes": "48x48", - "type": "image\/png", - "density": "1.0" - }, - { - "src": "images\/android-icon-72x72.png", - "sizes": "72x72", - "type": "image\/png", - "density": "1.5" - }, - { - "src": "images\/android-icon-96x96.png", - "sizes": "96x96", - "type": "image\/png", - "density": "2.0" - }, - { - "src": "images\/android-icon-144x144.png", - "sizes": "144x144", - "type": "image\/png", - "density": "3.0" - }, - { - "src": "images\/android-icon-192x192.png", - "sizes": "192x192", - "type": "image\/png", - "density": "4.0" - } - ] -} diff --git a/web/gui/src/dashboard.js/charting/_c3.js b/web/gui/src/dashboard.js/charting/_c3.js deleted file mode 100644 index 6688bbcce..000000000 --- a/web/gui/src/dashboard.js/charting/_c3.js +++ /dev/null @@ -1,114 +0,0 @@ - -// DEPRECATED: will be removed! - -// c3 - -NETDATA.c3Initialize = function(callback) { - if (typeof netdataNoC3 === 'undefined' || !netdataNoC3) { - - // C3 requires D3 - if (!NETDATA.chartLibraries.d3.initialized) { - if (NETDATA.chartLibraries.d3.enabled) { - NETDATA.d3Initialize(function() { - NETDATA.c3Initialize(callback); - }); - } else { - NETDATA.chartLibraries.c3.enabled = false; - if (typeof callback === "function") - return callback(); - } - } else { - NETDATA._loadCSS(NETDATA.c3_css); - - $.ajax({ - url: NETDATA.c3_js, - cache: true, - dataType: "script", - xhrFields: { withCredentials: true } // required for the cookie - }) - .done(function() { - NETDATA.registerChartLibrary('c3', NETDATA.c3_js); - }) - .fail(function() { - NETDATA.chartLibraries.c3.enabled = false; - NETDATA.error(100, NETDATA.c3_js); - }) - .always(function() { - if (typeof callback === "function") - return callback(); - }); - } - } else { - NETDATA.chartLibraries.c3.enabled = false; - if (typeof callback === "function") - return callback(); - } -}; - -NETDATA.c3ChartUpdate = function(state, data) { - state.c3_instance.destroy(); - return NETDATA.c3ChartCreate(state, data); - - //state.c3_instance.load({ - // rows: data.result, - // unload: true - //}); - - //return true; -}; - -NETDATA.c3ChartCreate = function(state, data) { - - state.element_chart.id = 'c3-' + state.uuid; - // console.log('id = ' + state.element_chart.id); - - state.c3_instance = c3.generate({ - bindto: '#' + state.element_chart.id, - size: { - width: state.chartWidth(), - height: state.chartHeight() - }, - color: { - pattern: state.chartColors() - }, - data: { - x: 'time', - rows: data.result, - type: (state.chart.chart_type === 'line')?'spline':'area-spline' - }, - axis: { - x: { - type: 'timeseries', - tick: { - format: function(x) { - return NETDATA.dateTime.xAxisTimeString(x); - } - } - } - }, - grid: { - x: { - show: true - }, - y: { - show: true - } - }, - point: { - show: false - }, - line: { - connectNull: false - }, - transition: { - duration: 0 - }, - interaction: { - enabled: true - } - }); - - // console.log(state.c3_instance); - - return true; -}; diff --git a/web/gui/src/dashboard.js/charting/_morris.js b/web/gui/src/dashboard.js/charting/_morris.js deleted file mode 100644 index 30789e4e2..000000000 --- a/web/gui/src/dashboard.js/charting/_morris.js +++ /dev/null @@ -1,81 +0,0 @@ - -// DEPRECATED: will be removed! - -// morris - -NETDATA.morrisInitialize = function(callback) { - if (typeof netdataNoMorris === 'undefined' || !netdataNoMorris) { - - // morris requires raphael - if (!NETDATA.chartLibraries.raphael.initialized) { - if (NETDATA.chartLibraries.raphael.enabled) { - NETDATA.raphaelInitialize(function() { - NETDATA.morrisInitialize(callback); - }); - } else { - NETDATA.chartLibraries.morris.enabled = false; - if (typeof callback === "function") - return callback(); - } - } else { - NETDATA._loadCSS(NETDATA.morris_css); - - $.ajax({ - url: NETDATA.morris_js, - cache: true, - dataType: "script", - xhrFields: { withCredentials: true } // required for the cookie - }) - .done(function() { - NETDATA.registerChartLibrary('morris', NETDATA.morris_js); - }) - .fail(function() { - NETDATA.chartLibraries.morris.enabled = false; - NETDATA.error(100, NETDATA.morris_js); - }) - .always(function() { - if (typeof callback === "function") - return callback(); - }); - } - } else { - NETDATA.chartLibraries.morris.enabled = false; - if (typeof callback === "function") - return callback(); - } -}; - -NETDATA.morrisChartUpdate = function(state, data) { - state.morris_instance.setData(data.result.data); - return true; -}; - -NETDATA.morrisChartCreate = function(state, data) { - - state.morris_options = { - element: state.element_chart.id, - data: data.result.data, - xkey: 'time', - ykeys: data.dimension_names, - labels: data.dimension_names, - lineWidth: 2, - pointSize: 3, - smooth: true, - hideHover: 'auto', - parseTime: true, - continuousLine: false, - behaveLikeLine: false - }; - - if (state.chart.chart_type === 'line') - state.morris_instance = new Morris.Line(state.morris_options); - - else if (state.chart.chart_type === 'area') { - state.morris_options.behaveLikeLine = true; - state.morris_instance = new Morris.Area(state.morris_options); - } - else // stacked - state.morris_instance = new Morris.Area(state.morris_options); - - return true; -}; diff --git a/web/gui/src/dashboard.js/charting/_raphael.js b/web/gui/src/dashboard.js/charting/_raphael.js deleted file mode 100644 index 2d89a22a8..000000000 --- a/web/gui/src/dashboard.js/charting/_raphael.js +++ /dev/null @@ -1,48 +0,0 @@ - -// DEPRECATED: will be removed! - -// raphael - -NETDATA.raphaelInitialize = function(callback) { - if (typeof netdataStopRaphael === 'undefined' || !netdataStopRaphael) { - $.ajax({ - url: NETDATA.raphael_js, - cache: true, - dataType: "script", - xhrFields: { withCredentials: true } // required for the cookie - }) - .done(function() { - NETDATA.registerChartLibrary('raphael', NETDATA.raphael_js); - }) - .fail(function() { - NETDATA.chartLibraries.raphael.enabled = false; - NETDATA.error(100, NETDATA.raphael_js); - }) - .always(function() { - if (typeof callback === "function") - return callback(); - }); - } else { - NETDATA.chartLibraries.raphael.enabled = false; - if (typeof callback === "function") - return callback(); - } -}; - -NETDATA.raphaelChartUpdate = function(state, data) { - $(state.element_chart).raphael(data.result, { - width: state.chartWidth(), - height: state.chartHeight() - }); - - return false; -}; - -NETDATA.raphaelChartCreate = function(state, data) { - $(state.element_chart).raphael(data.result, { - width: state.chartWidth(), - height: state.chartHeight() - }); - - return false; -}; diff --git a/web/gui/src/dashboard.js/charting/dygraph.js b/web/gui/src/dashboard.js/charting/dygraph.js index a60af18b8..f34d2f4aa 100644 --- a/web/gui/src/dashboard.js/charting/dygraph.js +++ b/web/gui/src/dashboard.js/charting/dygraph.js @@ -483,8 +483,28 @@ NETDATA.dygraphChartCreate = function (state, data) { NETDATA.globalSelectionSync.stop(); }, underlayCallback: function (canvas, area, g) { - // the chart is about to be drawn + + // update history_tip_element + if (state.tmp.dygraph_history_tip_element) { + const xHookRightSide = g.toDomXCoord(state.netdata_first); + if (xHookRightSide > area.x) { + state.tmp.dygraph_history_tip_element_displayed = true; + // group the styles for possible better performance + state.tmp.dygraph_history_tip_element.setAttribute( + 'style', + `display: block; left: ${area.x}px; right: calc(100% - ${xHookRightSide}px);` + ) + } else { + if (state.tmp.dygraph_history_tip_element_displayed) { + // additional check just for performance + // don't update the DOM when it's not needed + state.tmp.dygraph_history_tip_element.style.display = 'none'; + state.tmp.dygraph_history_tip_element_displayed = false; + } + } + } + // this function renders global highlighted time-frame if (NETDATA.globalChartUnderlay.isActive()) { @@ -953,6 +973,21 @@ NETDATA.dygraphChartCreate = function (state, data) { state.tmp.dygraph_instance = new Dygraph(state.element_chart, data.result.data, state.tmp.dygraph_options); + + state.tmp.dygraph_history_tip_element = document.createElement('div'); + state.tmp.dygraph_history_tip_element.innerHTML = ` + <span class="dygraph__history-tip-content"> + Want to extend your history of real-time metrics? + <br /> + <a href="https://docs.netdata.cloud/docs/configuration-guide/#increase-the-metrics-retention-period" target=_blank> + Configure Netdata's <b>history</b></a> + or use the <a href="https://docs.netdata.cloud/database/engine/" target=_blank>DB engine</a>. + </span> + `; + state.tmp.dygraph_history_tip_element.className = 'dygraph__history-tip'; + state.element_chart.appendChild(state.tmp.dygraph_history_tip_element); + + state.tmp.dygraph_force_zoom = false; state.tmp.dygraph_user_action = false; state.tmp.dygraph_last_rendered = Date.now(); diff --git a/web/gui/version.txt b/web/gui/version.txt new file mode 100644 index 000000000..3c59cf509 --- /dev/null +++ b/web/gui/version.txt @@ -0,0 +1 @@ +588ce5a7b18999dfa66698cd3a2f005f7a3c31cf |