
diff options
Diffstat (limited to 'web/gui')
27 files changed, 3857 insertions, 1862 deletions
diff --git a/web/gui/Makefile.am b/web/gui/Makefile.am index 117dc5d56..c69380f93 100644 --- a/web/gui/Makefile.am +++ b/web/gui/Makefile.am @@ -71,6 +71,11 @@ dist_web_DATA = \ version.txt \ $(NULL) +webolddir=$(webdir)/old +dist_webold_DATA = \ + old/index.html \ + $(NULL) + webstaticdir=$(webdir)/static/img dist_webstatic_DATA = \ static/img/netdata-logomark.svg \ diff --git a/web/gui/Makefile.in b/web/gui/Makefile.in deleted file mode 100644 index 9cc76fc22..000000000 --- a/web/gui/Makefile.in +++ /dev/null @@ -1,920 +0,0 @@ -# Makefile.in generated by automake 1.15.1 from Makefile.am. -# @configure_input@ - -# Copyright (C) 1994-2017 Free Software Foundation, Inc. - -# This Makefile.in is free software; the Free Software Foundation -# gives unlimited permission to copy and/or distribute it, -# with or without modifications, as long as this notice is preserved. - -# This program is distributed in the hope that it will be useful, -# but WITHOUT ANY WARRANTY, to the extent permitted by law; without -# even the implied warranty of MERCHANTABILITY or FITNESS FOR A -# PARTICULAR PURPOSE. - -@SET_MAKE@ - -VPATH = @srcdir@ -am__is_gnu_make = { \ - if test -z '$(MAKELEVEL)'; then \ - false; \ - elif test -n '$(MAKE_HOST)'; then \ - true; \ - elif test -n '$(MAKE_VERSION)' && test -n '$(CURDIR)'; then \ - true; \ - else \ - false; \ - fi; \ -} -am__make_running_with_option = \ - case $${target_option-} in \ - ?) ;; \ - *) echo "am__make_running_with_option: internal error: invalid" \ - "target option '$${target_option-}' specified" >&2; \ - exit 1;; \ - esac; \ - has_opt=no; \ - sane_makeflags=$$MAKEFLAGS; \ - if $(am__is_gnu_make); then \ - sane_makeflags=$$MFLAGS; \ - else \ - case $$MAKEFLAGS in \ - *\\[\ \ ]*) \ - bs=\\; \ - sane_makeflags=`printf '%s\n' "$$MAKEFLAGS" \ - | sed "s/$$bs$$bs[$$bs $$bs ]*//g"`;; \ - esac; \ - fi; \ - skip_next=no; \ - strip_trailopt () \ - { \ - flg=`printf '%s\n' "$$flg" | sed "s/$$1.*$$//"`; \ - }; \ - for flg in $$sane_makeflags; do \ - test $$skip_next = yes && { skip_next=no; continue; }; \ - case $$flg in \ - *=*|--*) continue;; \ - -*I) strip_trailopt 'I'; skip_next=yes;; \ - -*I?*) strip_trailopt 'I';; \ - -*O) strip_trailopt 'O'; skip_next=yes;; \ - -*O?*) strip_trailopt 'O';; \ - -*l) strip_trailopt 'l'; skip_next=yes;; \ - -*l?*) strip_trailopt 'l';; \ - -[dEDm]) skip_next=yes;; \ - -[JT]) skip_next=yes;; \ - esac; \ - case $$flg in \ - *$$target_option*) has_opt=yes; break;; \ - esac; \ - done; \ - test $$has_opt = yes -am__make_dryrun = (target_option=n; $(am__make_running_with_option)) -am__make_keepgoing = (target_option=k; $(am__make_running_with_option)) -pkgdatadir = $(datadir)/@PACKAGE@ -pkgincludedir = $(includedir)/@PACKAGE@ -pkglibdir = $(libdir)/@PACKAGE@ -pkglibexecdir = $(libexecdir)/@PACKAGE@ -am__cd = CDPATH="$${ZSH_VERSION+.}$(PATH_SEPARATOR)" && cd -install_sh_DATA = $(install_sh) -c -m 644 -install_sh_PROGRAM = $(install_sh) -c -install_sh_SCRIPT = $(install_sh) -c -INSTALL_HEADER = $(INSTALL_DATA) -transform = $(program_transform_name) -NORMAL_INSTALL = : -PRE_INSTALL = : -POST_INSTALL = : -NORMAL_UNINSTALL = : -PRE_UNINSTALL = : -POST_UNINSTALL = : -build_triplet = @build@ -host_triplet = @host@ -subdir = web/gui -ACLOCAL_M4 = $(top_srcdir)/aclocal.m4 -am__aclocal_m4_deps = $(top_srcdir)/build/m4/ax_c___atomic.m4 \ - $(top_srcdir)/build/m4/ax_c__generic.m4 \ - $(top_srcdir)/build/m4/ax_c_lto.m4 \ - $(top_srcdir)/build/m4/ax_c_mallinfo.m4 \ - $(top_srcdir)/build/m4/ax_c_mallopt.m4 \ - $(top_srcdir)/build/m4/ax_check_compile_flag.m4 \ - $(top_srcdir)/build/m4/ax_gcc_func_attribute.m4 \ - $(top_srcdir)/build/m4/ax_pthread.m4 \ - $(top_srcdir)/build/m4/jemalloc.m4 \ - $(top_srcdir)/build/m4/tcmalloc.m4 $(top_srcdir)/configure.ac -am__configure_deps = $(am__aclocal_m4_deps) $(CONFIGURE_DEPENDENCIES) \ - $(ACLOCAL_M4) -DIST_COMMON = $(srcdir)/Makefile.am $(dist_noinst_DATA) \ - $(dist_web_DATA) $(dist_webcss_DATA) $(dist_webdnt_DATA) \ - $(dist_webfonts_DATA) $(dist_webimages_DATA) \ - $(dist_weblib_DATA) $(dist_webstatic_DATA) \ - $(dist_webwellknown_DATA) $(am__DIST_COMMON) -mkinstalldirs = $(install_sh) -d -CONFIG_HEADER = $(top_builddir)/config.h -CONFIG_CLEAN_FILES = -CONFIG_CLEAN_VPATH_FILES = -AM_V_P = $(am__v_P_@AM_V@) -am__v_P_ = $(am__v_P_@AM_DEFAULT_V@) -am__v_P_0 = false -am__v_P_1 = : -AM_V_GEN = $(am__v_GEN_@AM_V@) -am__v_GEN_ = $(am__v_GEN_@AM_DEFAULT_V@) -am__v_GEN_0 = @echo " GEN " $@; -am__v_GEN_1 = -AM_V_at = $(am__v_at_@AM_V@) -am__v_at_ = $(am__v_at_@AM_DEFAULT_V@) -am__v_at_0 = @ -am__v_at_1 = -SOURCES = -DIST_SOURCES = -am__can_run_installinfo = \ - case $$AM_UPDATE_INFO_DIR in \ - n|no|NO) false;; \ - *) (install-info --version) >/dev/null 2>&1;; \ - esac -am__vpath_adj_setup = srcdirstrip=`echo "$(srcdir)" | sed 's|.|.|g'`; -am__vpath_adj = case $$p in \ - $(srcdir)/*) f=`echo "$$p" | sed "s|^$$srcdirstrip/||"`;; \ - *) f=$$p;; \ - esac; -am__strip_dir = f=`echo $$p | sed -e 's|^.*/||'`; -am__install_max = 40 -am__nobase_strip_setup = \ - srcdirstrip=`echo "$(srcdir)" | sed 's/[].[^$$\\*|]/\\\\&/g'` -am__nobase_strip = \ - for p in $$list; do echo "$$p"; done | sed -e "s|$$srcdirstrip/||" -am__nobase_list = $(am__nobase_strip_setup); \ - for p in $$list; do echo "$$p $$p"; done | \ - sed "s| $$srcdirstrip/| |;"' / .*\//!s/ .*/ ./; s,\( .*\)/[^/]*$$,\1,' | \ - $(AWK) 'BEGIN { files["."] = "" } { files[$$2] = files[$$2] " " $$1; \ - if (++n[$$2] == $(am__install_max)) \ - { print $$2, files[$$2]; n[$$2] = 0; files[$$2] = "" } } \ - END { for (dir in files) print dir, files[dir] }' -am__base_list = \ - sed '$$!N;$$!N;$$!N;$$!N;$$!N;$$!N;$$!N;s/\n/ /g' | \ - sed '$$!N;$$!N;$$!N;$$!N;s/\n/ /g' -am__uninstall_files_from_dir = { \ - test -z "$$files" \ - || { test ! -d "$$dir" && test ! -f "$$dir" && test ! -r "$$dir"; } \ - || { echo " ( cd '$$dir' && rm -f" $$files ")"; \ - $(am__cd) "$$dir" && rm -f $$files; }; \ - } -am__installdirs = "$(DESTDIR)$(webdir)" "$(DESTDIR)$(webcssdir)" \ - "$(DESTDIR)$(webdntdir)" "$(DESTDIR)$(webfontsdir)" \ - "$(DESTDIR)$(webimagesdir)" "$(DESTDIR)$(weblibdir)" \ - "$(DESTDIR)$(webstaticdir)" "$(DESTDIR)$(webwellknowndir)" -DATA = $(dist_noinst_DATA) $(dist_web_DATA) $(dist_webcss_DATA) \ - $(dist_webdnt_DATA) $(dist_webfonts_DATA) \ - $(dist_webimages_DATA) $(dist_weblib_DATA) \ - $(dist_webstatic_DATA) $(dist_webwellknown_DATA) -am__tagged_files = $(HEADERS) $(SOURCES) $(TAGS_FILES) $(LISP) -am__DIST_COMMON = $(srcdir)/Makefile.in -DISTFILES = $(DIST_COMMON) $(DIST_SOURCES) $(TEXINFOS) $(EXTRA_DIST) -ACLOCAL = @ACLOCAL@ -AMTAR = @AMTAR@ -AM_DEFAULT_VERBOSITY = @AM_DEFAULT_VERBOSITY@ -AUTOCONF = @AUTOCONF@ -AUTOHEADER = @AUTOHEADER@ -AUTOMAKE = @AUTOMAKE@ -AWK = @AWK@ -CC = @CC@ -CCDEPMODE = @CCDEPMODE@ -CFLAGS = @CFLAGS@ -CMOCKA_CFLAGS = @CMOCKA_CFLAGS@ -CMOCKA_LIBS = @CMOCKA_LIBS@ -CPP = @CPP@ -CPPFLAGS = @CPPFLAGS@ -CUPSCONFIG = @CUPSCONFIG@ -CXX = @CXX@ -CXXDEPMODE = @CXXDEPMODE@ -CXXFLAGS = @CXXFLAGS@ -CXX_BINARY = @CXX_BINARY@ -CYGPATH_W = @CYGPATH_W@ -DEFS = @DEFS@ -DEPDIR = @DEPDIR@ -ECHO_C = @ECHO_C@ -ECHO_N = @ECHO_N@ -ECHO_T = @ECHO_T@ -EGREP = @EGREP@ -ENABLE_UNITTESTS = @ENABLE_UNITTESTS@ -EXEEXT = @EXEEXT@ -GREP = @GREP@ -INSTALL = @INSTALL@ -INSTALL_DATA = @INSTALL_DATA@ -INSTALL_PROGRAM = @INSTALL_PROGRAM@ -INSTALL_SCRIPT = @INSTALL_SCRIPT@ -INSTALL_STRIP_PROGRAM = @INSTALL_STRIP_PROGRAM@ -IPMIMONITORING_CFLAGS = @IPMIMONITORING_CFLAGS@ -IPMIMONITORING_LIBS = @IPMIMONITORING_LIBS@ -JSON_CFLAGS = @JSON_CFLAGS@ -JSON_LIBS = @JSON_LIBS@ -LDFLAGS = @LDFLAGS@ -LIBCAP_CFLAGS = @LIBCAP_CFLAGS@ -LIBCAP_LIBS = @LIBCAP_LIBS@ -LIBCRYPTO_CFLAGS = @LIBCRYPTO_CFLAGS@ -LIBCRYPTO_LIBS = @LIBCRYPTO_LIBS@ -LIBCURL_CFLAGS = @LIBCURL_CFLAGS@ -LIBCURL_LIBS = @LIBCURL_LIBS@ -LIBMNL_CFLAGS = @LIBMNL_CFLAGS@ -LIBMNL_LIBS = @LIBMNL_LIBS@ -LIBMONGOC_CFLAGS = @LIBMONGOC_CFLAGS@ -LIBMONGOC_LIBS = @LIBMONGOC_LIBS@ -LIBOBJS = @LIBOBJS@ -LIBS = @LIBS@ -LIBSSL_CFLAGS = @LIBSSL_CFLAGS@ -LIBSSL_LIBS = @LIBSSL_LIBS@ -LTLIBOBJS = @LTLIBOBJS@ -MAINT = @MAINT@ -MAKEINFO = @MAKEINFO@ -MATH_CFLAGS = @MATH_CFLAGS@ -MATH_LIBS = @MATH_LIBS@ -MKDIR_P = @MKDIR_P@ -NFACCT_CFLAGS = @NFACCT_CFLAGS@ -NFACCT_LIBS = @NFACCT_LIBS@ -OBJEXT = @OBJEXT@ -OPTIONAL_CUPS_CFLAGS = @OPTIONAL_CUPS_CFLAGS@ -OPTIONAL_CUPS_LIBS = @OPTIONAL_CUPS_LIBS@ -OPTIONAL_IPMIMONITORING_CFLAGS = @OPTIONAL_IPMIMONITORING_CFLAGS@ -OPTIONAL_IPMIMONITORING_LIBS = @OPTIONAL_IPMIMONITORING_LIBS@ -OPTIONAL_JSONC_LIBS = @OPTIONAL_JSONC_LIBS@ -OPTIONAL_JUDY_LIBS = @OPTIONAL_JUDY_LIBS@ -OPTIONAL_KINESIS_CFLAGS = @OPTIONAL_KINESIS_CFLAGS@ -OPTIONAL_KINESIS_LIBS = @OPTIONAL_KINESIS_LIBS@ -OPTIONAL_LIBCAP_CFLAGS = @OPTIONAL_LIBCAP_CFLAGS@ -OPTIONAL_LIBCAP_LIBS = @OPTIONAL_LIBCAP_LIBS@ -OPTIONAL_LZ4_LIBS = @OPTIONAL_LZ4_LIBS@ -OPTIONAL_MATH_CFLAGS = @OPTIONAL_MATH_CFLAGS@ -OPTIONAL_MATH_LIBS = @OPTIONAL_MATH_LIBS@ -OPTIONAL_MONGOC_CFLAGS = @OPTIONAL_MONGOC_CFLAGS@ -OPTIONAL_MONGOC_LIBS = @OPTIONAL_MONGOC_LIBS@ -OPTIONAL_NFACCT_CFLAGS = @OPTIONAL_NFACCT_CFLAGS@ -OPTIONAL_NFACCT_LIBS = @OPTIONAL_NFACCT_LIBS@ -OPTIONAL_PROMETHEUS_REMOTE_WRITE_CFLAGS = @OPTIONAL_PROMETHEUS_REMOTE_WRITE_CFLAGS@ -OPTIONAL_PROMETHEUS_REMOTE_WRITE_LIBS = @OPTIONAL_PROMETHEUS_REMOTE_WRITE_LIBS@ -OPTIONAL_SSL_LIBS = @OPTIONAL_SSL_LIBS@ -OPTIONAL_UUID_CFLAGS = @OPTIONAL_UUID_CFLAGS@ -OPTIONAL_UUID_LIBS = @OPTIONAL_UUID_LIBS@ -OPTIONAL_UV_LIBS = @OPTIONAL_UV_LIBS@ -OPTIONAL_XENSTAT_CFLAGS = @OPTIONAL_XENSTAT_CFLAGS@ -OPTIONAL_XENSTAT_LIBS = @OPTIONAL_XENSTAT_LIBS@ -OPTIONAL_ZLIB_CFLAGS = @OPTIONAL_ZLIB_CFLAGS@ -OPTIONAL_ZLIB_LIBS = @OPTIONAL_ZLIB_LIBS@ -PACKAGE = @PACKAGE@ -PACKAGE_BUGREPORT = @PACKAGE_BUGREPORT@ -PACKAGE_NAME = @PACKAGE_NAME@ -PACKAGE_RPM_VERSION = @PACKAGE_RPM_VERSION@ -PACKAGE_STRING = @PACKAGE_STRING@ -PACKAGE_TARNAME = @PACKAGE_TARNAME@ -PACKAGE_URL = @PACKAGE_URL@ -PACKAGE_VERSION = @PACKAGE_VERSION@ -PATH_SEPARATOR = @PATH_SEPARATOR@ -PKG_CONFIG = @PKG_CONFIG@ -PKG_CONFIG_LIBDIR = @PKG_CONFIG_LIBDIR@ -PKG_CONFIG_PATH = @PKG_CONFIG_PATH@ -PROTOBUF_CFLAGS = @PROTOBUF_CFLAGS@ -PROTOBUF_LIBS = @PROTOBUF_LIBS@ -PROTOC = @PROTOC@ -PTHREAD_CC = @PTHREAD_CC@ -PTHREAD_CFLAGS = @PTHREAD_CFLAGS@ -PTHREAD_LIBS = @PTHREAD_LIBS@ -SET_MAKE = @SET_MAKE@ -SHELL = @SHELL@ -SSE_CANDIDATE = @SSE_CANDIDATE@ -STRIP = @STRIP@ -TEST_CFLAGS = @TEST_CFLAGS@ -TEST_LIBS = @TEST_LIBS@ -UUID_CFLAGS = @UUID_CFLAGS@ -UUID_LIBS = @UUID_LIBS@ -VERSION = @VERSION@ -XENLIGHT_CFLAGS = @XENLIGHT_CFLAGS@ -XENLIGHT_LIBS = @XENLIGHT_LIBS@ -YAJL_CFLAGS = @YAJL_CFLAGS@ -YAJL_LIBS = @YAJL_LIBS@ -ZLIB_CFLAGS = @ZLIB_CFLAGS@ -ZLIB_LIBS = @ZLIB_LIBS@ -abs_builddir = @abs_builddir@ -abs_srcdir = @abs_srcdir@ -abs_top_builddir = @abs_top_builddir@ -abs_top_srcdir = @abs_top_srcdir@ -ac_ct_CC = @ac_ct_CC@ -ac_ct_CXX = @ac_ct_CXX@ -am__include = @am__include@ -am__leading_dot = @am__leading_dot@ -am__quote = @am__quote@ -am__tar = @am__tar@ -am__untar = @am__untar@ -ax_pthread_config = @ax_pthread_config@ -bindir = @bindir@ -build = @build@ -build_alias = @build_alias@ -build_cpu = @build_cpu@ -build_os = @build_os@ -build_target = @build_target@ -build_vendor = @build_vendor@ -builddir = @builddir@ -cachedir = @cachedir@ -chartsdir = @chartsdir@ -configdir = @configdir@ -datadir = @datadir@ -datarootdir = @datarootdir@ -docdir = @docdir@ -dvidir = @dvidir@ -exec_prefix = @exec_prefix@ -has_jemalloc = @has_jemalloc@ -has_tcmalloc = @has_tcmalloc@ -host = @host@ -host_alias = @host_alias@ -host_cpu = @host_cpu@ -host_os = @host_os@ -host_vendor = @host_vendor@ -htmldir = @htmldir@ -includedir = @includedir@ -infodir = @infodir@ -install_sh = @install_sh@ -libconfigdir = @libconfigdir@ -libdir = @libdir@ -libexecdir = @libexecdir@ -localedir = @localedir@ -localstatedir = @localstatedir@ -logdir = @logdir@ -mandir = @mandir@ -mkdir_p = @mkdir_p@ -nodedir = @nodedir@ -oldincludedir = @oldincludedir@ -pdfdir = @pdfdir@ -pluginsdir = @pluginsdir@ -prefix = @prefix@ -program_transform_name = @program_transform_name@ -psdir = @psdir@ -pythondir = @pythondir@ -registrydir = @registrydir@ -runstatedir = @runstatedir@ -sbindir = @sbindir@ -sharedstatedir = @sharedstatedir@ -srcdir = @srcdir@ -sysconfdir = @sysconfdir@ -target_alias = @target_alias@ -top_build_prefix = @top_build_prefix@ -top_builddir = @top_builddir@ -top_srcdir = @top_srcdir@ -varlibdir = @varlibdir@ -webdir = @webdir@ - -# -# Copyright (C) 2015 Alon Bar-Lev <alon.barlev@gmail.com> -# SPDX-License-Identifier: GPL-3.0-or-later -# -MAINTAINERCLEANFILES = $(srcdir)/Makefile.in -CLEANFILES = \ - version.txt \ - $(NULL) - -DASHBOARD_JS_FILES = \ - src/dashboard.js/prologue.js.inc \ - src/dashboard.js/utils.js \ - src/dashboard.js/server-detection.js \ - src/dashboard.js/dependencies.js \ - src/dashboard.js/error-handling.js \ - src/dashboard.js/compatibility.js \ - src/dashboard.js/xss.js \ - src/dashboard.js/colors.js \ - src/dashboard.js/units-conversion.js \ - src/dashboard.js/options.js \ - src/dashboard.js/localstorage.js \ - src/dashboard.js/timeout.js \ - src/dashboard.js/themes.js \ - src/dashboard.js/charting/dygraph.js \ - src/dashboard.js/charting/sparkline.js \ - src/dashboard.js/charting/google-charts.js \ - src/dashboard.js/charting/gauge.js \ - src/dashboard.js/charting/easy-pie-chart.js \ - src/dashboard.js/charting/d3pie.js \ - src/dashboard.js/charting/d3.js \ - src/dashboard.js/charting/peity.js \ - src/dashboard.js/charting/textonly.js \ - src/dashboard.js/charting.js \ - src/dashboard.js/chart-registry.js \ - src/dashboard.js/common.js \ - src/dashboard.js/main.js \ - src/dashboard.js/alarms.js \ - src/dashboard.js/registry.js \ - src/dashboard.js/boot.js \ - src/dashboard.js/epilogue.js.inc \ - $(NULL) - -dist_noinst_DATA = \ - README.md \ - $(DASHBOARD_JS_FILES) \ - $(NULL) - -dist_web_DATA = \ - demo.html \ - demo2.html \ - demosites.html \ - demosites2.html \ - dashboard.html \ - dashboard.js \ - dashboard_info.js \ - dashboard_info_custom_example.js \ - dashboard.css \ - dashboard.slate.css \ - favicon.ico \ - goto-host-from-alarm.html \ - index.html \ - main.css \ - main.js \ - console.html \ - infographic.html \ - robots.txt \ - refresh-badges.js \ - sitemap.xml \ - tv.html \ - dash-example.html \ - version.txt \ - $(NULL) - -webstaticdir = $(webdir)/static/img -dist_webstatic_DATA = \ - static/img/netdata-logomark.svg \ - $(NULL) - -weblibdir = $(webdir)/lib -dist_weblib_DATA = \ - lib/bootstrap-3.3.7.min.js \ - lib/bootstrap-slider-10.0.0.min.js \ - lib/bootstrap-table-1.11.0.min.js \ - lib/bootstrap-table-export-1.11.0.min.js \ - lib/bootstrap-toggle-2.2.2.min.js \ - lib/clipboard-polyfill-be05dad.js \ - lib/d3-4.12.2.min.js \ - lib/d3pie-0.2.1-netdata-3.js \ - lib/dygraph-c91c859.min.js \ - lib/dygraph-smooth-plotter-c91c859.js \ - lib/fontawesome-all-5.0.1.min.js \ - lib/gauge-1.3.2.min.js \ - lib/jquery-2.2.4.min.js \ - lib/jquery.easypiechart-97b5824.min.js \ - lib/jquery.peity-3.2.0.min.js \ - lib/jquery.sparkline-2.1.2.min.js \ - lib/lz-string-1.4.4.min.js \ - lib/pako-1.0.6.min.js \ - lib/perfect-scrollbar-0.6.15.min.js \ - lib/tableExport-1.6.0.min.js \ - $(NULL) - -webcssdir = $(webdir)/css -dist_webcss_DATA = \ - css/morris-0.5.1.css \ - css/bootstrap-3.3.7.css \ - css/bootstrap-theme-3.3.7.min.css \ - css/bootstrap-slate-flat-3.3.7.css \ - css/bootstrap-slider-10.0.0.min.css \ - css/bootstrap-toggle-2.2.2.min.css \ - css/c3-0.4.18.min.css \ - $(NULL) - -webfontsdir = $(webdir)/fonts -dist_webfonts_DATA = \ - fonts/glyphicons-halflings-regular.eot \ - fonts/glyphicons-halflings-regular.svg \ - fonts/glyphicons-halflings-regular.ttf \ - fonts/glyphicons-halflings-regular.woff \ - fonts/glyphicons-halflings-regular.woff2 \ - $(NULL) - -webimagesdir = $(webdir)/images -dist_webimages_DATA = \ - images/netdata-logomark.svg \ - images/alert-128-orange.png \ - images/alert-128-red.png \ - images/alert-multi-size-orange.ico \ - images/alert-multi-size-red.ico \ - images/animated.gif \ - images/check-mark-2-128-green.png \ - images/check-mark-2-multi-size-green.ico \ - images/netdata.svg \ - images/post.png \ - images/android-icon-36x36.png \ - images/android-icon-48x48.png \ - images/android-icon-72x72.png \ - images/android-icon-96x96.png \ - images/android-icon-144x144.png \ - images/android-icon-192x192.png \ - images/apple-icon-57x57.png \ - images/apple-icon-60x60.png \ - images/apple-icon-72x72.png \ - images/apple-icon-76x76.png \ - images/apple-icon-114x114.png \ - images/apple-icon-120x120.png \ - images/apple-icon-144x144.png \ - images/apple-icon-152x152.png \ - images/apple-icon-180x180.png \ - images/apple-icon-precomposed.png \ - images/apple-icon.png \ - images/favicon-16x16.png \ - images/favicon-32x32.png \ - images/favicon-96x96.png \ - images/favicon.ico \ - images/ms-icon-70x70.png \ - images/ms-icon-144x144.png \ - images/ms-icon-150x150.png \ - images/ms-icon-310x310.png \ - images/banner-icon-144x144.png \ - $(NULL) - -webwellknowndir = $(webdir)/.well-known -dist_webwellknown_DATA = \ - $(NULL) - -webdntdir = $(webdir)/.well-known/dnt -dist_webdnt_DATA = \ - .well-known/dnt/cookies \ - $(NULL) - -all: all-am - -.SUFFIXES: -$(srcdir)/Makefile.in: @MAINTAINER_MODE_TRUE@ $(srcdir)/Makefile.am $(am__configure_deps) - @for dep in $?; do \ - case '$(am__configure_deps)' in \ - *$$dep*) \ - ( cd $(top_builddir) && $(MAKE) $(AM_MAKEFLAGS) am--refresh ) \ - && { if test -f $@; then exit 0; else break; fi; }; \ - exit 1;; \ - esac; \ - done; \ - echo ' cd $(top_srcdir) && $(AUTOMAKE) --gnu web/gui/Makefile'; \ - $(am__cd) $(top_srcdir) && \ - $(AUTOMAKE) --gnu web/gui/Makefile -Makefile: $(srcdir)/Makefile.in $(top_builddir)/config.status - @case '$?' in \ - *config.status*) \ - cd $(top_builddir) && $(MAKE) $(AM_MAKEFLAGS) am--refresh;; \ - *) \ - echo ' cd $(top_builddir) && $(SHELL) ./config.status $(subdir)/$@ $(am__depfiles_maybe)'; \ - cd $(top_builddir) && $(SHELL) ./config.status $(subdir)/$@ $(am__depfiles_maybe);; \ - esac; - -$(top_builddir)/config.status: $(top_srcdir)/configure $(CONFIG_STATUS_DEPENDENCIES) - cd $(top_builddir) && $(MAKE) $(AM_MAKEFLAGS) am--refresh - -$(top_srcdir)/configure: @MAINTAINER_MODE_TRUE@ $(am__configure_deps) - cd $(top_builddir) && $(MAKE) $(AM_MAKEFLAGS) am--refresh -$(ACLOCAL_M4): @MAINTAINER_MODE_TRUE@ $(am__aclocal_m4_deps) - cd $(top_builddir) && $(MAKE) $(AM_MAKEFLAGS) am--refresh -$(am__aclocal_m4_deps): -install-dist_webDATA: $(dist_web_DATA) - @$(NORMAL_INSTALL) - @list='$(dist_web_DATA)'; test -n "$(webdir)" || list=; \ - if test -n "$$list"; then \ - echo " $(MKDIR_P) '$(DESTDIR)$(webdir)'"; \ - $(MKDIR_P) "$(DESTDIR)$(webdir)" || exit 1; \ - fi; \ - for p in $$list; do \ - if test -f "$$p"; then d=; else d="$(srcdir)/"; fi; \ - echo "$$d$$p"; \ - done | $(am__base_list) | \ - while read files; do \ - echo " $(INSTALL_DATA) $$files '$(DESTDIR)$(webdir)'"; \ - $(INSTALL_DATA) $$files "$(DESTDIR)$(webdir)" || exit $$?; \ - done - -uninstall-dist_webDATA: - @$(NORMAL_UNINSTALL) - @list='$(dist_web_DATA)'; test -n "$(webdir)" || list=; \ - files=`for p in $$list; do echo $$p; done | sed -e 's|^.*/||'`; \ - dir='$(DESTDIR)$(webdir)'; $(am__uninstall_files_from_dir) -install-dist_webcssDATA: $(dist_webcss_DATA) - @$(NORMAL_INSTALL) - @list='$(dist_webcss_DATA)'; test -n "$(webcssdir)" || list=; \ - if test -n "$$list"; then \ - echo " $(MKDIR_P) '$(DESTDIR)$(webcssdir)'"; \ - $(MKDIR_P) "$(DESTDIR)$(webcssdir)" || exit 1; \ - fi; \ - for p in $$list; do \ - if test -f "$$p"; then d=; else d="$(srcdir)/"; fi; \ - echo "$$d$$p"; \ - done | $(am__base_list) | \ - while read files; do \ - echo " $(INSTALL_DATA) $$files '$(DESTDIR)$(webcssdir)'"; \ - $(INSTALL_DATA) $$files "$(DESTDIR)$(webcssdir)" || exit $$?; \ - done - -uninstall-dist_webcssDATA: - @$(NORMAL_UNINSTALL) - @list='$(dist_webcss_DATA)'; test -n "$(webcssdir)" || list=; \ - files=`for p in $$list; do echo $$p; done | sed -e 's|^.*/||'`; \ - dir='$(DESTDIR)$(webcssdir)'; $(am__uninstall_files_from_dir) -install-dist_webdntDATA: $(dist_webdnt_DATA) - @$(NORMAL_INSTALL) - @list='$(dist_webdnt_DATA)'; test -n "$(webdntdir)" || list=; \ - if test -n "$$list"; then \ - echo " $(MKDIR_P) '$(DESTDIR)$(webdntdir)'"; \ - $(MKDIR_P) "$(DESTDIR)$(webdntdir)" || exit 1; \ - fi; \ - for p in $$list; do \ - if test -f "$$p"; then d=; else d="$(srcdir)/"; fi; \ - echo "$$d$$p"; \ - done | $(am__base_list) | \ - while read files; do \ - echo " $(INSTALL_DATA) $$files '$(DESTDIR)$(webdntdir)'"; \ - $(INSTALL_DATA) $$files "$(DESTDIR)$(webdntdir)" || exit $$?; \ - done - -uninstall-dist_webdntDATA: - @$(NORMAL_UNINSTALL) - @list='$(dist_webdnt_DATA)'; test -n "$(webdntdir)" || list=; \ - files=`for p in $$list; do echo $$p; done | sed -e 's|^.*/||'`; \ - dir='$(DESTDIR)$(webdntdir)'; $(am__uninstall_files_from_dir) -install-dist_webfontsDATA: $(dist_webfonts_DATA) - @$(NORMAL_INSTALL) - @list='$(dist_webfonts_DATA)'; test -n "$(webfontsdir)" || list=; \ - if test -n "$$list"; then \ - echo " $(MKDIR_P) '$(DESTDIR)$(webfontsdir)'"; \ - $(MKDIR_P) "$(DESTDIR)$(webfontsdir)" || exit 1; \ - fi; \ - for p in $$list; do \ - if test -f "$$p"; then d=; else d="$(srcdir)/"; fi; \ - echo "$$d$$p"; \ - done | $(am__base_list) | \ - while read files; do \ - echo " $(INSTALL_DATA) $$files '$(DESTDIR)$(webfontsdir)'"; \ - $(INSTALL_DATA) $$files "$(DESTDIR)$(webfontsdir)" || exit $$?; \ - done - -uninstall-dist_webfontsDATA: - @$(NORMAL_UNINSTALL) - @list='$(dist_webfonts_DATA)'; test -n "$(webfontsdir)" || list=; \ - files=`for p in $$list; do echo $$p; done | sed -e 's|^.*/||'`; \ - dir='$(DESTDIR)$(webfontsdir)'; $(am__uninstall_files_from_dir) -install-dist_webimagesDATA: $(dist_webimages_DATA) - @$(NORMAL_INSTALL) - @list='$(dist_webimages_DATA)'; test -n "$(webimagesdir)" || list=; \ - if test -n "$$list"; then \ - echo " $(MKDIR_P) '$(DESTDIR)$(webimagesdir)'"; \ - $(MKDIR_P) "$(DESTDIR)$(webimagesdir)" || exit 1; \ - fi; \ - for p in $$list; do \ - if test -f "$$p"; then d=; else d="$(srcdir)/"; fi; \ - echo "$$d$$p"; \ - done | $(am__base_list) | \ - while read files; do \ - echo " $(INSTALL_DATA) $$files '$(DESTDIR)$(webimagesdir)'"; \ - $(INSTALL_DATA) $$files "$(DESTDIR)$(webimagesdir)" || exit $$?; \ - done - -uninstall-dist_webimagesDATA: - @$(NORMAL_UNINSTALL) - @list='$(dist_webimages_DATA)'; test -n "$(webimagesdir)" || list=; \ - files=`for p in $$list; do echo $$p; done | sed -e 's|^.*/||'`; \ - dir='$(DESTDIR)$(webimagesdir)'; $(am__uninstall_files_from_dir) -install-dist_weblibDATA: $(dist_weblib_DATA) - @$(NORMAL_INSTALL) - @list='$(dist_weblib_DATA)'; test -n "$(weblibdir)" || list=; \ - if test -n "$$list"; then \ - echo " $(MKDIR_P) '$(DESTDIR)$(weblibdir)'"; \ - $(MKDIR_P) "$(DESTDIR)$(weblibdir)" || exit 1; \ - fi; \ - for p in $$list; do \ - if test -f "$$p"; then d=; else d="$(srcdir)/"; fi; \ - echo "$$d$$p"; \ - done | $(am__base_list) | \ - while read files; do \ - echo " $(INSTALL_DATA) $$files '$(DESTDIR)$(weblibdir)'"; \ - $(INSTALL_DATA) $$files "$(DESTDIR)$(weblibdir)" || exit $$?; \ - done - -uninstall-dist_weblibDATA: - @$(NORMAL_UNINSTALL) - @list='$(dist_weblib_DATA)'; test -n "$(weblibdir)" || list=; \ - files=`for p in $$list; do echo $$p; done | sed -e 's|^.*/||'`; \ - dir='$(DESTDIR)$(weblibdir)'; $(am__uninstall_files_from_dir) -install-dist_webstaticDATA: $(dist_webstatic_DATA) - @$(NORMAL_INSTALL) - @list='$(dist_webstatic_DATA)'; test -n "$(webstaticdir)" || list=; \ - if test -n "$$list"; then \ - echo " $(MKDIR_P) '$(DESTDIR)$(webstaticdir)'"; \ - $(MKDIR_P) "$(DESTDIR)$(webstaticdir)" || exit 1; \ - fi; \ - for p in $$list; do \ - if test -f "$$p"; then d=; else d="$(srcdir)/"; fi; \ - echo "$$d$$p"; \ - done | $(am__base_list) | \ - while read files; do \ - echo " $(INSTALL_DATA) $$files '$(DESTDIR)$(webstaticdir)'"; \ - $(INSTALL_DATA) $$files "$(DESTDIR)$(webstaticdir)" || exit $$?; \ - done - -uninstall-dist_webstaticDATA: - @$(NORMAL_UNINSTALL) - @list='$(dist_webstatic_DATA)'; test -n "$(webstaticdir)" || list=; \ - files=`for p in $$list; do echo $$p; done | sed -e 's|^.*/||'`; \ - dir='$(DESTDIR)$(webstaticdir)'; $(am__uninstall_files_from_dir) -install-dist_webwellknownDATA: $(dist_webwellknown_DATA) - @$(NORMAL_INSTALL) - @list='$(dist_webwellknown_DATA)'; test -n "$(webwellknowndir)" || list=; \ - if test -n "$$list"; then \ - echo " $(MKDIR_P) '$(DESTDIR)$(webwellknowndir)'"; \ - $(MKDIR_P) "$(DESTDIR)$(webwellknowndir)" || exit 1; \ - fi; \ - for p in $$list; do \ - if test -f "$$p"; then d=; else d="$(srcdir)/"; fi; \ - echo "$$d$$p"; \ - done | $(am__base_list) | \ - while read files; do \ - echo " $(INSTALL_DATA) $$files '$(DESTDIR)$(webwellknowndir)'"; \ - $(INSTALL_DATA) $$files "$(DESTDIR)$(webwellknowndir)" || exit $$?; \ - done - -uninstall-dist_webwellknownDATA: - @$(NORMAL_UNINSTALL) - @list='$(dist_webwellknown_DATA)'; test -n "$(webwellknowndir)" || list=; \ - files=`for p in $$list; do echo $$p; done | sed -e 's|^.*/||'`; \ - dir='$(DESTDIR)$(webwellknowndir)'; $(am__uninstall_files_from_dir) -tags TAGS: - -ctags CTAGS: - -cscope cscopelist: - - -distdir: $(DISTFILES) - @srcdirstrip=`echo "$(srcdir)" | sed 's/[].[^$$\\*]/\\\\&/g'`; \ - topsrcdirstrip=`echo "$(top_srcdir)" | sed 's/[].[^$$\\*]/\\\\&/g'`; \ - list='$(DISTFILES)'; \ - dist_files=`for file in $$list; do echo $$file; done | \ - sed -e "s|^$$srcdirstrip/||;t" \ - -e "s|^$$topsrcdirstrip/|$(top_builddir)/|;t"`; \ - case $$dist_files in \ - */*) $(MKDIR_P) `echo "$$dist_files" | \ - sed '/\//!d;s|^|$(distdir)/|;s,/[^/]*$$,,' | \ - sort -u` ;; \ - esac; \ - for file in $$dist_files; do \ - if test -f $$file || test -d $$file; then d=.; else d=$(srcdir); fi; \ - if test -d $$d/$$file; then \ - dir=`echo "/$$file" | sed -e 's,/[^/]*$$,,'`; \ - if test -d "$(distdir)/$$file"; then \ - find "$(distdir)/$$file" -type d ! -perm -700 -exec chmod u+rwx {} \;; \ - fi; \ - if test -d $(srcdir)/$$file && test $$d != $(srcdir); then \ - cp -fpR $(srcdir)/$$file "$(distdir)$$dir" || exit 1; \ - find "$(distdir)/$$file" -type d ! -perm -700 -exec chmod u+rwx {} \;; \ - fi; \ - cp -fpR $$d/$$file "$(distdir)$$dir" || exit 1; \ - else \ - test -f "$(distdir)/$$file" \ - || cp -p $$d/$$file "$(distdir)/$$file" \ - || exit 1; \ - fi; \ - done -check-am: all-am -check: check-am -all-am: Makefile $(DATA) -installdirs: - for dir in "$(DESTDIR)$(webdir)" "$(DESTDIR)$(webcssdir)" "$(DESTDIR)$(webdntdir)" "$(DESTDIR)$(webfontsdir)" "$(DESTDIR)$(webimagesdir)" "$(DESTDIR)$(weblibdir)" "$(DESTDIR)$(webstaticdir)" "$(DESTDIR)$(webwellknowndir)"; do \ - test -z "$$dir" || $(MKDIR_P) "$$dir"; \ - done -install: install-am -install-exec: install-exec-am -install-data: install-data-am -uninstall: uninstall-am - -install-am: all-am - @$(MAKE) $(AM_MAKEFLAGS) install-exec-am install-data-am - -installcheck: installcheck-am -install-strip: - if test -z '$(STRIP)'; then \ - $(MAKE) $(AM_MAKEFLAGS) INSTALL_PROGRAM="$(INSTALL_STRIP_PROGRAM)" \ - install_sh_PROGRAM="$(INSTALL_STRIP_PROGRAM)" INSTALL_STRIP_FLAG=-s \ - install; \ - else \ - $(MAKE) $(AM_MAKEFLAGS) INSTALL_PROGRAM="$(INSTALL_STRIP_PROGRAM)" \ - install_sh_PROGRAM="$(INSTALL_STRIP_PROGRAM)" INSTALL_STRIP_FLAG=-s \ - "INSTALL_PROGRAM_ENV=STRIPPROG='$(STRIP)'" install; \ - fi -mostlyclean-generic: - -clean-generic: - -test -z "$(CLEANFILES)" || rm -f $(CLEANFILES) - -distclean-generic: - -test -z "$(CONFIG_CLEAN_FILES)" || rm -f $(CONFIG_CLEAN_FILES) - -test . = "$(srcdir)" || test -z "$(CONFIG_CLEAN_VPATH_FILES)" || rm -f $(CONFIG_CLEAN_VPATH_FILES) - -maintainer-clean-generic: - @echo "This command is intended for maintainers to use" - @echo "it deletes files that may require special tools to rebuild." - -test -z "$(MAINTAINERCLEANFILES)" || rm -f $(MAINTAINERCLEANFILES) -clean: clean-am - -clean-am: clean-generic mostlyclean-am - -distclean: distclean-am - -rm -f Makefile -distclean-am: clean-am distclean-generic - -dvi: dvi-am - -dvi-am: - -html: html-am - -html-am: - -info: info-am - -info-am: - -install-data-am: install-dist_webDATA install-dist_webcssDATA \ - install-dist_webdntDATA install-dist_webfontsDATA \ - install-dist_webimagesDATA install-dist_weblibDATA \ - install-dist_webstaticDATA install-dist_webwellknownDATA - -install-dvi: install-dvi-am - -install-dvi-am: - -install-exec-am: - -install-html: install-html-am - -install-html-am: - -install-info: install-info-am - -install-info-am: - -install-man: - -install-pdf: install-pdf-am - -install-pdf-am: - -install-ps: install-ps-am - -install-ps-am: - -installcheck-am: - -maintainer-clean: maintainer-clean-am - -rm -f Makefile -maintainer-clean-am: distclean-am maintainer-clean-generic - -mostlyclean: mostlyclean-am - -mostlyclean-am: mostlyclean-generic - -pdf: pdf-am - -pdf-am: - -ps: ps-am - -ps-am: - -uninstall-am: uninstall-dist_webDATA uninstall-dist_webcssDATA \ - uninstall-dist_webdntDATA uninstall-dist_webfontsDATA \ - uninstall-dist_webimagesDATA uninstall-dist_weblibDATA \ - uninstall-dist_webstaticDATA uninstall-dist_webwellknownDATA - -.MAKE: install-am install-strip - -.PHONY: all all-am check check-am clean clean-generic cscopelist-am \ - ctags-am distclean distclean-generic distdir dvi dvi-am html \ - html-am info info-am install install-am install-data \ - install-data-am install-dist_webDATA install-dist_webcssDATA \ - install-dist_webdntDATA install-dist_webfontsDATA \ - install-dist_webimagesDATA install-dist_weblibDATA \ - install-dist_webstaticDATA install-dist_webwellknownDATA \ - install-dvi install-dvi-am install-exec install-exec-am \ - install-html install-html-am install-info install-info-am \ - install-man install-pdf install-pdf-am install-ps \ - install-ps-am install-strip installcheck installcheck-am \ - installdirs maintainer-clean maintainer-clean-generic \ - mostlyclean mostlyclean-generic pdf pdf-am ps ps-am tags-am \ - uninstall uninstall-am uninstall-dist_webDATA \ - uninstall-dist_webcssDATA uninstall-dist_webdntDATA \ - uninstall-dist_webfontsDATA uninstall-dist_webimagesDATA \ - uninstall-dist_weblibDATA uninstall-dist_webstaticDATA \ - uninstall-dist_webwellknownDATA - -.PRECIOUS: Makefile - - -dashboard.js: $(DASHBOARD_JS_FILES) - if test -f $@; then rm -f $@; fi - cat $(DASHBOARD_JS_FILES) > $@.tmp && mv $@.tmp $@ - -version.txt: - if test -d "$(top_srcdir)/.git"; then \ - git --git-dir="$(top_srcdir)/.git" log -n 1 --format=%H; \ - fi > $@.tmp - test -s $@.tmp || echo 0 > $@.tmp - mv $@.tmp $@ - -# regenerate these files, even if they are up to date -.PHONY: version.txt dashboard.js - -# Tell versions [3.59,3.63) of GNU make to not export all variables. -# Otherwise a system limit (for SysV at least) may be exceeded. -.NOEXPORT: diff --git a/web/gui/README.md b/web/gui/README.md index cb7dc8987..c13f3d6cb 100644 --- a/web/gui/README.md +++ b/web/gui/README.md @@ -1,97 +1,108 @@ -# The standard web dashboard +<!-- +title: "Local Agent dashboard" +description: "The local Netdata Agent dashboard is the heart of health monitoring and performance troubleshooting, with hundreds of real-time charts." +custom_edit_url: https://github.com/netdata/netdata/edit/master/web/gui/README.md +--> -The standard web dashboard is the heart of Netdata's performance troubleshooting -toolkit. You've probably seen it before: +# Local Agent dashboard - +The local Netdata Agent dashboard is the heart of Netdata's performance troubleshooting toolkit. You've probably seen it +before: -Learn more about how dashboards work and how they're populated using the -`dashboards.js` file in our [web dashboards overview](../). + -By default, Netdata starts a web server for its dashboard at port `19999`. Open -up your web browser of choice and navigate to `http://SERVER-IP:19999`, or -`http://localhost:19999` on `localhost`. +Learn more about how dashboards work and how they're populated using the `dashboards.js` file in our [web dashboards +overview](/web/README.md). -Netdata uses an [internal, static-threaded web server](../server/) to host the -HTML, CSS, and JavaScript files that make up the standard dashboard. You don't -have to configure anything to access it, although you can adjust [your -settings](../server/#other-netdataconf-web-section-options) in the -`netdata.conf` file, or run Netdata behind an Nginx proxy, and so on. +By default, Netdata starts a web server for its dashboard at port `19999`. Open up your web browser of choice and +navigate to `http://NODE:19999`, replacing `NODE` with the IP address or hostname of your Agent. If you're unsure, try +`http://localhost:19999` first. -## Navigating the standard dashboard +Netdata uses an [internal, static-threaded web server](/web/server/README.md) to host the HTML, CSS, and JavaScript +files that make up the local Agent dashboard. You don't have to configure anything to access it, although you can adjust +[your settings](/web/server/README.md#other-netdataconf-web-section-options) in the `netdata.conf` file, or run Netdata +behind an [Nginx proxy](https://learn.netdata.cloud/docs/agent/running-behind-nginx), and so on. -Beyond charts, the standard dashboard can be broken down into three key areas: +## Navigating the local dashboard + +Beyond charts, the local dashboard can be broken down into three key areas: 1. [**Sections**](#sections) -2. [**Menus/submenus**](#menus) -3. [**Nodes menu**](#nodes-menu) +2. [**Time & date picker](#time--date-picker) +3. [**Metrics menus/submenus**](#metrics-menus) +4. [**Netdata Cloud menus: Spaces, War Rooms, and Visited nodes)**](#cloud-menus-spaces-war-rooms-and-visited-nodes) -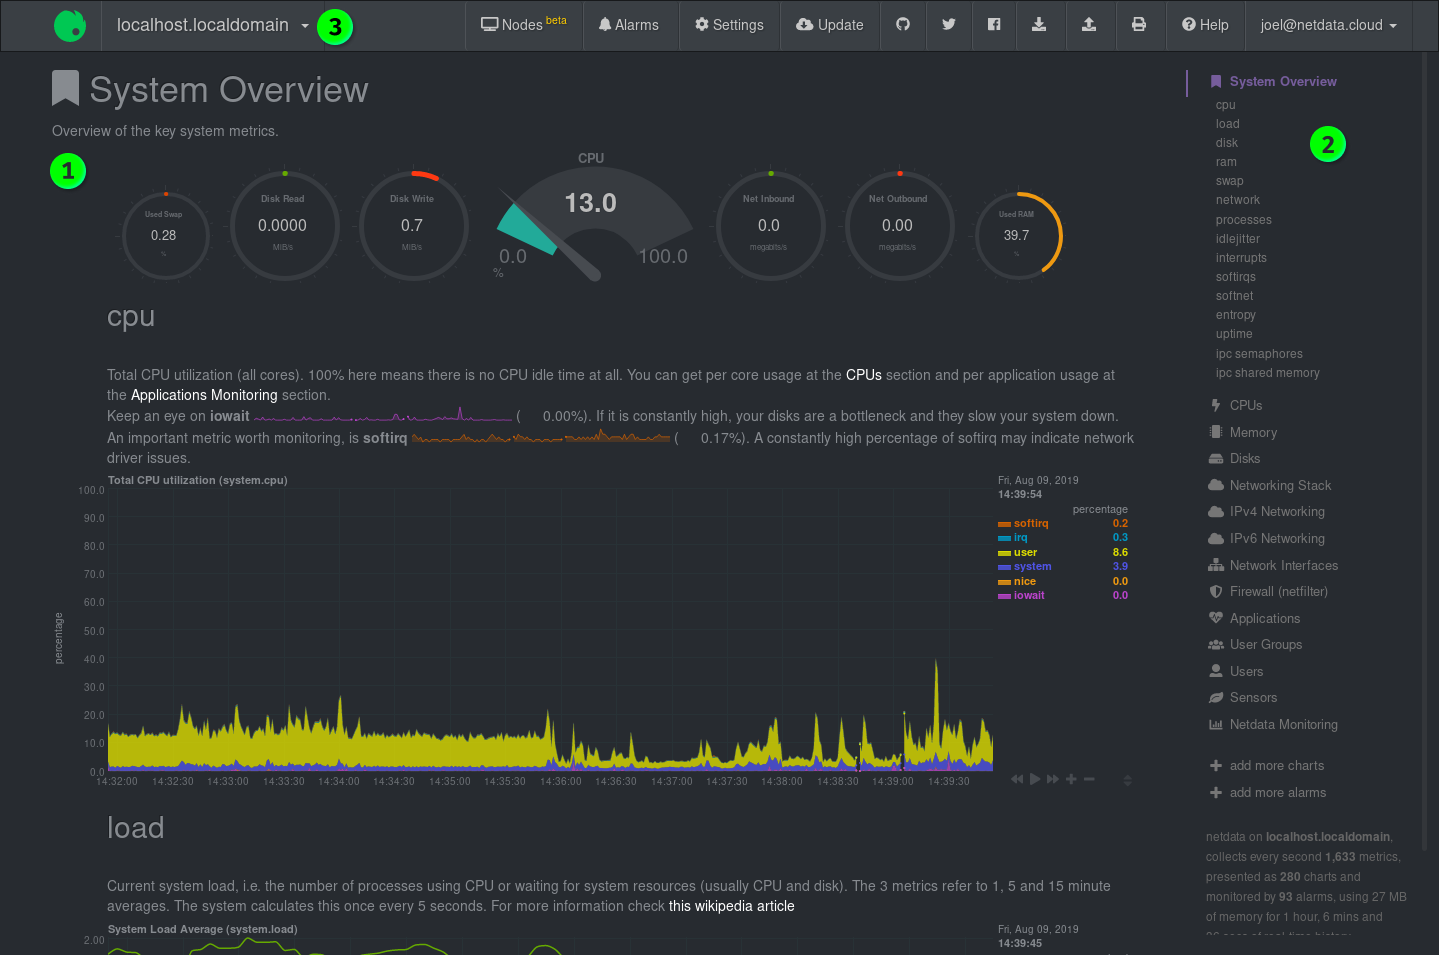 +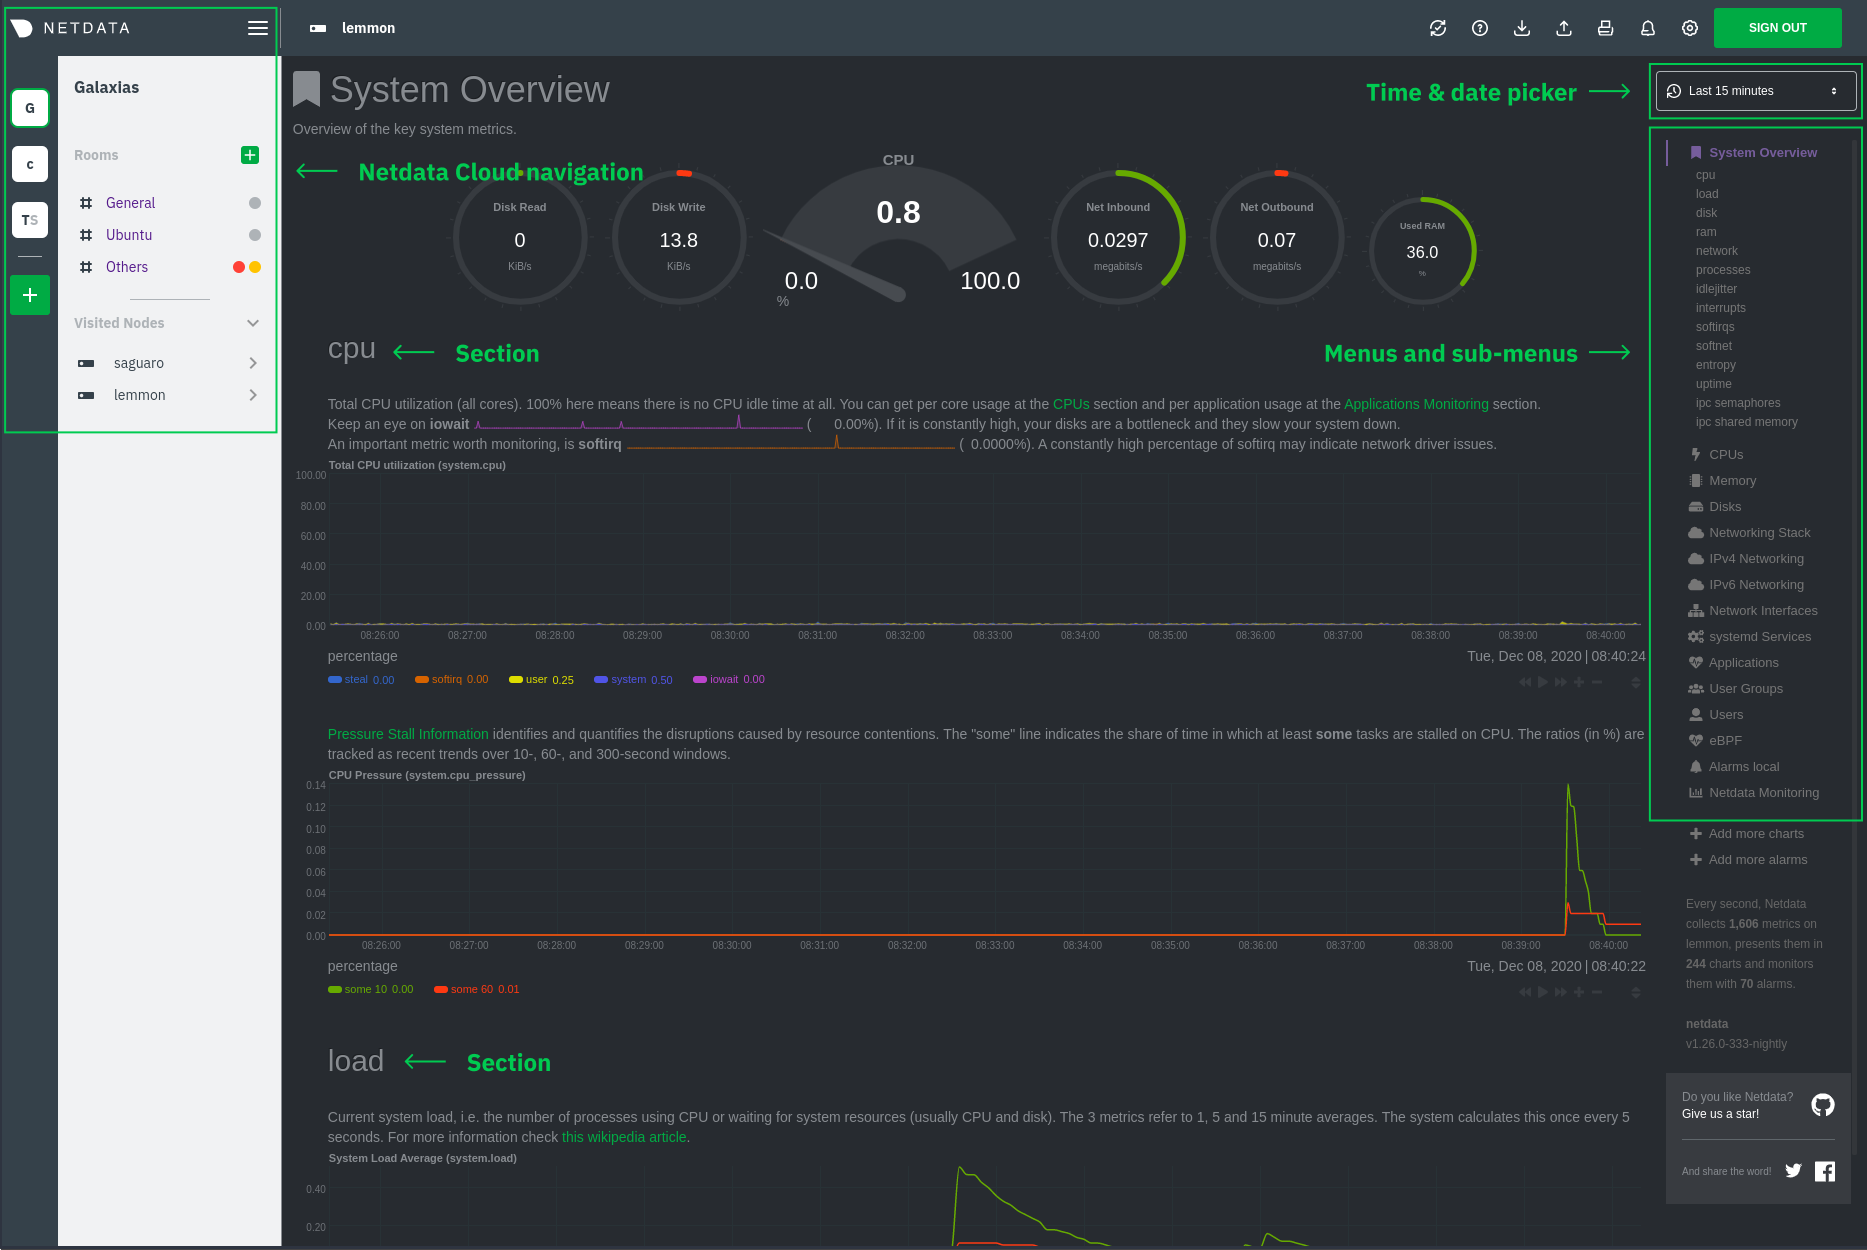 ### Sections Netdata is broken up into multiple **sections**, such as **System Overview**, **CPU**, **Disk**, and more. Inside each section you'll find a number of charts, -broken down into [contexts](../#contexts) and -[families](../#families). +broken down into [contexts](/web/README.md#contexts) and +[families](/web/README.md#families). An example of the **Memory** section on a Linux desktop system. 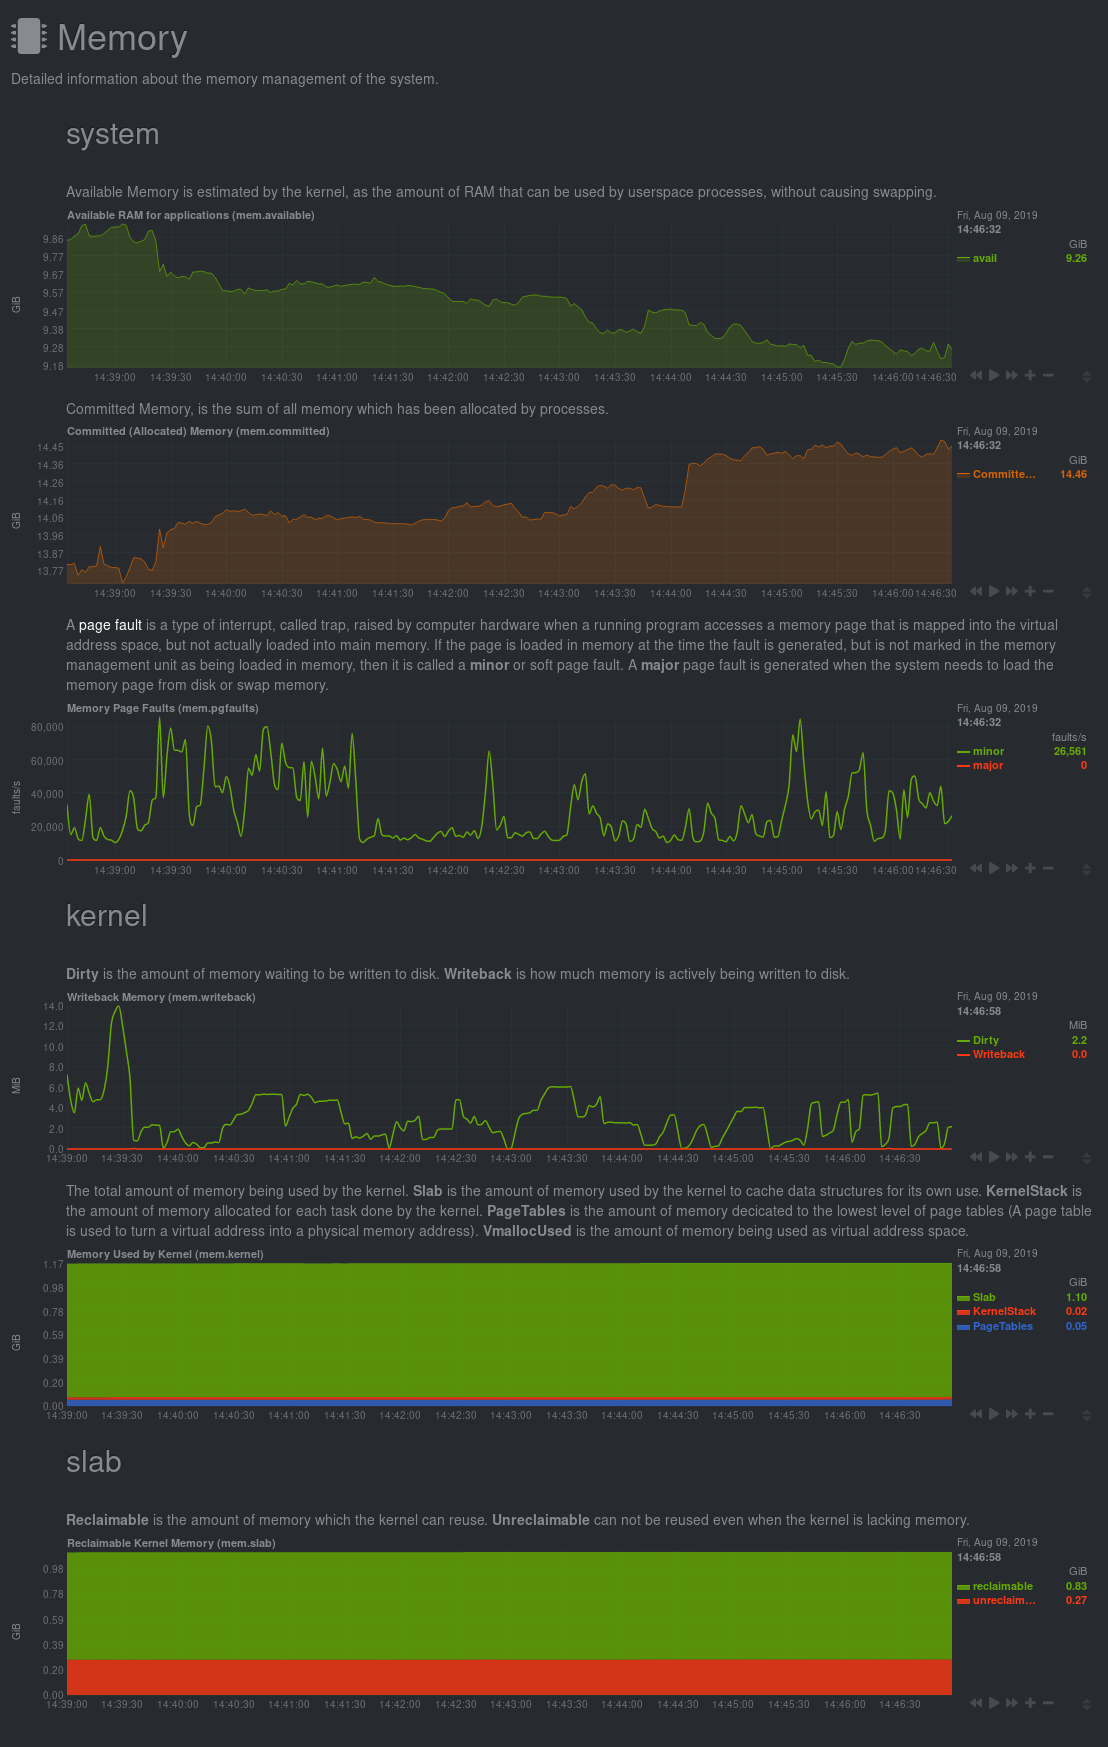 +dashboard](https://user-images.githubusercontent.com/1153921/101508423-e354cc00-3934-11eb-9b33-3ad57a5988b4.png) -All sections and their associated charts appear on a single "page," so all you -need to do to view different sections is scroll up and down the page. But it's -usually quicker to use the [menus](#menus). +All sections and their associated charts appear on a single page, so all you need to do to view different sections is +scroll up and down. But it's usually quicker to use the [menus](#metrics-menus). -### Menus +### Time & date picker -**Menus** appears on the right-hand side of the standard dashboard. Netdata -generates a menu for each section, and menus link to the section they're -associated with. +The local dashboard features a time & date picker to help you visualize specific timeframes of historical metrics. The +picker chooses an appropriate default to always show per-second granularity based on the width of your browser's +viewport. -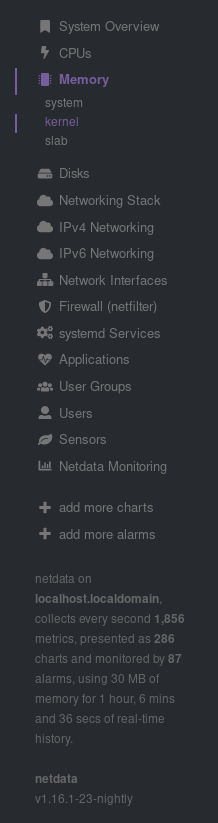 +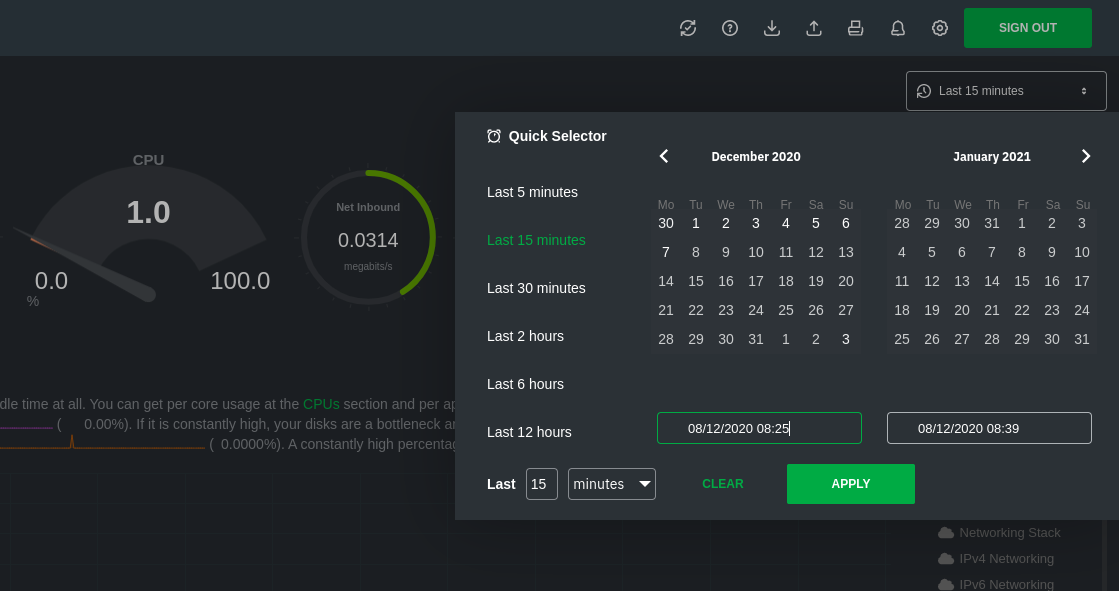 -Most menu items will contain several **submenu** entries, which represent any -[families](../#families) from that section. Netdata automatically -generates these submenu entries. +Use the Quick Selector to show metrics from the last 5 minutes, 15 minutes, 30 minutes, 2 hours, 6 hours, or 12 hours. -Here's a **Disks** menu with several submenu entries for each disk drive and -partition Netdata recognizes. +Beneath the Quick Selector is an input field and dropdown you use in combination to select a specific timeframe of +minutes, hours, days, or months. Enter a number and choose the appropriate unit of time. + +Use the calendar to select multiple days. Click on a date to begin the timeframe selection, then an ending date. + +Click **Apply** to re-render all visualizations with new metrics data, or **Clear** to restore the default timeframe. -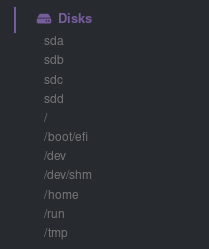 +[Increase the metrics retention policy](/docs/store/change-metrics-storage.md) for your node to see more historical +timeframes. -### Nodes menu +### Metrics menus -The nodes menu appears in the top-left corner of the standard dashboard and is -labeled with the hostname of the system Netdata is monitoring. +**Metrics menus** appears on the right-hand side of the local Agent dashboard. Netdata generates a menu for each +section, and menus link to the section they're associated with. -Clicking on it will display a drop-down menu of any nodes you might have -connected via the [Netdata registry](../../registry/). By default, you'll find -nothing under the **My nodes** heading, but you can try out any of the demo -Netdata nodes to see how the nodes menu works. +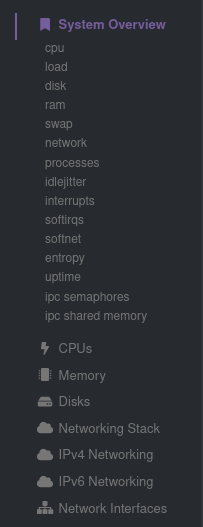 + +Most metrics menu items will contain several **submenu** entries, which represent any +[families](/web/README.md#families) from that section. Netdata automatically +generates these submenu entries. + +Here's a **Disks** menu with several submenu entries for each disk drive and +partition Netdata recognizes. -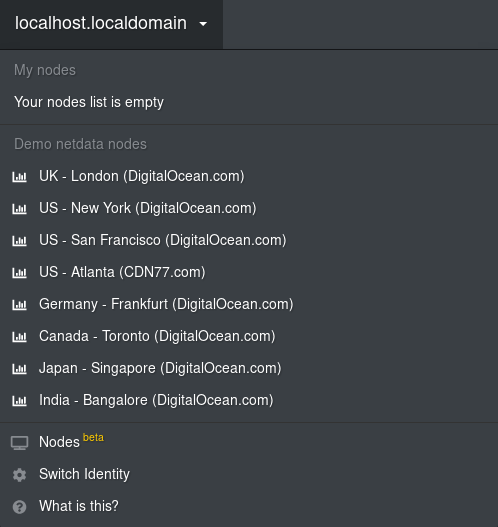 +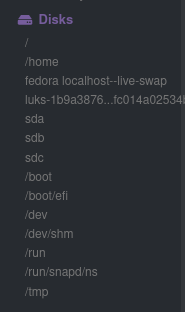 -Once you add nodes via [Netdata Cloud](../../docs/netdata-cloud/) or a [private -registry](../../registry/#run-your-own-registry), you will see them appear under -the **My nodes** heading. +### Cloud menus (Spaces, War Rooms, and Visited nodes) -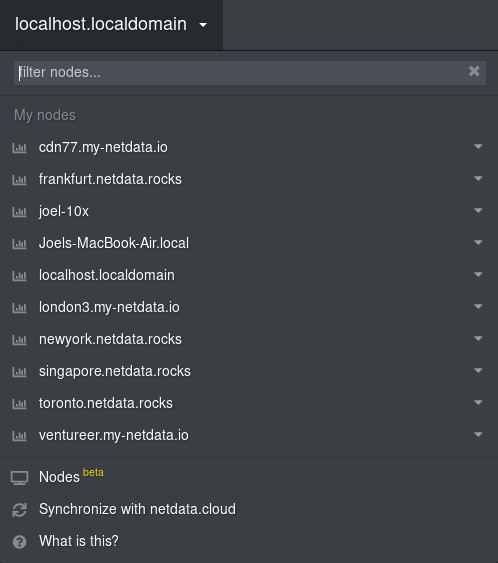 +The dashboard also features a menu related to Netdata Cloud functionality. You can view your existing Spaces or create +new ones via the left vertical column of boxes. This menu also displays the name of your current Space, shows a list of +any War Rooms you've added you your Space, and lists any notes you recently visited via their Agent dashboards. Click on +a War Room's name to jump to the Netdata Cloud web interface. -The nodes menu will also show the master netdata node and all slave nodes -streaming to that master, if you have [configured streaming](../../streaming). +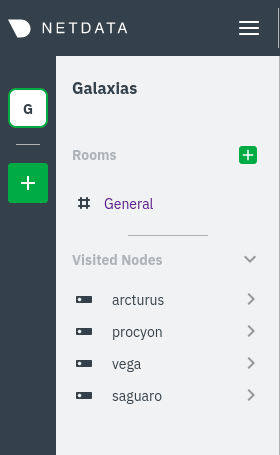 -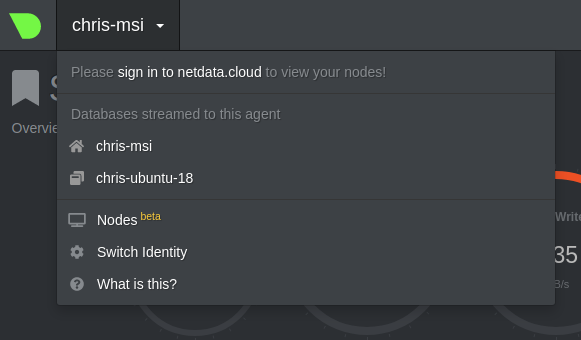 +If you want to know more about how Cloud populates this menu, and the Agent-Cloud integration at a high level, see our +document on [using the Agent with Netdata Cloud](/docs/agent-cloud.md). -## Customizing the standard dashboard +## Customizing the local dashboard Netdata stores information about individual charts in the `dashboard_info.js` file. This file includes section and subsection headings, descriptions, colors, @@ -114,8 +125,7 @@ If you want to customize this information, you should avoid editing overwrite the file when it's updated. Instead, you should create a new file with your customizations. -We created an example file at -[`dashboard_info_custom_example.js`](dashboard_info_custom_example.js). You can +We created an example file at `dashboard_info_custom_example.js`. You can copy this to a new file with a name of your choice in the `web/` directory. This directory changes based on your operating system and installation method. If you're on a Linux system, it should be at `/usr/share/netdata/web/`. @@ -153,7 +163,7 @@ file](https://user-images.githubusercontent.com/1153921/62798924-570e6c80-ba94-1 ## Custom dashboards -For information on creating custom dashboards from scratch, see the [custom -dashboards](custom/) or [Atlassian Confluence dashboards](confluence/) guides. +For information on creating custom dashboards from scratch, see the [custom dashboards](/web/gui/custom/README.md) or +[Atlassian Confluence dashboards](/web/gui/confluence/README.md) guides. []() diff --git a/web/gui/browserconfig.xml b/web/gui/browserconfig.xml new file mode 100644 index 000000000..32f47595e --- /dev/null +++ b/web/gui/browserconfig.xml @@ -0,0 +1,2 @@ +<?xml version="1.0" encoding="utf-8"?> +<browserconfig><msapplication><tile><square70x70logo src="images/ms-icon-70x70.png"/><square150x150logo src="images/ms-icon-150x150.png"/><square310x310logo src="images/ms-icon-310x310.png"/><TileColor>#ffffff</TileColor></tile></msapplication></browserconfig> diff --git a/web/gui/confluence/README.md b/web/gui/confluence/README.md index 221948357..2e929e7d1 100644 --- a/web/gui/confluence/README.md +++ b/web/gui/confluence/README.md @@ -1,3 +1,8 @@ +<!-- +title: "Atlassian Confluence dashboards" +custom_edit_url: https://github.com/netdata/netdata/edit/master/web/gui/confluence/README.md +--> + # Atlassian Confluence dashboards With Netdata you can build **live, interactive, monitoring dashboards** directly on Atlassian's **Confluence** pages. @@ -78,7 +83,9 @@ Hit **update** and you will get this: This badge is now auto-refreshing. It will update itself based on the update frequency of the alarm. -> Keep in mind you can add badges with custom Netdata queries too. Netdata automatically creates badges for all the alarms, but every chart, every dimension on every chart, can be used for a badge. And Netdata badges are quite powerful! Check [Creating Badges](../../api/badges/) for more information on badges. +> Keep in mind you can add badges with custom Netdata queries too. Netdata automatically creates badges for all the +> alarms, but every chart, every dimension on every chart, can be used for a badge. And Netdata badges are quite +> powerful! Check [Creating Badges](/web/api/badges/README.md) for more information on badges. So, let's create a table and add this badge for both our web servers: diff --git a/web/gui/custom/README.md b/web/gui/custom/README.md index c8d5c164a..733ef5211 100644 --- a/web/gui/custom/README.md +++ b/web/gui/custom/README.md @@ -1,3 +1,9 @@ +<!-- +title: "Custom dashboards" +description: "Build custom dashboards with key metrics from one or more nodes running the Netdata Agent and host them anywhere." +custom_edit_url: https://github.com/netdata/netdata/edit/master/web/gui/custom/README.md +--> + # Custom dashboards You can: @@ -10,16 +16,16 @@ You can: You can also add Netdata charts to existing web pages. -Check this **[very simple working example of a custom -dashboard](http://netdata.firehol.org/demo.html)**, and its **[html -source](../demo.html)**. +Check this **[very simple working example of a custom dashboard](http://netdata.firehol.org/demo.html)**, and its +**[html source](https://raw.githubusercontent.com/netdata/netdata/master/web/gui/demo.html)**. You should also look at the [custom dashboard template](https://my-netdata.io/dashboard.html), which contains samples of all -supported charts. The code is [here](../dashboard.html). +supported charts. The code is [here](https://raw.githubusercontent.com/netdata/netdata/master/web/gui/dashboard.html). -If you plan to put the dashboard on TV, check out [tv.html](../tv.html). Here's -is a screenshot of it, monitoring two servers on the same page: +If you plan to put the dashboard on TV, check out +[tv.html](https://raw.githubusercontent.com/netdata/netdata/master/web/gui/tv.html). Here's is a screenshot of it, +monitoring two servers on the same page:  @@ -65,7 +71,11 @@ header: ## Dash (Multi-Host Dashboard) -`dash-example.html` is an all-in-one page that automatically fetches graphs from all your hosts. Just add your graphs and charts (or use the defaults) one time using the `dash-*` syntax and it will be automatically replicated for all of your hosts; showing alarms and graphs for all your hosts on **one page!** +`dash-example.html` is an all-in-one page that automatically fetches graphs from all your hosts. Just add your graphs and charts (or use the defaults) one time using the `dash-*` syntax, and your selections will be automatically replicated for all of your hosts; showing alarms and graphs for all your hosts on **one page!** + +__**Dash will only work if you have implemented netdata streaming using `stream.conf`**__ + +`dash-example.html` was created as an experiment to demonstrate the capabilities of netdata in a multi-host environment. If you desire more features, submit a pull request or check out Netdata Cloud! ### Configure Dash @@ -74,29 +84,31 @@ First, rename the file so it doesn't get overwritten. For instance, with a webro cp /usr/share/netdata/web/dash-example.html /usr/share/netdata/web/dash.html ``` -Change the following line in `dash.html` to reflect your URLs. The second URL is used if you access your netdata dashboard from a reverse proxy. The reverse proxy URL is optional, if it is not set then both will use the netdata host URL. +Find and change the following line in `dash.html` to reflect your Netdata URLs. The second URL is only used if you access your Netdata dashboard through a reverse proxy. The reverse proxy URL is optional; if it is not set then both will use the Netdata host URL. ```js /* * TUTORIAL: Change this to the URL of your netdata host * If you use netdata behind a reverse proxy, add a second parameter for the reverse proxy url like so: -* new Dash('http://localhost:19999', 'https://my-domain.com/stats'); +* new Dash('http://localhost:19999', 'https://my-domain.com/stats'); */ var dash = new Dash('http://localhost:19999'); ``` -If you want to change the graphs or styling to fit your needs, just add an element to the page as shown. child divs will be generated to create your graph/chart: +### The `dash-*` Syntax + +If you want to change the graphs or styling to fit your needs, just add an element to the page as shown. Child divs will be generated to create your graph/chart: ``` -<div class="dash-graph" <---- Use class dash-graph for line graphs, etc - data-dash-netdata="system.cpu" <---- REQUIRED: Use data-dash-netdata to set the data source - data-dygraph-valuerange="[0, 100]"> <---- OPTIONAL: This overrides the default config. Any other data-* attributes will -</div> be added to the generated div, so you can set any desired options here +<div class="dash-graph" <---- Use class dash-graph for line graphs, etc + data-dash-netdata="system.cpu" <---- REQUIRED: Use data-dash-netdata to set the data source + data-dygraph-valuerange="[0, 100]"> <---- OPTIONAL: This overrides the default config. Any other data-* attributes will +</div> be added to the generated div, so you can set any desired options here -<div class="dash-chart" <---- Use class dash-chart for pie charts, etc. CHARTS ARE SQUARE - data-dash-netdata="system.io" <---- REQUIRED: Use data-dash-netdata to set the data source - data-dimensions="in" <---- Use this to override or append default options - data-title="Disk Read" <---- Use this to override or append default options - data-common-units="dash.io"> <---- Use this to override or append default options +<div class="dash-chart" <---- Use class dash-chart for pie charts, etc. CHARTS ARE SQUARE + data-dash-netdata="system.io" <---- REQUIRED: Use data-dash-netdata to set the data source + data-dimensions="in" <---- Use this to override or append default options + data-title="Disk Read" <---- Use this to override or append default options + data-common-units="dash.io"> <---- Use this to override or append default options </div> ``` @@ -104,7 +116,7 @@ To change the sizes of graphs and charts, find the `Dash.options` object in `das ```js /* * TUTORIAL: Change your graph/chart dimensions here. Host columns will automatically adjust. -* Charts are square! Their width is the same as their height. +* Charts are square! Their width is the same as their height. */ this.options = { graph_width: '40em', @@ -115,6 +127,10 @@ this.options = { To change the display order of your hosts, which is saved in localStorage, click the settings gear in the lower right corner +We hope you like it! + +--- + ## dashboard.js @@ -166,14 +182,14 @@ by adding this fragment before loading it: ```html <script>var netdataDontStart = true;</script> -`" +``` The above, will inform the `dashboard.js` to load everything, but not process the web page until you tell it to. You can tell it to start processing the page, by running this javascript code: ```js NETDATA.start(); -`" +``` Be careful not to call the `NETDATA.start()` multiple times. Each call to this function will spawn a new thread that will start refreshing the charts. @@ -284,9 +300,8 @@ Each chart can get data from a different Netdata server. You can specify the Net ></div> ``` -If you have ephemeral monitoring setup ([More info -here](../../../streaming/#monitoring-ephemeral-nodes)) and have no direct access -to the nodes dashboards, you can use the following: +If you have ephemeral monitoring setup ([More info here](/streaming/README.md#monitoring-ephemeral-nodes)) and have no +direct access to the nodes dashboards, you can use the following: ```html <div data-netdata="unique.id" @@ -309,7 +324,7 @@ Netdata supports a number of chart libraries. The default chart library is Each chart library has a number of specific settings. To learn more about them, you should investigate the documentation of the given chart library, or visit the appropriate JavaScript file that defines the library's options. These files -are concatenated into the monolithin `dashboard.js` for deployment. +are concatenated into the monolithic `dashboard.js` for deployment. - [Dygraph](https://github.com/netdata/netdata/blob/5b57fc441c40959514c4e2d0863be2e6a417e352/web/gui/dashboard.js#L2034) - [d3](https://github.com/netdata/netdata/blob/5b57fc441c40959514c4e2d0863be2e6a417e352/web/gui/dashboard.js#L4095) @@ -409,7 +424,7 @@ select specific dimensions using this: ``` Netdata supports coma (`,`) or pipe (`|`) separated [simple -patterns](../../../libnetdata/simple_pattern/) for dimensions. By default it +patterns](/libnetdata/simple_pattern/README.md) for dimensions. By default it searches for both dimension IDs and dimension NAMEs. You can control the target of the match with: `data-append-options="match-ids"` or `data-append-options="match-names"`. Spaces in `data-dimensions=""` are matched @@ -477,7 +492,7 @@ it, using this: ### API options -You can append Netdata **[REST API v1](../../api)** data options, using this: +You can append Netdata **[REST API v1](/web/api/README.md)** data options, using this: ```html <div data-netdata="unique.id" @@ -602,10 +617,11 @@ provided by the snippet: data-easypiechart-min-value="20" data-easypiechart-max-value="40" ></div> -`" +``` + In the first example, a value of `30`, without specifying the minimum, fills the chart bar to '75 %` (100% / 40 * 30). However, in this example the range is now `20` (40 - 20 = 20). The value `30` will fill the chart to ** '50 %`**, since it's in the middle between 20 and 40. -This szenario is useful if you have metrics that change only within a specific range, e.g. temperatures that are very unlikely to fall out of range. In these cases it is more useful to have the chart render the values between the given min and max, to better highlight the changes within them. +This scenario is useful if you have metrics that change only within a specific range, e.g. temperatures that are very unlikely to fall out of range. In these cases it is more useful to have the chart render the values between the given min and max, to better highlight the changes within them. #### Negative values diff --git a/web/gui/dash-example.html b/web/gui/dash-example.html index 231fec8ce..b1ff1af82 100644 --- a/web/gui/dash-example.html +++ b/web/gui/dash-example.html @@ -1,104 +1,106 @@ <!DOCTYPE html> <html lang="en"> <head> - <meta http-equiv="Content-Type" content="text/html; charset=utf-8"> - <meta charset="utf-8"> - <meta http-equiv="X-UA-Compatible" content="IE=edge,chrome=1"> - <meta name="viewport" content="width=device-width, initial-scale=1"> - <meta name="apple-mobile-web-app-capable" content="yes"> - <meta name="apple-mobile-web-app-status-bar-style" content="black-translucent"> + <meta http-equiv="Content-Type" content="text/html; charset=utf-8"> + <meta charset="utf-8"> + <meta http-equiv="X-UA-Compatible" content="IE=edge,chrome=1"> + <meta name="viewport" content="width=device-width, initial-scale=1"> + <meta name="apple-mobile-web-app-capable" content="yes"> + <meta name="apple-mobile-web-app-status-bar-style" content="black-translucent"> </head> <body> - <div id="alarms" class="collapsed"> - <div class="alarm-collapse-button" onclick="dash.toggle_alarm_collapse()">›</div> - <span class="alarm-count"></span> - <h1>Alarms</h1> - <div class="alarm-host-list"></div> - <div class="settings-button" onclick="dash.reorder_hosts()">⚙</div> - </div> - <div id="dash"> - <div class="netdata-host-stats-container template"> - <div class="drag-anchor"></div> - <div class="netdata-host-name">host</div> - <div class="netdata-host-stats"> - <div class="dash-graph" - data-dash-netdata="system.cpu" - data-dygraph-valuerange="[0, 100]"> - </div> - <div class="dash-graph" - data-dash-netdata="system.load"> - </div> - <div class="dash-graph" - data-dash-netdata="system.ram"> - </div> - <div class="dash-graph" - data-dash-netdata="system.net"> - </div> - <div class="dash-graph" - data-dash-netdata="system.processes"> - </div> - <div class="dash-graph" - data-dash-netdata="apps.cpu"> - </div> - <div class="dash-graph" - data-dash-netdata="apps.mem"> - </div> - <div class="dash-charts"> - <div class="dash-chart" - data-dash-netdata="system.io" - data-dimensions="in" - data-title="Disk Read" - data-common-units="dash.io"> - </div> - <div class="dash-chart" - data-dash-netdata="system.io" - data-dimensions="out" - data-title="Disk Write" - data-common-units="dash.io"> - </div> - <div class="dash-chart" - data-dash-netdata="system.cpu" - data-chart-library="gauge" - data-title="CPU" - data-units="%" - data-gauge-max-value="100" - data-colors="#22AA99" - data-gauge-stroke-color="#373B40"> - </div> - <div class="dash-chart" - data-dash-netdata="system.net" - data-dimensions="received" - data-title="Net Inbound" - data-common-units="dash.net"> - </div> - <div class="dash-chart" - data-dash-netdata="system.net" - data-dimensions="sent" - data-title="Net Outbound" - data-common-units="dash.net"> - </div> - <div class="dash-chart" - data-dash-netdata="system.ram" - data-dimensions="used|buffers|active|wired" - data-append-options="percentage" - data-title="Used RAM" - data-units="%" - data-easypiechart-max-value="100" - data-colors="#EE9911"> - </div> - </div> - </div> - </div> - </div> + <div id="alarms" class="collapsed"> + <div class="alarm-collapse-button" onclick="dash.toggle_alarm_collapse()">›</div> + <span class="alarm-count"></span> + <h1>Alarms</h1> + <div class="alarm-host-list"></div> + <div class="settings-button" onclick="dash.reorder_hosts()">⚙︎</div> + </div> + <div id="dash"> + <div class="netdata-host-stats-container template"> + <div class="netdata-host-name">host</div> + <div class="netdata-host-stats"> + <div class="dash-graph" + data-dash-netdata="system.cpu" + data-dygraph-valuerange="[0, 100]"> + </div> + <div class="dash-graph" + data-dash-netdata="system.load"> + </div> + <div class="dash-graph" + data-dash-netdata="system.ram"> + </div> + <div class="dash-graph" + data-dash-netdata="disk_space._"> + </div> + <div class="dash-graph" + data-dash-netdata="system.net"> + </div> + <div class="dash-graph" + data-dash-netdata="system.processes"> + </div> + <div class="dash-graph" + data-dash-netdata="apps.cpu"> + </div> + <div class="dash-graph" + data-dash-netdata="apps.mem"> + </div> + <div class="dash-charts"> + <div class="dash-chart" + data-dash-netdata="system.io" + data-dimensions="in" + data-title="Disk Read" + data-common-units="dash.io"> + </div> + <div class="dash-chart" + data-dash-netdata="system.io" + data-dimensions="out" + data-title="Disk Write" + data-common-units="dash.io"> + </div> + <div class="dash-chart" + data-dash-netdata="system.cpu" + data-chart-library="gauge" + data-title="CPU" + data-units="%" + data-gauge-max-value="100" + data-colors="#22AA99" + data-gauge-stroke-color="#373B40"> + </div> + <div class="dash-chart" + data-dash-netdata="system.net" + data-dimensions="received" + data-title="Net Inbound" + data-common-units="dash.net"> + </div> + <div class="dash-chart" + data-dash-netdata="system.net" + data-dimensions="sent" + data-title="Net Outbound" + data-common-units="dash.net"> + </div> + <div class="dash-chart" + data-dash-netdata="system.ram" + data-dimensions="used|buffers|active|wired" + data-append-options="percentage" + data-title="Used RAM" + data-units="%" + data-easypiechart-max-value="100" + data-colors="#EE9911"> + </div> + </div> + </div> + </div> + </div> </body> <script - src="https://code.jquery.com/jquery-3.4.1.min.js" - integrity="sha256-CSXorXvZcTkaix6Yvo6HppcZGetbYMGWSFlBw8HfCJo=" - crossorigin="anonymous"> + src="https://code.jquery.com/jquery-3.4.1.min.js" + integrity="sha256-CSXorXvZcTkaix6Yvo6HppcZGetbYMGWSFlBw8HfCJo=" + crossorigin="anonymous"> </script> <script type="text/javascript"> class PickNSort { - // PickNSort.js + // PickNSort.js constructor (dark) { this.items = []; @@ -294,6 +296,9 @@ class PickNSort { } add_css_to_page (dark) { + /* + * TUTORIAL: Change your theme colors here. Not sure how well it will work... + */ var light_theme = { windowbg: "#FFF", itembg: "#F4F4F4", @@ -304,10 +309,10 @@ class PickNSort { itembg: "#333", itemcolor: "#DBDBDB" } + var current_theme = (dark) ? dark_theme : light_theme; - $("<style>") - .prop("type", "text/css") - .html(` + + var css_string = ` #picknsort-container { position: fixed; z-index: 9999 !important; @@ -390,624 +395,634 @@ class PickNSort { padding: 0em 0.5em; height: calc(100% - 0.2em); } - `).appendTo("head"); + ` // End multiline string + + + $("<style>") + .prop("type", "text/css") + .html(css_string).appendTo("head"); } } </script> <script type="text/javascript"> - // Dash JS - - function picknsort_setup () { - if (localStorage.getItem('netdata_ordered_hosts')) { - picknsort.last_output = JSON.parse(localStorage.getItem('netdata_ordered_hosts')); - } else { - picknsort.last_output = { - enabled: dash.netdata_info.mirrored_hosts, - disabled: [] - } - } - } - - class Dash { - constructor (base_url, link_base_url) { - this.base_url = base_url; // URL of netdata host, with port - this.link_base_url = link_base_url || base_url; // Reverse proxy URL (Optional) - this.current_alarms = {}; - this.new_alarms = {}; - this.first_build = true; - /* - * TUTORIAL: Change your graph/chart dimensions here. Host columns will automatically adjust. - * Charts are square! Their width is the same as their height. - */ - this.options = { - graph_width: '40em', - graph_height: '20em', - chart_width: '10em' // Charts are square - }; - - this.init(); - } - - reorder_hosts () { - picknsort.popup(dash.update_ordered_hosts, dash.find_new_hosts); - } - - get_enabled_hosts () { - try { - return JSON.parse(localStorage.getItem('netdata_ordered_hosts')).enabled - } catch (e) { - return this.netdata_info.mirrored_hosts; - } - } - - get_ordered_hosts () { - try { - return JSON.parse(localStorage.getItem('netdata_ordered_hosts')); - } catch (e) { - return null; - } - } - - set_ordered_hosts (hosts) { - localStorage.setItem('netdata_ordered_hosts', JSON.stringify(hosts)); - location.reload(); - } - - update_ordered_hosts (enabled, disabled) { - if (enabled === null && disabled === null) { - return; - } - dash.set_ordered_hosts({ - enabled: enabled, - disabled: disabled - }); - } - - find_new_hosts () { - var newhosts = dash.netdata_info.mirrored_hosts.slice(); - var currenthosts = dash.get_ordered_hosts(); - - for (var i=0,len=currenthosts.enabled.length; i<len; i++) { - var found = newhosts.indexOf(currenthosts.enabled[i]); - - if (found > -1) { - newhosts.splice(found, 1); - } else { - currenthosts.enabled.splice(i, 1); - } - } - - for (var i=0,len=currenthosts.disabled.length; i<len; i++) { - var found = newhosts.indexOf(currenthosts.disabled[i]); - - if (found > -1) { - newhosts.splice(found, 1); - } else { - currenthosts.enabled.splice(i, 1); - } - } - - for (var i=0,len=newhosts.length; i<len; i++) { - currenthosts.enabled.push(newhosts[i]); - } - - dash.set_ordered_hosts(currenthosts); - } - - get_host_url (hostname, link) { - var base = ( link ) ? this.link_base_url : this.base_url; - return (hostname) ? base + '/host/' + hostname : base; - } - - get_api_url (hostname) { - return this.get_host_url(hostname) + '/api/v1' - } - - - init () { - var that = this; - $.get(this.get_api_url() + '/info', function (data) { - that.netdata_info = data; - picknsort_setup() - that.build(); - }); - } - - digest () { - this.fetch_active_alarms(); - this.fix_layout_errors(); - } - - build () { - // Fix vertically misaligned stats on load error - $('.dash-graph').css({ - height: this.options.graph_height, - width: this.options.graph_width - }); - $('.dash-chart').css({ - height: this.options.chart_width, // Charts are square - width: this.options.chart_width - }); - - // Fix chart alignment - $('.netdata-host-stats-container').css({ - width: 'calc(' + this.options.graph_width + ' + (2 * ' + $('.netdata-host-stats-container').css('padding-left') + '))' - }); - - var $template = $('.netdata-host-stats-container').first(); - - var hosts = this.get_enabled_hosts(); - - for (var i=0, len=hosts.length; i<len; i++) { - var hostname = hosts[i]; - $('#alarms .alarm-host-list').append('<div class="host-alarms ' + hostname + '"><a target="_blank" href="' + this.get_host_url(hostname, true) + '/"><h2>' + hostname + '</h2></a></div>'); - - $template.clone().removeClass('template').appendTo('#dash'); - var $newest = $('.netdata-host-stats-container').last(); - this.build_stats($newest, hostname); - } - - - if (this.first_build === true) { - this.remove_template_elements(); - this.first_build = false; - } - } - - build_stats ($hoststats, hostname) { - var that = this; - - $hoststats.find('.netdata-host-stats .dash-graph').each(function () { - that.build_graph($(this), hostname); - }); - - $hoststats.find('.netdata-host-stats .dash-chart').each(function () { - that.build_chart($(this), hostname); - }); - - $hoststats.find('.netdata-host-name').html('<a target="_blank" href="' + that.get_host_url(hostname, true) + '/">' + hostname + '</a>'); - } - - build_graph ($wrapper, hostname) { - var that = this; - var $graph = $('<div>', { - // Defaults - 'data-netdata': $wrapper.attr('data-dash-netdata'), - 'data-host': that.get_host_url(hostname), - 'data-before': '0', - 'data-after': '-540', - 'role': 'application', - 'data-width': that.options.graph_width, - 'data-height': that.options.graph_height - }); - - $.each($wrapper[0].attributes, function (key, node) { - if ( node.name.match(/^data-(?!dash).*/ ) ) { - $graph.attr(node.name, node.value); - } - }); - - $graph.appendTo($wrapper); - } - - build_chart ($wrapper, hostname) { - var that = this; - var $graph = $('<div>', { - // Defaults - 'data-netdata': $wrapper.attr('data-dash-netdata'), - 'data-host': that.get_host_url(hostname), - 'data-before': '0', - 'data-after': '-540', - 'data-points': '540', - 'role': 'application', - 'data-width': that.options.chart_width, - 'data-title': ' ', - 'data-easypiechart-trackcolor': "#373B40", - 'data-chart-library': 'easypiechart' - - }) - - $.each($wrapper[0].attributes, function (key, node) { - if ( node.name.match(/^data-(?!dash).*/ ) ) { - $graph.attr(node.name, node.value); - } - }); - - $graph.appendTo($wrapper); - } - - all_alarms_are_warnings () { - var out = true; - $.each(this.current_alarms, function (host, alarms) { - if (out === false) { - return false; // Maximum efficiency - } - $.each(alarms, function (name, data) { - if (data.status != "WARNING") { - out = false; - return false; - } - }); - }); - return out; - } - - update_alarm_count () { - console.log(this.all_alarms_are_warnings()); - var count = $('img.alarm-badge').length; - $('.alarm-count').text($('img.alarm-badge').length); - $('.alarm-count').removeClass('no-alarms warnings-only'); - if ( count === 0 ) { - $('.alarm-count').addClass('no-alarms'); - return - } - if (this.all_alarms_are_warnings()) { - $('.alarm-count').addClass('warnings-only'); - } - } - - fetch_active_alarms () { - var that = this; - console.log("Getting alarms..."); - var hosts = this.get_enabled_hosts(); - for (var i=0, len=hosts.length; i<len; i++) { - var hostname = hosts[i]; - - $.get(this.get_api_url(hostname) + '/alarms', function (data) { - that.new_alarms[ data.hostname ] = data.alarms; - if ( Object.keys(that.new_alarms).length === len ) { - // All responses received - if ( that.check_new_current_alarms() ) { - console.log("No alarm changes detected... Refreshing images."); - that.new_alarms = {}; - that.refresh_alarm_images(); - return; - } - - that.current_alarms = that.new_alarms; - that.new_alarms = {}; - that.draw_alarms(); - that.update_alarm_count(); - } - }); - } - } - - toggle_alarm_collapse () { - $('#alarms').toggleClass('collapsed'); - } - - check_new_current_alarms () { - // Create arrays of property names - var a = this.current_alarms; - var b = this.new_alarms; - var aProps = Object.keys(a); - var bProps = Object.keys(b); - - // If number of properties is different, - // objects are not equivalent - if (aProps.length != bProps.length) { - return false; - } - - for (var i = 0; i < aProps.length; i++) { - var propName = aProps[i]; - var aa = a[propName] - var aaProps = Object.keys(aa); - var bb = b[propName]; - var bbProps = Object.keys(bb); - - if (aaProps.length != bbProps.length) { - return false; - } - - for (var n = 0, len=aaProps.length; i < len; i++) { - if ( bb[aaProps[n]] === undefined ) { - return false; - } - } - } - - // If we made it this far, objects - // are considered equivalent - return true; - } - - refresh_alarm_images () { - // Use Math.random() to "reload" the image - $('.alarm-badge').each(function () { - var old_src = $(this).attr('src').replace(/&rand=.*/g, ""); - $(this).attr('src', old_src + "&rand=" + Math.random()); - }); - } - - draw_alarms () { - var that = this; - console.log("Drawing...", that.current_alarms); - $.each(that.current_alarms, function(hostname, alarms) { - $('#alarms .host-alarms.' + hostname + ' .alarm-badge').remove(); - $.each(alarms, function (index, alarm) { - that.draw_alarm(hostname, alarm); - }) - }); - } - - draw_alarm (hostname, alarm) { - var queryStr = '/badge.svg?alarm=' + alarm.name + '&chart=' + alarm.chart - $('<img />', { - src: this.get_api_url(hostname) + queryStr, - class: 'alarm-badge' - }).appendTo($('#alarms .host-alarms.' + hostname)); - } - - remove_template_elements () { - $('.netdata-host-stats-container').first().remove(); - } - - fix_layout_errors () { - $('.dash-graph:contains("chart not found")').html('<div class="loading-error">Not found</div>'); - $('.dash-chart:contains("chart not found")').html('<div class="loading-error">Not found</div>'); - } - } - - /* - * TUTORIAL: Change this to the URL of your netdata host - * If you use netdata behind a reverse proxy, add a second parameter for the reverse proxy url like so: - * new Dash('http://localhost:19999', 'https://my-domain.com/stats'); - */ - var dash = new Dash('http://localhost:19999'); - - var picknsort = new PickNSort(true); - - // Import dashboard.js - $.getScript(dash.base_url + '/dashboard.js', function() { - console.log("Loaded dashboard.js"); - setTimeout(function () { - $('#alarms').css("visibility", "visible"); - }, 400); - }); - - setInterval(function () { - dash.digest(); - }, 6 * 1000); + // Dash JS + + function picknsort_setup () { + if (localStorage.getItem('netdata_ordered_hosts')) { + picknsort.last_output = JSON.parse(localStorage.getItem('netdata_ordered_hosts')); + } else { + picknsort.last_output = { + enabled: dash.netdata_info.mirrored_hosts, + disabled: [] + } + } + } + + class Dash { + constructor (base_url, link_base_url) { + this.base_url = base_url; // URL of netdata host, with port + this.link_base_url = link_base_url || base_url; // Reverse proxy URL (Optional) + this.current_alarms = {}; + this.new_alarms = {}; + this.first_build = true; + /* + * TUTORIAL: Change your graph/chart dimensions here. Host columns will automatically adjust. + * Charts are square! Their width is the same as their height. + */ + this.options = { + graph_width: '40em', + graph_height: '20em', + chart_width: '10em' // Charts are square + }; + + this.init(); + } + + reorder_hosts () { + picknsort.popup(dash.update_ordered_hosts, dash.find_new_hosts); + } + + get_enabled_hosts () { + try { + return JSON.parse(localStorage.getItem('netdata_ordered_hosts')).enabled + } catch (e) { + return this.netdata_info.mirrored_hosts.sort(); + } + } + + get_ordered_hosts () { + try { + return JSON.parse(localStorage.getItem('netdata_ordered_hosts')); + } catch (e) { + return null; + } + } + + set_ordered_hosts (hosts) { + localStorage.setItem('netdata_ordered_hosts', JSON.stringify(hosts)); + location.reload(); + } + + update_ordered_hosts (enabled, disabled) { + if (enabled === null && disabled === null) { + return; + } + dash.set_ordered_hosts({ + enabled: enabled, + disabled: disabled + }); + } + + find_new_hosts () { + var newhosts = dash.netdata_info.mirrored_hosts.slice(); + var currenthosts = dash.get_ordered_hosts(); + + for (var i=0,len=currenthosts.enabled.length; i<len; i++) { + var found = newhosts.indexOf(currenthosts.enabled[i]); + + if (found > -1) { + newhosts.splice(found, 1); + } else { + currenthosts.enabled.splice(i, 1); + } + } + + for (var i=0,len=currenthosts.disabled.length; i<len; i++) { + var found = newhosts.indexOf(currenthosts.disabled[i]); + + if (found > -1) { + newhosts.splice(found, 1); + } else { + currenthosts.enabled.splice(i, 1); + } + } + + for (var i=0,len=newhosts.length; i<len; i++) { + currenthosts.enabled.push(newhosts[i]); + } + + dash.set_ordered_hosts(currenthosts); + } + + get_host_url (hostname, link) { + var base = ( link ) ? this.link_base_url : this.base_url; + return (hostname) ? base + '/host/' + hostname : base; + } + + get_api_url (hostname) { + return this.get_host_url(hostname) + '/api/v1' + } + + + init () { + var that = this; + $.get(this.get_api_url() + '/info', function (data) { + that.netdata_info = data; + picknsort_setup() + that.build(); + }); + } + + digest () { + this.fetch_active_alarms(); + this.fix_layout_errors(); + } + + build () { + // Fix vertically misaligned stats on load error + $('.dash-graph').css({ + height: this.options.graph_height, + width: this.options.graph_width + }); + $('.dash-chart').css({ + height: this.options.chart_width, // Charts are square + width: this.options.chart_width + }); + + // Fix chart alignment + $('.netdata-host-stats-container').css({ + width: 'calc(' + this.options.graph_width + ' + (2 * ' + $('.netdata-host-stats-container').css('padding-left') + '))' + }); + + var $template = $('.netdata-host-stats-container').first(); + + var hosts = this.get_enabled_hosts(); + + for (var i=0, len=hosts.length; i<len; i++) { + var hostname = hosts[i]; + $('#alarms .alarm-host-list').append('<div class="host-alarms ' + hostname + '"><a onclick="return dash.scroll_to_host_stats(' + "'" + hostname + "'" + ')" href="#' + hostname + '"><h2>' + hostname + '</h2></a></div>'); + + $template.clone().removeClass('template').attr('id', hostname).appendTo('#dash'); + var $newest = $('.netdata-host-stats-container').last(); + this.build_stats($newest, hostname); + } + + + if (this.first_build === true) { + this.remove_template_elements(); + this.first_build = false; + } + } + + build_stats ($hoststats, hostname) { + var that = this; + + $hoststats.find('.netdata-host-stats .dash-graph').each(function () { + that.build_graph($(this), hostname); + }); + + $hoststats.find('.netdata-host-stats .dash-chart').each(function () { + that.build_chart($(this), hostname); + }); + + $hoststats.find('.netdata-host-name').html('<a target="_blank" href="' + that.get_host_url(hostname, true) + '/">' + hostname + '</a>'); + } + + build_graph ($wrapper, hostname) { + var that = this; + var $graph = $('<div>', { + // Defaults + 'data-netdata': $wrapper.attr('data-dash-netdata'), + 'data-host': that.get_host_url(hostname), + 'data-before': '0', + 'data-after': '-540', + 'role': 'application', + 'data-width': that.options.graph_width, + 'data-height': that.options.graph_height + }); + + $.each($wrapper[0].attributes, function (key, node) { + if ( node.name.match(/^data-(?!dash).*/ ) ) { + $graph.attr(node.name, node.value); + } + }); + + $graph.appendTo($wrapper); + } + + build_chart ($wrapper, hostname) { + var that = this; + var $graph = $('<div>', { + // Defaults + 'data-netdata': $wrapper.attr('data-dash-netdata'), + 'data-host': that.get_host_url(hostname), + 'data-before': '0', + 'data-after': '-540', + 'data-points': '540', + 'role': 'application', + 'data-width': that.options.chart_width, + 'data-title': ' ', + 'data-easypiechart-trackcolor': "#373B40", + 'data-chart-library': 'easypiechart' + + }) + + $.each($wrapper[0].attributes, function (key, node) { + if ( node.name.match(/^data-(?!dash).*/ ) ) { + $graph.attr(node.name, node.value); + } + }); + + $graph.appendTo($wrapper); + } + + scroll_to_host_stats (hostname) { + event.preventDefault(); + $('#dash').scrollLeft(document.getElementById(hostname).offsetLeft - $('#' + hostname).width()); + + // Prevent regular event from happening + return false; + } + + all_alarms_are_warnings () { + var out = true; + $.each(this.current_alarms, function (host, alarms) { + if (out === false) { + return false; // Maximum efficiency + } + $.each(alarms, function (name, data) { + if (data.status != "WARNING") { + out = false; + return false; + } + }); + }); + return out; + } + + update_alarm_count () { + console.log(this.all_alarms_are_warnings()); + var count = $('img.alarm-badge').length; + $('.alarm-count').text($('img.alarm-badge').length); + $('.alarm-count').removeClass('no-alarms warnings-only'); + if ( count === 0 ) { + $('.alarm-count').addClass('no-alarms'); + return + } + if (this.all_alarms_are_warnings()) { + $('.alarm-count').addClass('warnings-only'); + } + } + + fetch_active_alarms () { + var that = this; + console.log("Getting alarms..."); + var hosts = this.get_enabled_hosts(); + for (var i=0, len=hosts.length; i<len; i++) { + var hostname = hosts[i]; + + $.get(this.get_api_url(hostname) + '/alarms', function (data) { + that.new_alarms[ data.hostname ] = data.alarms; + if ( Object.keys(that.new_alarms).length === len ) { + // All responses received + if ( that.check_new_current_alarms() ) { + console.log("No alarm changes detected... Refreshing images."); + that.new_alarms = {}; + that.refresh_alarm_images(); + return; + } + + that.current_alarms = that.new_alarms; + that.new_alarms = {}; + that.draw_alarms(); + that.update_alarm_count(); + } + }); + } + } + + toggle_alarm_collapse () { + $('#alarms').toggleClass('collapsed'); + } + + check_new_current_alarms () { + // Create arrays of property names + var a = this.current_alarms; + var b = this.new_alarms; + var aProps = Object.keys(a); + var bProps = Object.keys(b); + + // If number of properties is different, + // objects are not equivalent + if (aProps.length != bProps.length) { + return false; + } + + for (var i = 0; i < aProps.length; i++) { + var propName = aProps[i]; + var aa = a[propName]; + var aaProps = Object.keys(aa); + var bb = b[propName]; + var bbProps = Object.keys(bb); + + if (aaProps.length != bbProps.length) { + return false; + } + + for (var n = 0, len=aaProps.length; i < len; i++) { + if ( bb[aaProps[n]] === undefined ) { + return false; + } + } + } + + // If we made it this far, objects + // are considered equivalent + return true; + } + + refresh_alarm_images () { + // Use Math.random() to "reload" the image + $('.alarm-badge').each(function () { + var old_src = $(this).attr('src').replace(/&rand=.*/g, ""); + $(this).attr('src', old_src + "&rand=" + Math.random()); + }); + } + + draw_alarms () { + var that = this; + console.log("Drawing...", that.current_alarms); + $.each(that.current_alarms, function(hostname, alarms) { + $('#alarms .host-alarms.' + hostname + ' .alarm-badge').remove(); + $.each(alarms, function (index, alarm) { + that.draw_alarm(hostname, alarm); + }) + }); + } + + draw_alarm (hostname, alarm) { + var queryStr = '/badge.svg?alarm=' + alarm.name + '&chart=' + alarm.chart + $('<img />', { + src: this.get_api_url(hostname) + queryStr, + class: 'alarm-badge' + }).appendTo($('#alarms .host-alarms.' + hostname)); + } + + remove_template_elements () { + $('.netdata-host-stats-container').first().remove(); + } + + fix_layout_errors () { + $('.dash-graph:contains("chart not found")').html('<div class="loading-error">Not found</div>'); + $('.dash-chart:contains("chart not found")').html('<div class="loading-error">Not found</div>'); + } + } + + /* + * TUTORIAL: Change this to the URL of your netdata host + * If you use netdata behind a reverse proxy, add a second parameter for the reverse proxy url like so: + * new Dash('http://localhost:19999', 'https://my-domain.com/stats'); + */ + var dash = new Dash('http://localhost:19999'); + + var picknsort = new PickNSort(true); + + // Import dashboard.js + $.getScript(dash.base_url + '/dashboard.js', function() { + console.log("Loaded dashboard.js"); + setTimeout(function () { + $('#alarms').css("visibility", "visible"); + }, 400); + }); + + setInterval(function () { + dash.digest(); + }, 6 * 1000); </script> <style type="text/css"> - body { - background-color: #272b30; - } - - a, a:hover { - color: #AAA !important; - } - - #dash { - overflow: scroll; - width: 100vw; - white-space: nowrap; - height: 100vh; - - } - - #alarms { - display: block; - z-index: 9999; - position: fixed; - right: 0; - top: 0; - bottom: 0; - background-color: #111; - width: 23em; - padding: 1em; - color: #AAA; - box-shadow: 0 0 3em #060606; - border: solid 1px #2d2d2d; - visibility: hidden; - } - - - - #alarms h1 { - text-align: center; - margin: 0; - margin-bottom: 0.5em; - margin-top: -0.1em; - font-size: 2em; - } - - #alarms h2 { - font-size: 1.5em; - } - - #alarms .alarm-collapse-button { - position: absolute; - top: 0; - left: 0; - width: 0.9em; - height: 0.9em; - font-size: 4em; - line-height: 0.8; - background: #111; - text-align: center; - cursor: default; - } - - #alarms .alarm-collapse-button:hover { - background: #000; - } - - #alarms.collapsed { - width: 4em; - } - - #alarms.collapsed .alarm-collapse-button { - position: fixed; - left: auto; - right: 0; - top: 0; - bottom: 0; - width: 4em; - height: 100vh; - opacity: 0; - z-index: 9999; - } - - #alarms.collapsed h1 { - transform: rotate(-90deg); - position: absolute; - left: -9.1em; - top: 4em; - width: 20em; - } - - #alarms .alarm-host-list { - margin-top: 1em; - height: 100%; - overflow-y: scroll; - scrollbar-width: thin; - } - - #alarms.collapsed .alarm-host-list { - display: none; - } - - - - #alarms .host-alarms { - background: #1d1d1d; - margin-bottom: 1em; - padding: 0.2em 1em; - padding-bottom: 1.5em; - border-top: 1px solid; - position: relative; - } - - .host-alarms a:last-child:after { - position: absolute; - display: block; - content: 'no alarms'; - width: 6em; - height: 1em; - right: 0; - top: 2em; - color: #646464; - } - - #alarms .host-alarms img.alarm-badge { - margin: .25em; - height: 1.2em; - } - - #alarms .alarm-count { - width: 1.5em; - height: 1.5em; - text-align: center; - position: absolute; - right: 0.5em; - top: 0.5em; - font-size: 1.5em; - background: #6f1515; - border-radius: 50%; - } - - #alarms .alarm-count:empty { - background: #333; - } - - #alarms .no-alarms { - background: #156f15; - color: rgba(0,0,0,0); - } - - #alarms .warnings-only { - background: #f48041; - color: #EEE; - } - - .settings-button { - position: absolute; - bottom: 0; - right: 0; - font-size: 3em; - width: 1.3em; - height: 1.3em; - z-index: 9999; - text-align: center; - line-height: 1.2; - cursor: default; - } - - .settings-button:hover { - background: #424242; - } - - .drag-anchor { - position: absolute; - top: 0; - left: 0; - width: 100%; - height: 2em; - background: #111; - - } - - .netdata-host-name { - font-size: 3em; - color: #FFF; - text-align: center; - white-space: nowrap; - } - - .netdata-host-stats-container { - position: relative; - margin: 0 1em; - padding: 3em 2em; - display: inline-block; - text-align: center; - color: #CCC; - background: #232323; - } - - .netdata-host-stats-container:last-of-type { - margin-right: 27em; - } - - .netdata-host-stats { - - } - - .netdata-message { - } - - .dash-graph { - margin-bottom: 1em; - } - - .netdata-legend-resize-handler { - display: none - } - - .dash-charts { - white-space: normal; - margin: 2em 0; - } - - .dash-chart { - display: inline-block; - vertical-align: top; - } - - .easyPieChartLabel { - color: #FFF; - } - - .loading-error { - padding-top: 2em; - font-size: 2em; - } - - .netdata-legend-value, .netdata-legend-toolbox, .netdata-legend-toolbox-button, .netdata-legend-resize-handler { - background: initial; - } + body { + background-color: #272b30; + } + + a, a:hover { + color: #AAA !important; + } + + #dash { + overflow: scroll; + width: 100vw; + white-space: nowrap; + height: 100vh; + + } + + #alarms { + display: block; + z-index: 9999; + position: fixed; + right: 0; + top: 0; + bottom: 0; + background-color: #111; + width: 23em; + padding: 1em; + color: #AAA; + box-shadow: 0 0 3em #060606; + border: solid 1px #2d2d2d; + visibility: hidden; + } + + + + #alarms h1 { + text-align: center; + margin: 0; + margin-bottom: 0.5em; + margin-top: -0.1em; + font-size: 2em; + } + + #alarms h2 { + font-size: 1.5em; + } + + #alarms .alarm-collapse-button { + position: absolute; + top: 0; + left: 0; + width: 0.9em; + height: 0.9em; + font-size: 4em; + line-height: 0.8; + background: #111; + text-align: center; + cursor: default; + } + + #alarms .alarm-collapse-button:hover { + background: #000; + } + + #alarms.collapsed { + width: 4em; + } + + #alarms.collapsed .alarm-collapse-button { + position: fixed; + left: auto; + right: 0; + top: 0; + bottom: 0; + width: 4em; + height: 100vh; + opacity: 0; + z-index: 9999; + } + + #alarms.collapsed h1 { + transform: rotate(-90deg); + position: absolute; + left: -9.1em; + top: 4em; + width: 20em; + } + + #alarms .alarm-host-list { + margin-top: 1em; + height: 100%; + overflow-y: scroll; + scrollbar-width: thin; + } + + #alarms.collapsed .alarm-host-list { + display: none; + } + + + + #alarms .host-alarms { + background: #1d1d1d; + margin-bottom: 1em; + padding: 0.2em 1em; + padding-bottom: 1.5em; + border-top: 1px solid; + position: relative; + } + + .host-alarms a:last-child:after { + position: absolute; + display: block; + content: 'no alarms'; + width: 6em; + height: 1em; + right: 0; + top: 2em; + color: #646464; + } + + #alarms .host-alarms img.alarm-badge { + margin: .25em; + height: 1.2em; + } + + #alarms .alarm-count { + width: 1.5em; + height: 1.5em; + text-align: center; + position: absolute; + right: 0.5em; + top: 0.5em; + font-size: 1.5em; + background: #6f1515; + border-radius: 50%; + } + + #alarms .alarm-count:empty { + background: #333; + } + + #alarms .no-alarms { + background: #156f15; + color: rgba(0,0,0,0); + } + + #alarms .warnings-only { + background: #f48041; + color: #EEE; + } + + .settings-button { + position: absolute; + bottom: 0; + right: 0; + font-size: 3em; + width: 1.3em; + height: 1.3em; + z-index: 9999; + text-align: center; + line-height: 1.2; + cursor: default; + } + + .settings-button:hover { + background: #424242; + } + + .netdata-host-name { + font-size: 3em; + color: #FFF; + text-align: center; + white-space: nowrap; + background: inherit; + position: sticky; + top: 0; + z-index: 9998; + box-shadow: 0 0.5em 1em #232323; + margin-bottom: 0.5em; + border-bottom: solid 0.1em #AAA; + } + + .netdata-host-stats-container { + position: relative; + margin: 0 1em; + padding: 1em 2em; + display: inline-block; + text-align: center; + color: #CCC; + background: #232323; + } + + .netdata-host-stats-container:last-of-type { + margin-right: 27em; + } + + .netdata-host-stats { + + } + + .netdata-message { + } + + .dash-graph { + margin-bottom: 1em; + } + + .netdata-legend-resize-handler { + display: none + } + + .dash-charts { + white-space: normal; + margin: 2em 0; + } + + .dash-chart { + display: inline-block; + vertical-align: top; + } + + .easyPieChartLabel { + color: #FFF; + } + + .loading-error { + padding-top: 2em; + font-size: 2em; + } + + .netdata-legend-value, .netdata-legend-toolbox, .netdata-legend-toolbox-button, .netdata-legend-resize-handler { + background: initial; + } </style> </html> diff --git a/web/gui/dashboard.js b/web/gui/dashboard.js index 9bce4f72a..53e9090b1 100644 --- a/web/gui/dashboard.js +++ b/web/gui/dashboard.js @@ -792,6 +792,13 @@ NETDATA.unitsConversion = { 'gigabits/s': 1000000, 'terabits/s': 1000000000 }, + 'bytes/s': { + 'bytes/s': 1, + 'kilobytes/s': 1024, + 'megabytes/s': 1024 * 1024, + 'gigabytes/s': 1024 * 1024 * 1024, + 'terabytes/s': 1024 * 1024 * 1024 * 1024 + }, 'kilobytes/s': { 'bytes/s': 1 / 1024, 'kilobytes/s': 1, @@ -799,6 +806,13 @@ NETDATA.unitsConversion = { 'gigabytes/s': 1024 * 1024, 'terabytes/s': 1024 * 1024 * 1024 }, + 'B/s': { + 'B/s': 1, + 'KiB/s': 1024, + 'MiB/s': 1024 * 1024, + 'GiB/s': 1024 * 1024 * 1024, + 'TiB/s': 1024 * 1024 * 1024 * 1024 + }, 'KB/s': { 'B/s': 1 / 1024, 'KB/s': 1, @@ -2185,6 +2199,9 @@ NETDATA.dygraphChartCreate = function (state, data) { visibility: state.dimensions_visibility.selected2BooleanArray(state.data.dimension_names), logscale: NETDATA.chartLibraries.dygraph.isLogScale(state) ? 'y' : undefined, + // Expects a string in the format "<series name>: <style>" where each series is separated by a | + perSeriesStyle: NETDATA.dataAttribute(state.element, 'dygraph-per-series-style', ''), + axes: { x: { pixelsPerLabel: NETDATA.dataAttribute(state.element, 'dygraph-xpixelsperlabel', 50), @@ -2841,9 +2858,14 @@ NETDATA.dygraphChartCreate = function (state, data) { //state.tmp.dygraph_options.isZoomedIgnoreProgrammaticZoom = true; } - state.tmp.dygraph_instance = new Dygraph(state.element_chart, - data.result.data, state.tmp.dygraph_options); + let seriesStyles = NETDATA.dygraphGetSeriesStyle(state.tmp.dygraph_options); + state.tmp.dygraph_options.series = seriesStyles; + state.tmp.dygraph_instance = new Dygraph( + state.element_chart, + data.result.data, + state.tmp.dygraph_options + ); state.tmp.dygraph_history_tip_element = document.createElement('div'); state.tmp.dygraph_history_tip_element.innerHTML = ` @@ -2881,6 +2903,51 @@ NETDATA.dygraphChartCreate = function (state, data) { return true; }; + +NETDATA.dygraphGetSeriesStyle = function(dygraphOptions) { + const seriesStyleStr = dygraphOptions.perSeriesStyle; + let formattedStyles = {}; + + if (seriesStyleStr === '') { + return formattedStyles; + } + + // Parse the config string into a JSON object + let styles = seriesStyleStr.replace(' ', '').split('|'); + + styles.forEach(style => { + const keys = style.split(':'); + formattedStyles[keys[0]] = keys[1]; + }); + + for (let key in formattedStyles) { + if (formattedStyles.hasOwnProperty(key)) { + let settings; + + switch (formattedStyles[key]) { + case 'line': + settings = { fillGraph: false }; + break; + case 'area': + settings = { fillGraph: true }; + break; + case 'dot': + settings = { + fillGraph: false, + drawPoints: true, + pointSize: dygraphOptions.pointSize + }; + break; + default: + settings = undefined; + } + + formattedStyles[key] = settings; + } + } + + return formattedStyles; +}; // ---------------------------------------------------------------------------------------------------------------- // sparkline @@ -7944,7 +8011,7 @@ let chartState = function (element) { hide: NETDATA.options.current.show_help_delay_hide_ms }, title: 'Pan Right', - content: 'Pan the chart to the right. You can also <b>drag it</b> with your mouse or your finger (on touch devices).<br/><small>Help, can be disabled from the settings.</small>' + content: 'Pan the chart to the right. You can also <b>drag it</b> with your mouse or your finger (on touch devices).<br/><small>Help can be disabled from the settings.</small>' }); } @@ -7970,7 +8037,7 @@ let chartState = function (element) { hide: NETDATA.options.current.show_help_delay_hide_ms }, title: 'Chart Zoom In', - content: 'Zoom in the chart. You can also press SHIFT and select an area of the chart, or press SHIFT or ALT and use the mouse wheel or 2-finger touchpad scroll to zoom in or out.<br/><small>Help, can be disabled from the settings.</small>' + content: 'Zoom in the chart. You can also press SHIFT and select an area of the chart, or press SHIFT or ALT and use the mouse wheel or 2-finger touchpad scroll to zoom in or out.<br/><small>Help can be disabled from the settings.</small>' }); } @@ -7997,7 +8064,7 @@ let chartState = function (element) { hide: NETDATA.options.current.show_help_delay_hide_ms }, title: 'Chart Zoom Out', - content: 'Zoom out the chart. You can also press SHIFT or ALT and use the mouse wheel, or 2-finger touchpad scroll to zoom in or out.<br/><small>Help, can be disabled from the settings.</small>' + content: 'Zoom out the chart. You can also press SHIFT or ALT and use the mouse wheel, or 2-finger touchpad scroll to zoom in or out.<br/><small>Help can be disabled from the settings.</small>' }); } @@ -8029,7 +8096,7 @@ let chartState = function (element) { hide: NETDATA.options.current.show_help_delay_hide_ms }, title: 'Chart Resize', - content: 'Drag this point with your mouse or your finger (on touch devices), to resize the chart vertically. You can also <b>double click it</b> or <b>double tap it</b> to reset between 2 states: the default and the one that fits all the values.<br/><small>Help, can be disabled from the settings.</small>' + content: 'Drag this point with your mouse or your finger (on touch devices), to resize the chart vertically. You can also <b>double click it</b> or <b>double tap it</b> to reset between 2 states: the default and the one that fits all the values.<br/><small>Help can be disabled from the settings.</small>' }); } @@ -8089,7 +8156,7 @@ let chartState = function (element) { show: NETDATA.options.current.show_help_delay_show_ms, hide: NETDATA.options.current.show_help_delay_hide_ms }, - content: 'You can click or tap on the values or the labels to select dimensions. By pressing SHIFT or CONTROL, you can enable or disable multiple dimensions.<br/><small>Help, can be disabled from the settings.</small>' + content: 'You can click or tap on the values or the labels to select dimensions. By pressing SHIFT or CONTROL, you can enable or disable multiple dimensions.<br/><small>Help can be disabled from the settings.</small>' }); } } else { diff --git a/web/gui/dashboard_info.js b/web/gui/dashboard_info.js index cb5c9f7bc..1f289ba0c 100644 --- a/web/gui/dashboard_info.js +++ b/web/gui/dashboard_info.js @@ -50,11 +50,17 @@ netdataDashboard.menu = { info: 'Performance metrics for network interfaces.' }, + 'wireless': { + title: 'Wireless Interfaces', + icon: '<i class="fas fa-wifi"></i>', + info: 'Performance metrics for wireless interfaces.' + }, + 'ip': { title: 'Networking Stack', icon: '<i class="fas fa-cloud"></i>', info: function (os) { - if(os === "linux") + if (os === "linux") return 'Metrics for the networking stack of the system. These metrics are collected from <code>/proc/net/netstat</code>, apply to both IPv4 and IPv6 traffic and are related to operation of the kernel networking stack.'; else return 'Metrics for the networking stack of the system.'; @@ -190,6 +196,11 @@ netdataDashboard.menu = { info: 'Performance metrics for the operation of netdata itself and its plugins.' }, + 'aclk_test': { + title: 'ACLK Test Generator', + info: 'For internal use to perform integration testing.' + }, + 'example': { title: 'Example Charts', info: 'Example charts, demonstrating the external plugin architecture.' @@ -517,12 +528,60 @@ netdataDashboard.menu = { icon: '<i class="fas fa-folder-open"></i>', info: 'Provides <b><a href="https://hadoop.apache.org/docs/r3.2.0/hadoop-project-dist/hadoop-hdfs/HdfsDesign.html">Hadoop Distributed File System</a></b> performance statistics. Module collects metrics over <code>Java Management Extensions</code> through the web interface of an <code>HDFS</code> daemon.' }, - + 'am2320': { title: 'AM2320 Sensor', icon: '<i class="fas fa-thermometer-half"></i>', info: 'Readings from the external AM2320 Sensor.' - } + }, + + 'scaleio': { + title: 'ScaleIO', + icon: '<i class="fas fa-database"></i>', + info: 'Performance and health statistics for various ScaleIO components. Data collected via VxFlex OS Gateway REST API.' + }, + + 'squidlog': { + title: 'Squid log', + icon: '<i class="fas fa-file-alt"></i>', + info: undefined + }, + + 'cockroachdb': { + title: 'CockroachDB', + icon: '<i class="fas fa-database"></i>', + info: 'Performance and health statistics for various <code>CockroachDB</code> components.' + }, + + 'ebpf': { + title: 'eBPF', + icon: '<i class="fas fa-heartbeat"></i>', + info: 'Monitor system calls, internal functions, bytes read, bytes written and errors using <code>eBPF</code>.' + }, + + 'vernemq': { + title: 'VerneMQ', + icon: '<i class="fas fa-comments"></i>', + info: 'Performance data for the <b><a href="https://vernemq.com/">VerneMQ</a></b> open-source MQTT broker.' + }, + + 'pulsar': { + title: 'Pulsar', + icon: '<i class="fas fa-comments"></i>', + info: 'Summary, namespaces and topics performance data for the <b><a href="http://pulsar.apache.org/">Apache Pulsar</a></b> pub-sub messaging system.' + }, + + 'anomalies': { + title: 'Anomalies', + icon: '<i class="fas fa-flask"></i>', + info: 'Anomaly scores relating to key system metrics. A high anomaly probability indicates strange behaviour and may trigger an anomaly prediction from the trained models. Read the <a href="https://github.com/netdata/netdata/tree/master/collectors/python.d.plugin/anomalies" target="_blank">anomalies collector docs</a> for more details.' + }, + + 'alarms': { + title: 'Alarms', + icon: '<i class="fas fa-bell"></i>', + info: 'Charts showing alarm status over time. More details <a href="https://github.com/netdata/netdata/blob/master/collectors/python.d.plugin/alarms/README.md" target="_blank">here</a>.' + }, }; @@ -705,7 +764,7 @@ var cgroupMemLimitIsSet = 0; netdataDashboard.context = { 'system.cpu': { info: function (os) { - void(os); + void (os); return 'Total CPU utilization (all cores). 100% here means there is no CPU idle time at all. You can get per core usage at the <a href="#menu_cpu">CPUs</a> section and per application usage at the <a href="#menu_apps">Applications Monitoring</a> section.' + netdataDashboard.sparkline('<br/>Keep an eye on <b>iowait</b> ', 'system.cpu', 'iowait', '%', '. If it is constantly high, your disks are a bottleneck and they slow your system down.') + netdataDashboard.sparkline('<br/>An important metric worth monitoring, is <b>softirq</b> ', 'system.cpu', 'softirq', '%', '. A constantly high percentage of softirq may indicate network driver issues.'); @@ -714,10 +773,35 @@ netdataDashboard.context = { }, 'system.load': { - info: 'Current system load, i.e. the number of processes using CPU or waiting for system resources (usually CPU and disk). The 3 metrics refer to 1, 5 and 15 minute averages. The system calculates this once every 5 seconds. For more information check <a href="https://en.wikipedia.org/wiki/Load_(computing)" target="_blank">this wikipedia article</a>', + info: 'Current system load, i.e. the number of processes using CPU or waiting for system resources (usually CPU and disk). The 3 metrics refer to 1, 5 and 15 minute averages. The system calculates this once every 5 seconds. For more information check <a href="https://en.wikipedia.org/wiki/Load_(computing)" target="_blank">this wikipedia article</a>.', height: 0.7 }, + 'system.cpu_pressure': { + info: '<a href="https://www.kernel.org/doc/html/latest/accounting/psi.html">Pressure Stall Information</a> ' + + 'identifies and quantifies the disruptions caused by resource contentions. ' + + 'The "some" line indicates the share of time in which at least <b>some</b> tasks are stalled on CPU. ' + + 'The ratios (in %) are tracked as recent trends over 10-, 60-, and 300-second windows.' + }, + + 'system.memory_some_pressure': { + info: '<a href="https://www.kernel.org/doc/html/latest/accounting/psi.html">Pressure Stall Information</a> ' + + 'identifies and quantifies the disruptions caused by resource contentions. ' + + 'The "some" line indicates the share of time in which at least <b>some</b> tasks are stalled on memory. ' + + 'The "full" line indicates the share of time in which <b>all non-idle</b> tasks are stalled on memory simultaneously. ' + + 'In this state actual CPU cycles are going to waste, and a workload that spends extended time in this state is considered to be thrashing. ' + + 'The ratios (in %) are tracked as recent trends over 10-, 60-, and 300-second windows.' + }, + + 'system.io_some_pressure': { + info: '<a href="https://www.kernel.org/doc/html/latest/accounting/psi.html">Pressure Stall Information</a> ' + + 'identifies and quantifies the disruptions caused by resource contentions. ' + + 'The "some" line indicates the share of time in which at least <b>some</b> tasks are stalled on I/O. ' + + 'The "full" line indicates the share of time in which <b>all non-idle</b> tasks are stalled on I/O simultaneously. ' + + 'In this state actual CPU cycles are going to waste, and a workload that spends extended time in this state is considered to be thrashing. ' + + 'The ratios (in %) are tracked as recent trends over 10-, 60-, and 300-second windows.' + }, + 'system.io': { info: function (os) { var s = 'Total Disk I/O, for all physical disks. You can get detailed information about each disk at the <a href="#menu_disk">Disks</a> section and per application Disk usage at the <a href="#menu_apps">Applications Monitoring</a> section.'; @@ -847,7 +931,7 @@ netdataDashboard.context = { 'mem.ksm_ratios': { heads: [ function (os, id) { - void(os); + void (os); return '<div data-netdata="' + id + '"' + ' data-gauge-max-value="100"' + ' data-chart-library="gauge"' @@ -907,7 +991,7 @@ netdataDashboard.context = { }, 'mem.kernel': { - info: 'The total amount of memory being used by the kernel. <b>Slab</b> is the amount of memory used by the kernel to cache data structures for its own use. <b>KernelStack</b> is the amount of memory allocated for each task done by the kernel. <b>PageTables</b> is the amount of memory decicated to the lowest level of page tables (A page table is used to turn a virtual address into a physical memory address). <b>VmallocUsed</b> is the amount of memory being used as virtual address space.' + info: 'The total amount of memory being used by the kernel. <b>Slab</b> is the amount of memory used by the kernel to cache data structures for its own use. <b>KernelStack</b> is the amount of memory allocated for each task done by the kernel. <b>PageTables</b> is the amount of memory dedicated to the lowest level of page tables (A page table is used to turn a virtual address into a physical memory address). <b>VmallocUsed</b> is the amount of memory being used as virtual address space.' }, 'mem.slab': { @@ -1020,6 +1104,93 @@ netdataDashboard.context = { info: 'Carried over process group uptime since the Netdata restart. The period of time within which at least one process in the group was running.' }, + 'apps.file_open': { + info: 'Calls to the internal function <code>do_sys_open</code> ( For kernels newer than <code>5.5.19</code> we add a kprobe to <code>do_sys_openat2</code>. ), which is the common function called from' + + ' <a href="https://www.man7.org/linux/man-pages/man2/open.2.html" target="_blank">open(2)</a> ' + + ' and <a href="https://www.man7.org/linux/man-pages/man2/openat.2.html" target="_blank">openat(2)</a>. ' + }, + + 'apps.file_open_error': { + info: 'Failed calls to the internal function <code>do_sys_open</code> ( For kernels newer than <code>5.5.19</code> we add a kprobe to <code>do_sys_openat2</code>. ).' + }, + + 'apps.file_closed': { + info: 'Calls to the internal function <a href="https://elixir.bootlin.com/linux/latest/source/fs/file.c#L665" target="_blank">__close_fd</a>, which is called from' + + ' <a href="https://www.man7.org/linux/man-pages/man2/close.2.html" target="_blank">close(2)</a>. ' + }, + + 'apps.file_close_error': { + info: 'Failed calls to the internal function <a href="https://elixir.bootlin.com/linux/latest/source/fs/file.c#L665" target="_blank">__close_fd</a>.' + }, + + 'apps.file_deleted': { + info: 'Calls to the function <a href="https://www.kernel.org/doc/htmldocs/filesystems/API-vfs-unlink.html" target="_blank">vfs_unlink</a>. This chart does not show all events that remove files from the filesystem, because filesystems can create their own functions to remove files.' + }, + + 'apps.vfs_write_call': { + info: 'Successful calls to the function <a href="https://topic.alibabacloud.com/a/kernel-state-file-operation-__-work-information-kernel_8_8_20287135.html" target="_blank">vfs_write</a>. This chart may not show all filesystem events if it uses other functions to store data on disk.' + }, + + 'apps.vfs_write_error': { + info: 'Failed calls to the function <a href="https://topic.alibabacloud.com/a/kernel-state-file-operation-__-work-information-kernel_8_8_20287135.html" target="_blank">vfs_write</a>. This chart may not show all filesystem events if it uses other functions to store data on disk.' + }, + + 'apps.vfs_read_call': { + info: 'Successful calls to the function <a href="https://topic.alibabacloud.com/a/kernel-state-file-operation-__-work-information-kernel_8_8_20287135.html" target="_blank">vfs_read</a>. This chart may not show all filesystem events if it uses other functions to store data on disk.' + }, + + 'apps.vfs_read_error': { + info: 'Failed calls to the function <a href="https://topic.alibabacloud.com/a/kernel-state-file-operation-__-work-information-kernel_8_8_20287135.html" target="_blank">vfs_read</a>. This chart may not show all filesystem events if it uses other functions to store data on disk.' + }, + + 'apps.vfs_write_bytes': { + info: 'Total of bytes successfully written using the function <a href="https://topic.alibabacloud.com/a/kernel-state-file-operation-__-work-information-kernel_8_8_20287135.html" target="_blank">vfs_write</a>.' + }, + + 'apps.vfs_read_bytes': { + info: 'Total of bytes successfully read using the function <a href="https://topic.alibabacloud.com/a/kernel-state-file-operation-__-work-information-kernel_8_8_20287135.html" target="_blank">vfs_read</a>.' + }, + + 'apps.process_create': { + info: 'Calls to either <a href="https://www.ece.uic.edu/~yshi1/linux/lkse/node4.html#SECTION00421000000000000000" target="_blank">do_fork</a>, or <code>kernel_clone</code> if you are running kernel newer than 5.9.16, to create a new task, which is the common name used to define process and tasks inside the kernel. Netdata identifies the process by counting the number of calls to <a href="https://linux.die.net/man/2/clone" target="_blank">sys_clone</a> that do not have the flag <code>CLONE_THREAD</code> set.' + }, + + 'apps.thread_create': { + info: 'Calls to either <a href="https://www.ece.uic.edu/~yshi1/linux/lkse/node4.html#SECTION00421000000000000000" target="_blank">do_fork</a>, or <code>kernel_clone</code> if you are running kernel newer than 5.9.16, to create a new task, which is the common name used to define process and tasks inside the kernel. Netdata identifies the threads by counting the number of calls to <a href="https://linux.die.net/man/2/clone" target="_blank">sys_clone</a> that have the flag <code>CLONE_THREAD</code> set.' + }, + + 'apps.task_close': { + info: 'Calls to the functions responsible for closing (<a href="https://www.informit.com/articles/article.aspx?p=370047&seqNum=4" target="_blank">do_exit</a>) and releasing (<a href="https://www.informit.com/articles/article.aspx?p=370047&seqNum=4" target="_blank">release_task</a>) tasks.' + }, + + 'apps.bandwidth_sent': { + info: 'Bytes sent by functions <code>tcp_sendmsg</code> and <code>udp_sendmsg</code>.' + }, + + 'apps.bandwidth_recv': { + info: 'Bytes received by functions <code>tcp_cleanup_rbuf</code> and <code>udp_recvmsg</code>. We use <code>tcp_cleanup_rbuf</code> instead <code>tcp_recvmsg</code>, because this last misses <code>tcp_read_sock()</code> traffic and we would also need to have more probes to get the socket and package size.' + }, + + 'apps.bandwidth_tcp_send': { + info: 'Calls for function <code>tcp_sendmsg</code>.' + }, + + 'apps.bandwidth_tcp_recv': { + info: 'Calls for functions <code>tcp_cleanup_rbuf</code>. We use <code>tcp_cleanup_rbuf</code> instead <code>tcp_recvmsg</code>, because this last misses <code>tcp_read_sock()</code> traffic and we would also need to have more probes to get the socket and package size.' + }, + + 'apps.bandwidth_tcp_retransmit': { + info: 'Calls for functions <code>tcp_retranstmit_skb</code>.' + }, + + 'apps.bandwidth_udp_send': { + info: 'Calls for function <code>udp_sendmsg</code>.' + }, + + 'apps.bandwidth_udp_recv': { + info: 'Calls for function <code>udp_recvmsg</code>.' + }, + // ------------------------------------------------------------------------ // USERS @@ -1080,7 +1251,7 @@ netdataDashboard.context = { 'tc.qos': { heads: [ function (os, id) { - void(os); + void (os); if (id.match(/.*-ifb$/)) return netdataDashboard.gaugeChart('Inbound', '12%', '', '#5555AA'); @@ -1096,46 +1267,42 @@ netdataDashboard.context = { 'net.net': { mainheads: [ function (os, id) { - void(os); + void (os); if (id.match(/^cgroup_.*/)) { var iface; try { iface = ' ' + id.substring(id.lastIndexOf('.net_') + 5, id.length); - } - catch (e) { + } catch (e) { iface = ''; } return netdataDashboard.gaugeChart('Received' + iface, '12%', 'received'); - } - else + } else return ''; }, function (os, id) { - void(os); + void (os); if (id.match(/^cgroup_.*/)) { var iface; try { iface = ' ' + id.substring(id.lastIndexOf('.net_') + 5, id.length); - } - catch (e) { + } catch (e) { iface = ''; } return netdataDashboard.gaugeChart('Sent' + iface, '12%', 'sent'); - } - else + } else return ''; } ], heads: [ function (os, id) { - void(os); + void (os); if (!id.match(/^cgroup_.*/)) return netdataDashboard.gaugeChart('Received', '12%', 'received'); else return ''; }, function (os, id) { - void(os); + void (os); if (!id.match(/^cgroup_.*/)) return netdataDashboard.gaugeChart('Sent', '12%', 'sent'); else @@ -1358,6 +1525,14 @@ netdataDashboard.context = { '</ul>' + 'For more information see <a href="https://www.postgresql.org/docs/current/static/warm-standby.html#STREAMING-REPLICATION-SLOTS" target="_blank">Replication Slots</a>.' }, + 'postgres.backend_usage': { + info: 'Connections usage against maximum connections allowed, as defined in the <i>max_connections</i> setting.<ul>' + + '<li><strong>available:</strong> maximum new connections allowed.</li>' + + '<li><strong>used:</strong> connections currently in use.</li>' + + '</ul>' + + 'Assuming non-superuser accounts are being used to connect to Postgres (so <i>superuser_reserved_connections</i> are subtracted from <i>max_connections</i>).<br/>' + + 'For more information see <a href="https://www.postgresql.org/docs/current/runtime-config-connection.html" target="_blank">Connections and Authentication</a>.' + }, // ------------------------------------------------------------------------ @@ -1387,7 +1562,7 @@ netdataDashboard.context = { 'apache.workers': { mainheads: [ function (os, id) { - void(os); + void (os); return '<div data-netdata="' + id + '"' + ' data-dimensions="busy"' + ' data-append-options="percentage"' @@ -1448,7 +1623,7 @@ netdataDashboard.context = { 'lighttpd.workers': { mainheads: [ function (os, id) { - void(os); + void (os); return '<div data-netdata="' + id + '"' + ' data-dimensions="busy"' + ' data-append-options="percentage"' @@ -1539,7 +1714,7 @@ netdataDashboard.context = { info: 'Number of (connected) RetroShare friends.', mainheads: [ function (os, id) { - void(os); + void (os); return '<div data-netdata="' + id + '"' + ' data-dimensions="peers_connected"' + ' data-append-options="friends"' @@ -1579,7 +1754,7 @@ netdataDashboard.context = { valueRange: "[0, null]", mainheads: [ function (os, id) { - void(os); + void (os); cgroupCPULimitIsSet = 1; return '<div data-netdata="' + id + '"' + ' data-dimensions="used"' @@ -1601,7 +1776,7 @@ netdataDashboard.context = { 'cgroup.cpu': { mainheads: [ function (os, id) { - void(os); + void (os); if (cgroupCPULimitIsSet === 0) { return '<div data-netdata="' + id + '"' + ' data-chart-library="gauge"' @@ -1614,8 +1789,7 @@ netdataDashboard.context = { + ' data-points="CHART_DURATION"' + ' data-colors="' + NETDATA.colors[4] + '"' + ' role="application"></div>'; - } - else + } else return ''; } ] @@ -1624,7 +1798,7 @@ netdataDashboard.context = { 'cgroup.mem_usage_limit': { mainheads: [ function (os, id) { - void(os); + void (os); cgroupMemLimitIsSet = 1; return '<div data-netdata="' + id + '"' + ' data-dimensions="used"' @@ -1647,7 +1821,7 @@ netdataDashboard.context = { 'cgroup.mem_usage': { mainheads: [ function (os, id) { - void(os); + void (os); if (cgroupMemLimitIsSet === 0) { return '<div data-netdata="' + id + '"' + ' data-chart-library="gauge"' @@ -1660,8 +1834,7 @@ netdataDashboard.context = { + ' data-points="CHART_DURATION"' + ' data-colors="' + NETDATA.colors[1] + '"' + ' role="application"></div>'; - } - else + } else return ''; } ] @@ -1670,7 +1843,7 @@ netdataDashboard.context = { 'cgroup.throttle_io': { mainheads: [ function (os, id) { - void(os); + void (os); return '<div data-netdata="' + id + '"' + ' data-dimensions="read"' + ' data-chart-library="gauge"' @@ -1685,7 +1858,7 @@ netdataDashboard.context = { + ' role="application"></div>'; }, function (os, id) { - void(os); + void (os); return '<div data-netdata="' + id + '"' + ' data-dimensions="write"' + ' data-chart-library="gauge"' @@ -1810,6 +1983,10 @@ netdataDashboard.context = { info: 'The usage space in each OSD.' }, + 'ceph.osd_size': { + info: "Each OSD's size" + }, + 'ceph.apply_latency': { info: 'Time taken to flush an update in each OSD.' }, @@ -1825,7 +2002,7 @@ netdataDashboard.context = { info: 'Web server responses by type. <code>success</code> includes <b>1xx</b>, <b>2xx</b>, <b>304</b> and <b>401</b>, <code>error</code> includes <b>5xx</b>, <code>redirect</code> includes <b>3xx</b> except <b>304</b>, <code>bad</code> includes <b>4xx</b> except <b>401</b>, <code>other</code> are all the other responses.', mainheads: [ function (os, id) { - void(os); + void (os); return '<div data-netdata="' + id + '"' + ' data-dimensions="success"' + ' data-chart-library="gauge"' @@ -1843,7 +2020,7 @@ netdataDashboard.context = { }, function (os, id) { - void(os); + void (os); return '<div data-netdata="' + id + '"' + ' data-dimensions="redirect"' + ' data-chart-library="gauge"' @@ -1861,7 +2038,7 @@ netdataDashboard.context = { }, function (os, id) { - void(os); + void (os); return '<div data-netdata="' + id + '"' + ' data-dimensions="bad"' + ' data-chart-library="gauge"' @@ -1879,7 +2056,7 @@ netdataDashboard.context = { }, function (os, id) { - void(os); + void (os); return '<div data-netdata="' + id + '"' + ' data-dimensions="error"' + ' data-chart-library="gauge"' @@ -1912,7 +2089,7 @@ netdataDashboard.context = { 'web_log.response_time': { mainheads: [ function (os, id) { - void(os); + void (os); return '<div data-netdata="' + id + '"' + ' data-dimensions="avg"' + ' data-chart-library="gauge"' @@ -1958,7 +2135,7 @@ netdataDashboard.context = { '<code>other</code> are all the other responses.', mainheads: [ function (os, id) { - void(os); + void (os); return '<div data-netdata="' + id + '"' + ' data-dimensions="success"' + ' data-chart-library="gauge"' @@ -1976,7 +2153,7 @@ netdataDashboard.context = { }, function (os, id) { - void(os); + void (os); return '<div data-netdata="' + id + '"' + ' data-dimensions="redirect"' + ' data-chart-library="gauge"' @@ -1994,7 +2171,7 @@ netdataDashboard.context = { }, function (os, id) { - void(os); + void (os); return '<div data-netdata="' + id + '"' + ' data-dimensions="bad"' + ' data-chart-library="gauge"' @@ -2012,7 +2189,7 @@ netdataDashboard.context = { }, function (os, id) { - void(os); + void (os); return '<div data-netdata="' + id + '"' + ' data-dimensions="error"' + ' data-chart-library="gauge"' @@ -2047,7 +2224,7 @@ netdataDashboard.context = { 'web_log.squid_duration': { mainheads: [ function (os, id) { - void(os); + void (os); return '<div data-netdata="' + id + '"' + ' data-dimensions="avg"' + ' data-chart-library="gauge"' @@ -2130,6 +2307,106 @@ netdataDashboard.context = { '<code>TIMEOUT</code>, when the response was not completed due to a connection timeout.' }, + // ------------------------------------------------------------------------ + // go web_log + + 'web_log.type_requests': { + info: 'Web server responses by type. <code>success</code> includes <b>1xx</b>, <b>2xx</b>, <b>304</b> and <b>401</b>, <code>error</code> includes <b>5xx</b>, <code>redirect</code> includes <b>3xx</b> except <b>304</b>, <code>bad</code> includes <b>4xx</b> except <b>401</b>, <code>other</code> are all the other responses.', + mainheads: [ + function (os, id) { + void (os); + return '<div data-netdata="' + id + '"' + + ' data-dimensions="success"' + + ' data-chart-library="gauge"' + + ' data-title="Successful"' + + ' data-units="requests/s"' + + ' data-gauge-adjust="width"' + + ' data-width="12%"' + + ' data-before="0"' + + ' data-after="-CHART_DURATION"' + + ' data-points="CHART_DURATION"' + + ' data-common-max="' + id + '"' + + ' data-colors="' + NETDATA.colors[0] + '"' + + ' data-decimal-digits="0"' + + ' role="application"></div>'; + }, + + function (os, id) { + void (os); + return '<div data-netdata="' + id + '"' + + ' data-dimensions="redirect"' + + ' data-chart-library="gauge"' + + ' data-title="Redirects"' + + ' data-units="requests/s"' + + ' data-gauge-adjust="width"' + + ' data-width="12%"' + + ' data-before="0"' + + ' data-after="-CHART_DURATION"' + + ' data-points="CHART_DURATION"' + + ' data-common-max="' + id + '"' + + ' data-colors="' + NETDATA.colors[2] + '"' + + ' data-decimal-digits="0"' + + ' role="application"></div>'; + }, + + function (os, id) { + void (os); + return '<div data-netdata="' + id + '"' + + ' data-dimensions="bad"' + + ' data-chart-library="gauge"' + + ' data-title="Bad Requests"' + + ' data-units="requests/s"' + + ' data-gauge-adjust="width"' + + ' data-width="12%"' + + ' data-before="0"' + + ' data-after="-CHART_DURATION"' + + ' data-points="CHART_DURATION"' + + ' data-common-max="' + id + '"' + + ' data-colors="' + NETDATA.colors[3] + '"' + + ' data-decimal-digits="0"' + + ' role="application"></div>'; + }, + + function (os, id) { + void (os); + return '<div data-netdata="' + id + '"' + + ' data-dimensions="error"' + + ' data-chart-library="gauge"' + + ' data-title="Server Errors"' + + ' data-units="requests/s"' + + ' data-gauge-adjust="width"' + + ' data-width="12%"' + + ' data-before="0"' + + ' data-after="-CHART_DURATION"' + + ' data-points="CHART_DURATION"' + + ' data-common-max="' + id + '"' + + ' data-colors="' + NETDATA.colors[1] + '"' + + ' data-decimal-digits="0"' + + ' role="application"></div>'; + } + ] + }, + + 'web_log.request_processing_time': { + mainheads: [ + function (os, id) { + void (os); + return '<div data-netdata="' + id + '"' + + ' data-dimensions="avg"' + + ' data-chart-library="gauge"' + + ' data-title="Average Response Time"' + + ' data-units="milliseconds"' + + ' data-gauge-adjust="width"' + + ' data-width="12%"' + + ' data-before="0"' + + ' data-after="-CHART_DURATION"' + + ' data-points="CHART_DURATION"' + + ' data-colors="' + NETDATA.colors[4] + '"' + + ' data-decimal-digits="2"' + + ' role="application"></div>'; + } + ] + }, // ------------------------------------------------------------------------ // Fronius Solar Power @@ -2304,6 +2581,16 @@ netdataDashboard.context = { colors: NETDATA.colors[3] }, + 'rabbitmq.queue_messages': { + info: 'Total amount of messages and their states in this queue.', + colors: NETDATA.colors[3] + }, + + 'rabbitmq.queue_messages_stats': { + info: 'Overall messaging rates including acknowledgements, delieveries, redeliveries, and publishes.', + colors: NETDATA.colors[3] + }, + // ------------------------------------------------------------------------ // ntpd @@ -2444,33 +2731,33 @@ netdataDashboard.context = { 'proxysql.pool_status': { info: 'The status of the backend servers. ' + - '<code>1=ONLINE</code> backend server is fully operational, ' + - '<code>2=SHUNNED</code> backend sever is temporarily taken out of use because of either too many connection errors in a time that was too short, or replication lag exceeded the allowed threshold, ' + - '<code>3=OFFLINE_SOFT</code> when a server is put into OFFLINE_SOFT mode, new incoming connections aren\'t accepted anymore, while the existing connections are kept until they became inactive. In other words, connections are kept in use until the current transaction is completed. This allows to gracefully detach a backend, ' + - '<code>4=OFFLINE_HARD</code> when a server is put into OFFLINE_HARD mode, the existing connections are dropped, while new incoming connections aren\'t accepted either. This is equivalent to deleting the server from a hostgroup, or temporarily taking it out of the hostgroup for maintenance work, ' + - '<code>-1</code> Unknown status.' + '<code>1=ONLINE</code> backend server is fully operational, ' + + '<code>2=SHUNNED</code> backend sever is temporarily taken out of use because of either too many connection errors in a time that was too short, or replication lag exceeded the allowed threshold, ' + + '<code>3=OFFLINE_SOFT</code> when a server is put into OFFLINE_SOFT mode, new incoming connections aren\'t accepted anymore, while the existing connections are kept until they became inactive. In other words, connections are kept in use until the current transaction is completed. This allows to gracefully detach a backend, ' + + '<code>4=OFFLINE_HARD</code> when a server is put into OFFLINE_HARD mode, the existing connections are dropped, while new incoming connections aren\'t accepted either. This is equivalent to deleting the server from a hostgroup, or temporarily taking it out of the hostgroup for maintenance work, ' + + '<code>-1</code> Unknown status.' }, 'proxysql.pool_net': { info: 'The amount of data sent to/received from the backend ' + - '(This does not include metadata (packets\' headers, OK/ERR packets, fields\' description, etc).' + '(This does not include metadata (packets\' headers, OK/ERR packets, fields\' description, etc).' }, 'proxysql.pool_overall_net': { info: 'The amount of data sent to/received from the all backends ' + - '(This does not include metadata (packets\' headers, OK/ERR packets, fields\' description, etc).' + '(This does not include metadata (packets\' headers, OK/ERR packets, fields\' description, etc).' }, 'proxysql.questions': { info: '<code>questions</code> total number of queries sent from frontends, ' + - '<code>slow_queries</code> number of queries that ran for longer than the threshold in milliseconds defined in global variable <code>mysql-long_query_time</code>. ' + '<code>slow_queries</code> number of queries that ran for longer than the threshold in milliseconds defined in global variable <code>mysql-long_query_time</code>. ' }, 'proxysql.connections': { info: '<code>aborted</code> number of frontend connections aborted due to invalid credential or max_connections reached, ' + - '<code>connected</code> number of frontend connections currently connected, ' + - '<code>created</code> number of frontend connections created, ' + - '<code>non_idle</code> number of frontend connections that are not currently idle. ' + '<code>connected</code> number of frontend connections currently connected, ' + + '<code>created</code> number of frontend connections created, ' + + '<code>non_idle</code> number of frontend connections that are not currently idle. ' }, 'proxysql.pool_latency': { @@ -2534,7 +2821,7 @@ netdataDashboard.context = { 'vsphere.host_mem_usage': { info: - '<code>granted</code> is amount of machine memory that is mapped for a host, '+ + '<code>granted</code> is amount of machine memory that is mapped for a host, ' + 'it equals sum of all granted metrics for all powered-on virtual machines, plus machine memory for vSphere services on the host. ' + '<code>consumed</code> is amount of machine memory used on the host, it includes memory used by the Service Console, the VMkernel, vSphere services, plus the total consumed metrics for all running virtual machines. ' + '<code>consumed</code> = <code>total host memory</code> - <code>free host memory</code>.' + @@ -2629,7 +2916,7 @@ netdataDashboard.context = { '<code>2</code>: one or more components in the appliance might be degraded; ' + '<code>3</code>: one or more components might be in an unusable status and the appliance might become unresponsive soon; ' + '<code>4</code>: no health data is available.' - }, + }, 'vcsa.components_health': { info: @@ -2639,7 +2926,7 @@ netdataDashboard.context = { '<code>2</code>: degraded, and may have serious problems; ' + '<code>3</code>: unavailable, or will stop functioning soon; ' + '<code>4</code>: no health data is available.' - }, + }, 'vcsa.software_updates_health': { info: @@ -2649,7 +2936,7 @@ netdataDashboard.context = { '<code>2</code>: non-security updates are available; ' + '<code>3</code>: security updates are available; ' + '<code>4</code>: an error retrieving information on software updates.' - }, + }, // ------------------------------------------------------------------------ // Zookeeper @@ -2661,5 +2948,830 @@ netdataDashboard.context = { '<code>2</code>: follower, ' + '<code>3</code>: observer, ' + '<code>4</code>: standalone.' + }, + + // ------------------------------------------------------------------------ + // Squidlog + + 'squidlog.requests': { + info: 'Total number of requests (log lines read). It includes <code>unmatched</code>.' + }, + + 'squidlog.excluded_requests': { + info: '<code>unmatched</code> counts the lines in the log file that are not matched by the plugin parser (<a href="https://github.com/netdata/netdata/issues/new?title=squidlog%20reports%20unmatched%20lines&body=squidlog%20plugin%20reports%20unmatched%20lines.%0A%0AThis%20is%20my%20log:%0A%0A%60%60%60txt%0A%0Aplease%20paste%20your%20squid%20server%20log%20here%0A%0A%60%60%60" target="_blank">let us know</a> if you have any unmatched).' + }, + + 'squidlog.type_requests': { + info: 'Requests by response type:<br>' + + '<ul>' + + ' <li><code>success</code> includes 1xx, 2xx, 0, 304, 401.</li>' + + ' <li><code>error</code> includes 5xx and 6xx.</li>' + + ' <li><code>redirect</code> includes 3xx except 304.</li>' + + ' <li><code>bad</code> includes 4xx except 401.</li>' + + ' </ul>' + }, + + 'squidlog.http_status_code_class_responses': { + info: 'The HTTP response status code classes. According to <a href="https://tools.ietf.org/html/rfc7231" target="_blank">rfc7231</a>:<br>' + + ' <li><code>1xx</code> is informational responses.</li>' + + ' <li><code>2xx</code> is successful responses.</li>' + + ' <li><code>3xx</code> is redirects.</li>' + + ' <li><code>4xx</code> is bad requests.</li>' + + ' <li><code>5xx</code> is internal server errors.</li>' + + ' </ul>' + + 'Squid also uses <code>0</code> for a result code being unavailable, and <code>6xx</code> to signal an invalid header, a proxy error.' + }, + + 'squidlog.http_status_code_responses': { + info: 'Number of responses for each http response status code individually.' + }, + + 'squidlog.uniq_clients': { + info: 'Unique clients (requesting instances), within each data collection iteration. If data collection is <b>per second</b>, this chart shows <b>unique clients per second</b>.' + }, + + 'squidlog.bandwidth': { + info: 'The size is the amount of data delivered to the clients. Mind that this does not constitute the net object size, as headers are also counted. ' + + 'Also, failed requests may deliver an error page, the size of which is also logged here.' + }, + + 'squidlog.response_time': { + info: 'The elapsed time considers how many milliseconds the transaction busied the cache. It differs in interpretation between TCP and UDP:' + + '<ul>' + + ' <li><code>TCP</code> this is basically the time from having received the request to when Squid finishes sending the last byte of the response.</li>' + + ' <li><code>UDP</code> this is the time between scheduling a reply and actually sending it.</li>' + + ' </ul>' + + 'Please note that <b>the entries are logged after the reply finished being sent</b>, not during the lifetime of the transaction.' + }, + + 'squidlog.cache_result_code_requests': { + info: 'The Squid result code is composed of several tags (separated by underscore characters) which describe the response sent to the client. ' + + 'Check the <a href="https://wiki.squid-cache.org/SquidFaq/SquidLogs#Squid_result_codes">squid documentation</a> about them.' + }, + + 'squidlog.cache_result_code_transport_tag_requests': { + info: 'These tags are always present and describe delivery method.<br>' + + '<ul>' + + ' <li><code>TCP</code> requests on the HTTP port (usually 3128).</li>' + + ' <li><code>UDP</code> requests on the ICP port (usually 3130) or HTCP port (usually 4128).</li>' + + ' <li><code>NONE</code> Squid delivered an unusual response or no response at all. Seen with cachemgr requests and errors, usually when the transaction fails before being classified into one of the above outcomes. Also seen with responses to CONNECT requests.</li>' + + ' </ul>' + }, + + 'squidlog.cache_result_code_handling_tag_requests': { + info: 'These tags are optional and describe why the particular handling was performed or where the request came from.<br>' + + '<ul>' + + ' <li><code>CF</code> at least one request in this transaction was collapsed. See <a href="http://www.squid-cache.org/Doc/config/collapsed_forwarding/" target="_blank">collapsed_forwarding</a> for more details about request collapsing.</li>' + + ' <li><code>CLIENT</code> usually seen with client issued a "no-cache", or analogous cache control command along with the request. Thus, the cache has to validate the object.</li>' + + ' <li><code>IMS</code> the client sent a revalidation (conditional) request.</li>' + + ' <li><code>ASYNC</code> the request was generated internally by Squid. Usually this is background fetches for cache information exchanges, background revalidation from <i>stale-while-revalidate</i> cache controls, or ESI sub-objects being loaded.</li>' + + ' <li><code>SWAPFAIL</code> the object was believed to be in the cache, but could not be accessed. A new copy was requested from the server.</li>' + + ' <li><code>REFRESH</code> a revalidation (conditional) request was sent to the server.</li>' + + ' <li><code>SHARED</code> this request was combined with an existing transaction by collapsed forwarding.</li>' + + ' <li><code>REPLY</code> the HTTP reply from server or peer. Usually seen on <code>DENIED</code> due to <a href="http://www.squid-cache.org/Doc/config/http_reply_access/" target="_blank">http_reply_access</a> ACLs preventing delivery of servers response object to the client.</li>' + + ' </ul>' + }, + + 'squidlog.cache_code_object_tag_requests': { + info: 'These tags are optional and describe what type of object was produced.<br>' + + '<ul>' + + ' <li><code>NEGATIVE</code> only seen on HIT responses, indicating the response was a cached error response. e.g. <b>404 not found</b>.</li>' + + ' <li><code>STALE</code> the object was cached and served stale. This is usually caused by <i>stale-while-revalidate</i> or <i>stale-if-error</i> cache controls.</li>' + + ' <li><code>OFFLINE</code> the requested object was retrieved from the cache during <a href="http://www.squid-cache.org/Doc/config/offline_mode/" target="_blank">offline_mode</a>. The offline mode never validates any object.</li>' + + ' <li><code>INVALID</code> an invalid request was received. An error response was delivered indicating what the problem was.</li>' + + ' <li><code>FAILED</code> only seen on <code>REFRESH</code> to indicate the revalidation request failed. The response object may be the server provided network error or the stale object which was being revalidated depending on stale-if-error cache control.</li>' + + ' <li><code>MODIFIED</code> only seen on <code>REFRESH</code> responses to indicate revalidation produced a new modified object.</li>' + + ' <li><code>UNMODIFIED</code> only seen on <code>REFRESH</code> responses to indicate revalidation produced a 304 (Not Modified) status. The client gets either a full 200 (OK), a 304 (Not Modified), or (in theory) another response, depending on the client request and other details.</li>' + + ' <li><code>REDIRECT</code> Squid generated an HTTP redirect response to this request.</li>' + + ' </ul>' + }, + + 'squidlog.cache_code_load_source_tag_requests': { + info: 'These tags are optional and describe whether the response was loaded from cache, network, or otherwise.<br>' + + '<ul>' + + ' <li><code>HIT</code> the response object delivered was the local cache object.</li>' + + ' <li><code>MEM</code> the response object came from memory cache, avoiding disk accesses. Only seen on HIT responses.</li>' + + ' <li><code>MISS</code> the response object delivered was the network response object.</li>' + + ' <li><code>DENIED</code> the request was denied by access controls.</li>' + + ' <li><code>NOFETCH</code> an ICP specific type, indicating service is alive, but not to be used for this request.</li>' + + ' <li><code>TUNNEL</code> a binary tunnel was established for this transaction.</li>' + + ' </ul>' + }, + + 'squidlog.cache_code_error_tag_requests': { + info: 'These tags are optional and describe some error conditions which occured during response delivery.<br>' + + '<ul>' + + ' <li><code>ABORTED</code> the response was not completed due to the connection being aborted (usually by the client).</li>' + + ' <li><code>TIMEOUT</code> the response was not completed due to a connection timeout.</li>' + + ' <li><code>IGNORED</code> while refreshing a previously cached response A, Squid got a response B that was older than A (as determined by the Date header field). Squid ignored response B (and attempted to use A instead).</li>' + + ' </ul>' + }, + + 'squidlog.http_method_requests': { + info: 'The request method to obtain an object. Please refer to section <a href="https://wiki.squid-cache.org/SquidFaq/SquidLogs#Request_methods">request-methods</a> for available methods and their description.' + }, + + 'squidlog.hier_code_requests': { + info: 'A code that explains how the request was handled, e.g. by forwarding it to a peer, or going straight to the source. ' + + 'Any hierarchy tag may be prefixed with <code>TIMEOUT_</code>, if the timeout occurs waiting for all ICP replies to return from the neighbours. The timeout is either dynamic, if the <a href="http://www.squid-cache.org/Doc/config/icp_query_timeout/" target="_blank">icp_query_timeout</a> was not set, or the time configured there has run up. ' + + 'Refer to <a href="https://wiki.squid-cache.org/SquidFaq/SquidLogs#Hierarchy_Codes" target="_blank">Hierarchy Codes</a> for details on hierarchy codes.' + }, + + 'squidlog.server_address_forwarded_requests': { + info: 'The IP address or hostname where the request (if a miss) was forwarded. For requests sent to origin servers, this is the origin server\'s IP address. ' + + 'For requests sent to a neighbor cache, this is the neighbor\'s hostname. NOTE: older versions of Squid would put the origin server hostname here.' + }, + + 'squidlog.mime_type_requests': { + info: 'The content type of the object as seen in the HTTP reply header. Please note that ICP exchanges usually don\'t have any content type.' + }, + + // ------------------------------------------------------------------------ + // CockroachDB + + 'cockroachdb.process_cpu_time_combined_percentage': { + info: 'Current combined cpu utilization, calculated as <code>(user+system)/num of logical cpus</code>.' + }, + + 'cockroachdb.host_disk_bandwidth': { + info: 'Summary disk bandwidth statistics across all system host disks.' + }, + + 'cockroachdb.host_disk_operations': { + info: 'Summary disk operations statistics across all system host disks.' + }, + + 'cockroachdb.host_disk_iops_in_progress': { + info: 'Summary disk iops in progress statistics across all system host disks.' + }, + + 'cockroachdb.host_network_bandwidth': { + info: 'Summary network bandwidth statistics across all system host network interfaces.' + }, + + 'cockroachdb.host_network_packets': { + info: 'Summary network packets statistics across all system host network interfaces.' + }, + + 'cockroachdb.live_nodes': { + info: 'Will be <code>0</code> if this node is not itself live.' + }, + + 'cockroachdb.total_storage_capacity': { + info: 'Entire disk capacity. It includes non-CR data, CR data, and empty space.' + }, + + 'cockroachdb.storage_capacity_usability': { + info: '<code>usable</code> is sum of empty space and CR data, <code>unusable</code> is space used by non-CR data.' + }, + + 'cockroachdb.storage_usable_capacity': { + info: 'Breakdown of <code>usable</code> space.' + }, + + 'cockroachdb.storage_used_capacity_percentage': { + info: '<code>total</code> is % of <b>total</b> space used, <code>usable</code> is % of <b>usable</b> space used.' + }, + + 'cockroachdb.sql_bandwidth': { + info: 'The total amount of SQL client network traffic.' + }, + + 'cockroachdb.sql_errors': { + info: '<code>statement</code> is statements resulting in a planning or runtime error, ' + + '<code>transaction</code> is SQL transactions abort errors.' + }, + + 'cockroachdb.sql_started_ddl_statements': { + info: 'The amount of <b>started</b> DDL (Data Definition Language) statements. ' + + 'This type means database schema changes. ' + + 'It includes <code>CREATE</code>, <code>ALTER</code>, <code>DROP</code>, <code>RENAME</code>, <code>TRUNCATE</code> and <code>COMMENT</code> statements.' + }, + + 'cockroachdb.sql_executed_ddl_statements': { + info: 'The amount of <b>executed</b> DDL (Data Definition Language) statements. ' + + 'This type means database schema changes. ' + + 'It includes <code>CREATE</code>, <code>ALTER</code>, <code>DROP</code>, <code>RENAME</code>, <code>TRUNCATE</code> and <code>COMMENT</code> statements.' + }, + + 'cockroachdb.sql_started_dml_statements': { + info: 'The amount of <b>started</b> DML (Data Manipulation Language) statements.' + }, + + 'cockroachdb.sql_executed_dml_statements': { + info: 'The amount of <b>executed</b> DML (Data Manipulation Language) statements.' + }, + + 'cockroachdb.sql_started_tcl_statements': { + info: 'The amount of <b>started</b> TCL (Transaction Control Language) statements.' + }, + + 'cockroachdb.sql_executed_tcl_statements': { + info: 'The amount of <b>executed</b> TCL (Transaction Control Language) statements.' + }, + + 'cockroachdb.live_bytes': { + info: 'The amount of live data used by both applications and the CockroachDB system.' + }, + + 'cockroachdb.kv_transactions': { + info: 'KV transactions breakdown:<br>' + + '<ul>' + + ' <li><code>committed</code> committed KV transactions (including 1PC).</li>' + + ' <li><code>fast-path_committed</code> KV transaction on-phase commit attempts.</li>' + + ' <li><code>aborted</code> aborted KV transactions.</li>' + + ' </ul>' + }, + + 'cockroachdb.kv_transaction_restarts': { + info: 'KV transactions restarts breakdown:<br>' + + '<ul>' + + ' <li><code>write too old</code> restarts due to a concurrent writer committing first.</li>' + + ' <li><code>write too old (multiple)</code> restarts due to multiple concurrent writers committing first.</li>' + + ' <li><code>forwarded timestamp (iso=serializable)</code> restarts due to a forwarded commit timestamp and isolation=SERIALIZABLE".</li>' + + ' <li><code>possible replay</code> restarts due to possible replays of command batches at the storage layer.</li>' + + ' <li><code>async consensus failure</code> restarts due to async consensus writes that failed to leave intents.</li>' + + ' <li><code>read within uncertainty interval</code> restarts due to reading a new value within the uncertainty interval.</li>' + + ' <li><code>aborted</code> restarts due to an abort by a concurrent transaction (usually due to deadlock).</li>' + + ' <li><code>push failure</code> restarts due to a transaction push failure.</li>' + + ' <li><code>unknown</code> restarts due to a unknown reasons.</li>' + + ' </ul>' + }, + + 'cockroachdb.ranges': { + info: 'CockroachDB stores all user data (tables, indexes, etc.) and almost all system data in a giant sorted map of key-value pairs. ' + + 'This keyspace is divided into "ranges", contiguous chunks of the keyspace, so that every key can always be found in a single range.' + }, + + 'cockroachdb.ranges_replication_problem': { + info: 'Ranges with not optimal number of replicas:<br>' + + '<ul>' + + ' <li><code>unavailable</code> ranges with fewer live replicas than needed for quorum.</li>' + + ' <li><code>under replicated</code> ranges with fewer live replicas than the replication target.</li>' + + ' <li><code>over replicated</code> ranges with more live replicas than the replication target.</li>' + + ' </ul>' + }, + + 'cockroachdb.replicas': { + info: 'CockroachDB replicates each range (3 times by default) and stores each replica on a different node.' + }, + + 'cockroachdb.replicas_leaders': { + info: 'For each range, one of the replicas is the <code>leader</code> for write requests, <code>not leaseholders</code> is the number of Raft leaders whose range lease is held by another store.' + }, + + 'cockroachdb.replicas_leaseholders': { + info: 'For each range, one of the replicas holds the "range lease". This replica, referred to as the <code>leaseholder</code>, is the one that receives and coordinates all read and write requests for the range.' + }, + + 'cockroachdb.queue_processing_failures': { + info: 'Failed replicas breakdown by queue:<br>' + + '<ul>' + + ' <li><code>gc</code> replicas which failed processing in the GC queue.</li>' + + ' <li><code>replica gc</code> replicas which failed processing in the replica GC queue.</li>' + + ' <li><code>replication</code> replicas which failed processing in the replicate queue.</li>' + + ' <li><code>split</code> replicas which failed processing in the split queue.</li>' + + ' <li><code>consistency</code> replicas which failed processing in the consistency checker queue.</li>' + + ' <li><code>raft log</code> replicas which failed processing in the Raft log queue.</li>' + + ' <li><code>raft snapshot</code> replicas which failed processing in the Raft repair queue.</li>' + + ' <li><code>time series maintenance</code> replicas which failed processing in the time series maintenance queue.</li>' + + ' </ul>' + }, + + 'cockroachdb.rebalancing_queries': { + info: 'Number of kv-level requests received per second by the store, averaged over a large time period as used in rebalancing decisions.' + }, + + 'cockroachdb.rebalancing_writes': { + info: 'Number of keys written (i.e. applied by raft) per second to the store, averaged over a large time period as used in rebalancing decisions.' + }, + + 'cockroachdb.slow_requests': { + info: 'Requests that have been stuck for a long time.' + }, + + 'cockroachdb.timeseries_samples': { + info: 'The amount of metric samples written to disk.' + }, + + 'cockroachdb.timeseries_write_errors': { + info: 'The amount of errors encountered while attempting to write metrics to disk.' + }, + + 'cockroachdb.timeseries_write_bytes': { + info: 'Size of metric samples written to disk.' + }, + + // ------------------------------------------------------------------------ + // eBPF + + 'ebpf.tcp_functions': { + title : 'TCP calls', + info: 'Successful or failed calls to functions <code>tcp_sendmsg</code>, <code>tcp_cleanup_rbuf</code> and <code>tcp_close</code>.' + }, + + 'ebpf.tcp_bandwidth': { + title : 'TCP bandwidth', + info: 'Bytes sent and received for functions <code>tcp_sendmsg</code> and <code>tcp_cleanup_rbuf</code>. We use <code>tcp_cleanup_rbuf</code> instead <code>tcp_recvmsg</code>, because this last misses <code>tcp_read_sock()</code> traffic and we would also need to have more probes to get the socket and package size.' + }, + + 'ebpf.tcp_retransmit': { + title : 'TCP retransmit', + info: 'Number of packets retransmitted for function <code>tcp_retranstmit_skb</code>.' + }, + + 'ebpf.tcp_error': { + title : 'TCP errors', + info: 'Failed calls that to functions <code>tcp_sendmsg</code>, <code>tcp_cleanup_rbuf</code> and <code>tcp_close</code>.' + }, + + 'ebpf.udp_functions': { + title : 'UDP calls', + info: 'Successful or failed calls to functions <code>udp_sendmsg</code> and <code>udp_recvmsg</code>.' + }, + + 'ebpf.udp_bandwidth': { + title : 'UDP bandwidth', + info: 'Bytes sent and received for functions <code>udp_sendmsg</code> and <code>udp_recvmsg</code>.' + }, + + 'ebpf.file_descriptor': { + title : 'File access', + info: 'Calls for internal functions on Linux kernel. The open dimension is attached to the kernel internal function <code>do_sys_open</code> ( For kernels newer than <code>5.5.19</code> we add a kprobe to <code>do_sys_openat2</code>. ), which is the common function called from'+ + ' <a href="https://www.man7.org/linux/man-pages/man2/open.2.html" target="_blank">open(2)</a> ' + + ' and <a href="https://www.man7.org/linux/man-pages/man2/openat.2.html" target="_blank">openat(2)</a>. ' + + ' The close dimension is attached to the function <code>__close_fd</code>, which is called from system call' + + ' <a href="https://www.man7.org/linux/man-pages/man2/close.2.html" target="_blank">close(2)</a>. ' + }, + + 'ebpf.file_error': { + title : 'File access error', + info: 'Failed calls to the kernel internal function <code>do_sys_open</code> ( For kernels newer than <code>5.5.19</code> we add a kprobe to <code>do_sys_openat2</code>. ), which is the common function called from'+ + ' <a href="https://www.man7.org/linux/man-pages/man2/open.2.html" target="_blank">open(2)</a> ' + + ' and <a href="https://www.man7.org/linux/man-pages/man2/openat.2.html" target="_blank">openat(2)</a>. ' + + ' The close dimension is attached to the function <code>__close_fd</code>, which is called from system call' + + ' <a href="https://www.man7.org/linux/man-pages/man2/close.2.html" target="_blank">close(2)</a>. ' + }, + + 'ebpf.deleted_objects': { + title : 'VFS remove', + info: 'This chart does not show all events that remove files from the file system, because file systems can create their own functions to remove files, it shows calls for the function <a href="https://www.kernel.org/doc/htmldocs/filesystems/API-vfs-unlink.html" target="_blank">vfs_unlink</a>. ' + }, + + 'ebpf.io': { + title : 'VFS IO', + info: 'Successful or failed calls to functions <a href="https://topic.alibabacloud.com/a/kernel-state-file-operation-__-work-information-kernel_8_8_20287135.html" target="_blank">vfs_read</a> and <a href="https://topic.alibabacloud.com/a/kernel-state-file-operation-__-work-information-kernel_8_8_20287135.html" target="_blank">vfs_write</a>. This chart may not show all file system events if it uses other functions to store data on disk.' + }, + + 'ebpf.io_bytes': { + title : 'VFS bytes written', + info: 'Total of bytes read or written with success using the functions <a href="https://topic.alibabacloud.com/a/kernel-state-file-operation-__-work-information-kernel_8_8_20287135.html" target="_blank">vfs_read</a> and <a href="https://topic.alibabacloud.com/a/kernel-state-file-operation-__-work-information-kernel_8_8_20287135.html" target="_blank">vfs_write</a>.' + }, + + 'ebpf.io_error': { + title : 'VFS IO error', + info: 'Failed calls to functions <a href="https://topic.alibabacloud.com/a/kernel-state-file-operation-__-work-information-kernel_8_8_20287135.html" target="_blank">vfs_read</a> and <a href="https://topic.alibabacloud.com/a/kernel-state-file-operation-__-work-information-kernel_8_8_20287135.html" target="_blank">vfs_write</a>.' + }, + + 'ebpf.process_thread': { + title : 'Task creation', + info: 'Number of times that either <a href="https://www.ece.uic.edu/~yshi1/linux/lkse/node4.html#SECTION00421000000000000000" target="_blank">do_fork</a>, or <code>kernel_clone</code> if you are running kernel newer than 5.9.16, is called to create a new task, which is the common name used to define process and tasks inside the kernel. Netdata identifies the threads by couting the number of calls for <a href="https://linux.die.net/man/2/clone" target="_blank">sys_clone</a> that has the flag <code>CLONE_THREAD</code> set.' + }, + + 'ebpf.exit': { + title : 'Exit monitoring', + info: 'Calls for the functions responsible for closing (<a href="https://www.informit.com/articles/article.aspx?p=370047&seqNum=4" target="_blank">do_exit</a>) and releasing (<a href="https://www.informit.com/articles/article.aspx?p=370047&seqNum=4" target="_blank">release_task</a>) tasks.' + }, + + 'ebpf.task_error': { + title : 'Task error', + info: 'Number of errors to create a new process or thread.' + }, + + 'ebpf.process_status': { + title : 'Task status', + info: 'Difference between the number of process created and the number of threads created per period(<code>process</code> dimension), it also shows the number of possible zombie process running on system.' + }, + + // ------------------------------------------------------------------------ + // ACLK Internal Stats + 'netdata.aclk_status': { + valueRange: "[0, 1]", + info: 'This chart shows if ACLK was online during entirety of the sample duration.' + }, + + 'netdata.aclk_query_per_second': { + info: 'This chart shows how many queries were added for ACLK_query thread to process and how many it was actually able to process.' + }, + + 'netdata.aclk_latency_mqtt': { + info: 'Measures latency between MQTT publish of the message and it\'s PUB_ACK being received' + }, + + // ------------------------------------------------------------------------ + // VerneMQ + + 'vernemq.sockets': { + mainheads: [ + function (os, id) { + void (os); + return '<div data-netdata="' + id + '"' + + ' data-dimensions="open_sockets"' + + ' data-chart-library="gauge"' + + ' data-title="Connected Clients"' + + ' data-units="clients"' + + ' data-gauge-adjust="width"' + + ' data-width="16%"' + + ' data-before="0"' + + ' data-after="-CHART_DURATION"' + + ' data-points="CHART_DURATION"' + + ' data-colors="' + NETDATA.colors[4] + '"' + + ' data-decimal-digits="2"' + + ' role="application"></div>'; + } + ] + }, + 'vernemq.queue_processes': { + mainheads: [ + function (os, id) { + void (os); + return '<div data-netdata="' + id + '"' + + ' data-dimensions="queue_processes"' + + ' data-chart-library="gauge"' + + ' data-title="Queues Processes"' + + ' data-units="processes"' + + ' data-gauge-adjust="width"' + + ' data-width="16%"' + + ' data-before="0"' + + ' data-after="-CHART_DURATION"' + + ' data-points="CHART_DURATION"' + + ' data-colors="' + NETDATA.colors[4] + '"' + + ' data-decimal-digits="2"' + + ' role="application"></div>'; + } + ] + }, + 'vernemq.queue_messages_in_queues': { + mainheads: [ + function (os, id) { + void (os); + return '<div data-netdata="' + id + '"' + + ' data-dimensions="queue_messages_current"' + + ' data-chart-library="gauge"' + + ' data-title="Messages in the Queues"' + + ' data-units="messages"' + + ' data-gauge-adjust="width"' + + ' data-width="16%"' + + ' data-before="0"' + + ' data-after="-CHART_DURATION"' + + ' data-points="CHART_DURATION"' + + ' data-colors="' + NETDATA.colors[2] + '"' + + ' data-decimal-digits="2"' + + ' role="application"></div>'; + } + ] + }, + 'vernemq.queue_messages': { + mainheads: [ + function (os, id) { + void (os); + return '<div data-netdata="' + id + '"' + + ' data-dimensions="queue_message_in"' + + ' data-chart-library="easypiechart"' + + ' data-title="MQTT Receive Rate"' + + ' data-units="messages/s"' + + ' data-gauge-adjust="width"' + + ' data-width="14%"' + + ' data-before="0"' + + ' data-after="-CHART_DURATION"' + + ' data-points="CHART_DURATION"' + + ' data-colors="' + NETDATA.colors[0] + '"' + + ' data-decimal-digits="2"' + + ' role="application"></div>'; + }, + function (os, id) { + void (os); + return '<div data-netdata="' + id + '"' + + ' data-dimensions="queue_message_out"' + + ' data-chart-library="easypiechart"' + + ' data-title="MQTT Send Rate"' + + ' data-units="messages/s"' + + ' data-gauge-adjust="width"' + + ' data-width="14%"' + + ' data-before="0"' + + ' data-after="-CHART_DURATION"' + + ' data-points="CHART_DURATION"' + + ' data-colors="' + NETDATA.colors[1] + '"' + + ' data-decimal-digits="2"' + + ' role="application"></div>'; + }, + ] + }, + 'vernemq.average_scheduler_utilization': { + mainheads: [ + function (os, id) { + void (os); + return '<div data-netdata="' + id + '"' + + ' data-dimensions="system_utilization"' + + ' data-chart-library="gauge"' + + ' data-gauge-max-value="100"' + + ' data-title="Average Scheduler Utilization"' + + ' data-units="percentage"' + + ' data-gauge-adjust="width"' + + ' data-width="16%"' + + ' data-before="0"' + + ' data-after="-CHART_DURATION"' + + ' data-points="CHART_DURATION"' + + ' data-colors="' + NETDATA.colors[3] + '"' + + ' data-decimal-digits="2"' + + ' role="application"></div>'; + } + ] + }, + + // ------------------------------------------------------------------------ + // Apache Pulsar + 'pulsar.messages_rate': { + mainheads: [ + function (os, id) { + void (os); + return '<div data-netdata="' + id + '"' + + ' data-dimensions="pulsar_rate_in"' + + ' data-chart-library="easypiechart"' + + ' data-title="Publish"' + + ' data-units="messages/s"' + + ' data-gauge-adjust="width"' + + ' data-width="12%"' + + ' data-before="0"' + + ' data-after="-CHART_DURATION"' + + ' data-points="CHART_DURATION"' + + ' data-colors="' + NETDATA.colors[0] + '"' + + ' data-decimal-digits="2"' + + ' role="application"></div>'; + }, + function (os, id) { + void (os); + return '<div data-netdata="' + id + '"' + + ' data-dimensions="pulsar_rate_out"' + + ' data-chart-library="easypiechart"' + + ' data-title="Dispatch"' + + ' data-units="messages/s"' + + ' data-gauge-adjust="width"' + + ' data-width="12%"' + + ' data-before="0"' + + ' data-after="-CHART_DURATION"' + + ' data-points="CHART_DURATION"' + + ' data-colors="' + NETDATA.colors[1] + '"' + + ' data-decimal-digits="2"' + + ' role="application"></div>'; + }, + ] + }, + 'pulsar.subscription_msg_rate_redeliver': { + mainheads: [ + function (os, id) { + void (os); + return '<div data-netdata="' + id + '"' + + ' data-dimensions="pulsar_subscription_msg_rate_redeliver"' + + ' data-chart-library="gauge"' + + ' data-gauge-max-value="100"' + + ' data-title="Redelivered"' + + ' data-units="messages/s"' + + ' data-gauge-adjust="width"' + + ' data-width="14%"' + + ' data-before="0"' + + ' data-after="-CHART_DURATION"' + + ' data-points="CHART_DURATION"' + + ' data-colors="' + NETDATA.colors[3] + '"' + + ' data-decimal-digits="2"' + + ' role="application"></div>'; + } + ] + }, + 'pulsar.subscription_blocked_on_unacked_messages': { + mainheads: [ + function (os, id) { + void (os); + return '<div data-netdata="' + id + '"' + + ' data-dimensions="pulsar_subscription_blocked_on_unacked_messages"' + + ' data-chart-library="gauge"' + + ' data-gauge-max-value="100"' + + ' data-title="Blocked On Unacked"' + + ' data-units="subscriptions"' + + ' data-gauge-adjust="width"' + + ' data-width="14%"' + + ' data-before="0"' + + ' data-after="-CHART_DURATION"' + + ' data-points="CHART_DURATION"' + + ' data-colors="' + NETDATA.colors[3] + '"' + + ' data-decimal-digits="2"' + + ' role="application"></div>'; + } + ] + }, + 'pulsar.msg_backlog': { + mainheads: [ + function (os, id) { + void (os); + return '<div data-netdata="' + id + '"' + + ' data-dimensions="pulsar_msg_backlog"' + + ' data-chart-library="gauge"' + + ' data-gauge-max-value="100"' + + ' data-title="Messages Backlog"' + + ' data-units="messages"' + + ' data-gauge-adjust="width"' + + ' data-width="14%"' + + ' data-before="0"' + + ' data-after="-CHART_DURATION"' + + ' data-points="CHART_DURATION"' + + ' data-colors="' + NETDATA.colors[2] + '"' + + ' data-decimal-digits="2"' + + ' role="application"></div>'; + } + ] + }, + + 'pulsar.namespace_messages_rate': { + heads: [ + function (os, id) { + void (os); + return '<div data-netdata="' + id + '"' + + ' data-dimensions="publish"' + + ' data-chart-library="easypiechart"' + + ' data-title="Publish"' + + ' data-units="messages/s"' + + ' data-gauge-adjust="width"' + + ' data-width="12%"' + + ' data-before="0"' + + ' data-after="-CHART_DURATION"' + + ' data-points="CHART_DURATION"' + + ' data-colors="' + NETDATA.colors[0] + '"' + + ' data-decimal-digits="2"' + + ' role="application"></div>'; + }, + function (os, id) { + void (os); + return '<div data-netdata="' + id + '"' + + ' data-dimensions="dispatch"' + + ' data-chart-library="easypiechart"' + + ' data-title="Dispatch"' + + ' data-units="messages/s"' + + ' data-gauge-adjust="width"' + + ' data-width="12%"' + + ' data-before="0"' + + ' data-after="-CHART_DURATION"' + + ' data-points="CHART_DURATION"' + + ' data-colors="' + NETDATA.colors[1] + '"' + + ' data-decimal-digits="2"' + + ' role="application"></div>'; + }, + ] + }, + 'pulsar.namespace_subscription_msg_rate_redeliver': { + heads: [ + function (os, id) { + void (os); + return '<div data-netdata="' + id + '"' + + ' data-dimensions="redelivered"' + + ' data-chart-library="gauge"' + + ' data-gauge-max-value="100"' + + ' data-title="Redelivered"' + + ' data-units="messages/s"' + + ' data-gauge-adjust="width"' + + ' data-width="14%"' + + ' data-before="0"' + + ' data-after="-CHART_DURATION"' + + ' data-points="CHART_DURATION"' + + ' data-colors="' + NETDATA.colors[3] + '"' + + ' data-decimal-digits="2"' + + ' role="application"></div>'; + } + ] + }, + 'pulsar.namespace_subscription_blocked_on_unacked_messages': { + heads: [ + function (os, id) { + void (os); + return '<div data-netdata="' + id + '"' + + ' data-dimensions="blocked"' + + ' data-chart-library="gauge"' + + ' data-gauge-max-value="100"' + + ' data-title="Blocked On Unacked"' + + ' data-units="subscriptions"' + + ' data-gauge-adjust="width"' + + ' data-width="14%"' + + ' data-before="0"' + + ' data-after="-CHART_DURATION"' + + ' data-points="CHART_DURATION"' + + ' data-colors="' + NETDATA.colors[3] + '"' + + ' data-decimal-digits="2"' + + ' role="application"></div>'; } + ] + }, + 'pulsar.namespace_msg_backlog': { + heads: [ + function (os, id) { + void (os); + return '<div data-netdata="' + id + '"' + + ' data-dimensions="backlog"' + + ' data-chart-library="gauge"' + + ' data-gauge-max-value="100"' + + ' data-title="Messages Backlog"' + + ' data-units="messages"' + + ' data-gauge-adjust="width"' + + ' data-width="14%"' + + ' data-before="0"' + + ' data-after="-CHART_DURATION"' + + ' data-points="CHART_DURATION"' + + ' data-colors="' + NETDATA.colors[2] + '"' + + ' data-decimal-digits="2"' + + ' role="application"></div>'; + }, + ], + }, + + // ------------------------------------------------------------------------ + // Nvidia-smi + + 'nvidia_smi.fan_speed': { + heads: [ + function (os, id) { + void (os); + return '<div data-netdata="' + id + '"' + + ' data-dimensions="speed"' + + ' data-chart-library="easypiechart"' + + ' data-title="Fan Speed"' + + ' data-units="percentage"' + + ' data-gauge-adjust="width"' + + ' data-width="12%"' + + ' data-before="0"' + + ' data-after="-CHART_DURATION"' + + ' data-points="CHART_DURATION"' + + ' data-colors="' + NETDATA.colors[4] + '"' + + ' data-decimal-digits="2"' + + ' role="application"></div>'; + } + ] + }, + 'nvidia_smi.temperature': { + heads: [ + function (os, id) { + void (os); + return '<div data-netdata="' + id + '"' + + ' data-dimensions="temp"' + + ' data-chart-library="easypiechart"' + + ' data-title="Temperature"' + + ' data-units="celsius"' + + ' data-gauge-adjust="width"' + + ' data-width="12%"' + + ' data-before="0"' + + ' data-after="-CHART_DURATION"' + + ' data-points="CHART_DURATION"' + + ' data-colors="' + NETDATA.colors[3] + '"' + + ' data-decimal-digits="2"' + + ' role="application"></div>'; + } + ] + }, + 'nvidia_smi.memory_allocated': { + heads: [ + function (os, id) { + void (os); + return '<div data-netdata="' + id + '"' + + ' data-dimensions="used"' + + ' data-chart-library="easypiechart"' + + ' data-title="Used Memory"' + + ' data-units="MiB"' + + ' data-gauge-adjust="width"' + + ' data-width="12%"' + + ' data-before="0"' + + ' data-after="-CHART_DURATION"' + + ' data-points="CHART_DURATION"' + + ' data-colors="' + NETDATA.colors[4] + '"' + + ' data-decimal-digits="2"' + + ' role="application"></div>'; + } + ] + }, + 'nvidia_smi.power': { + heads: [ + function (os, id) { + void (os); + return '<div data-netdata="' + id + '"' + + ' data-dimensions="power"' + + ' data-chart-library="easypiechart"' + + ' data-title="Power Utilization"' + + ' data-units="watts"' + + ' data-gauge-adjust="width"' + + ' data-width="12%"' + + ' data-before="0"' + + ' data-after="-CHART_DURATION"' + + ' data-points="CHART_DURATION"' + + ' data-colors="' + NETDATA.colors[2] + '"' + + ' data-decimal-digits="2"' + + ' role="application"></div>'; + } + ] + }, }; diff --git a/web/gui/demo2.html b/web/gui/demo2.html index 05ca72084..650acfe0e 100644 --- a/web/gui/demo2.html +++ b/web/gui/demo2.html @@ -15,14 +15,14 @@ <meta property="og:locale" content="en_US" /> <meta property="og:image" content="https://cloud.githubusercontent.com/assets/2662304/22945737/e98cd0c6-f2fd-11e6-96f1-5501934b0955.png"/> - <meta property="og:url" content="http://my-netdata.io/"/> + <meta property="og:url" content="https://my-netdata.io/"/> <meta property="og:type" content="website"/> <meta property="og:site_name" content="netdata"/> <meta property="og:title" content="netdata - real-time performance monitoring, done right!"/> <meta property="og:description" content="Stunning real-time dashboards, blazingly fast and extremely interactive. Zero configuration, zero dependencies, zero maintenance." /> </head> <script>var netdataTheme = 'slate';</script> -<script type="text/javascript" src="http://my-netdata.io/dashboard.js?v20190902-0"></script> +<script type="text/javascript" src="https://my-netdata.io/dashboard.js?v20190902-0"></script> <body> <div class="container" style="width: 90%; padding-top: 10px; text-align: center; color: #AAA"> diff --git a/web/gui/images/favicon-128.png b/web/gui/images/favicon-128.png Binary files differnew file mode 100644 index 000000000..5371f920c --- /dev/null +++ b/web/gui/images/favicon-128.png diff --git a/web/gui/images/favicon-196x196.png b/web/gui/images/favicon-196x196.png Binary files differnew file mode 100644 index 000000000..a208c27fa --- /dev/null +++ b/web/gui/images/favicon-196x196.png diff --git a/web/gui/images/ms-icon-310x150.png b/web/gui/images/ms-icon-310x150.png Binary files differnew file mode 100644 index 000000000..5d4ac57b6 --- /dev/null +++ b/web/gui/images/ms-icon-310x150.png diff --git a/web/gui/images/ms-icon-36x36.png b/web/gui/images/ms-icon-36x36.png Binary files differnew file mode 100644 index 000000000..e251302ed --- /dev/null +++ b/web/gui/images/ms-icon-36x36.png diff --git a/web/gui/images/packaging-beta-tag.svg b/web/gui/images/packaging-beta-tag.svg new file mode 100644 index 000000000..cebdc0847 --- /dev/null +++ b/web/gui/images/packaging-beta-tag.svg @@ -0,0 +1,42 @@ +<svg width="127" height="16" viewBox="0 0 127 16" fill="none" xmlns="http://www.w3.org/2000/svg"> +<rect width="127" height="16" rx="2" fill="url(#paint0_linear)"/> +<path d="M86 0H125C126.105 0 127 0.895431 127 2V14C127 15.1046 126.105 16 125 16H86V0Z" fill="url(#paint1_linear)"/> +<path d="M6.5 4V10" stroke="white" stroke-linecap="round" stroke-linejoin="round"/> +<path d="M12.5 7C13.3284 7 14 6.32843 14 5.5C14 4.67157 13.3284 4 12.5 4C11.6716 4 11 4.67157 11 5.5C11 6.32843 11.6716 7 12.5 7Z" stroke="white" stroke-linecap="round" stroke-linejoin="round"/> +<path d="M6.5 13C7.32843 13 8 12.3284 8 11.5C8 10.6716 7.32843 10 6.5 10C5.67157 10 5 10.6716 5 11.5C5 12.3284 5.67157 13 6.5 13Z" stroke="white" stroke-linecap="round" stroke-linejoin="round"/> +<path d="M12.5 7C12.5 8.19347 12.0259 9.33807 11.182 10.182C10.3381 11.0259 9.19347 11.5 8 11.5" stroke="white" stroke-linecap="round" stroke-linejoin="round"/> +<g filter="url(#filter0_d)"> +<path d="M23.939 7.93848V11H22.9077V3.17969H25.792C26.6478 3.17969 27.3174 3.39811 27.8008 3.83496C28.2878 4.27181 28.5312 4.8501 28.5312 5.56982C28.5312 6.32894 28.2931 6.91439 27.8169 7.32617C27.3442 7.73438 26.6657 7.93848 25.7812 7.93848H23.939ZM23.939 7.09521H25.792C26.3434 7.09521 26.766 6.96631 27.0596 6.7085C27.3532 6.4471 27.5 6.07113 27.5 5.58057C27.5 5.11507 27.3532 4.74268 27.0596 4.46338C26.766 4.18408 26.3631 4.03906 25.8511 4.02832H23.939V7.09521ZM33.6548 11C33.5976 10.8854 33.551 10.6813 33.5152 10.3877C33.0533 10.8675 32.5018 11.1074 31.8609 11.1074C31.288 11.1074 30.8171 10.9463 30.4483 10.624C30.0831 10.2982 29.9004 9.88639 29.9004 9.38867C29.9004 8.78353 30.1296 8.31445 30.5879 7.98145C31.0499 7.64486 31.698 7.47656 32.5323 7.47656H33.4991V7.02002C33.4991 6.67269 33.3952 6.39697 33.1876 6.19287C32.9799 5.98519 32.6737 5.88135 32.2691 5.88135C31.9146 5.88135 31.6174 5.97087 31.3775 6.1499C31.1376 6.32894 31.0176 6.54557 31.0176 6.7998H30.0186C30.0186 6.50977 30.1207 6.23047 30.3248 5.96191C30.5324 5.68978 30.8117 5.47493 31.1627 5.31738C31.5171 5.15983 31.9057 5.08105 32.3282 5.08105C32.9978 5.08105 33.5224 5.24935 33.9019 5.58594C34.2815 5.91895 34.4784 6.37907 34.4927 6.96631V9.64111C34.4927 10.1746 34.5608 10.599 34.6968 10.9141V11H33.6548ZM32.0059 10.2427C32.3174 10.2427 32.6129 10.1621 32.8921 10.001C33.1714 9.83984 33.3738 9.63037 33.4991 9.37256V8.18018H32.7203C31.5028 8.18018 30.8941 8.53646 30.8941 9.24902C30.8941 9.56055 30.9979 9.80404 31.2056 9.97949C31.4133 10.1549 31.6801 10.2427 32.0059 10.2427ZM38.8214 10.2964C39.1759 10.2964 39.4856 10.189 39.7506 9.97412C40.0156 9.75928 40.1624 9.49072 40.191 9.16846H41.131C41.1131 9.50146 40.9985 9.81836 40.7872 10.1191C40.576 10.4199 40.2931 10.6598 39.9386 10.8389C39.5877 11.0179 39.2153 11.1074 38.8214 11.1074C38.0301 11.1074 37.3999 10.8442 36.9308 10.3179C36.4653 9.78792 36.2325 9.06462 36.2325 8.14795V7.98145C36.2325 7.41569 36.3364 6.9126 36.5441 6.47217C36.7517 6.03174 37.0489 5.68978 37.4357 5.44629C37.826 5.2028 38.2861 5.08105 38.816 5.08105C39.4677 5.08105 40.0084 5.2762 40.4381 5.6665C40.8714 6.0568 41.1023 6.56348 41.131 7.18652H40.191C40.1624 6.81055 40.0192 6.5026 39.7613 6.2627C39.5071 6.01921 39.192 5.89746 38.816 5.89746C38.3112 5.89746 37.9191 6.08008 37.6398 6.44531C37.364 6.80697 37.2262 7.33154 37.2262 8.01904V8.20703C37.2262 8.87663 37.364 9.39225 37.6398 9.75391C37.9155 10.1156 38.3094 10.2964 38.8214 10.2964ZM44.3102 8.30908L43.6872 8.95898V11H42.6935V2.75H43.6872V7.73975L44.2189 7.10059L46.029 5.18848H47.2375L44.9762 7.61621L47.5007 11H46.3351L44.3102 8.30908ZM52.2913 11C52.234 10.8854 52.1874 10.6813 52.1516 10.3877C51.6897 10.8675 51.1383 11.1074 50.4973 11.1074C49.9244 11.1074 49.4535 10.9463 49.0847 10.624C48.7195 10.2982 48.5369 9.88639 48.5369 9.38867C48.5369 8.78353 48.766 8.31445 49.2244 7.98145C49.6863 7.64486 50.3344 7.47656 51.1687 7.47656H52.1355V7.02002C52.1355 6.67269 52.0316 6.39697 51.824 6.19287C51.6163 5.98519 51.3101 5.88135 50.9055 5.88135C50.551 5.88135 50.2538 5.97087 50.0139 6.1499C49.774 6.32894 49.654 6.54557 49.654 6.7998H48.655C48.655 6.50977 48.7571 6.23047 48.9612 5.96191C49.1689 5.68978 49.4482 5.47493 49.7991 5.31738C50.1536 5.15983 50.5421 5.08105 50.9646 5.08105C51.6342 5.08105 52.1588 5.24935 52.5383 5.58594C52.9179 5.91895 53.1148 6.37907 53.1291 6.96631V9.64111C53.1291 10.1746 53.1972 10.599 53.3332 10.9141V11H52.2913ZM50.6423 10.2427C50.9538 10.2427 51.2493 10.1621 51.5286 10.001C51.8079 9.83984 52.0102 9.63037 52.1355 9.37256V8.18018H51.3567C50.1392 8.18018 49.5305 8.53646 49.5305 9.24902C49.5305 9.56055 49.6343 9.80404 49.842 9.97949C50.0497 10.1549 50.3165 10.2427 50.6423 10.2427ZM54.8904 8.0459C54.8904 7.13997 55.0999 6.42025 55.5188 5.88672C55.9378 5.34961 56.4928 5.08105 57.1839 5.08105C57.8929 5.08105 58.4461 5.33171 58.8436 5.83301L58.8919 5.18848H59.7996V10.8604C59.7996 11.6123 59.5758 12.2049 59.1282 12.6382C58.6842 13.0715 58.0862 13.2881 57.3343 13.2881C56.9153 13.2881 56.5053 13.1986 56.1043 13.0195C55.7033 12.8405 55.3971 12.5952 55.1858 12.2837L55.7015 11.6875C56.1276 12.2139 56.6486 12.4771 57.2645 12.4771C57.7479 12.4771 58.1238 12.341 58.3924 12.0688C58.6645 11.7967 58.8006 11.4136 58.8006 10.9194V10.4199C58.4031 10.8783 57.8606 11.1074 57.1731 11.1074C56.4928 11.1074 55.9414 10.8335 55.5188 10.2856C55.0999 9.73779 54.8904 8.99121 54.8904 8.0459ZM55.8895 8.15869C55.8895 8.81396 56.0237 9.32959 56.2923 9.70557C56.5608 10.078 56.9368 10.2642 57.4202 10.2642C58.0468 10.2642 58.507 9.97949 58.8006 9.41016V6.75684C58.4962 6.20182 58.0397 5.92432 57.431 5.92432C56.9476 5.92432 56.5698 6.1123 56.2977 6.48828C56.0255 6.86426 55.8895 7.42106 55.8895 8.15869ZM62.8231 11H61.8295V5.18848H62.8231V11ZM61.7489 3.64697C61.7489 3.48584 61.7972 3.34977 61.8939 3.23877C61.9942 3.12777 62.141 3.07227 62.3343 3.07227C62.5277 3.07227 62.6745 3.12777 62.7748 3.23877C62.875 3.34977 62.9252 3.48584 62.9252 3.64697C62.9252 3.80811 62.875 3.94238 62.7748 4.0498C62.6745 4.15723 62.5277 4.21094 62.3343 4.21094C62.141 4.21094 61.9942 4.15723 61.8939 4.0498C61.7972 3.94238 61.7489 3.80811 61.7489 3.64697ZM65.7983 5.18848L65.8305 5.91895C66.2745 5.36035 66.8546 5.08105 67.5707 5.08105C68.7989 5.08105 69.4184 5.77393 69.4291 7.15967V11H68.4355V7.1543C68.4319 6.73535 68.3352 6.42562 68.1454 6.2251C67.9592 6.02458 67.6674 5.92432 67.2699 5.92432C66.9477 5.92432 66.6648 6.01025 66.4213 6.18213C66.1778 6.354 65.988 6.57959 65.852 6.85889V11H64.8583V5.18848H65.7983ZM71.1313 8.0459C71.1313 7.13997 71.3408 6.42025 71.7597 5.88672C72.1787 5.34961 72.7337 5.08105 73.4248 5.08105C74.1338 5.08105 74.687 5.33171 75.0845 5.83301L75.1328 5.18848H76.0405V10.8604C76.0405 11.6123 75.8167 12.2049 75.3691 12.6382C74.9251 13.0715 74.3271 13.2881 73.5752 13.2881C73.1562 13.2881 72.7462 13.1986 72.3452 13.0195C71.9442 12.8405 71.638 12.5952 71.4267 12.2837L71.9424 11.6875C72.3685 12.2139 72.8895 12.4771 73.5054 12.4771C73.9888 12.4771 74.3647 12.341 74.6333 12.0688C74.9054 11.7967 75.0415 11.4136 75.0415 10.9194V10.4199C74.644 10.8783 74.1015 11.1074 73.414 11.1074C72.7337 11.1074 72.1823 10.8335 71.7597 10.2856C71.3408 9.73779 71.1313 8.99121 71.1313 8.0459ZM72.1304 8.15869C72.1304 8.81396 72.2646 9.32959 72.5332 9.70557C72.8017 10.078 73.1777 10.2642 73.6611 10.2642C74.2877 10.2642 74.7479 9.97949 75.0415 9.41016V6.75684C74.7371 6.20182 74.2806 5.92432 73.6719 5.92432C73.1885 5.92432 72.8107 6.1123 72.5386 6.48828C72.2664 6.86426 72.1304 7.42106 72.1304 8.15869Z" fill="white"/> +</g> +<g filter="url(#filter1_d)"> +<path d="M93.7949 12V4.17969H96.4751C97.3595 4.17969 98.0327 4.35693 98.4946 4.71143C98.9565 5.06592 99.1875 5.59408 99.1875 6.2959C99.1875 6.65397 99.0908 6.97624 98.8975 7.2627C98.7041 7.54915 98.4212 7.77116 98.0488 7.92871C98.4714 8.04329 98.7972 8.25993 99.0264 8.57861C99.2591 8.89372 99.3755 9.27327 99.3755 9.71729C99.3755 10.4513 99.1392 11.0153 98.6665 11.4092C98.1974 11.8031 97.5243 12 96.647 12H93.7949ZM95.1538 8.47119V10.915H96.6631C97.0892 10.915 97.4222 10.8094 97.6621 10.5981C97.902 10.3869 98.022 10.0933 98.022 9.71729C98.022 8.90446 97.6066 8.4891 96.7759 8.47119H95.1538ZM95.1538 7.47217H96.4858C96.9084 7.47217 97.2378 7.37728 97.4741 7.1875C97.714 6.99414 97.834 6.72201 97.834 6.37109C97.834 5.98438 97.723 5.70508 97.501 5.5332C97.2826 5.36133 96.9406 5.27539 96.4751 5.27539H95.1538V7.47217ZM105.745 8.50879H102.533V10.915H106.288V12H101.174V4.17969H106.25V5.27539H102.533V7.43457H105.745V8.50879ZM113.592 5.27539H111.153V12H109.805V5.27539H107.388V4.17969H113.592V5.27539ZM118.796 10.1792H115.767L115.133 12H113.72L116.674 4.17969H117.894L120.853 12H119.435L118.796 10.1792ZM116.148 9.0835H118.415L117.281 5.83936L116.148 9.0835Z" fill="white"/> +</g> +<defs> +<filter id="filter0_d" x="21.9077" y="2.75" width="55.1328" height="12.5381" filterUnits="userSpaceOnUse" color-interpolation-filters="sRGB"> +<feFlood flood-opacity="0" result="BackgroundImageFix"/> +<feColorMatrix in="SourceAlpha" type="matrix" values="0 0 0 0 0 0 0 0 0 0 0 0 0 0 0 0 0 0 127 0"/> +<feOffset dy="1"/> +<feGaussianBlur stdDeviation="0.5"/> +<feColorMatrix type="matrix" values="0 0 0 0 0 0 0 0 0 0 0 0 0 0 0 0 0 0 0.5 0"/> +<feBlend mode="normal" in2="BackgroundImageFix" result="effect1_dropShadow"/> +<feBlend mode="normal" in="SourceGraphic" in2="effect1_dropShadow" result="shape"/> +</filter> +<filter id="filter1_d" x="92.7949" y="4.17969" width="29.0583" height="9.82031" filterUnits="userSpaceOnUse" color-interpolation-filters="sRGB"> +<feFlood flood-opacity="0" result="BackgroundImageFix"/> +<feColorMatrix in="SourceAlpha" type="matrix" values="0 0 0 0 0 0 0 0 0 0 0 0 0 0 0 0 0 0 127 0"/> +<feOffset dy="1"/> +<feGaussianBlur stdDeviation="0.5"/> +<feColorMatrix type="matrix" values="0 0 0 0 0 0 0 0 0 0 0 0 0 0 0 0 0 0 0.5 0"/> +<feBlend mode="normal" in2="BackgroundImageFix" result="effect1_dropShadow"/> +<feBlend mode="normal" in="SourceGraphic" in2="effect1_dropShadow" result="shape"/> +</filter> +<linearGradient id="paint0_linear" x1="63.5" y1="0" x2="63.5" y2="16" gradientUnits="userSpaceOnUse"> +<stop stop-color="#606060"/> +<stop offset="1" stop-color="#4D4D4D"/> +</linearGradient> +<linearGradient id="paint1_linear" x1="106.5" y1="0" x2="106.5" y2="16" gradientUnits="userSpaceOnUse"> +<stop stop-color="#BFBFBF"/> +<stop offset="1" stop-color="#7F7F7F"/> +</linearGradient> +</defs> +</svg> diff --git a/web/gui/images/seo-performance-128.png b/web/gui/images/seo-performance-128.png Binary files differnew file mode 100644 index 000000000..2a212a475 --- /dev/null +++ b/web/gui/images/seo-performance-128.png diff --git a/web/gui/index.html b/web/gui/index.html index 41017936c..d3099101f 100644 --- a/web/gui/index.html +++ b/web/gui/index.html @@ -1315,7 +1315,7 @@ </div> </div> </div> - <iframe id="ssoifrm" width="0" height="0"></iframe> + <iframe id="ssoifrm" width="0" height="0" style="border: none;"></iframe> <div id="hiddenDownloadLinks" style="display: none;" hidden></div> <script type="text/javascript" src="dashboard.js?v20190902-0"></script> </body> diff --git a/web/gui/main.js b/web/gui/main.js index 0635b07a7..5bf11e5f7 100644 --- a/web/gui/main.js +++ b/web/gui/main.js @@ -499,10 +499,26 @@ function toggleAgentItem(e, guid) { // When you stream metrics from netdata to netdata, the recieving netdata now // has multiple host databases. It's own, and multiple mirrored. Mirrored databases // can be accessed with <http://localhost:19999/host/NAME/> +const OLD_DASHBOARD_SUFFIX = "old" +let isOldSuffix = true +try { + const currentScriptMainJs = document.currentScript; + const mainJsSrc = currentScriptMainJs.getAttribute("src") + isOldSuffix = mainJsSrc.startsWith("../main.js") +} catch { + console.warn("current script not detecting, assuming the dashboard is running with /old suffix") +} + +function transformWithOldSuffix(url) { + return isOldSuffix ? `../${url}` : url +} + function renderStreamedHosts(options) { let html = `<div class="info-item">Databases streamed to this agent</div>`; - var base = document.location.origin.toString() + document.location.pathname.toString(); + var base = document.location.origin.toString() + + document.location.pathname.toString() + .replace(isOldSuffix ? `/${OLD_DASHBOARD_SUFFIX}` : "", ""); if (base.endsWith("/host/" + options.hostname + "/")) { base = base.substring(0, base.length - ("/host/" + options.hostname + "/").toString().length); } @@ -536,10 +552,10 @@ function renderStreamedHosts(options) { displayedDatabases = true; if (hostname === master) { - url = `${base}/`; + url = isOldSuffix ? `${base}/${OLD_DASHBOARD_SUFFIX}/` : `${base}/`; icon = 'home'; } else { - url = `${base}/host/${hostname}/`; + url = isOldSuffix ? `${base}/host/${hostname}/${OLD_DASHBOARD_SUFFIX}/` : `${base}/host/${hostname}/`; icon = 'window-restore'; } @@ -707,10 +723,9 @@ function clearMyNetdataMenu() { } function errorMyNetdataMenu() { - setMyNetdataMenu(`<div class="agent-item" style="white-space: nowrap"> + setMyNetdataMenu(`<div class="agent-item" style="padding: 0 8px"> <i class="fas fa-exclamation-triangle" style="color: red"></i> - Cannot load known netdata agents from netdata.cloud! - <div></div> + Cannot load known Netdata agents from Netdata Cloud! Please make sure you have the latest version of Netdata. </div>`); } @@ -791,11 +806,6 @@ function renderMyNetdataMenu(machinesArray) { if (!isSignedIn()) { html += ( `<div class="agent-item"> - <i class="fas fa-tv"></i> - <a onClick="openAuthenticatedUrl('console.html');" target="_blank">Nodes<sup class="beta"> beta</sup></a> - <div></div> - </div> - <div class="agent-item"> <i class="fas fa-cog""></i> <a href="#" onclick="switchRegistryModalHandler(); return false;">Switch Identity</a> <div></div> @@ -965,7 +975,7 @@ function gotoServerModalHandler(guid) { if (!isSignedIn()) { // When the registry is enabled, if the user's known URLs are not working - // we consult the registry to get additional URLs. + // we consult the registry to get additional URLs. setTimeout(function () { if (gotoServerStop === false) { document.getElementById('gotoServerResponse').innerHTML = '<b>Added all the known URLs for this machine.</b>'; @@ -1805,8 +1815,8 @@ function renderPage(menus, data) { const isMemoryModeDbEngine = data.memory_mode === "dbengine"; - sidebar += '<li class="" style="padding-top:15px;"><a href="https://github.com/netdata/netdata/blob/master/docs/Add-more-charts-to-netdata.md#add-more-charts-to-netdata" target="_blank"><i class="fas fa-plus"></i> add more charts</a></li>'; - sidebar += '<li class=""><a href="https://github.com/netdata/netdata/tree/master/health#Health-monitoring" target="_blank"><i class="fas fa-plus"></i> add more alarms</a></li>'; + sidebar += '<li class="" style="padding-top:15px;"><a href="https://docs.netdata.cloud/collectors/quickstart/" target="_blank"><i class="fas fa-plus"></i> Add more charts</a></li>'; + sidebar += '<li class=""><a href="https://docs.netdata.cloud/health/quickstart/" target="_blank"><i class="fas fa-plus"></i> Add more alarms</a></li>'; sidebar += '<li class="" style="margin:20px;color:#666;"><small>Every ' + ((data.update_every === 1) ? 'second' : data.update_every.toString() + ' seconds') + ', ' + 'Netdata collects <strong>' + data.dimensions_count.toLocaleString() + '</strong> metrics on ' + @@ -1818,7 +1828,7 @@ function renderPage(menus, data) { if (!isMemoryModeDbEngine) { sidebar += '<br /> <br />Get more history by ' + - '<a href="https://docs.netdata.cloud/docs/configuration-guide/#increase-the-metrics-retention-period" target=_blank>configuring Netdata\'s <strong>history</strong></a> or using the <a href="https://docs.netdata.cloud/database/engine/" target=_blank>DB engine.</a>' + '<a href="https://docs.netdata.cloud/docs/configuration-guide/#increase-the-metrics-retention-period" target=_blank>configuring Netdata\'s <strong>history</strong></a> or using the <a href="https://docs.netdata.cloud/database/engine/" target=_blank>DB engine.</a>'; } sidebar += '<br/> <br/><strong>netdata</strong><br/>' + data.version.toString() + '</small></li>'; @@ -1933,7 +1943,7 @@ function renderChartsAndMenu(data) { function loadJs(url, callback) { $.ajax({ - url: url, + url: url.startsWith("http") ? url : transformWithOldSuffix(url), cache: true, dataType: "script", xhrFields: { withCredentials: true } // required for the cookie @@ -1980,7 +1990,7 @@ function loadBootstrapSlider(callback) { if (bootstrapSliderLoaded === false) { bootstrapSliderLoaded = true; loadJs('lib/bootstrap-slider-10.0.0.min.js', function () { - NETDATA._loadCSS('css/bootstrap-slider-10.0.0.min.css'); + NETDATA._loadCSS(transformWithOldSuffix("css/bootstrap-slider-10.0.0.min.css")); callback(); }); } else { @@ -4806,11 +4816,7 @@ function signInDidClick(e) { } function shouldShowSignInBanner() { - if (isSignedIn()) { - return false; - } - - return localStorage.getItem("signInBannerClosed") != "true"; + return false; } function closeSignInBanner() { @@ -4894,43 +4900,6 @@ function signOut() { cloudSSOSignOut(); } -function renderAccountUI() { - if (!NETDATA.registry.isCloudEnabled) { - return - } - - const container = document.getElementById("account-menu-container"); - if (isSignedIn()) { - container.removeAttribute("title"); - container.removeAttribute("data-original-title"); - container.removeAttribute("data-placement"); - container.innerHTML = ( - `<a href="#" class="dropdown-toggle" data-toggle="dropdown"><span id="amc-account-name"></span> <strong class="caret"></strong></a> - <ul id="cloud-menu" class="dropdown-menu scrollable-menu inpagemenu" role="menu"> - <li> - <a onclick="openAuthenticatedUrl('console.html');" target="_blank" class="btn"> - <i class="fas fa-tv"></i> <span class="hidden-sm hidden-md">Nodes<sup class="beta"> beta</sup></span> - </a> - </li> - <li> - <a href="#" class="btn" onclick="signOutDidClick(event); return false"> - <i class="fas fa-sign-out-alt"></i> <span class="hidden-sm hidden-md">Sign Out</span> - </a> - </li> - </ul>` - ) - document.getElementById("amc-account-name").textContent = cloudAccountName; // Anti-XSS - } else { - container.setAttribute("data-original-title", "sign in"); - container.setAttribute("data-placement", "bottom"); - container.innerHTML = ( - `<a href="#" class="btn sign-in-btn theme-${netdataTheme}" onclick="signInDidClick(event); return false"> - <i class="fas fa-sign-in-alt"></i> <span class="hidden-sm hidden-md">Sign In</span> - </a>` - ) - } -} - function handleMessage(e) { switch (e.data.type) { case "sign-in": @@ -4956,13 +4925,13 @@ function handleSignInMessage(e) { netdataRegistryCallback(registryAgents); if (e.data.redirectURI && !window.location.href.includes(e.data.redirectURI)) { - window.location.replace(e.data.redirectURI); + // lgtm false-positive - redirectURI does not come from user input, but from iframe callback + window.location.replace(e.data.redirectURI); // lgtm[js/client-side-unvalidated-url-redirection] } } function handleSignOutMessage(e) { clearCloudVariables(); - renderAccountUI(); renderMyNetdataMenu(registryAgents); } @@ -5116,7 +5085,6 @@ function initCloud() { } touchAgent(); - renderAccountUI(); } // This callback is called after NETDATA.registry is initialized. @@ -5128,7 +5096,7 @@ function netdataRegistryCallback(machinesArray) { registryAgents = machinesArray; if (isSignedIn()) { - // We call getCloudAccountAgents() here because it requires that + // We call getCloudAccountAgents() here because it requires that // NETDATA.registry is initialized. clearMyNetdataMenu(); getCloudAccountAgents().then((agents) => { @@ -5154,8 +5122,8 @@ function netdataRegistryCallback(machinesArray) { } }; -// If we know the cloudBaseURL and agentID from local storage render (eagerly) -// the account ui before receiving the definitive response from the web server. +// If we know the cloudBaseURL and agentID from local storage render (eagerly) +// the account ui before receiving the definitive response from the web server. // This improves the perceived performance. function tryFastInitCloud() { const baseURL = localStorage.getItem("cloud.baseURL"); @@ -5183,5 +5151,5 @@ if (document.readyState === "complete") { if (document.readyState === "complete") { initializeApp(); } - }) + }); } diff --git a/web/gui/manifest.json b/web/gui/manifest.json new file mode 100644 index 000000000..52cb4831c --- /dev/null +++ b/web/gui/manifest.json @@ -0,0 +1,41 @@ +{ + "name": "App", + "icons": [ + { + "src": "images\/android-icon-36x36.png", + "sizes": "36x36", + "type": "image\/png", + "density": "0.75" + }, + { + "src": "images\/android-icon-48x48.png", + "sizes": "48x48", + "type": "image\/png", + "density": "1.0" + }, + { + "src": "images\/android-icon-72x72.png", + "sizes": "72x72", + "type": "image\/png", + "density": "1.5" + }, + { + "src": "images\/android-icon-96x96.png", + "sizes": "96x96", + "type": "image\/png", + "density": "2.0" + }, + { + "src": "images\/android-icon-144x144.png", + "sizes": "144x144", + "type": "image\/png", + "density": "3.0" + }, + { + "src": "images\/android-icon-192x192.png", + "sizes": "192x192", + "type": "image\/png", + "density": "4.0" + } + ] +} diff --git a/web/gui/old/index.html b/web/gui/old/index.html new file mode 100644 index 000000000..94ec12b70 --- /dev/null +++ b/web/gui/old/index.html @@ -0,0 +1,1321 @@ +<!DOCTYPE html> +<!-- SPDX-License-Identifier: GPL-3.0-or-later --> +<html lang="en"> +<head> + <title>netdata dashboard</title> + <meta name="application-name" content="netdata"> + + <meta http-equiv="Content-Type" content="text/html; charset=utf-8" /> + <meta charset="utf-8"> + <meta http-equiv="X-UA-Compatible" content="IE=edge,chrome=1"> + <meta name="viewport" content="width=device-width, initial-scale=1"> + <meta name="apple-mobile-web-app-capable" content="yes"> + <meta name="apple-mobile-web-app-status-bar-style" content="black-translucent"> + <meta name="author" content="costa@tsaousis.gr"> + + <link rel="stylesheet" type="text/css" href="../main.css?v=5"> + + <link rel="icon" href="data:image/x-icon;base64,iVBORw0KGgoAAAANSUhEUgAAACAAAAAgCAYAAABzenr0AAAAGXRFWHRTb2Z0d2FyZQBBZG9iZSBJbWFnZVJlYWR5ccllPAAAAP9JREFUeNpiYBgFo+A/w34gpiZ8DzWzAYgNiHGAA5UdgA73g+2gcyhgg/0DGQoweB6IBQYyFCCOGOBQwBMd/xnW09ERDtgcoEBHB+zHFQrz6egIBUasocDAcJ9OxWAhE4YQI8MDILmATg7wZ8QRDfQKhQf4Cie6pAVGPA4AhQKo0BCgZRAw4ZSBpIWJNI6CD4wEKikBaFqgVSgcYMIrzcjwgcahcIGRiPYCLUPBkNhWUwP9akVcoQBpatG4MsLviAIqWj6f3Absfdq2igg7IIEKDVQKEzN5ofAenJCp1I8gJRTug5tfkGIdR1FDniMI+QZUjF8Amn5htOdHCAAEGACE6B0cS6mrEwAAAABJRU5ErkJggg==" /> + + <meta property="og:locale" content="en_US" /> + <meta property="og:url" content="https://my-netdata.io" /> + <meta property="og:type" content="website" /> + <meta property="og:site_name" content="netdata"/> + <meta property="og:title" content="Get control of your Linux Servers. Simple. Effective. Awesome." /> + <meta property="og:description" content="Unparalleled insights, in real-time, of everything happening on your Linux systems and applications, with stunning, interactive web dashboards and powerful performance and health alarms." /> + <meta property="og:image" content="https://cloud.githubusercontent.com/assets/2662304/22945737/e98cd0c6-f2fd-11e6-96f1-5501934b0955.png" /> + <meta property="og:image:type" content="image/png" /> + <meta property="fb:app_id" content="1200089276712916" /> + + <meta name="twitter:card" content="summary" /> + <meta name="twitter:site" content="@linuxnetdata" /> + <meta name="twitter:title" content="Get control of your Linux Servers. Simple. Effective. Awesome." /> + <meta name="twitter:description" content="Unparalleled insights, in real-time, of everything happening on your Linux systems and applications, with stunning, interactive web dashboards and powerful performance and health alarms." /> + <meta name="twitter:image" content="https://cloud.githubusercontent.com/assets/2662304/14092712/93b039ea-f551-11e5-822c-beadbf2b2a2e.gif" /> + + <script src="../main.js?v20200429-0"></script> +</head> + +<body data-spy="scroll" data-target="#sidebar" data-offset="100"> + <div id="loadOverlay" class="loadOverlay" style="background-color: #fff; color: #888;"> + <div style="font-size: 3vh;"> + You must enable JavaScript in order to use Netdata!<br /> + You can do this in <a href="https://enable-javascript.com/" target="_blank">your browser settings</a>. + </div> + </div> + <script type="text/javascript"> + // Cleanup JS warning. + document.documentElement.style.overflowY = "scroll"; + + // Change the loadOverlay colors ASAP to match the theme. + let theme; + const hash = document.location.hash; + if (hash.includes('theme=slate')) { + theme = 'slate'; + } else if (hash.includes('theme=white')) { + theme = 'white'; + } else { + theme = localStorage.getItem('netdataTheme') || 'slate'; + } + const overlayEl = document.getElementById('loadOverlay'); + overlayEl.innerHTML = 'netdata<br/><div style="font-size: 3vh;">Real-time performance monitoring, done right!</div>'; + overlayEl.style = theme == 'slate' ? "background-color: #272b30; color: #373b40;" : "background-color: #fff; color: #ddd;"; + </script> + <nav class="navbar navbar-default navbar-fixed-top" role="banner"> + <div class="container"> + <div class="navbar-header"> + <button class="navbar-toggle" type="button" data-toggle="collapse" data-target=".navbar-collapse"> + <span class="sr-only">Toggle navigation</span> + <span class="icon-bar"></span> + <span class="icon-bar"></span> + <span class="icon-bar"></span> + </button> + <ul class="nav navbar-nav" style="display: inline-block"> + <li data-placement="right" class="hidden-xs hidden-sm" style="line-height: 50px; margin-right: 15px" title="Netdata Agent"> + <img src="../images/netdata-logomark.svg" height="32"/> + </li> + <li class="dropdown" id="myNetdataDropdownParent" title="your other netdata servers" data-toggle="tooltip" data-placement="right"> + <a href="#" id="hostname" class="dropdown-toggle" data-toggle="dropdown"> + my-netdata + <strong class="caret"></strong></a> + <div id="my-netdata-dropdown-content" class="dropdown-menu scrollable-menu inpagemenu"> + <div class="agent-item" style="white-space: nowrap"> + <i class="fas fa-hourglass-half"></i> + Loading, please wait... + <div></div> + </div> + </div> + </li> + </ul> + </div> + <nav class="collapse navbar-collapse navbar-right" role="navigation"> + <ul class="nav navbar-nav"> + <li id="alarmsButton" title="check the health monitoring alarms and their log" data-toggle="tooltip" data-placement="bottom"><a href="#" class="btn" data-toggle="modal" data-target="#alarmsModal"><i class="fas fa-bell"></i> <span class="hidden-sm hidden-md">Alarms </span><span id="alarms_count_badge" class="badge"></span></a></li> + <li title="change dashboard settings" data-toggle="tooltip" data-placement="bottom"><a href="#" class="btn" data-toggle="modal" data-target="#optionsModal"><i class="fas fa-cog"></i> <span class="hidden-sm hidden-md">Settings</span></a></li> + <li title="check for netdata updates<br/>you should keep your netdata updated" data-toggle="tooltip" data-placement="bottom" class="hidden-sm" id="updateButton"><a href="#" class="btn" data-toggle="modal" data-target="#updateModal"><i class="fas fa-cloud-download-alt"></i> <span class="hidden-sm hidden-md">Update </span><span id="update_badge" class="badge"></span></a></li> + <li title="the netdata wiki home at github<br/>remember to <b>give netdata a <i class="fas fa-star"></i></b> !" data-toggle="tooltip" data-placement="bottom" class="hidden-xs hidden-sm hidden-md"><a href="https://github.com/netdata/netdata" class="btn" target="_blank"><i class="fab fa-github"></i></a></li> + <li title="follow netdata on twitter" data-toggle="tooltip" data-placement="bottom" class="hidden-xs hidden-sm hidden-md"><a href="https://twitter.com/linuxnetdata" class="btn" target="_blank"><i class="fab fa-twitter"></i></a></li> + <li title="like netdata on facebook" data-toggle="tooltip" data-placement="bottom" class="hidden-xs hidden-sm hidden-md"><a href="https://www.facebook.com/linuxnetdata/" class="btn" target="_blank"><i class="fab fa-facebook"></i></a></li> + <li title="import / load a netdata snapshot" data-toggle="tooltip" data-placement="bottom" id="loadButton"><a href="#" class="btn" data-toggle="modal" data-target="#loadSnapshotModal"><i class="fas fa-download"></i> <span class="hidden-sm hidden-md hidden-lg">Import</span></a></li> + <li title="export / save a netdata snapshot" data-toggle="tooltip" data-placement="bottom" id="saveButton"><a href="#" class="btn" data-toggle="modal" data-target="#saveSnapshotModal"><i class="fas fa-upload"></i> <span class="hidden-sm hidden-md hidden-lg">Export</span></a></li> + <li title="print this dashboard to PDF" data-toggle="tooltip" data-placement="bottom" id="printButton"><a href="#" class="btn" data-toggle="modal" data-target="#printPreflightModal"><i class="fas fa-print"></i> <span class="hidden-sm hidden-md hidden-lg">Print</span></a></li> + <li title="get help on using the charts" data-toggle="tooltip" data-placement="bottom" class="hidden-sm"><a href="#" class="btn" data-toggle="modal" data-target="#helpModal"><i class="fas fa-question-circle"></i> <span class="hidden-sm hidden-md">Help</span></a></li> + <li id="account-menu-container" class="dropdown" data-toggle="tooltip"></li> + </ul> + </nav> + </div> + </nav> + <div class="navbar-highlight"> + <div id="navbar-highlight-content" class="navbar-highlight-content"></div> + </div> + + <div id="sign-in-banner" style="display: none"> + <div class="container"> + Like what you see? + <strong><a href="#" class="__link" onclick="signInDidClick(event); return false">Sign in</a> + to experience the full-range of netdata capabilities!</strong> + <div class="__close" onclick="closeSignInBannerDidClick(event)"> + Close <i class="fas fa-times"></i> + </div> + </div> + </div> + + <div id="masthead" style="display: none;"> + <div class="container"> + <div class="row"> + <div class="col-md-7"> + <h1>Netdata + <p class="lead">Real-time performance monitoring, in the greatest possible detail</p> + </h1> + </div> + <div class="col-md-5"> + <div class="well well-lg"> + <div class="row"> + <div class="col-md-6"> + <b>Drag</b> charts to pan. + <b>Shift + wheel</b> on them, to zoom in and out. + <b>Double-click</b> on them, to reset. + <b>Hover</b> on them too! + </div> + <div class="col-md-6"> + <div class="netdata-container" data-netdata="system.intr" data-chart-library="dygraph" data-dygraph-theme="sparkline" data-dygraph-type="line" data-dygraph-strokewidth="3" data-dygraph-smooth="true" data-dygraph-highlightcirclesize="6" data-after="-90" data-height="60px" data-colors="#C66"></div> + </div> + </div> + </div> + </div> + </div> + </div> + </div> + + <div class="container"> + <div class="row"> + <div class="charts-body" role="main"> + <div id="charts_div"></div> + </div> + <div class="sidebar-body hidden-xs hidden-sm hidden-print" id="sidebar-body" role="complementary"> + <nav class="dashboard-sidebar hidden-print hidden-xs hidden-sm" id="sidebar" role="menu"></nav> + </div> + </div> + </div> + + <div id="footer" class="container" style="display: none;"> + <div class="row"> + <div class="col-md-10" role="main"> + <div class="p"> + <big><a href="https://github.com/netdata/netdata/wiki" target="_blank">Netdata</a></big> + <br /><br /> + <i class="fas fa-copyright"></i> Copyright 2018, <a href="mailto:info@netdata.cloud">Netdata, Inc</a>.<br/> + <i class="fas fa-copyright"></i> Copyright 2016-2018, <a href="mailto:costa@tsaousis.gr">Costa Tsaousis</a>.<br/> + </div> + <div class="p"> + Released under <a href="http://www.gnu.org/licenses/gpl-3.0.en.html" target="_blank">GPL v3 or later</a>. + Netdata uses <a href="https://github.com/netdata/netdata/blob/master/REDISTRIBUTED.md" target="_blank">third party tools</a>. + <br /><br /> + </div> + </div> + </div> + </div> + + <div class="modal fade" id="xssModal" tabindex="-1" role="dialog" aria-labelledby="xssModalLabel" data-keyboard="false" data-backdrop="static" style="z-index: 3000"> + <div class="modal-dialog modal-lg" role="document"> + <div class="modal-content"> + <div class="modal-header"> + <h4 class="modal-title" id="xssModalLabel">XSS Protection</h4> + </div> + <div class="modal-body"> + <p> + This dashboard is about to render data from server: + </p> + <p style="font-size: 1.25em;"> + <code id="netdataXssModalServer"></code> + </p> + <p> + To protect your privacy, the dashboard will <b>check all data transferred</b> for cross site scripting (XSS). + <br/>This is CPU intensive, so your browser might be a bit slower. + </p> + <p> + If you <b>trust</b> the remote server, you can disable XSS protection.<br/> + In this case, any remote dashboard decoration code (javascript) will also run. + </p> + <p> + If you <b>don't trust</b> the remote server, you should keep the protection on.<br/> + The dashboard will run slower and remote dashboard decoration code will not run, but better be safe than sorry... + </p> + </div> + <div class="modal-footer"> + <a href="#" onclick="return xssModalKeepXss();" type="button" class="btn btn-success" data-dismiss="modal">Keep protecting me</a> + <a href="#" onclick="return xssModalDisableXss();" type="button" class="btn btn-danger" data-dismiss="modal">I don't need this, the server is mine</a> + </div> + </div> + </div> + </div> + + <div class="modal fade" id="printPreflightModal" tabindex="-1" role="dialog" aria-labelledby="printPreflightModalLabel"> + <div class="modal-dialog modal-lg" role="document"> + <div class="modal-content"> + <div class="modal-header"> + <button type="button" class="close" data-dismiss="modal" aria-label="Close"><span aria-hidden="true">×</span></button> + <h4 class="modal-title" id="printPreflightModalLabel">Print this netdata dashboard</h4> + </div> + <div class="modal-body"> + <p> + netdata dashboards cannot be captured, since we are lazy loading and hiding all but the visible charts. + <br/> + To capture the whole page with all the charts rendered, a new browser window will pop-up that will render all the charts at once. + The new browser window will maintain the current pan and zoom settings of the charts. So, align the charts before proceeding. + </p> + <p> + <small> + This process will put some CPU and memory pressure on your browser.<br/> + For the netdata server, we will sequencially download all the charts, to avoid congesting network and server resources.<br/> + <b>Please, do not print netdata dashboards on paper!</b> + </small> + </p> + </div> + <div class="modal-footer"> + <a href="#" onclick="printPreflight(); return false;" type="button" class="btn btn-default">Print</a> + <button type="button" class="btn btn-default" data-dismiss="modal">Close</button> + </div> + </div> + </div> + </div> + + <div class="modal fade" id="printModal" tabindex="-1" role="dialog" aria-labelledby="printModalLabel" data-keyboard="false" data-backdrop="static"> + <div class="modal-dialog modal-lg" role="document"> + <div class="modal-content"> + <div class="modal-header"> + <button type="button" class="close" data-dismiss="modal" aria-label="Close"><span aria-hidden="true">×</span></button> + <h4 class="modal-title" id="printModalLabel">Preparing dashboard for printing...</h4> + </div> + <div class="modal-body"> + Please wait while we initialize and render all the charts on the dashboard. + <div class="progress progress-striped active" style="height: 2em !important;"> + <div id="printModalProgressBar" class="progress-bar progress-bar-info" role="progressbar" aria-valuenow="0" aria-valuemin="0" aria-valuemax="100" style="min-width: 2em;"> + <span id="printModalProgressBarText" style="padding-left: 10px; padding-top: 4px; font-size: 1.2em; text-align: left; width: 100%; position: absolute; display: block; color: black;"></span> + </div> + </div> + The print dialog will appear as soon as we finish rendering the page. + </div> + <div class="modal-footer"> + </div> + </div> + </div> + </div> + + <div class="modal fade" id="loadSnapshotModal" tabindex="-1" role="dialog" aria-labelledby="loadSnapshotModalLabel"> + <div class="modal-dialog modal-lg" role="document"> + <div class="modal-content"> + <div class="modal-header"> + <button type="button" class="close" data-dismiss="modal" aria-label="Close"><span aria-hidden="true">×</span></button> + <h4 class="modal-title" id="loadSnapshotModalLabel">Import a netdata snapshot</h4> + </div> + <div id="loadSnapshotDragAndDrop" class="modal-body"> + <p> + netdata can export and import dashboard snapshots. + Any netdata can import the snapshot of any other netdata. + The snapshots are not uploaded to a server. They are handled entirely by your web browser, on your computer. + </p> + <p style="text-align: center;"> + <label class="btn btn-default"> + Click here to select the netdata snapshot file to import + <input type="file" id="loadSnapshotSelectFiles" value="Import" style="display: none;" + onchange="loadSnapshotPreflight();"> + </label> + </p> + <div id="loadSnapshotStatus" class="alert alert-info" role="alert"> + Browse for a snapshot file (or drag it and drop it here), then click <b>Import</b> to render it. + </div> + <p> + <table class="table"> + <tbody> + <tr><th>Filename</th><td id="loadSnapshotFilename"></td></tr> + <tr><th>Hostname</th><td id="loadSnapshotHostname"></td></tr> + <tr><th>Origin URL</th><td id="loadSnapshotURL"></td></tr> + <tr><th>Charts Info</th><td id="loadSnapshotCharts"></td></tr> + <tr><th>Snapshot Info</th><td id="loadSnapshotInfo"></td></tr> + <tr><th>Time Range</th><td id="loadSnapshotTimeRange"></td></tr> + <tr><th>Comments</th><td id="loadSnapshotComments"></td></tr> + </tbody> + </table> + </p> + </div> + <div class="modal-footer"> + <span style="display: inline-block; padding-right: 20px;">Snapshot files contain both data and javascript code. Make sure <b>you trust the files</b> you import!</span> + <a id="loadSnapshotImport" href="#" onclick="loadSnapshot(); return false;" type="button" class="btn btn-success disabled">Import</a> + <button type="button" class="btn btn-default" data-dismiss="modal">Close</button> + </div> + </div> + </div> + </div> + + <div class="modal fade" id="saveSnapshotModal" tabindex="-1" role="dialog" aria-labelledby="saveSnapshotModalLabel" data-keyboard="false" data-backdrop="static"> + <div class="modal-dialog modal-lg" role="document"> + <div class="modal-content"> + <div class="modal-header"> + <button type="button" class="close" data-dismiss="modal" aria-label="Close"><span aria-hidden="true">×</span></button> + <h4 class="modal-title" id="saveSnapshotModalLabel">Export a snapshot</h4> + </div> + <div class="modal-body"> + <div id="saveSnapshotModalProgressSection" hidden> + Please wait while we collect all the dashboard data... + <div class="progress progress-striped active" style="height: 2em !important;"> + <div id="saveSnapshotModalProgressBar" class="progress-bar progress-bar-info" role="progressbar" aria-valuenow="0" aria-valuemin="0" aria-valuemax="100" style="min-width: 2em;"> + <span id="saveSnapshotModalProgressBarText" style="padding-left: 10px; padding-top: 4px; font-size: 1.2em; text-align: left; width: 100%; position: absolute; display: block;"></span> + </div> + </div> + </div> + + <div id="saveSnapshotResolutionRadio" style="text-align: center;"> + Select the desired resolution of the snapshot. This is the <b>seconds of data per point</b>. + <br/> + + <br/> + + <br/> + <input id="saveSnapshotResolutionSlider" data-slider-id='saveSnapshotResolutionSlider' type="text" style="width: 80%;" tabindex="0"/> + <br/> <br/> + <div class="input-group"> + <span class="input-group-addon" id="sizing-saveSnapshotFilename" style="width: 100px;">Filename</span> + <input id="saveSnapshotFilename" class="form-control" placeholder="Filename of the generated snapshot" aria-describedby="sizing-saveSnapshotFilename" tabindex="2"/> + <div class="input-group-btn"> + <div class="input-group-btn"> + <button type="button" class="btn btn-default dropdown-toggle" data-toggle="dropdown" aria-haspopup="true" aria-expanded="false"><span id="saveSnapshotCompressionName">Compression</span> <span class="caret"></span></button> + <ul class="dropdown-menu dropdown-menu-right"> + <li class="disabled"><a href="#" class="disabled">Select Compression</a></li> + <li role="separator" class="divider"></li> + <li><a href="#" onclick="saveSnapshotSetCompression('none'); return false;">uncompressed</a></li> + <li role="separator" class="divider"></li> + <li><a href="#" onclick="saveSnapshotSetCompression('pako.deflate'); return false;">pako.deflate (gzip, binary)</a></li> + <li><a href="#" onclick="saveSnapshotSetCompression('pako.deflate.base64'); return false;">pako.deflate.base64 (gzip, ascii)</a></li> + <li role="separator" class="divider"></li> + <li><a href="#" onclick="saveSnapshotSetCompression('lzstring.uri'); return false;">lzstring.uri (LZ, ascii)</a></li> + <li><a href="#" onclick="saveSnapshotSetCompression('lzstring.utf16'); return false;">lzstring.utf16 (LZ, utf16)</a></li> + <li><a href="#" onclick="saveSnapshotSetCompression('lzstring.base64'); return false;">lzstring.base64 (LZ, ascii)</a></li> + </ul> + </div><!-- /btn-group --> + </div> + </div> + <div class="input-group" style="padding-top: 10px; width: 100%"> + <span class="input-group-addon" id="sizing-saveSnapshotComments" style="width: 100px;">Comments</span> + <input id="saveSnapshotComments" class="form-control" placeholder="Any comments about this snapshot?" aria-describedby="sizing-saveSnapshotComments" tabindex="3"/> + </div> + </div> + + + <div id="saveSnapshotStatus" class="alert alert-info" role="alert"> + Select snaphost resolution. This controls the size the snapshot file. + </div> + <p> + The generated snapshot will include all charts of this dashboard, <b>for the visible timeframe</b>, so align, pan and zoom the charts as needed. + The scroll position of the dashboard will also be saved. + The snapshot will be downloaded as a file, to your computer, that can be imported back into any netdata dashboard (no need to import it back on this server). + </p> + <p> + <small> + Snapshot files include all the information of the dashboard, including the URL of the origin server, its netdata unique ID, etc. + So, if you share the snapshot file with third parties, they will be able to access the origin server, if this server is exposed on the internet. + <br/> + Snapshots are handled entirely by the web browser. The netdata servers are not aware of them. + </small> + </p> + </div> + <div class="modal-footer"> + <a id="saveSnapshotExport" href="#" onclick="saveSnapshot(); return false;" type="button" class="btn btn-success" tabindex="4">Export</a> + <button type="button" class="btn btn-default" data-dismiss="modal" tabindex="5">Cancel</button> + </div> + </div> + </div> + </div> + + <div class="modal fade" id="welcomeModal" tabindex="-1" role="dialog" aria-labelledby="welcomeModalLabel"> + <div class="modal-dialog modal-lg" role="document"> + <div class="modal-content"> + <div class="modal-header"> + <button type="button" class="close" data-dismiss="modal" aria-label="Close"><span aria-hidden="true">×</span></button> + <h4 class="modal-title" id="welcomeModalLabel">Welcome to the world of netdata</h4> + </div> + <div class="modal-body"> + <div class="p"> + <div style="width: 100%; text-align: center; padding-top: 10px; padding-bottom: 10px; font-size: 18px;"> + if there is a metric for something, we want it visualised<br/> + and we want this visualisation to be <strong>real-time</strong>, <strong>efficient</strong> and <strong>awesome</strong> + </div> + </div> + <div class="p"> + <b><a href="https://github.com/netdata/netdata/wiki" target="_blank">netdata</a></b> + is a new way to monitor your systems and applications, to get <strong>real-time insights</strong> + of what is really happening and what affects performance. + It is carefully optimised to be a real-time system, without interfering in any way, + to the core function of your systems. + </div> + <div class="p"> + <b><a href="https://github.com/netdata/netdata/wiki" target="_blank">netdata</a></b> + has been designed to monitor <strong>massive amounts of metrics, per server, per second</strong>. + When installed, it might come up with 1k to 3k metrics, but we have been testing it with 100k + metrics, all collected per second, and still the cpu utilisation remained negligible. + <br/> + We have also tried to give each metric, a meaning, a context. + We have grouped and categorized all metrics into meaningful charts, providing a + better understanding of the underlying technologies and mechanisms. + </div> + <div class="p"> + <b><a href="https://github.com/netdata/netdata/wiki" target="_blank">netdata</a></b> is free, + open-source software. If you decide to use it, + <strong><a href="https://github.com/netdata/netdata/tree/master/docs/a-github-star-is-important.md" target="_blank">it is important to give netdata a star at GitHub</a></strong>. + </div> + <div class="p"> + Enjoy real-time performance monitoring! + </div> + <div class="p"> + Costa Tsaousis + </div> + </div> + <div class="modal-footer"> + <button type="button" class="btn btn-default" data-dismiss="modal">Close</button> + </div> + </div> + </div> + </div> + + <div class="modal fade" id="helpModal" tabindex="-1" role="dialog" aria-labelledby="helpModalLabel"> + <div class="modal-dialog modal-lg" role="document"> + <div class="modal-content"> + <div class="modal-header"> + <button type="button" class="close" data-dismiss="modal" aria-label="Close"><span aria-hidden="true">×</span></button> + <h4 class="modal-title" id="helpModalLabel">Dashboard Help</h4> + </div> + <div class="modal-body"> + + <h4>Dygraphs (line, area and stacked area charts)</h4> + + <!-- Nav tabs --> + <ul class="nav nav-tabs" role="tablist"> + <li role="presentation" class="active"><a href="#help_mouse" aria-controls="help_mouse" role="tab" data-toggle="tab">Mouse Interface</a></li> + <li role="presentation"><a href="#help_touch" aria-controls="help_touch" role="tab" data-toggle="tab">Touch Interface</a></li> + </ul> + + <!-- Tab panes --> + <div class="tab-content"> + <div role="tabpanel" class="tab-pane active" id="help_mouse"> + <div class="p"> + <h4>Mouse Over / Hover</h4> + Mouse over on a chart to show, at its legend, the values for the timestamp under the mouse (the chart will also highlight the point at the chart). + <br/> + All the other visible charts will also show and highlight their values for the same timestamp. + </div> + <hr/> + <div class="p"> + <h4>Drag Chart Contents</h4> + Drag the contents of a chart, by pressing the left mouse button and moving the mouse, to pan it horizontally. + <br/> + All the charts will follow soon after you let the chart alone (this little delay is by design: it speeds up your browser and lets you focus on what you are exploring). + <br/> + Once a chart is panned, auto refreshing stops for all charts. To enable it again, <b>double click</b> a panned chart. + </div> + <hr/> + <div class="p"> + <h4>Double Click</h4> + Double Click a chart to reset all the charts to their default auto-refreshing state. + </div> + <hr/> + <div class="p"> + <h4>SHIFT + Drag</h4> + While pressing the <code>SHIFT</code> key, press the left mouse button on the contents of a chart and move the mouse to select an area, to zoom in. The other charts will follow too. Zooming is performed in two phases: + <ul> + <li>The already loaded chart contents are zoomed (low resolution)</li> + <li>New data are transferred from the netdata server, to refresh the chart with possibly more detail.</li> + </ul> + Once a chart is zoomed, auto refreshing stops for all charts. To enable it again, <b>double click</b> a zoomed chart. + </div> + <hr/> + <div class="p"> + <h4>Highlight Timeframe</h4> + While pressing the <code>ALT</code> key, press the left mouse button on the contents of a chart and move the mouse to select an area. The selected are will be highlighted on all charts. + </div> + <hr/> + <div class="p"> + <h4>SHIFT + Mouse Wheel</h4> + While pressing the <code>SHIFT</code> key and the mouse pointer is over the contents of a chart, scroll the mouse wheel to zoom in or out. This kind of zooming is aligned to center below the mouse pointer. The other charts will follow too. + <br/> + Once a chart is zoomed, auto refreshing stops for all charts. To enable it again, <b>double click</b> a zoomed chart. + </div> + <hr/> + <div class="p"> + <h4>Legend Operations</h4> + Click on the label or value of a dimension, will select / un-select this dimension. + <br/> + You can press any of the SHIFT or CONTROL keys and then click on legend labels or values, to select / un-select multiple dimensions. + </div> + </div> + <div role="tabpanel" class="tab-pane" id="help_touch"> + <div class="p"> + <h4>Single Tap</h4> + Single Tap on the contents of a chart to show, at its legend, the values for the timestamp tapped (the chart will also highlight the point at the chart). + <br/> + All the other visible charts will also show and highlight their values for the same timestamp. + </div> + <hr/> + <div class="p"> + <h4>Drag Chart Contents</h4> + Touch and Drag the contents of a chart to pan it horizontally. + <br/> + All the charts will follow soon after you let the chart alone (this little delay is by design: it speeds up your browser and lets you focus on what you are exploring). + <br/> + Once a chart is panned, auto refreshing stops for all charts. To enable it again, <b>double tap</b> a panned chart. + </div> + <hr/> + <div class="p"> + <h4>Double Tap</h4> + Double tap a chart to reset all the charts to their default auto-refreshing state. + </div> + <hr/> + <div class="p"> + <h4>Zoom <small>(does not work on firefox and IE/Edge)</small></h4> + With two fingers, zoom in or out. + <br/> + Once a chart is zoomed, auto refreshing stops for all charts. To enable it again, <b>double click</b> a zoomed chart. + </div> + <hr/> + <div class="p"> + <h4>Legend Operations</h4> + Tap on the label or value of a dimension, will select / un-select this dimension. + </div> + </div> + </div> + </div> + <div class="modal-footer"> + <button type="button" class="btn btn-default" data-dismiss="modal">Close</button> + </div> + </div> + </div> + </div> + + <div class="modal fade" id="alarmsModal" tabindex="-1" role="dialog" aria-labelledby="alarmsModalLabel"> + <div class="modal-dialog modal-lg" role="document" style="display: table;"> <!-- allow the modal to expand horizontally --> + <div class="modal-content"> + <div class="modal-header"> + <button type="button" class="close" data-dismiss="modal" aria-label="Close"><span aria-hidden="true">×</span></button> + <h4 class="modal-title" id="alarmsModalLabel">netdata alarms</h4> + </div> + <div class="modal-body"> + <!-- Nav tabs --> + <ul class="nav nav-tabs" role="tablist"> + <li role="presentation" class="active"><a href="#alarms_active" aria-controls="alarms_active" role="tab" data-toggle="tab">Active</a></li> + <li role="presentation"><a href="#alarms_all" aria-controls="alarms_all" role="tab" data-toggle="tab">All</a></li> + <li role="presentation"><a href="#alarms_log" aria-controls="alarms_log" role="tab" data-toggle="tab">Log</a></li> + </ul> + + <!-- Tab panes --> + <div class="tab-content"> + <div role="tabpanel" class="tab-pane active" id="alarms_active"> + loading... + </div> + <div role="tabpanel" class="tab-pane" id="alarms_all"> + loading... + </div> + <div role="tabpanel" class="tab-pane" id="alarms_log"> + loading... + </div> + </div> + </div> + <div class="modal-footer"> + <!-- <a href="#" onclick="alarmsUpdateModal(); return false;" type="button" class="btn btn-default">Update</a> --> + <button type="button" class="btn btn-default" data-dismiss="modal">Close</button> + </div> + </div> + </div> + </div> + + <div class="modal fade" id="optionsModal" tabindex="-1" role="dialog" aria-labelledby="optionsModalLabel"> + <div class="modal-dialog modal-lg" role="document"> + <div class="modal-content"> + <div class="modal-header"> + <button type="button" class="close" data-dismiss="modal" aria-label="Close"><span aria-hidden="true">×</span></button> + <h4 class="modal-title" id="optionsModalLabel">netdata dashboard options</h4> + </div> + <div class="modal-body"> + <center> + <small style="color: #BBBBBB;">These are browser settings. Each viewer has its own. They do not affect the operation of your netdata server. + <br/> + Settings take effect immediately and are saved permanently to browser local storage (except the refresh on focus / always option). + <br/> + To reset all options (including charts sizes) to their defaults, click <a href="#" onclick="resetDashboardOptions(); return false;">here</a>.</small> + </center> + <div style="padding: 10px;"></div> + + <!-- Nav tabs --> + <ul class="nav nav-tabs" role="tablist"> + <li role="presentation" class="active"><a href="#settings_performance" aria-controls="settings_performance" role="tab" data-toggle="tab">Performance</a></li> + <li role="presentation"><a href="#settings_sync" aria-controls="settings_sync" role="tab" data-toggle="tab">Synchronization</a></li> + <li role="presentation"><a href="#settings_visual" aria-controls="settings_visual" role="tab" data-toggle="tab">Visual</a></li> + <li role="presentation"><a href="#settings_locale" aria-controls="settings_locale" role="tab" data-toggle="tab">Locale</a></li> + </ul> + + <!-- Tab panes --> + <div class="tab-content"> + <div role="tabpanel" class="tab-pane active" id="settings_performance"> + <form id="optionsForm1" method="get" class="form-horizontal"> + <div class="form-group"> + <table> + <tr class="option-row"> + <td class="option-control"><input id="stop_updates_when_focus_is_lost" type="checkbox" checked data-toggle="toggle" data-offstyle="danger" data-onstyle="success" data-on="On Focus" data-off="Always" data-width="110px"></td> + <td class="option-info"><strong>When to refresh the charts?</strong><br/> + <small>When set to <b>On Focus</b>, the charts will stop being updated if the page / tab does not have the focus of the user. When set to <b>Always</b>, the charts will always be refreshed. Set it to <b>On Focus</b> it to lower the CPU requirements of the browser (and extend the battery of laptops and tablets) when this page does not have your focus. Set to <b>Always</b> to work on another window (i.e. change the settings of something) and have the charts auto-refresh in this window.</small> + </td> + </tr> + <tr class="option-row"> + <td class="option-control"> + <input id="eliminate_zero_dimensions" type="checkbox" checked data-toggle="toggle" data-on="Non Zero" data-off="All" data-width="110px"> + </td> + <td class="option-info"><strong>Which dimensions to show?</strong><br/> + <small>When set to <b>Non Zero</b>, dimensions that have all their values (within the current view) set to zero will not be transferred from the netdata server (except if all dimensions of the chart are zero, in which case this setting does nothing - all dimensions are transferred and shown). When set to <b>All</b>, all dimensions will always be shown. Set it to <b>Non Zero</b> to lower the data transferred between netdata and your browser, lower the CPU requirements of your browser (fewer lines to draw) and increase the focus on the legends (fewer entries at the legends).</small> + </td> + </tr> + <tr class="option-row"> + <td class="option-control"><input id="destroy_on_hide" type="checkbox" data-toggle="toggle" data-on="Destroy" data-off="Hide" data-width="110px"></td> + <td class="option-info"><strong>How to handle hidden charts?</strong><br/> + <small>When set to <b>Destroy</b>, charts that are not in the current viewport of the browser (are above, or below the visible area of the page), will be destroyed and re-created if and when they become visible again. When set to <b>Hide</b>, the not-visible charts will be just hidden, to simplify the DOM and speed up your browser. Set it to <b>Destroy</b>, to lower the memory requirements of your browser. Set it to <b>Hide</b> for faster restoration of charts on page scrolling.</small> + </td> + </tr> + <tr class="option-row"> + <td class="option-control"><input id="async_on_scroll" type="checkbox" data-toggle="toggle" data-on="Async" data-off="Sync" data-width="110px"></td> + <td class="option-info"><strong>Page scroll handling?</strong><br/> + <small>When set to <b>Sync</b>, charts will be examined for their visibility immediately after scrolling. On slow computers this may impact the smoothness of page scrolling. To update the page when scrolling ends, set it to <b>Async</b>. Set it to <b>Sync</b> for immediate chart updates when scrolling. Set it to <b>Async</b> for smoother page scrolling on slower computers.</small> + </td> + </tr> + </table> + </div> + </form> + </div> + <div role="tabpanel" class="tab-pane" id="settings_sync"> + <form id="optionsForm2" method="get" class="form-horizontal"> + <div class="form-group"> + <table> + <tr class="option-row"> + <td class="option-control"><input id="parallel_refresher" type="checkbox" checked data-toggle="toggle" data-on="Parallel" data-off="Sequential" data-width="110px"></td> + <td class="option-info"><strong>Which chart refresh policy to use?</strong><br/> + <small>When set to <b>parallel</b>, visible charts are refreshed in parallel (all queries are sent to netdata server in parallel) and are rendered asynchronously. When set to <b>sequential</b> charts are refreshed one after another. Set it to parallel if your browser can cope with it (most modern browsers do), set it to sequential if you work on an older/slower computer.</small> + </td> + </tr> + <tr class="option-row" id="concurrent_refreshes_row"> + <td class="option-control"><input id="concurrent_refreshes" type="checkbox" checked data-toggle="toggle" data-on="Resync" data-off="Best Effort" data-width="110px"></td> + <td class="option-info"><strong>Shall we re-sync chart refreshes?</strong><br/> + <small>When set to <b>Resync</b>, the dashboard will attempt to re-synchronize all the charts so that they are refreshed concurrently. When set to <b>Best Effort</b>, each chart may be refreshed with a little time difference to the others. Normally, the dashboard starts refreshing them in parallel, but depending on the speed of your computer and the network latencies, charts start having a slight time difference. Setting this to <b>Resync</b> will attempt to re-synchronize the charts on every update. Setting it to <b>Best Effort</b> may lower the pressure on your browser and the network.</small> + </td> + </tr> + <tr class="option-row"> + <td class="option-control"><input id="sync_selection" type="checkbox" checked data-toggle="toggle" data-on="Sync" data-off="Don't Sync" data-onstyle="success" data-offstyle="danger" data-width="110px"></td> + <td class="option-info"><strong>Sync hover selection on all charts?</strong><br/> + <small>When enabled, a selection on one chart will automatically select the same time on all other visible charts and the legends of all visible charts will be updated to show the selected values. When disabled, only the chart getting the user's attention will be selected. Enable it to get better insights of the data. Disable it if you are on a very slow computer that cannot actually do it.</small> + </td> + </tr> + <tr class="option-row"> + <td class="option-control"><input id="sync_pan_and_zoom" type="checkbox" checked data-toggle="toggle" data-on="Sync" data-off="Don't Sync" data-onstyle="success" data-offstyle="danger" data-width="110px"></td> + <td class="option-info"><strong>Sync pan and zoom on all charts?</strong><br/> + <small>When enabled, pan and zoom operations on a chart will be replicated to all charts (even the ones that are not currently visible - of course only when they will become visible). When disabled, pan and zoom operations will not be propagated to other charts.</small> + </td> + </tr> + </table> + </div> + </form> + </div> + <div role="tabpanel" class="tab-pane" id="settings_visual"> + <form id="optionsForm3" method="get" class="form-horizontal"> + <div class="form-group"> + <table> + <tr class="option-row"> + <td class="option-control"><input id="netdata_theme_control" type="checkbox" checked data-toggle="toggle" data-offstyle="danger" data-onstyle="success" data-on="Dark" data-off="White" data-width="110px"></td> + <td class="option-info"><strong>Which theme to use?</strong><br/> + <small>Netdata comes with two themes: <b>Dark</b> (the default) and <b>White</b>. + <br/> + <b>Switching this will reload the dashboard</b>. + </small> + </td> + </tr> + <tr class="option-row"> + <td class="option-control"><input id="show_help" type="checkbox" checked data-toggle="toggle" data-on="Help Me" data-off="No Help" data-width="110px"></td> + <td class="option-info"><strong>Do you need help?</strong><br/> + <small>Netdata can show some help in some areas to help you use the dashboard. If all these balloons bother you, disable them using this switch. + <br/> + <b>Switching this will reload the dashboard</b>. + </small> + </td> + </tr> + <tr class="option-row"> + <td class="option-control"><input id="pan_and_zoom_data_padding" type="checkbox" checked data-toggle="toggle" data-on="Pad" data-off="Don't Pad" data-width="110px"></td> + <td class="option-info"><strong>Enable data padding when panning and zooming?</strong><br/> + <small>When set to <b>Pad</b> the charts will be padded with more data, both before and after the visible area, thus giving the impression the whole database is loaded. This padding will happen only after the first pan or zoom operation on the chart (initially all charts have only the visible data). When set to <b>Don't Pad</b> only the visible data will be transfered from the netdata server, even after the first pan and zoom operation.</small> + </td> + </tr> + <tr class="option-row"> + <td class="option-control"><input id="smooth_plot" type="checkbox" checked data-toggle="toggle" data-on="Smooth" data-off="Rough" data-width="110px"></td> + <td class="option-info"><strong>Enable Bézier lines on charts?</strong><br/> + <small>When set to <b>Smooth</b> the charts libraries that support it, will plot smooth curves instead of simple straight lines to connect the points. + <br/> + Keep in mind <a href="http://dygraphs.com" target="_blank">dygraphs</a>, the main charting library in netdata dashboards, can only smooth line charts. It cannot smooth area or stacked charts. When set to <b>Rough</b>, this setting can lower the CPU resources consumed by your browser.</small> + </td> + </tr> + </table> + </div> + </form> + </div> + <div role="tabpanel" class="tab-pane" id="settings_locale"> + <form id="optionsForm4" method="get" class="form-horizontal"> + <div class="form-group"> + <table> + <tr class="option-row"> + <td colspan="2" align="center"> + <small> + <b>These settings are applied gradually, as charts are updated. To force them, refresh the dashboard now</b>. + </small> + </td> + </tr> + <tr class="option-row"> + <td class="option-control"><input id="units_conversion" type="checkbox" checked data-toggle="toggle" data-on="Scale Units" data-off="Fixed Units" data-onstyle="success" data-width="110px"></td> + <td class="option-info"><strong>Enable auto-scaling of select units?</strong><br/> + <small>When set to <b>Scale Units</b> the values shown will dynamically be scaled (e.g. 1000 kilobits will be shown as 1 megabit). + Netdata can auto-scale these original units: <code>kilobits/s</code>, <code>kilobytes/s</code>, <code>KB/s</code>, + <code>KB</code>, <code>MB</code>, and <code>GB</code>. + When set to <b>Fixed Units</b> all the values will be rendered using the original units maintained by the netdata server. + </small> + </td> + </tr> + <tr id="settingsLocaleTempRow" class="option-row"> + <td class="option-control"><input id="units_temp" type="checkbox" checked data-toggle="toggle" data-on="Celsius" data-off="Fahrenheit" data-width="110px"></td> + <td class="option-info"><strong>Which units to use for temperatures?</strong><br/> + <small>Set the temperature units of the dashboard. + </small> + </td> + </tr> + <tr id="settingsLocaleTimeRow" class="option-row"> + <td class="option-control"><input id="seconds_as_time" type="checkbox" checked data-toggle="toggle" data-on="Time" data-off="Seconds" data-onstyle="success" data-width="110px"></td> + <td class="option-info"><strong>Convert seconds to time?</strong><br/> + <small>When set to <b>Time</b>, charts that present <code>seconds</code> will show <code>DDd:HH:MM:SS</code>. + When set to <b>Seconds</b>, the raw number of seconds will be presented. + </small> + </td> + </tr> + <tr class="option-row"> + <td class="option-control"><input id="local_timezone" type="checkbox" checked data-toggle="toggle" data-on="Your Time" data-off="Server Time" data-onstyle="success" data-offstyle="danger" data-width="110px"></td> + <td class="option-info"><strong>Show browser local time or server time?</strong><br/> + <small>When set to <b>Your Time</b>, the charts will use your browser local time. When set to <b>Server Time</b> the charts will use the server time. + <br/> + Set it to <b>Your Time</b> to have a common time-reference, no matter where the server is and which time zone it uses (all your dashboards will report your local time). + Set it to <b>Server Time</b> when you need to compare netdata charts with server log files. + <br/> + Your browser time zone is: <b><span id="browser_timezone">-</span></b>.<br/> + The server reported timezone is: <b><span id="server_timezone">-</span></b> (you can set this in netdata.conf <code>[global].timezone</code>).<br/> + The current time zone on the dashboard is: <b><span id="current_timezone">-</span></b>. + <br/> + <div class="dropup"> + <button class="btn btn-default dropdown-toggle" type="button" id="dropdownTimeZone" data-toggle="dropdown" aria-haspopup="true" aria-expanded="true"> + Select Server Time Zone + <span class="caret"></span> + </button> + <ul class="dropdown-menu scrollable-menu-50" aria-labelledby="dropdownTimeZone"> + <li><a href=# onclick="return selected_server_timezone('UTC');">Universal Time Coordinated (UTC)</a></li> + <li><a href=# onclick="return selected_server_timezone('Africa/Abidjan');">Africa/Abidjan</a></li> + <li><a href=# onclick="return selected_server_timezone('Africa/Accra');">Africa/Accra</a></li> + <li><a href=# onclick="return selected_server_timezone('Africa/Algiers');">Africa/Algiers</a></li> + <li><a href=# onclick="return selected_server_timezone('Africa/Bissau');">Africa/Bissau</a></li> + <li><a href=# onclick="return selected_server_timezone('Africa/Cairo');">Africa/Cairo</a></li> + <li><a href=# onclick="return selected_server_timezone('Africa/Casablanca');">Africa/Casablanca</a></li> + <li><a href=# onclick="return selected_server_timezone('Africa/Ceuta');">Africa/Ceuta</a></li> + <li><a href=# onclick="return selected_server_timezone('Africa/El_Aaiun');">Africa/El_Aaiun</a></li> + <li><a href=# onclick="return selected_server_timezone('Africa/Johannesburg');">Africa/Johannesburg</a></li> + <li><a href=# onclick="return selected_server_timezone('Africa/Khartoum');">Africa/Khartoum</a></li> + <li><a href=# onclick="return selected_server_timezone('Africa/Lagos');">Africa/Lagos</a></li> + <li><a href=# onclick="return selected_server_timezone('Africa/Maputo');">Africa/Maputo</a></li> + <li><a href=# onclick="return selected_server_timezone('Africa/Monrovia');">Africa/Monrovia</a></li> + <li><a href=# onclick="return selected_server_timezone('Africa/Nairobi');">Africa/Nairobi</a></li> + <li><a href=# onclick="return selected_server_timezone('Africa/Ndjamena');">Africa/Ndjamena</a></li> + <li><a href=# onclick="return selected_server_timezone('Africa/Tripoli');">Africa/Tripoli</a></li> + <li><a href=# onclick="return selected_server_timezone('Africa/Tunis');">Africa/Tunis</a></li> + <li><a href=# onclick="return selected_server_timezone('Africa/Windhoek');">Africa/Windhoek</a></li> + <li><a href=# onclick="return selected_server_timezone('America/Adak');">America/Adak</a></li> + <li><a href=# onclick="return selected_server_timezone('America/Anchorage');">America/Anchorage</a></li> + <li><a href=# onclick="return selected_server_timezone('America/Araguaina');">America/Araguaina</a></li> + <li><a href=# onclick="return selected_server_timezone('America/Argentina/Buenos_Aires');">America/Argentina/Buenos_Aires</a></li> + <li><a href=# onclick="return selected_server_timezone('America/Argentina/Catamarca');">America/Argentina/Catamarca</a></li> + <li><a href=# onclick="return selected_server_timezone('America/Argentina/Cordoba');">America/Argentina/Cordoba</a></li> + <li><a href=# onclick="return selected_server_timezone('America/Argentina/Jujuy');">America/Argentina/Jujuy</a></li> + <li><a href=# onclick="return selected_server_timezone('America/Argentina/La_Rioja');">America/Argentina/La_Rioja</a></li> + <li><a href=# onclick="return selected_server_timezone('America/Argentina/Mendoza');">America/Argentina/Mendoza</a></li> + <li><a href=# onclick="return selected_server_timezone('America/Argentina/Rio_Gallegos');">America/Argentina/Rio_Gallegos</a></li> + <li><a href=# onclick="return selected_server_timezone('America/Argentina/Salta');">America/Argentina/Salta</a></li> + <li><a href=# onclick="return selected_server_timezone('America/Argentina/San_Juan');">America/Argentina/San_Juan</a></li> + <li><a href=# onclick="return selected_server_timezone('America/Argentina/San_Luis');">America/Argentina/San_Luis</a></li> + <li><a href=# onclick="return selected_server_timezone('America/Argentina/Tucuman');">America/Argentina/Tucuman</a></li> + <li><a href=# onclick="return selected_server_timezone('America/Argentina/Ushuaia');">America/Argentina/Ushuaia</a></li> + <li><a href=# onclick="return selected_server_timezone('America/Asuncion');">America/Asuncion</a></li> + <li><a href=# onclick="return selected_server_timezone('America/Atikokan');">America/Atikokan</a></li> + <li><a href=# onclick="return selected_server_timezone('America/Bahia');">America/Bahia</a></li> + <li><a href=# onclick="return selected_server_timezone('America/Bahia_Banderas');">America/Bahia_Banderas</a></li> + <li><a href=# onclick="return selected_server_timezone('America/Barbados');">America/Barbados</a></li> + <li><a href=# onclick="return selected_server_timezone('America/Belem');">America/Belem</a></li> + <li><a href=# onclick="return selected_server_timezone('America/Belize');">America/Belize</a></li> + <li><a href=# onclick="return selected_server_timezone('America/Blanc-Sablon');">America/Blanc-Sablon</a></li> + <li><a href=# onclick="return selected_server_timezone('America/Boa_Vista');">America/Boa_Vista</a></li> + <li><a href=# onclick="return selected_server_timezone('America/Bogota');">America/Bogota</a></li> + <li><a href=# onclick="return selected_server_timezone('America/Boise');">America/Boise</a></li> + <li><a href=# onclick="return selected_server_timezone('America/Cambridge_Bay');">America/Cambridge_Bay</a></li> + <li><a href=# onclick="return selected_server_timezone('America/Campo_Grande');">America/Campo_Grande</a></li> + <li><a href=# onclick="return selected_server_timezone('America/Cancun');">America/Cancun</a></li> + <li><a href=# onclick="return selected_server_timezone('America/Caracas');">America/Caracas</a></li> + <li><a href=# onclick="return selected_server_timezone('America/Cayenne');">America/Cayenne</a></li> + <li><a href=# onclick="return selected_server_timezone('America/Chicago');">America/Chicago</a></li> + <li><a href=# onclick="return selected_server_timezone('America/Chihuahua');">America/Chihuahua</a></li> + <li><a href=# onclick="return selected_server_timezone('America/Costa_Rica');">America/Costa_Rica</a></li> + <li><a href=# onclick="return selected_server_timezone('America/Creston');">America/Creston</a></li> + <li><a href=# onclick="return selected_server_timezone('America/Cuiaba');">America/Cuiaba</a></li> + <li><a href=# onclick="return selected_server_timezone('America/Curacao');">America/Curacao</a></li> + <li><a href=# onclick="return selected_server_timezone('America/Danmarkshavn');">America/Danmarkshavn</a></li> + <li><a href=# onclick="return selected_server_timezone('America/Dawson');">America/Dawson</a></li> + <li><a href=# onclick="return selected_server_timezone('America/Dawson_Creek');">America/Dawson_Creek</a></li> + <li><a href=# onclick="return selected_server_timezone('America/Denver');">America/Denver</a></li> + <li><a href=# onclick="return selected_server_timezone('America/Detroit');">America/Detroit</a></li> + <li><a href=# onclick="return selected_server_timezone('America/Edmonton');">America/Edmonton</a></li> + <li><a href=# onclick="return selected_server_timezone('America/Eirunepe');">America/Eirunepe</a></li> + <li><a href=# onclick="return selected_server_timezone('America/El_Salvador');">America/El_Salvador</a></li> + <li><a href=# onclick="return selected_server_timezone('America/Fortaleza');">America/Fortaleza</a></li> + <li><a href=# onclick="return selected_server_timezone('America/Fort_Nelson');">America/Fort_Nelson</a></li> + <li><a href=# onclick="return selected_server_timezone('America/Glace_Bay');">America/Glace_Bay</a></li> + <li><a href=# onclick="return selected_server_timezone('America/Godthab');">America/Godthab</a></li> + <li><a href=# onclick="return selected_server_timezone('America/Goose_Bay');">America/Goose_Bay</a></li> + <li><a href=# onclick="return selected_server_timezone('America/Grand_Turk');">America/Grand_Turk</a></li> + <li><a href=# onclick="return selected_server_timezone('America/Guatemala');">America/Guatemala</a></li> + <li><a href=# onclick="return selected_server_timezone('America/Guayaquil');">America/Guayaquil</a></li> + <li><a href=# onclick="return selected_server_timezone('America/Guyana');">America/Guyana</a></li> + <li><a href=# onclick="return selected_server_timezone('America/Halifax');">America/Halifax</a></li> + <li><a href=# onclick="return selected_server_timezone('America/Havana');">America/Havana</a></li> + <li><a href=# onclick="return selected_server_timezone('America/Hermosillo');">America/Hermosillo</a></li> + <li><a href=# onclick="return selected_server_timezone('America/Indiana/Indianapolis');">America/Indiana/Indianapolis</a></li> + <li><a href=# onclick="return selected_server_timezone('America/Indiana/Knox');">America/Indiana/Knox</a></li> + <li><a href=# onclick="return selected_server_timezone('America/Indiana/Marengo');">America/Indiana/Marengo</a></li> + <li><a href=# onclick="return selected_server_timezone('America/Indiana/Petersburg');">America/Indiana/Petersburg</a></li> + <li><a href=# onclick="return selected_server_timezone('America/Indiana/Tell_City');">America/Indiana/Tell_City</a></li> + <li><a href=# onclick="return selected_server_timezone('America/Indiana/Vevay');">America/Indiana/Vevay</a></li> + <li><a href=# onclick="return selected_server_timezone('America/Indiana/Vincennes');">America/Indiana/Vincennes</a></li> + <li><a href=# onclick="return selected_server_timezone('America/Indiana/Winamac');">America/Indiana/Winamac</a></li> + <li><a href=# onclick="return selected_server_timezone('America/Inuvik');">America/Inuvik</a></li> + <li><a href=# onclick="return selected_server_timezone('America/Iqaluit');">America/Iqaluit</a></li> + <li><a href=# onclick="return selected_server_timezone('America/Jamaica');">America/Jamaica</a></li> + <li><a href=# onclick="return selected_server_timezone('America/Juneau');">America/Juneau</a></li> + <li><a href=# onclick="return selected_server_timezone('America/Kentucky/Louisville');">America/Kentucky/Louisville</a></li> + <li><a href=# onclick="return selected_server_timezone('America/Kentucky/Monticello');">America/Kentucky/Monticello</a></li> + <li><a href=# onclick="return selected_server_timezone('America/La_Paz');">America/La_Paz</a></li> + <li><a href=# onclick="return selected_server_timezone('America/Lima');">America/Lima</a></li> + <li><a href=# onclick="return selected_server_timezone('America/Los_Angeles');">America/Los_Angeles</a></li> + <li><a href=# onclick="return selected_server_timezone('America/Maceio');">America/Maceio</a></li> + <li><a href=# onclick="return selected_server_timezone('America/Managua');">America/Managua</a></li> + <li><a href=# onclick="return selected_server_timezone('America/Manaus');">America/Manaus</a></li> + <li><a href=# onclick="return selected_server_timezone('America/Martinique');">America/Martinique</a></li> + <li><a href=# onclick="return selected_server_timezone('America/Matamoros');">America/Matamoros</a></li> + <li><a href=# onclick="return selected_server_timezone('America/Mazatlan');">America/Mazatlan</a></li> + <li><a href=# onclick="return selected_server_timezone('America/Menominee');">America/Menominee</a></li> + <li><a href=# onclick="return selected_server_timezone('America/Merida');">America/Merida</a></li> + <li><a href=# onclick="return selected_server_timezone('America/Metlakatla');">America/Metlakatla</a></li> + <li><a href=# onclick="return selected_server_timezone('America/Mexico_City');">America/Mexico_City</a></li> + <li><a href=# onclick="return selected_server_timezone('America/Miquelon');">America/Miquelon</a></li> + <li><a href=# onclick="return selected_server_timezone('America/Moncton');">America/Moncton</a></li> + <li><a href=# onclick="return selected_server_timezone('America/Monterrey');">America/Monterrey</a></li> + <li><a href=# onclick="return selected_server_timezone('America/Montevideo');">America/Montevideo</a></li> + <li><a href=# onclick="return selected_server_timezone('America/Nassau');">America/Nassau</a></li> + <li><a href=# onclick="return selected_server_timezone('America/New_York');">America/New_York</a></li> + <li><a href=# onclick="return selected_server_timezone('America/Nipigon');">America/Nipigon</a></li> + <li><a href=# onclick="return selected_server_timezone('America/Nome');">America/Nome</a></li> + <li><a href=# onclick="return selected_server_timezone('America/Noronha');">America/Noronha</a></li> + <li><a href=# onclick="return selected_server_timezone('America/North_Dakota/Beulah');">America/North_Dakota/Beulah</a></li> + <li><a href=# onclick="return selected_server_timezone('America/North_Dakota/Center');">America/North_Dakota/Center</a></li> + <li><a href=# onclick="return selected_server_timezone('America/North_Dakota/New_Salem');">America/North_Dakota/New_Salem</a></li> + <li><a href=# onclick="return selected_server_timezone('America/Ojinaga');">America/Ojinaga</a></li> + <li><a href=# onclick="return selected_server_timezone('America/Panama');">America/Panama</a></li> + <li><a href=# onclick="return selected_server_timezone('America/Pangnirtung');">America/Pangnirtung</a></li> + <li><a href=# onclick="return selected_server_timezone('America/Paramaribo');">America/Paramaribo</a></li> + <li><a href=# onclick="return selected_server_timezone('America/Phoenix');">America/Phoenix</a></li> + <li><a href=# onclick="return selected_server_timezone('America/Port-au-Prince');">America/Port-au-Prince</a></li> + <li><a href=# onclick="return selected_server_timezone('America/Port_of_Spain');">America/Port_of_Spain</a></li> + <li><a href=# onclick="return selected_server_timezone('America/Porto_Velho');">America/Porto_Velho</a></li> + <li><a href=# onclick="return selected_server_timezone('America/Puerto_Rico');">America/Puerto_Rico</a></li> + <li><a href=# onclick="return selected_server_timezone('America/Punta_Arenas');">America/Punta_Arenas</a></li> + <li><a href=# onclick="return selected_server_timezone('America/Rainy_River');">America/Rainy_River</a></li> + <li><a href=# onclick="return selected_server_timezone('America/Rankin_Inlet');">America/Rankin_Inlet</a></li> + <li><a href=# onclick="return selected_server_timezone('America/Recife');">America/Recife</a></li> + <li><a href=# onclick="return selected_server_timezone('America/Regina');">America/Regina</a></li> + <li><a href=# onclick="return selected_server_timezone('America/Resolute');">America/Resolute</a></li> + <li><a href=# onclick="return selected_server_timezone('America/Rio_Branco');">America/Rio_Branco</a></li> + <li><a href=# onclick="return selected_server_timezone('America/Santarem');">America/Santarem</a></li> + <li><a href=# onclick="return selected_server_timezone('America/Santiago');">America/Santiago</a></li> + <li><a href=# onclick="return selected_server_timezone('America/Santo_Domingo');">America/Santo_Domingo</a></li> + <li><a href=# onclick="return selected_server_timezone('America/Sao_Paulo');">America/Sao_Paulo</a></li> + <li><a href=# onclick="return selected_server_timezone('America/Scoresbysund');">America/Scoresbysund</a></li> + <li><a href=# onclick="return selected_server_timezone('America/Sitka');">America/Sitka</a></li> + <li><a href=# onclick="return selected_server_timezone('America/St_Johns');">America/St_Johns</a></li> + <li><a href=# onclick="return selected_server_timezone('America/Swift_Current');">America/Swift_Current</a></li> + <li><a href=# onclick="return selected_server_timezone('America/Tegucigalpa');">America/Tegucigalpa</a></li> + <li><a href=# onclick="return selected_server_timezone('America/Thule');">America/Thule</a></li> + <li><a href=# onclick="return selected_server_timezone('America/Thunder_Bay');">America/Thunder_Bay</a></li> + <li><a href=# onclick="return selected_server_timezone('America/Tijuana');">America/Tijuana</a></li> + <li><a href=# onclick="return selected_server_timezone('America/Toronto');">America/Toronto</a></li> + <li><a href=# onclick="return selected_server_timezone('America/Vancouver');">America/Vancouver</a></li> + <li><a href=# onclick="return selected_server_timezone('America/Whitehorse');">America/Whitehorse</a></li> + <li><a href=# onclick="return selected_server_timezone('America/Winnipeg');">America/Winnipeg</a></li> + <li><a href=# onclick="return selected_server_timezone('America/Yakutat');">America/Yakutat</a></li> + <li><a href=# onclick="return selected_server_timezone('America/Yellowknife');">America/Yellowknife</a></li> + <li><a href=# onclick="return selected_server_timezone('Antarctica/Casey');">Antarctica/Casey</a></li> + <li><a href=# onclick="return selected_server_timezone('Antarctica/Davis');">Antarctica/Davis</a></li> + <li><a href=# onclick="return selected_server_timezone('Antarctica/DumontDUrville');">Antarctica/DumontDUrville</a></li> + <li><a href=# onclick="return selected_server_timezone('Antarctica/Macquarie');">Antarctica/Macquarie</a></li> + <li><a href=# onclick="return selected_server_timezone('Antarctica/Mawson');">Antarctica/Mawson</a></li> + <li><a href=# onclick="return selected_server_timezone('Antarctica/Palmer');">Antarctica/Palmer</a></li> + <li><a href=# onclick="return selected_server_timezone('Antarctica/Rothera');">Antarctica/Rothera</a></li> + <li><a href=# onclick="return selected_server_timezone('Antarctica/Syowa');">Antarctica/Syowa</a></li> + <li><a href=# onclick="return selected_server_timezone('Antarctica/Troll');">Antarctica/Troll</a></li> + <li><a href=# onclick="return selected_server_timezone('Antarctica/Vostok');">Antarctica/Vostok</a></li> + <li><a href=# onclick="return selected_server_timezone('Asia/Almaty');">Asia/Almaty</a></li> + <li><a href=# onclick="return selected_server_timezone('Asia/Amman');">Asia/Amman</a></li> + <li><a href=# onclick="return selected_server_timezone('Asia/Anadyr');">Asia/Anadyr</a></li> + <li><a href=# onclick="return selected_server_timezone('Asia/Aqtau');">Asia/Aqtau</a></li> + <li><a href=# onclick="return selected_server_timezone('Asia/Aqtobe');">Asia/Aqtobe</a></li> + <li><a href=# onclick="return selected_server_timezone('Asia/Ashgabat');">Asia/Ashgabat</a></li> + <li><a href=# onclick="return selected_server_timezone('Asia/Atyrau');">Asia/Atyrau</a></li> + <li><a href=# onclick="return selected_server_timezone('Asia/Baghdad');">Asia/Baghdad</a></li> + <li><a href=# onclick="return selected_server_timezone('Asia/Baku');">Asia/Baku</a></li> + <li><a href=# onclick="return selected_server_timezone('Asia/Bangkok');">Asia/Bangkok</a></li> + <li><a href=# onclick="return selected_server_timezone('Asia/Barnaul');">Asia/Barnaul</a></li> + <li><a href=# onclick="return selected_server_timezone('Asia/Beirut');">Asia/Beirut</a></li> + <li><a href=# onclick="return selected_server_timezone('Asia/Bishkek');">Asia/Bishkek</a></li> + <li><a href=# onclick="return selected_server_timezone('Asia/Brunei');">Asia/Brunei</a></li> + <li><a href=# onclick="return selected_server_timezone('Asia/Chita');">Asia/Chita</a></li> + <li><a href=# onclick="return selected_server_timezone('Asia/Choibalsan');">Asia/Choibalsan</a></li> + <li><a href=# onclick="return selected_server_timezone('Asia/Colombo');">Asia/Colombo</a></li> + <li><a href=# onclick="return selected_server_timezone('Asia/Damascus');">Asia/Damascus</a></li> + <li><a href=# onclick="return selected_server_timezone('Asia/Dhaka');">Asia/Dhaka</a></li> + <li><a href=# onclick="return selected_server_timezone('Asia/Dili');">Asia/Dili</a></li> + <li><a href=# onclick="return selected_server_timezone('Asia/Dubai');">Asia/Dubai</a></li> + <li><a href=# onclick="return selected_server_timezone('Asia/Dushanbe');">Asia/Dushanbe</a></li> + <li><a href=# onclick="return selected_server_timezone('Asia/Famagusta');">Asia/Famagusta</a></li> + <li><a href=# onclick="return selected_server_timezone('Asia/Gaza');">Asia/Gaza</a></li> + <li><a href=# onclick="return selected_server_timezone('Asia/Hebron');">Asia/Hebron</a></li> + <li><a href=# onclick="return selected_server_timezone('Asia/Ho_Chi_Minh');">Asia/Ho_Chi_Minh</a></li> + <li><a href=# onclick="return selected_server_timezone('Asia/Hong_Kong');">Asia/Hong_Kong</a></li> + <li><a href=# onclick="return selected_server_timezone('Asia/Hovd');">Asia/Hovd</a></li> + <li><a href=# onclick="return selected_server_timezone('Asia/Irkutsk');">Asia/Irkutsk</a></li> + <li><a href=# onclick="return selected_server_timezone('Asia/Jakarta');">Asia/Jakarta</a></li> + <li><a href=# onclick="return selected_server_timezone('Asia/Jayapura');">Asia/Jayapura</a></li> + <li><a href=# onclick="return selected_server_timezone('Asia/Jerusalem');">Asia/Jerusalem</a></li> + <li><a href=# onclick="return selected_server_timezone('Asia/Kabul');">Asia/Kabul</a></li> + <li><a href=# onclick="return selected_server_timezone('Asia/Kamchatka');">Asia/Kamchatka</a></li> + <li><a href=# onclick="return selected_server_timezone('Asia/Karachi');">Asia/Karachi</a></li> + <li><a href=# onclick="return selected_server_timezone('Asia/Kathmandu');">Asia/Kathmandu</a></li> + <li><a href=# onclick="return selected_server_timezone('Asia/Khandyga');">Asia/Khandyga</a></li> + <li><a href=# onclick="return selected_server_timezone('Asia/Kolkata');">Asia/Kolkata</a></li> + <li><a href=# onclick="return selected_server_timezone('Asia/Krasnoyarsk');">Asia/Krasnoyarsk</a></li> + <li><a href=# onclick="return selected_server_timezone('Asia/Kuala_Lumpur');">Asia/Kuala_Lumpur</a></li> + <li><a href=# onclick="return selected_server_timezone('Asia/Kuching');">Asia/Kuching</a></li> + <li><a href=# onclick="return selected_server_timezone('Asia/Macau');">Asia/Macau</a></li> + <li><a href=# onclick="return selected_server_timezone('Asia/Magadan');">Asia/Magadan</a></li> + <li><a href=# onclick="return selected_server_timezone('Asia/Makassar');">Asia/Makassar</a></li> + <li><a href=# onclick="return selected_server_timezone('Asia/Manila');">Asia/Manila</a></li> + <li><a href=# onclick="return selected_server_timezone('Asia/Nicosia');">Asia/Nicosia</a></li> + <li><a href=# onclick="return selected_server_timezone('Asia/Novokuznetsk');">Asia/Novokuznetsk</a></li> + <li><a href=# onclick="return selected_server_timezone('Asia/Novosibirsk');">Asia/Novosibirsk</a></li> + <li><a href=# onclick="return selected_server_timezone('Asia/Omsk');">Asia/Omsk</a></li> + <li><a href=# onclick="return selected_server_timezone('Asia/Oral');">Asia/Oral</a></li> + <li><a href=# onclick="return selected_server_timezone('Asia/Pontianak');">Asia/Pontianak</a></li> + <li><a href=# onclick="return selected_server_timezone('Asia/Pyongyang');">Asia/Pyongyang</a></li> + <li><a href=# onclick="return selected_server_timezone('Asia/Qatar');">Asia/Qatar</a></li> + <li><a href=# onclick="return selected_server_timezone('Asia/Qyzylorda');">Asia/Qyzylorda</a></li> + <li><a href=# onclick="return selected_server_timezone('Asia/Riyadh');">Asia/Riyadh</a></li> + <li><a href=# onclick="return selected_server_timezone('Asia/Sakhalin');">Asia/Sakhalin</a></li> + <li><a href=# onclick="return selected_server_timezone('Asia/Samarkand');">Asia/Samarkand</a></li> + <li><a href=# onclick="return selected_server_timezone('Asia/Seoul');">Asia/Seoul</a></li> + <li><a href=# onclick="return selected_server_timezone('Asia/Shanghai');">Asia/Shanghai</a></li> + <li><a href=# onclick="return selected_server_timezone('Asia/Singapore');">Asia/Singapore</a></li> + <li><a href=# onclick="return selected_server_timezone('Asia/Srednekolymsk');">Asia/Srednekolymsk</a></li> + <li><a href=# onclick="return selected_server_timezone('Asia/Taipei');">Asia/Taipei</a></li> + <li><a href=# onclick="return selected_server_timezone('Asia/Tashkent');">Asia/Tashkent</a></li> + <li><a href=# onclick="return selected_server_timezone('Asia/Tbilisi');">Asia/Tbilisi</a></li> + <li><a href=# onclick="return selected_server_timezone('Asia/Tehran');">Asia/Tehran</a></li> + <li><a href=# onclick="return selected_server_timezone('Asia/Thimphu');">Asia/Thimphu</a></li> + <li><a href=# onclick="return selected_server_timezone('Asia/Tokyo');">Asia/Tokyo</a></li> + <li><a href=# onclick="return selected_server_timezone('Asia/Tomsk');">Asia/Tomsk</a></li> + <li><a href=# onclick="return selected_server_timezone('Asia/Ulaanbaatar');">Asia/Ulaanbaatar</a></li> + <li><a href=# onclick="return selected_server_timezone('Asia/Urumqi');">Asia/Urumqi</a></li> + <li><a href=# onclick="return selected_server_timezone('Asia/Ust-Nera');">Asia/Ust-Nera</a></li> + <li><a href=# onclick="return selected_server_timezone('Asia/Vladivostok');">Asia/Vladivostok</a></li> + <li><a href=# onclick="return selected_server_timezone('Asia/Yakutsk');">Asia/Yakutsk</a></li> + <li><a href=# onclick="return selected_server_timezone('Asia/Yangon');">Asia/Yangon</a></li> + <li><a href=# onclick="return selected_server_timezone('Asia/Yekaterinburg');">Asia/Yekaterinburg</a></li> + <li><a href=# onclick="return selected_server_timezone('Asia/Yerevan');">Asia/Yerevan</a></li> + <li><a href=# onclick="return selected_server_timezone('Atlantic/Azores');">Atlantic/Azores</a></li> + <li><a href=# onclick="return selected_server_timezone('Atlantic/Bermuda');">Atlantic/Bermuda</a></li> + <li><a href=# onclick="return selected_server_timezone('Atlantic/Canary');">Atlantic/Canary</a></li> + <li><a href=# onclick="return selected_server_timezone('Atlantic/Cape_Verde');">Atlantic/Cape_Verde</a></li> + <li><a href=# onclick="return selected_server_timezone('Atlantic/Faroe');">Atlantic/Faroe</a></li> + <li><a href=# onclick="return selected_server_timezone('Atlantic/Madeira');">Atlantic/Madeira</a></li> + <li><a href=# onclick="return selected_server_timezone('Atlantic/Reykjavik');">Atlantic/Reykjavik</a></li> + <li><a href=# onclick="return selected_server_timezone('Atlantic/South_Georgia');">Atlantic/South_Georgia</a></li> + <li><a href=# onclick="return selected_server_timezone('Atlantic/Stanley');">Atlantic/Stanley</a></li> + <li><a href=# onclick="return selected_server_timezone('Australia/Adelaide');">Australia/Adelaide</a></li> + <li><a href=# onclick="return selected_server_timezone('Australia/Brisbane');">Australia/Brisbane</a></li> + <li><a href=# onclick="return selected_server_timezone('Australia/Broken_Hill');">Australia/Broken_Hill</a></li> + <li><a href=# onclick="return selected_server_timezone('Australia/Currie');">Australia/Currie</a></li> + <li><a href=# onclick="return selected_server_timezone('Australia/Darwin');">Australia/Darwin</a></li> + <li><a href=# onclick="return selected_server_timezone('Australia/Eucla');">Australia/Eucla</a></li> + <li><a href=# onclick="return selected_server_timezone('Australia/Hobart');">Australia/Hobart</a></li> + <li><a href=# onclick="return selected_server_timezone('Australia/Lindeman');">Australia/Lindeman</a></li> + <li><a href=# onclick="return selected_server_timezone('Australia/Lord_Howe');">Australia/Lord_Howe</a></li> + <li><a href=# onclick="return selected_server_timezone('Australia/Melbourne');">Australia/Melbourne</a></li> + <li><a href=# onclick="return selected_server_timezone('Australia/Perth');">Australia/Perth</a></li> + <li><a href=# onclick="return selected_server_timezone('Australia/Sydney');">Australia/Sydney</a></li> + <li><a href=# onclick="return selected_server_timezone('Europe/Amsterdam');">Europe/Amsterdam</a></li> + <li><a href=# onclick="return selected_server_timezone('Europe/Andorra');">Europe/Andorra</a></li> + <li><a href=# onclick="return selected_server_timezone('Europe/Astrakhan');">Europe/Astrakhan</a></li> + <li><a href=# onclick="return selected_server_timezone('Europe/Athens');">Europe/Athens</a></li> + <li><a href=# onclick="return selected_server_timezone('Europe/Belgrade');">Europe/Belgrade</a></li> + <li><a href=# onclick="return selected_server_timezone('Europe/Berlin');">Europe/Berlin</a></li> + <li><a href=# onclick="return selected_server_timezone('Europe/Brussels');">Europe/Brussels</a></li> + <li><a href=# onclick="return selected_server_timezone('Europe/Bucharest');">Europe/Bucharest</a></li> + <li><a href=# onclick="return selected_server_timezone('Europe/Budapest');">Europe/Budapest</a></li> + <li><a href=# onclick="return selected_server_timezone('Europe/Chisinau');">Europe/Chisinau</a></li> + <li><a href=# onclick="return selected_server_timezone('Europe/Copenhagen');">Europe/Copenhagen</a></li> + <li><a href=# onclick="return selected_server_timezone('Europe/Dublin');">Europe/Dublin</a></li> + <li><a href=# onclick="return selected_server_timezone('Europe/Gibraltar');">Europe/Gibraltar</a></li> + <li><a href=# onclick="return selected_server_timezone('Europe/Helsinki');">Europe/Helsinki</a></li> + <li><a href=# onclick="return selected_server_timezone('Europe/Istanbul');">Europe/Istanbul</a></li> + <li><a href=# onclick="return selected_server_timezone('Europe/Kaliningrad');">Europe/Kaliningrad</a></li> + <li><a href=# onclick="return selected_server_timezone('Europe/Kiev');">Europe/Kiev</a></li> + <li><a href=# onclick="return selected_server_timezone('Europe/Kirov');">Europe/Kirov</a></li> + <li><a href=# onclick="return selected_server_timezone('Europe/Lisbon');">Europe/Lisbon</a></li> + <li><a href=# onclick="return selected_server_timezone('Europe/London');">Europe/London</a></li> + <li><a href=# onclick="return selected_server_timezone('Europe/Luxembourg');">Europe/Luxembourg</a></li> + <li><a href=# onclick="return selected_server_timezone('Europe/Madrid');">Europe/Madrid</a></li> + <li><a href=# onclick="return selected_server_timezone('Europe/Malta');">Europe/Malta</a></li> + <li><a href=# onclick="return selected_server_timezone('Europe/Minsk');">Europe/Minsk</a></li> + <li><a href=# onclick="return selected_server_timezone('Europe/Monaco');">Europe/Monaco</a></li> + <li><a href=# onclick="return selected_server_timezone('Europe/Moscow');">Europe/Moscow</a></li> + <li><a href=# onclick="return selected_server_timezone('Europe/Oslo');">Europe/Oslo</a></li> + <li><a href=# onclick="return selected_server_timezone('Europe/Paris');">Europe/Paris</a></li> + <li><a href=# onclick="return selected_server_timezone('Europe/Prague');">Europe/Prague</a></li> + <li><a href=# onclick="return selected_server_timezone('Europe/Riga');">Europe/Riga</a></li> + <li><a href=# onclick="return selected_server_timezone('Europe/Rome');">Europe/Rome</a></li> + <li><a href=# onclick="return selected_server_timezone('Europe/Samara');">Europe/Samara</a></li> + <li><a href=# onclick="return selected_server_timezone('Europe/Saratov');">Europe/Saratov</a></li> + <li><a href=# onclick="return selected_server_timezone('Europe/Simferopol');">Europe/Simferopol</a></li> + <li><a href=# onclick="return selected_server_timezone('Europe/Sofia');">Europe/Sofia</a></li> + <li><a href=# onclick="return selected_server_timezone('Europe/Stockholm');">Europe/Stockholm</a></li> + <li><a href=# onclick="return selected_server_timezone('Europe/Tallinn');">Europe/Tallinn</a></li> + <li><a href=# onclick="return selected_server_timezone('Europe/Tirane');">Europe/Tirane</a></li> + <li><a href=# onclick="return selected_server_timezone('Europe/Ulyanovsk');">Europe/Ulyanovsk</a></li> + <li><a href=# onclick="return selected_server_timezone('Europe/Uzhgorod');">Europe/Uzhgorod</a></li> + <li><a href=# onclick="return selected_server_timezone('Europe/Vienna');">Europe/Vienna</a></li> + <li><a href=# onclick="return selected_server_timezone('Europe/Vilnius');">Europe/Vilnius</a></li> + <li><a href=# onclick="return selected_server_timezone('Europe/Volgograd');">Europe/Volgograd</a></li> + <li><a href=# onclick="return selected_server_timezone('Europe/Warsaw');">Europe/Warsaw</a></li> + <li><a href=# onclick="return selected_server_timezone('Europe/Zaporozhye');">Europe/Zaporozhye</a></li> + <li><a href=# onclick="return selected_server_timezone('Europe/Zurich');">Europe/Zurich</a></li> + <li><a href=# onclick="return selected_server_timezone('Indian/Chagos');">Indian/Chagos</a></li> + <li><a href=# onclick="return selected_server_timezone('Indian/Christmas');">Indian/Christmas</a></li> + <li><a href=# onclick="return selected_server_timezone('Indian/Cocos');">Indian/Cocos</a></li> + <li><a href=# onclick="return selected_server_timezone('Indian/Kerguelen');">Indian/Kerguelen</a></li> + <li><a href=# onclick="return selected_server_timezone('Indian/Mahe');">Indian/Mahe</a></li> + <li><a href=# onclick="return selected_server_timezone('Indian/Maldives');">Indian/Maldives</a></li> + <li><a href=# onclick="return selected_server_timezone('Indian/Mauritius');">Indian/Mauritius</a></li> + <li><a href=# onclick="return selected_server_timezone('Indian/Reunion');">Indian/Reunion</a></li> + <li><a href=# onclick="return selected_server_timezone('Pacific/Apia');">Pacific/Apia</a></li> + <li><a href=# onclick="return selected_server_timezone('Pacific/Auckland');">Pacific/Auckland</a></li> + <li><a href=# onclick="return selected_server_timezone('Pacific/Bougainville');">Pacific/Bougainville</a></li> + <li><a href=# onclick="return selected_server_timezone('Pacific/Chatham');">Pacific/Chatham</a></li> + <li><a href=# onclick="return selected_server_timezone('Pacific/Chuuk');">Pacific/Chuuk</a></li> + <li><a href=# onclick="return selected_server_timezone('Pacific/Easter');">Pacific/Easter</a></li> + <li><a href=# onclick="return selected_server_timezone('Pacific/Efate');">Pacific/Efate</a></li> + <li><a href=# onclick="return selected_server_timezone('Pacific/Enderbury');">Pacific/Enderbury</a></li> + <li><a href=# onclick="return selected_server_timezone('Pacific/Fakaofo');">Pacific/Fakaofo</a></li> + <li><a href=# onclick="return selected_server_timezone('Pacific/Fiji');">Pacific/Fiji</a></li> + <li><a href=# onclick="return selected_server_timezone('Pacific/Funafuti');">Pacific/Funafuti</a></li> + <li><a href=# onclick="return selected_server_timezone('Pacific/Galapagos');">Pacific/Galapagos</a></li> + <li><a href=# onclick="return selected_server_timezone('Pacific/Gambier');">Pacific/Gambier</a></li> + <li><a href=# onclick="return selected_server_timezone('Pacific/Guadalcanal');">Pacific/Guadalcanal</a></li> + <li><a href=# onclick="return selected_server_timezone('Pacific/Guam');">Pacific/Guam</a></li> + <li><a href=# onclick="return selected_server_timezone('Pacific/Honolulu');">Pacific/Honolulu</a></li> + <li><a href=# onclick="return selected_server_timezone('Pacific/Kiritimati');">Pacific/Kiritimati</a></li> + <li><a href=# onclick="return selected_server_timezone('Pacific/Kosrae');">Pacific/Kosrae</a></li> + <li><a href=# onclick="return selected_server_timezone('Pacific/Kwajalein');">Pacific/Kwajalein</a></li> + <li><a href=# onclick="return selected_server_timezone('Pacific/Majuro');">Pacific/Majuro</a></li> + <li><a href=# onclick="return selected_server_timezone('Pacific/Marquesas');">Pacific/Marquesas</a></li> + <li><a href=# onclick="return selected_server_timezone('Pacific/Nauru');">Pacific/Nauru</a></li> + <li><a href=# onclick="return selected_server_timezone('Pacific/Niue');">Pacific/Niue</a></li> + <li><a href=# onclick="return selected_server_timezone('Pacific/Norfolk');">Pacific/Norfolk</a></li> + <li><a href=# onclick="return selected_server_timezone('Pacific/Noumea');">Pacific/Noumea</a></li> + <li><a href=# onclick="return selected_server_timezone('Pacific/Pago_Pago');">Pacific/Pago_Pago</a></li> + <li><a href=# onclick="return selected_server_timezone('Pacific/Palau');">Pacific/Palau</a></li> + <li><a href=# onclick="return selected_server_timezone('Pacific/Pitcairn');">Pacific/Pitcairn</a></li> + <li><a href=# onclick="return selected_server_timezone('Pacific/Pohnpei');">Pacific/Pohnpei</a></li> + <li><a href=# onclick="return selected_server_timezone('Pacific/Port_Moresby');">Pacific/Port_Moresby</a></li> + <li><a href=# onclick="return selected_server_timezone('Pacific/Rarotonga');">Pacific/Rarotonga</a></li> + <li><a href=# onclick="return selected_server_timezone('Pacific/Tahiti');">Pacific/Tahiti</a></li> + <li><a href=# onclick="return selected_server_timezone('Pacific/Tarawa');">Pacific/Tarawa</a></li> + <li><a href=# onclick="return selected_server_timezone('Pacific/Tongatapu');">Pacific/Tongatapu</a></li> + <li><a href=# onclick="return selected_server_timezone('Pacific/Wake');">Pacific/Wake</a></li> + <li><a href=# onclick="return selected_server_timezone('Pacific/Wallis');">Pacific/Wallis</a></li> + </ul> + </div> + <b><span id="timezone_error_message"></span></b> + + </small> + </td> + </tr> + </table> + </div> + </form> + </div> + </div> + </div> + <div class="modal-footer"> + <button type="button" class="btn btn-default" data-dismiss="modal">Close</button> + </div> + </div> + </div> + </div> + + + <div class="modal fade" id="updateModal" tabindex="-1" role="dialog" aria-labelledby="updateModalLabel"> + <div class="modal-dialog" role="document"> + <div class="modal-content"> + <div class="modal-header"> + <button type="button" class="close" data-dismiss="modal" aria-label="Close"><span aria-hidden="true">×</span></button> + <h4 class="modal-title" id="updateModalLabel">Update Check</h4> + </div> + <div class="modal-body"> + Your netdata version: <b><code><span id="netdataVersion">Unknown</span></code></b><br/> + <br/> + <div style="padding: 10px;"></div> + <div id="versionCheckLog">Not checked yet. Please press the Check Now button.</div> + <div> + <hr/> + </div> + <div> + For progress reports and key netdata updates: <strong><a href="https://twitter.com/linuxnetdata" target="_blank">follow netdata on <i class="fab fa-twitter"></i> twitter</a></strong>. + <br/> + You can also <a href="https://www.facebook.com/linuxnetdata/" target="_blank">follow netdata on <i class="fab fa-facebook"></i> facebook</a>, + or <a href="https://github.com/netdata/netdata" target="_blank">watch netdata on <i class="fab fa-github"></i> github</a>. + </div> + </div> + <div class="modal-footer"> + <a href="#" onclick="notifyForUpdate(true); return false;" type="button" class="btn btn-default">Check Now</a> + <button type="button" class="btn btn-default" data-dismiss="modal">Close</button> + </div> + </div> + </div> + </div> + + <div class="modal fade" id="signInModal" tabindex="-1" role="dialog" aria-labelledby="signInModalLabel"> + <div class="modal-dialog" role="document"> + <div class="modal-content"> + <div class="modal-header"> + <button type="button" class="close" data-dismiss="modal" aria-label="Close"><span aria-hidden="true">×</span></button> + <h4 class="modal-title" id="signInModalLabel">Sign In</h4> + </div> + <div class="modal-body"> + <p> + Signing-in to netdata.cloud will synchronize the list of + your netdata monitored nodes known at registry + <strong><span id="sim-registry"></span></strong>. This + may include server hostnames, urls and identification + GUIDs. + </p> + <p> + After you upgrade all your netdata servers, your private + registry will not be needed any more. + </p> + <p> + Are you sure you want to proceed? + </p> + </div> + <div class="modal-footer"> + <button type="button" class="btn btn-default" data-dismiss="modal">Cancel</button> + <a href="#" onclick="explicitlySignIn(); return false;" type="button" class="btn btn-success">Sign In</a> + </div> + </div> + </div> + </div> + + <div class="modal fade" id="syncRegistryModal" tabindex="-1" role="dialog" aria-labelledby="syncRegistryModalLabel"> + <div class="modal-dialog" role="document"> + <div class="modal-content"> + <div class="modal-header"> + <button type="button" class="close" data-dismiss="modal" aria-label="Close"><span aria-hidden="true">×</span></button> + <h4 class="modal-title" id="syncRegistryModalLabel">Synchronize netdata.cloud with registry?</h4> + </div> + <div class="modal-body"> + <p> + You are about to synchronize your netdata.cloud account with data from the registry at <strong><span id="sync-registry-modal-registry"></span></strong>. + This may include server hostnames, urls and identification GUIDs. + </p> + <p> + Are you sure you want to proceed? + </p> + </div> + <div class="modal-footer"> + <button type="button" class="btn btn-default" data-dismiss="modal">Cancel</button> + <a href="#" onclick="explicitlySyncAgents(); return false;" type="button" class="btn btn-success">Synchronize</a> + </div> + </div> + </div> + </div> + + <div class="modal fade" id="deleteRegistryModal" tabindex="-1" role="dialog" aria-labelledby="deleteRegistryModalLabel"> + <div class="modal-dialog" role="document"> + <div class="modal-content"> + <div class="modal-header"> + <button type="button" class="close" data-dismiss="modal" aria-label="Close"><span aria-hidden="true">×</span></button> + <h4 class="modal-title" id="deleteRegistryModalLabel">Delete <span id="deleteRegistryServerName"></span>?</h4> + </div> + <div class="modal-body"> + You are about to delete, from your personal list of netdata servers, the following server: + <p style="text-align: center; padding-top: 10px; padding-bottom: 10px; line-height: 2;"> + <b><span id="deleteRegistryServerName2"></span></b> + <br/> + <b><span id="deleteRegistryServerURL"></span></b> + </p> + Are you sure you want to do this? + <br/> + <div style="padding: 10px;"></div> + <small>Keep in mind, this server will be added back if and when you visit it again.</small> + <br/> + <div id="deleteRegistryResponse" style="display: block; width: 100%; text-align: center; padding-top: 20px;"></div> + </div> + <div class="modal-footer"> + <button type="button" class="btn btn-success" data-dismiss="modal">keep it</button> + <a href="#" onclick="notifyForDeleteRegistry(); return false;" type="button" class="btn btn-danger">delete it</a> + </div> + </div> + </div> + </div> + + <div class="modal fade" id="switchRegistryModal" tabindex="-1" role="dialog" aria-labelledby="switchRegistryModalLabel"> + <div class="modal-dialog" role="document"> + <div class="modal-content"> + <div class="modal-header"> + <button type="button" class="close" data-dismiss="modal" aria-label="Close"><span aria-hidden="true">×</span></button> + <h4 class="modal-title" id="switchRegistryModalLabel">Switch Netdata Registry Identity</h4> + </div> + <div class="modal-body"> + You can copy and paste the following ID to all your browsers (e.g. work and home). + <br/> + All the browsers with the same ID will identify <b>you</b>, so please don't share this with others. + <div style="text-align: center; padding-top: 10px; padding-bottom: 10px; line-height: 2;"> + <form action="#"> + <input type="text" class="form-control" id="switchRegistryPersonGUID" placeholder="your personal ID" maxlength="36" autocomplete="off" style="text-align: center; font-size: 1.4em;"> + </form> + </div> + Either copy this ID and paste it to another browser, or paste here the ID you have taken from another browser. + <div style="padding-top: 10px;"><small> + Keep in mind that: + <ul> + <li>when you switch ID, your previous ID will be lost forever - this is irreversible.</li> + <li>both IDs (your old and the new) must list this netdata at their personal lists.</li> + <li>both IDs have to be known by the registry: <b><span id="switchRegistryURL"></span></b>.</li> + <li>to get a new ID, just clear your browser cookies.</li> + </ul> + </small></div> + <div id="switchRegistryResponse" style="display: block; width: 100%; text-align: center; padding-top: 20px;"></div> + </div> + <div class="modal-footer"> + <button type="button" class="btn btn-success" data-dismiss="modal">cancel</button> + <a href="#" onclick="notifyForSwitchRegistry(); return false;" type="button" class="btn btn-danger">impersonate</a> + </div> + </div> + </div> + </div> + + <div class="modal fade" id="gotoServerModal" tabindex="-1" role="dialog" aria-labelledby="gotoServerModalLabel"> + <div class="modal-dialog" role="document"> + <div class="modal-content"> + <div class="modal-header"> + <button type="button" class="close" data-dismiss="modal" aria-label="Close"><span aria-hidden="true">×</span></button> + <h4 class="modal-title" id="gotoServerModalLabel"><span id="gotoServerName"></span></h4> + </div> + <div class="modal-body"> + Checking known URLs for this server... + <div style="padding-top: 20px;"> + <table id="gotoServerList"> + </table> + </div> + <p style="padding-top: 10px;"><small> + Checks may fail if you are viewing an HTTPS page and the server to be checked is HTTP only. + </small></p> + <div id="gotoServerResponse" style="display: block; width: 100%; text-align: center; padding-top: 20px;"></div> + </div> + <div class="modal-footer"> + <button type="button" class="btn btn-default" data-dismiss="modal">Close</button> + </div> + </div> + </div> + </div> + <iframe id="ssoifrm" width="0" height="0"></iframe> + <div id="hiddenDownloadLinks" style="display: none;" hidden></div> + <script type="text/javascript" src="../dashboard.js?v20190902-0"></script> +</body> +</html> diff --git a/web/gui/src/dashboard.js/charting/_c3.js b/web/gui/src/dashboard.js/charting/_c3.js new file mode 100644 index 000000000..6688bbcce --- /dev/null +++ b/web/gui/src/dashboard.js/charting/_c3.js @@ -0,0 +1,114 @@ + +// DEPRECATED: will be removed! + +// c3 + +NETDATA.c3Initialize = function(callback) { + if (typeof netdataNoC3 === 'undefined' || !netdataNoC3) { + + // C3 requires D3 + if (!NETDATA.chartLibraries.d3.initialized) { + if (NETDATA.chartLibraries.d3.enabled) { + NETDATA.d3Initialize(function() { + NETDATA.c3Initialize(callback); + }); + } else { + NETDATA.chartLibraries.c3.enabled = false; + if (typeof callback === "function") + return callback(); + } + } else { + NETDATA._loadCSS(NETDATA.c3_css); + + $.ajax({ + url: NETDATA.c3_js, + cache: true, + dataType: "script", + xhrFields: { withCredentials: true } // required for the cookie + }) + .done(function() { + NETDATA.registerChartLibrary('c3', NETDATA.c3_js); + }) + .fail(function() { + NETDATA.chartLibraries.c3.enabled = false; + NETDATA.error(100, NETDATA.c3_js); + }) + .always(function() { + if (typeof callback === "function") + return callback(); + }); + } + } else { + NETDATA.chartLibraries.c3.enabled = false; + if (typeof callback === "function") + return callback(); + } +}; + +NETDATA.c3ChartUpdate = function(state, data) { + state.c3_instance.destroy(); + return NETDATA.c3ChartCreate(state, data); + + //state.c3_instance.load({ + // rows: data.result, + // unload: true + //}); + + //return true; +}; + +NETDATA.c3ChartCreate = function(state, data) { + + state.element_chart.id = 'c3-' + state.uuid; + // console.log('id = ' + state.element_chart.id); + + state.c3_instance = c3.generate({ + bindto: '#' + state.element_chart.id, + size: { + width: state.chartWidth(), + height: state.chartHeight() + }, + color: { + pattern: state.chartColors() + }, + data: { + x: 'time', + rows: data.result, + type: (state.chart.chart_type === 'line')?'spline':'area-spline' + }, + axis: { + x: { + type: 'timeseries', + tick: { + format: function(x) { + return NETDATA.dateTime.xAxisTimeString(x); + } + } + } + }, + grid: { + x: { + show: true + }, + y: { + show: true + } + }, + point: { + show: false + }, + line: { + connectNull: false + }, + transition: { + duration: 0 + }, + interaction: { + enabled: true + } + }); + + // console.log(state.c3_instance); + + return true; +}; diff --git a/web/gui/src/dashboard.js/charting/_morris.js b/web/gui/src/dashboard.js/charting/_morris.js new file mode 100644 index 000000000..30789e4e2 --- /dev/null +++ b/web/gui/src/dashboard.js/charting/_morris.js @@ -0,0 +1,81 @@ + +// DEPRECATED: will be removed! + +// morris + +NETDATA.morrisInitialize = function(callback) { + if (typeof netdataNoMorris === 'undefined' || !netdataNoMorris) { + + // morris requires raphael + if (!NETDATA.chartLibraries.raphael.initialized) { + if (NETDATA.chartLibraries.raphael.enabled) { + NETDATA.raphaelInitialize(function() { + NETDATA.morrisInitialize(callback); + }); + } else { + NETDATA.chartLibraries.morris.enabled = false; + if (typeof callback === "function") + return callback(); + } + } else { + NETDATA._loadCSS(NETDATA.morris_css); + + $.ajax({ + url: NETDATA.morris_js, + cache: true, + dataType: "script", + xhrFields: { withCredentials: true } // required for the cookie + }) + .done(function() { + NETDATA.registerChartLibrary('morris', NETDATA.morris_js); + }) + .fail(function() { + NETDATA.chartLibraries.morris.enabled = false; + NETDATA.error(100, NETDATA.morris_js); + }) + .always(function() { + if (typeof callback === "function") + return callback(); + }); + } + } else { + NETDATA.chartLibraries.morris.enabled = false; + if (typeof callback === "function") + return callback(); + } +}; + +NETDATA.morrisChartUpdate = function(state, data) { + state.morris_instance.setData(data.result.data); + return true; +}; + +NETDATA.morrisChartCreate = function(state, data) { + + state.morris_options = { + element: state.element_chart.id, + data: data.result.data, + xkey: 'time', + ykeys: data.dimension_names, + labels: data.dimension_names, + lineWidth: 2, + pointSize: 3, + smooth: true, + hideHover: 'auto', + parseTime: true, + continuousLine: false, + behaveLikeLine: false + }; + + if (state.chart.chart_type === 'line') + state.morris_instance = new Morris.Line(state.morris_options); + + else if (state.chart.chart_type === 'area') { + state.morris_options.behaveLikeLine = true; + state.morris_instance = new Morris.Area(state.morris_options); + } + else // stacked + state.morris_instance = new Morris.Area(state.morris_options); + + return true; +}; diff --git a/web/gui/src/dashboard.js/charting/_raphael.js b/web/gui/src/dashboard.js/charting/_raphael.js new file mode 100644 index 000000000..2d89a22a8 --- /dev/null +++ b/web/gui/src/dashboard.js/charting/_raphael.js @@ -0,0 +1,48 @@ + +// DEPRECATED: will be removed! + +// raphael + +NETDATA.raphaelInitialize = function(callback) { + if (typeof netdataStopRaphael === 'undefined' || !netdataStopRaphael) { + $.ajax({ + url: NETDATA.raphael_js, + cache: true, + dataType: "script", + xhrFields: { withCredentials: true } // required for the cookie + }) + .done(function() { + NETDATA.registerChartLibrary('raphael', NETDATA.raphael_js); + }) + .fail(function() { + NETDATA.chartLibraries.raphael.enabled = false; + NETDATA.error(100, NETDATA.raphael_js); + }) + .always(function() { + if (typeof callback === "function") + return callback(); + }); + } else { + NETDATA.chartLibraries.raphael.enabled = false; + if (typeof callback === "function") + return callback(); + } +}; + +NETDATA.raphaelChartUpdate = function(state, data) { + $(state.element_chart).raphael(data.result, { + width: state.chartWidth(), + height: state.chartHeight() + }); + + return false; +}; + +NETDATA.raphaelChartCreate = function(state, data) { + $(state.element_chart).raphael(data.result, { + width: state.chartWidth(), + height: state.chartHeight() + }); + + return false; +}; diff --git a/web/gui/src/dashboard.js/charting/dygraph.js b/web/gui/src/dashboard.js/charting/dygraph.js index f34d2f4aa..4b44e7c43 100644 --- a/web/gui/src/dashboard.js/charting/dygraph.js +++ b/web/gui/src/dashboard.js/charting/dygraph.js @@ -314,6 +314,9 @@ NETDATA.dygraphChartCreate = function (state, data) { visibility: state.dimensions_visibility.selected2BooleanArray(state.data.dimension_names), logscale: NETDATA.chartLibraries.dygraph.isLogScale(state) ? 'y' : undefined, + // Expects a string in the format "<series name>: <style>" where each series is separated by a | + perSeriesStyle: NETDATA.dataAttribute(state.element, 'dygraph-per-series-style', ''), + axes: { x: { pixelsPerLabel: NETDATA.dataAttribute(state.element, 'dygraph-xpixelsperlabel', 50), @@ -970,9 +973,14 @@ NETDATA.dygraphChartCreate = function (state, data) { //state.tmp.dygraph_options.isZoomedIgnoreProgrammaticZoom = true; } - state.tmp.dygraph_instance = new Dygraph(state.element_chart, - data.result.data, state.tmp.dygraph_options); + let seriesStyles = NETDATA.dygraphGetSeriesStyle(state.tmp.dygraph_options); + state.tmp.dygraph_options.series = seriesStyles; + state.tmp.dygraph_instance = new Dygraph( + state.element_chart, + data.result.data, + state.tmp.dygraph_options + ); state.tmp.dygraph_history_tip_element = document.createElement('div'); state.tmp.dygraph_history_tip_element.innerHTML = ` @@ -1010,3 +1018,48 @@ NETDATA.dygraphChartCreate = function (state, data) { return true; }; + +NETDATA.dygraphGetSeriesStyle = function(dygraphOptions) { + const seriesStyleStr = dygraphOptions.perSeriesStyle; + let formattedStyles = {}; + + if (seriesStyleStr === '') { + return formattedStyles; + } + + // Parse the config string into a JSON object + let styles = seriesStyleStr.replace(' ', '').split('|'); + + styles.forEach(style => { + const keys = style.split(':'); + formattedStyles[keys[0]] = keys[1]; + }); + + for (let key in formattedStyles) { + if (formattedStyles.hasOwnProperty(key)) { + let settings; + + switch (formattedStyles[key]) { + case 'line': + settings = { fillGraph: false }; + break; + case 'area': + settings = { fillGraph: true }; + break; + case 'dot': + settings = { + fillGraph: false, + drawPoints: true, + pointSize: dygraphOptions.pointSize + }; + break; + default: + settings = undefined; + } + + formattedStyles[key] = settings; + } + } + + return formattedStyles; +}; diff --git a/web/gui/src/dashboard.js/main.js b/web/gui/src/dashboard.js/main.js index 564ee7d4e..c1cfba5e5 100644 --- a/web/gui/src/dashboard.js/main.js +++ b/web/gui/src/dashboard.js/main.js @@ -2789,7 +2789,7 @@ let chartState = function (element) { hide: NETDATA.options.current.show_help_delay_hide_ms }, title: 'Pan Right', - content: 'Pan the chart to the right. You can also <b>drag it</b> with your mouse or your finger (on touch devices).<br/><small>Help, can be disabled from the settings.</small>' + content: 'Pan the chart to the right. You can also <b>drag it</b> with your mouse or your finger (on touch devices).<br/><small>Help can be disabled from the settings.</small>' }); } @@ -2815,7 +2815,7 @@ let chartState = function (element) { hide: NETDATA.options.current.show_help_delay_hide_ms }, title: 'Chart Zoom In', - content: 'Zoom in the chart. You can also press SHIFT and select an area of the chart, or press SHIFT or ALT and use the mouse wheel or 2-finger touchpad scroll to zoom in or out.<br/><small>Help, can be disabled from the settings.</small>' + content: 'Zoom in the chart. You can also press SHIFT and select an area of the chart, or press SHIFT or ALT and use the mouse wheel or 2-finger touchpad scroll to zoom in or out.<br/><small>Help can be disabled from the settings.</small>' }); } @@ -2842,7 +2842,7 @@ let chartState = function (element) { hide: NETDATA.options.current.show_help_delay_hide_ms }, title: 'Chart Zoom Out', - content: 'Zoom out the chart. You can also press SHIFT or ALT and use the mouse wheel, or 2-finger touchpad scroll to zoom in or out.<br/><small>Help, can be disabled from the settings.</small>' + content: 'Zoom out the chart. You can also press SHIFT or ALT and use the mouse wheel, or 2-finger touchpad scroll to zoom in or out.<br/><small>Help can be disabled from the settings.</small>' }); } @@ -2874,7 +2874,7 @@ let chartState = function (element) { hide: NETDATA.options.current.show_help_delay_hide_ms }, title: 'Chart Resize', - content: 'Drag this point with your mouse or your finger (on touch devices), to resize the chart vertically. You can also <b>double click it</b> or <b>double tap it</b> to reset between 2 states: the default and the one that fits all the values.<br/><small>Help, can be disabled from the settings.</small>' + content: 'Drag this point with your mouse or your finger (on touch devices), to resize the chart vertically. You can also <b>double click it</b> or <b>double tap it</b> to reset between 2 states: the default and the one that fits all the values.<br/><small>Help can be disabled from the settings.</small>' }); } @@ -2934,7 +2934,7 @@ let chartState = function (element) { show: NETDATA.options.current.show_help_delay_show_ms, hide: NETDATA.options.current.show_help_delay_hide_ms }, - content: 'You can click or tap on the values or the labels to select dimensions. By pressing SHIFT or CONTROL, you can enable or disable multiple dimensions.<br/><small>Help, can be disabled from the settings.</small>' + content: 'You can click or tap on the values or the labels to select dimensions. By pressing SHIFT or CONTROL, you can enable or disable multiple dimensions.<br/><small>Help can be disabled from the settings.</small>' }); } } else { diff --git a/web/gui/src/dashboard.js/units-conversion.js b/web/gui/src/dashboard.js/units-conversion.js index af2c843eb..b0dbd2938 100644 --- a/web/gui/src/dashboard.js/units-conversion.js +++ b/web/gui/src/dashboard.js/units-conversion.js @@ -25,6 +25,13 @@ NETDATA.unitsConversion = { 'gigabits/s': 1000000, 'terabits/s': 1000000000 }, + 'bytes/s': { + 'bytes/s': 1, + 'kilobytes/s': 1024, + 'megabytes/s': 1024 * 1024, + 'gigabytes/s': 1024 * 1024 * 1024, + 'terabytes/s': 1024 * 1024 * 1024 * 1024 + }, 'kilobytes/s': { 'bytes/s': 1 / 1024, 'kilobytes/s': 1, @@ -32,6 +39,13 @@ NETDATA.unitsConversion = { 'gigabytes/s': 1024 * 1024, 'terabytes/s': 1024 * 1024 * 1024 }, + 'B/s': { + 'B/s': 1, + 'KiB/s': 1024, + 'MiB/s': 1024 * 1024, + 'GiB/s': 1024 * 1024 * 1024, + 'TiB/s': 1024 * 1024 * 1024 * 1024 + }, 'KB/s': { 'B/s': 1 / 1024, 'KB/s': 1, diff --git a/web/gui/version.txt b/web/gui/version.txt deleted file mode 100644 index cd8a059de..000000000 --- a/web/gui/version.txt +++ /dev/null @@ -1 +0,0 @@ -5000257f0171271cb3ee2cf0fe02e8a2154ddf2e |