# netdata [](https://travis-ci.org/firehol/netdata) [](https://www.codacy.com/app/netdata/netdata?utm_source=github.com&utm_medium=referral&utm_content=firehol/netdata&utm_campaign=Badge_Grade) [](https://codeclimate.com/github/firehol/netdata) [](https://www.gnu.org/licenses/gpl-3.0) > *New to netdata? Here is a live demo: [http://my-netdata.io](http://my-netdata.io)* **netdata** is a system for **distributed real-time performance and health monitoring**. It provides **unparalleled insights, in real-time**, of everything happening on the system it runs (including applications such as web and database servers), using **modern interactive web dashboards**. _netdata is **fast** and **efficient**, designed to permanently run on all systems (**physical** & **virtual** servers, **containers**, **IoT** devices), without disrupting their core function._ netdata runs on **Linux**, **FreeBSD**, and **MacOS**. [](https://twitter.com/linuxnetdata) []() --- ## User base *Docker pulls*<br/> [](https://hub.docker.com/r/titpetric/netdata/) [](https://hub.docker.com/r/firehol/netdata/) *Since May 16th 2016 (the date the [global public netdata registry](https://github.com/firehol/netdata/wiki/mynetdata-menu-item) was released):*<br/> [](https://registry.my-netdata.io/#menu_netdata_submenu_registry) [](https://registry.my-netdata.io/#menu_netdata_submenu_registry) [](https://registry.my-netdata.io/#menu_netdata_submenu_registry) *in the last 24 hours:*<br/> [](https://registry.my-netdata.io/#menu_netdata_submenu_registry) [](https://registry.my-netdata.io/#menu_netdata_submenu_registry) [](https://registry.my-netdata.io/#menu_netdata_submenu_registry) --- ## News `Dec 17th, 2017` - **[netdata v1.9.0 released!](https://github.com/firehol/netdata/releases)** A big release: - dashboard snapshots, for loading / saving selected time-frames - highlighted time-frames across all charts of the dashboard - IP access lists for filtering access to netdata - enhanced VMs and containers monitoring - auto-scaling of chart units - timezone conversion at the dashboard to allow comparing charts with server logs - python.d.plugin rewritten - dozens of more improvements, enhancements, features and compatibility fixes --- ## Features <p align="center"> <img src="https://cloud.githubusercontent.com/assets/2662304/19168687/f6a567be-8c19-11e6-8561-ce8d589e8346.gif"/> </p> - **Stunning interactive bootstrap dashboards**<br/> mouse and touch friendly, in 2 themes: dark, light - **Amazingly fast**<br/> responds to all queries in less than 0.5 ms per metric, even on low-end hardware - **Highly efficient**<br/> collects thousands of metrics per server per second, with just 1% CPU utilization of a single core, a few MB of RAM and no disk I/O at all - **Sophisticated alerting**<br/> hundreds of alarms, **out of the box**!<br/> supports dynamic thresholds, hysteresis, alarm templates, multiple role-based notification methods (such as email, slack.com, flock.com, pushover.net, pushbullet.com, telegram.org, twilio.com, messagebird.com, kavenegar.com) - **Extensible**<br/> you can monitor anything you can get a metric for, using its Plugin API (anything can be a netdata plugin, BASH, python, perl, node.js, java, Go, ruby, etc) - **Embeddable**<br/> it can run anywhere a Linux kernel runs (even IoT) and its charts can be embedded on your web pages too - **Customizable**<br/> custom dashboards can be built using simple HTML (no javascript necessary) - **Zero configuration**<br/> auto-detects everything, it can collect up to 5000 metrics per server out of the box - **Zero dependencies**<br/> it is even its own web server, for its static web files and its web API - **Zero maintenance**<br/> you just run it, it does the rest - **scales to infinity**<br/> requiring minimal central resources - **several operating modes**<br/> autonomous host monitoring, headless data collector, forwarding proxy, store and forward proxy, central multi-host monitoring, in all possible configurations. Each node may have different metrics retention policy and run with or without health monitoring. - **time-series back-ends supported**<br/> can archive its metrics on `graphite`, `opentsdb`, `prometheus`, json document DBs, in the same or lower detail (lower: to prevent it from congesting these servers due to the amount of data collected)  --- ## What does it monitor? netdata collects several thousands of metrics per device. All these metrics are collected and visualized in real-time. > _Almost all metrics are auto-detected, without any configuration._ This is a list of what it currently monitors: - **CPU**<br/> usage, interrupts, softirqs, frequency, total and per core, CPU states - **Memory**<br/> RAM, swap and kernel memory usage, KSM (Kernel Samepage Merging), NUMA - **Disks**<br/> per disk: I/O, operations, backlog, utilization, space, software RAID (md)  - **Network interfaces**<br/> per interface: bandwidth, packets, errors, drops  - **IPv4 networking**<br/> bandwidth, packets, errors, fragments, tcp: connections, packets, errors, handshake, udp: packets, errors, broadcast: bandwidth, packets, multicast: bandwidth, packets - **IPv6 networking**<br/> bandwidth, packets, errors, fragments, ECT, udp: packets, errors, udplite: packets, errors, broadcast: bandwidth, multicast: bandwidth, packets, icmp: messages, errors, echos, router, neighbor, MLDv2, group membership, break down by type - **Interprocess Communication - IPC**<br/> such as semaphores and semaphores arrays - **netfilter / iptables Linux firewall**<br/> connections, connection tracker events, errors - **Linux DDoS protection**<br/> SYNPROXY metrics - **fping** latencies</br> for any number of hosts, showing latency, packets and packet loss  - **Processes**<br/> running, blocked, forks, active - **Entropy**<br/> random numbers pool, using in cryptography - **NFS file servers and clients**<br/> NFS v2, v3, v4: I/O, cache, read ahead, RPC calls - **Network QoS**<br/> the only tool that visualizes network `tc` classes in realtime  - **Linux Control Groups**<br/> containers: systemd, lxc, docker - **Applications**<br/> by grouping the process tree and reporting CPU, memory, disk reads, disk writes, swap, threads, pipes, sockets - per group  - **Users and User Groups resource usage**<br/> by summarizing the process tree per user and group, reporting: CPU, memory, disk reads, disk writes, swap, threads, pipes, sockets - **Apache and lighttpd web servers**<br/> `mod-status` (v2.2, v2.4) and cache log statistics, for multiple servers - **Nginx web servers**<br/> `stub-status`, for multiple servers - **Tomcat**<br/> accesses, threads, free memory, volume - **web server log files**<br/> extracting in real-time, web server performance metrics and applying several health checks - **mySQL databases**<br/> multiple servers, each showing: bandwidth, queries/s, handlers, locks, issues, tmp operations, connections, binlog metrics, threads, innodb metrics, and more - **Postgres databases**<br/> multiple servers, each showing: per database statistics (connections, tuples read - written - returned, transactions, locks), backend processes, indexes, tables, write ahead, background writer and more - **Redis databases**<br/> multiple servers, each showing: operations, hit rate, memory, keys, clients, slaves - **couchdb**<br/> reads/writes, request methods, status codes, tasks, replication, per-db, etc - **mongodb**<br/> operations, clients, transactions, cursors, connections, asserts, locks, etc - **memcached databases**<br/> multiple servers, each showing: bandwidth, connections, items - **elasticsearch**<br/> search and index performance, latency, timings, cluster statistics, threads statistics, etc - **ISC Bind name servers**<br/> multiple servers, each showing: clients, requests, queries, updates, failures and several per view metrics - **NSD name servers**<br/> queries, zones, protocols, query types, transfers, etc. - **PowerDNS**</br> queries, answers, cache, latency, etc. - **Postfix email servers**<br/> message queue (entries, size) - **exim email servers**<br/> message queue (emails queued) - **Dovecot** POP3/IMAP servers<br/> - **ISC dhcpd**<br/> pools utilization, leases, etc. - **IPFS**<br/> bandwidth, peers - **Squid proxy servers**<br/> multiple servers, each showing: clients bandwidth and requests, servers bandwidth and requests - **HAproxy**<br/> bandwidth, sessions, backends, etc - **varnish**<br/> threads, sessions, hits, objects, backends, etc - **OpenVPN**<br/> status per tunnel - **Hardware sensors**<br/> `lm_sensors` and `IPMI`: temperature, voltage, fans, power, humidity - **NUT and APC UPSes**<br/> load, charge, battery voltage, temperature, utility metrics, output metrics - **PHP-FPM**<br/> multiple instances, each reporting connections, requests, performance - **hddtemp**<br/> disk temperatures - **smartd**<br/> disk S.M.A.R.T. values - **SNMP devices**<br/> can be monitored too (although you will need to configure these) - **chrony**</br> frequencies, offsets, delays, etc. - **beanstalkd**</br> global and per tube monitoring - **statsd**<br/> [netdata is a fully featured statsd server](https://github.com/firehol/netdata/wiki/statsd) - **ceph**<br/> OSD usage, Pool usage, number of objects, etc. And you can extend it, by writing plugins that collect data from any source, using any computer language. --- ## netdata infographic This is a high level overview of netdata feature set and architecture. Click it to to interact with it (it has direct links to documentation). [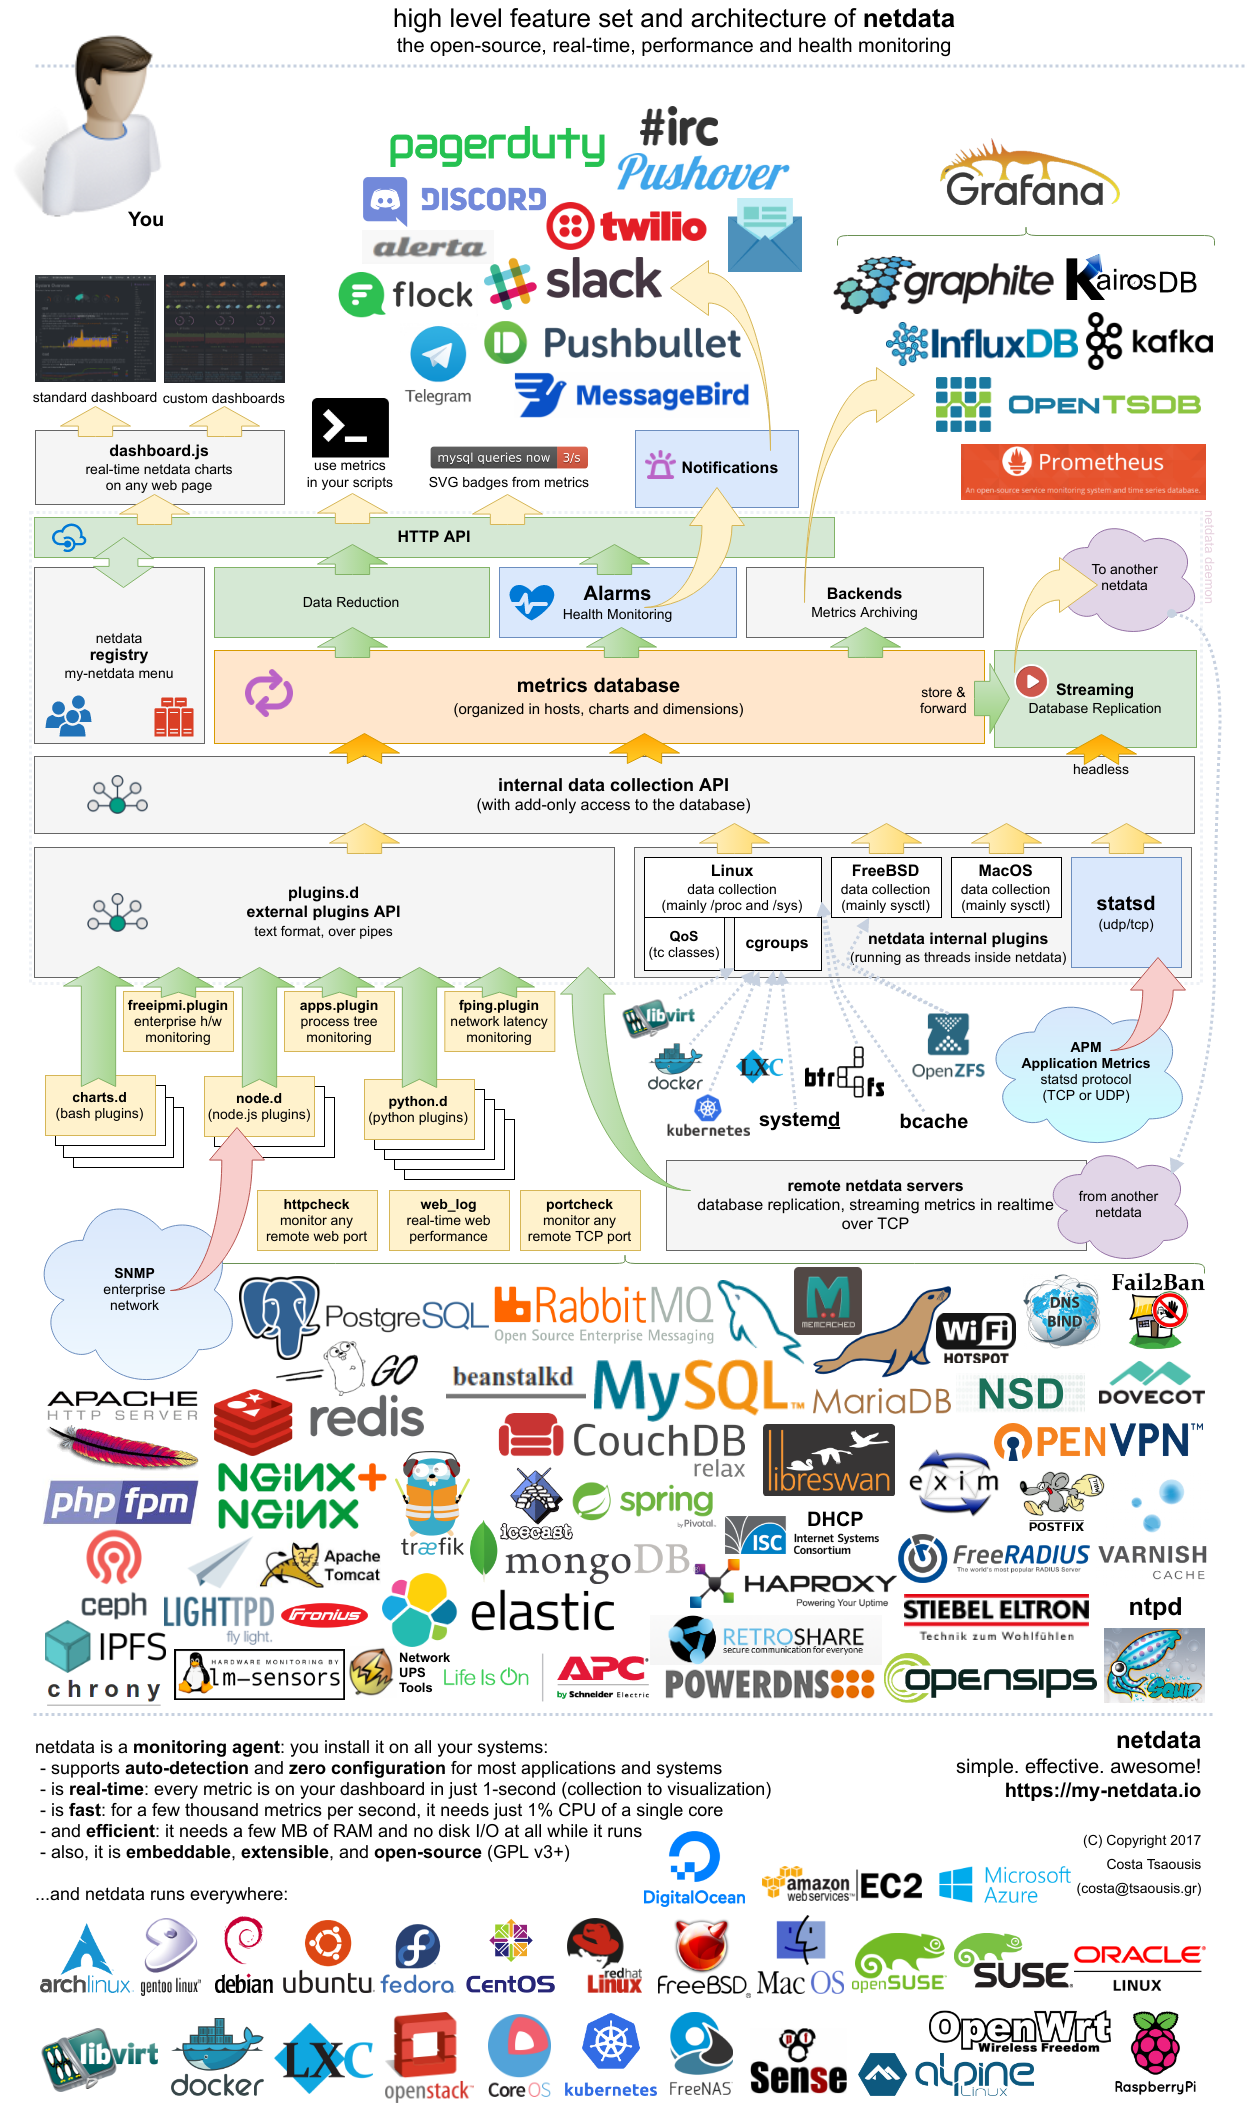](https://my-netdata.io/infographic.html) --- ## Installation Use our **[automatic installer](https://github.com/firehol/netdata/wiki/Installation)** to build and install it on your system. It should run on **any Linux** system (including IoT). It has been tested on: - Alpine - Arch Linux - CentOS - Debian - Fedora - Gentoo - openSUSE - PLD Linux - RedHat Enterprise Linux - SUSE - Ubuntu --- ## Interaction with netdata After installation, you can interact with netdata using **[CLI](https://github.com/firehol/netdata/wiki/Command-Line-Options)** and web dashboards. The default port of dashboard is 19999. To access the web dashboard on localhost, use: http://localhost:19999 --- ## Documentation Check the **[netdata wiki](https://github.com/firehol/netdata/wiki)**. ## License netdata is [GPLv3+](LICENSE). It re-distributes other open-source tools and libraries. Please check the [third party licenses](https://github.com/firehol/netdata/blob/master/LICENSE-REDISTRIBUTED.md).