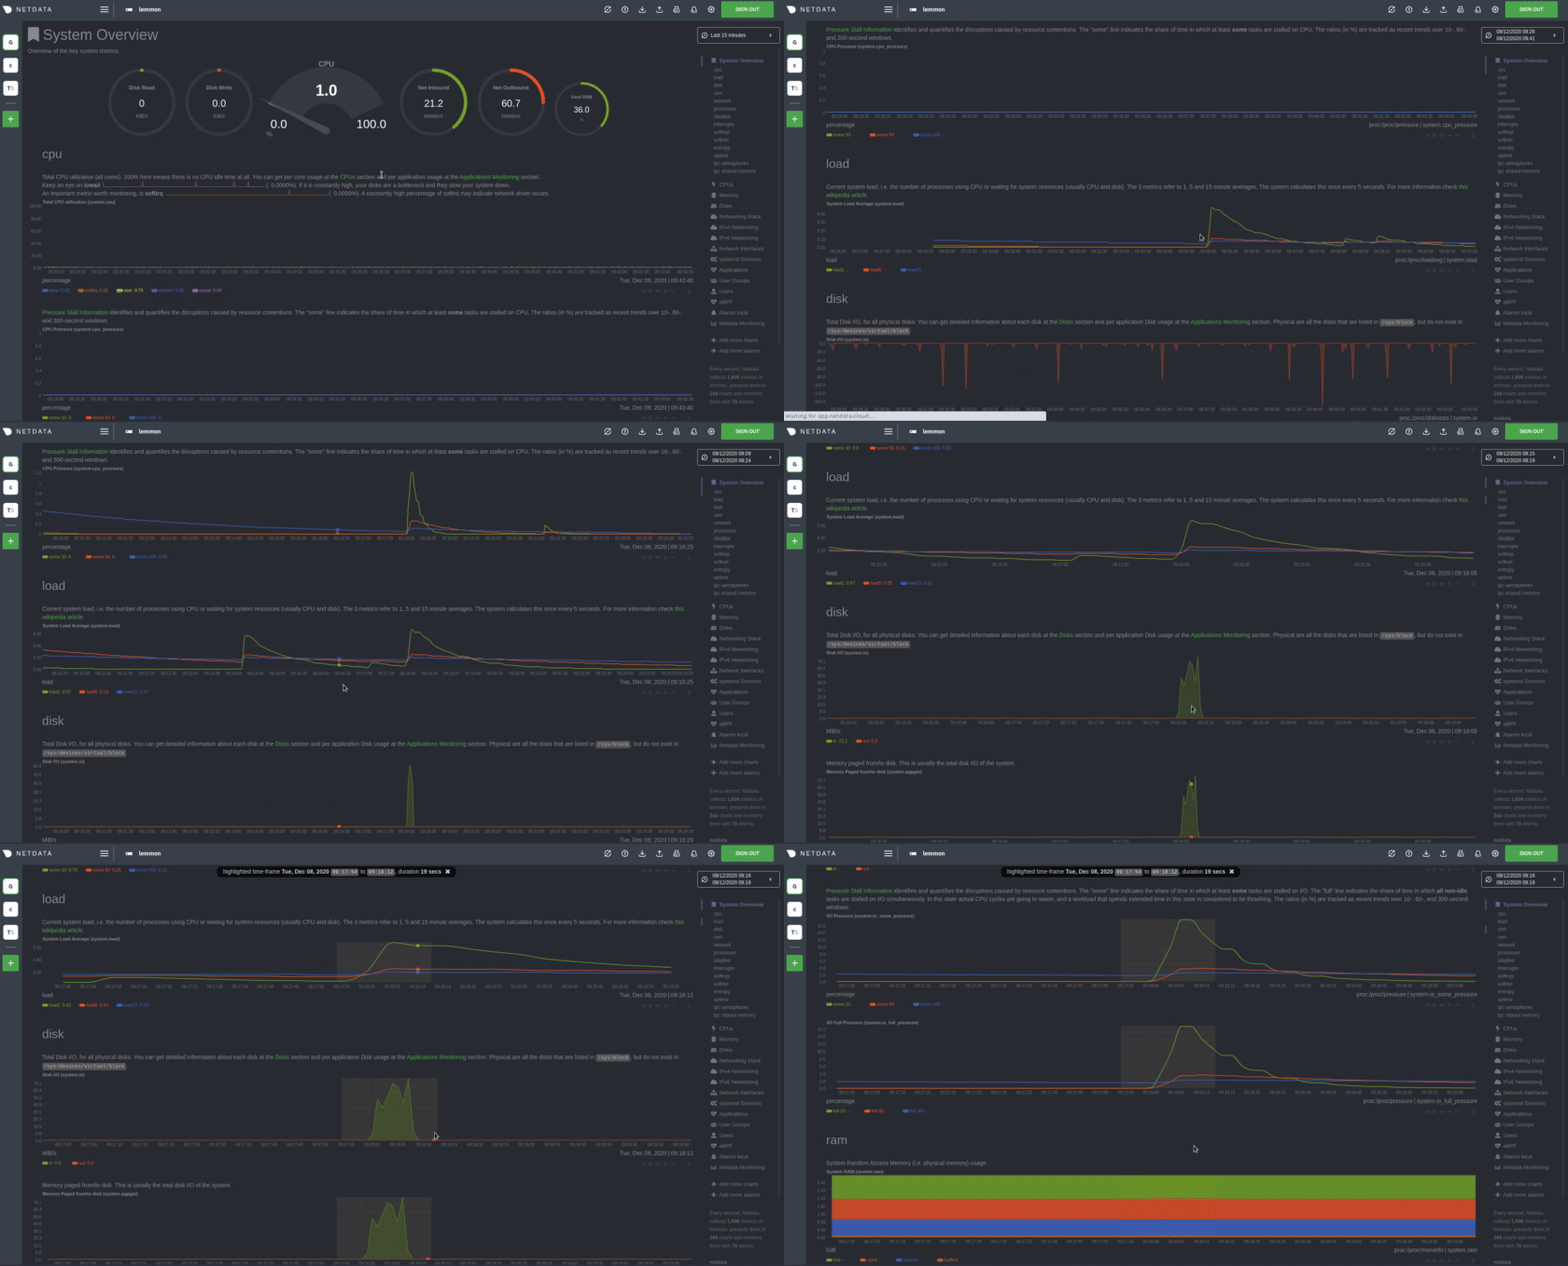
Netdata is high-fidelity infrastructure monitoring and troubleshooting.
Open-source, free, preconfigured, opinionated, and always real-time.


 Netdata's **distributed, real-time monitoring Agent** collects thousands of metrics from systems, hardware, containers,
and applications with zero configuration. It runs permanently on all your physical/virtual servers, containers, cloud
deployments, and edge/IoT devices, and is perfectly safe to install on your systems mid-incident without any
preparation.
You can install Netdata on most Linux distributions (Ubuntu, Debian, CentOS, and more), container platforms (Kubernetes
clusters, Docker), and many other operating systems (FreeBSD, macOS). No `sudo` required.
Netdata is designed by system administrators, DevOps engineers, and developers to collect everything, help you visualize
metrics, troubleshoot complex performance problems, and make data interoperable with the rest of your monitoring stack.
People get addicted to Netdata. Once you use it on your systems, there's no going back! _You've been warned..._

> **[Latest release](https://github.com/netdata/netdata/releases/latest): v1.28.0, December 18, 2020**
>
> Release v1.28.0 is a hotfix release to address a deadlock in the Netdata Agent. We intended to release this hotfix as
> v1.27.1, but we can't backtrack on a release once we've begun to publish new Docker images and binary packages on
> other platforms.
>
> **v1.27.0, December 17, 2020**
>
> The v1.27.0 release of the Netdata Agent brings dramatic improvements to long-term metrics storage via the database
> engine, and new dashboard features like a time & date picker for visualizing precise timeframes. Two new collectors
> bring incredible new value to existing features, including a bit of machine learning magic.
## Menu
- [Features](#features)
- [Get Netdata](#get-netdata)
- [How it works](#how-it-works)
- [Documentation](#documentation)
- [Community](#community)
- [Contribute](#contribute)
- [License](#license)
- [Is it any good?](#is-it-any-good)
## Features

Here's what you can expect from Netdata:
- **1s granularity**: The highest possible resolution for all metrics.
- **Unlimited metrics**: Netdata collects all the available metrics—the more, the better.
- **1% CPU utilization of a single core**: It's unbelievably optimized.
- **A few MB of RAM**: The highly-efficient database engine stores per-second metrics in RAM and then "spills"
historical metrics to disk long-term storage.
- **Minimal disk I/O**: While running, Netdata only writes historical metrics and reads `error` and `access` logs.
- **Zero configuration**: Netdata auto-detects everything, and can collect up to 10,000 metrics per server out of the
box.
- **Zero maintenance**: You just run it. Netdata does the rest.
- **Stunningly fast, interactive visualizations**: The dashboard responds to queries in less than 1ms per metric to
synchronize charts as you pan through time, zoom in on anomalies, and more.
- **Visual anomaly detection**: Our UI/UX emphasizes the relationships between charts to help you detect the root
cause of anomalies.
- **Scales to infinity**: You can install it on all your servers, containers, VMs, and IoT devices. Metrics are not
centralized by default, so there is no limit.
- **Several operating modes**: Autonomous host monitoring (the default), headless data collector, forwarding proxy,
store and forward proxy, central multi-host monitoring, in all possible configurations. Use different metrics
retention policies per node and run with or without health monitoring.
Netdata works with tons of applications, notifications platforms, and other time-series databases:
- **300+ system, container, and application endpoints**: Collectors autodetect metrics from default endpoints and
immediately visualize them into meaningful charts designed for troubleshooting. See [everything we
support](https://learn.netdata.cloud/docs/agent/collectors/collectors).
- **20+ notification platforms**: Netdata's health watchdog sends warning and critical alarms to your [favorite
platform](https://learn.netdata.cloud/docs/monitor/enable-notifications) to inform you of anomalies just seconds
after they affect your node.
- **30+ external time-series databases**: Export resampled metrics as they're collected to other [local- and
Cloud-based databases](https://learn.netdata.cloud/docs/export/external-databases) for best-in-class
interoperability.
> 💡 **Want to leverage the monitoring power of Netdata across entire infrastructure**? View metrics from
> any number of distributed nodes in a single interface and unlock even more
> [features](https://learn.netdata.cloud/docs/overview/why-netdata) with [Netdata
> Cloud](https://learn.netdata.cloud/docs/overview/what-is-netdata#netdata-cloud).
## Get Netdata
Netdata's **distributed, real-time monitoring Agent** collects thousands of metrics from systems, hardware, containers,
and applications with zero configuration. It runs permanently on all your physical/virtual servers, containers, cloud
deployments, and edge/IoT devices, and is perfectly safe to install on your systems mid-incident without any
preparation.
You can install Netdata on most Linux distributions (Ubuntu, Debian, CentOS, and more), container platforms (Kubernetes
clusters, Docker), and many other operating systems (FreeBSD, macOS). No `sudo` required.
Netdata is designed by system administrators, DevOps engineers, and developers to collect everything, help you visualize
metrics, troubleshoot complex performance problems, and make data interoperable with the rest of your monitoring stack.
People get addicted to Netdata. Once you use it on your systems, there's no going back! _You've been warned..._

> **[Latest release](https://github.com/netdata/netdata/releases/latest): v1.28.0, December 18, 2020**
>
> Release v1.28.0 is a hotfix release to address a deadlock in the Netdata Agent. We intended to release this hotfix as
> v1.27.1, but we can't backtrack on a release once we've begun to publish new Docker images and binary packages on
> other platforms.
>
> **v1.27.0, December 17, 2020**
>
> The v1.27.0 release of the Netdata Agent brings dramatic improvements to long-term metrics storage via the database
> engine, and new dashboard features like a time & date picker for visualizing precise timeframes. Two new collectors
> bring incredible new value to existing features, including a bit of machine learning magic.
## Menu
- [Features](#features)
- [Get Netdata](#get-netdata)
- [How it works](#how-it-works)
- [Documentation](#documentation)
- [Community](#community)
- [Contribute](#contribute)
- [License](#license)
- [Is it any good?](#is-it-any-good)
## Features

Here's what you can expect from Netdata:
- **1s granularity**: The highest possible resolution for all metrics.
- **Unlimited metrics**: Netdata collects all the available metrics—the more, the better.
- **1% CPU utilization of a single core**: It's unbelievably optimized.
- **A few MB of RAM**: The highly-efficient database engine stores per-second metrics in RAM and then "spills"
historical metrics to disk long-term storage.
- **Minimal disk I/O**: While running, Netdata only writes historical metrics and reads `error` and `access` logs.
- **Zero configuration**: Netdata auto-detects everything, and can collect up to 10,000 metrics per server out of the
box.
- **Zero maintenance**: You just run it. Netdata does the rest.
- **Stunningly fast, interactive visualizations**: The dashboard responds to queries in less than 1ms per metric to
synchronize charts as you pan through time, zoom in on anomalies, and more.
- **Visual anomaly detection**: Our UI/UX emphasizes the relationships between charts to help you detect the root
cause of anomalies.
- **Scales to infinity**: You can install it on all your servers, containers, VMs, and IoT devices. Metrics are not
centralized by default, so there is no limit.
- **Several operating modes**: Autonomous host monitoring (the default), headless data collector, forwarding proxy,
store and forward proxy, central multi-host monitoring, in all possible configurations. Use different metrics
retention policies per node and run with or without health monitoring.
Netdata works with tons of applications, notifications platforms, and other time-series databases:
- **300+ system, container, and application endpoints**: Collectors autodetect metrics from default endpoints and
immediately visualize them into meaningful charts designed for troubleshooting. See [everything we
support](https://learn.netdata.cloud/docs/agent/collectors/collectors).
- **20+ notification platforms**: Netdata's health watchdog sends warning and critical alarms to your [favorite
platform](https://learn.netdata.cloud/docs/monitor/enable-notifications) to inform you of anomalies just seconds
after they affect your node.
- **30+ external time-series databases**: Export resampled metrics as they're collected to other [local- and
Cloud-based databases](https://learn.netdata.cloud/docs/export/external-databases) for best-in-class
interoperability.
> 💡 **Want to leverage the monitoring power of Netdata across entire infrastructure**? View metrics from
> any number of distributed nodes in a single interface and unlock even more
> [features](https://learn.netdata.cloud/docs/overview/why-netdata) with [Netdata
> Cloud](https://learn.netdata.cloud/docs/overview/what-is-netdata#netdata-cloud).
## Get Netdata


To install Netdata from source on most Linux systems (physical, virtual, container, IoT, edge), run our [one-line
installation script](https://learn.netdata.cloud/docs/agent/packaging/installer/methods/packages). This script downloads
and builds all dependencies, including those required to connect to [Netdata Cloud](https://netdata.cloud/cloud) if you
choose, and enables [automatic nightly
updates](https://learn.netdata.cloud/docs/agent/packaging/installer#nightly-vs-stable-releases) and [anonymous
statistics](https://learn.netdata.cloud/docs/agent/anonymous-statistics).
```bash
bash <(curl -Ss https://my-netdata.io/kickstart.sh)
```
To view the Netdata dashboard, navigate to `http://localhost:19999`, or `http://NODE:19999`.
### Docker
You can also try out Netdata's capabilities in a [Docker
container](https://learn.netdata.cloud/docs/agent/packaging/docker/):
```bash
docker run -d --name=netdata \
-p 19999:19999 \
-v netdataconfig:/etc/netdata \
-v netdatalib:/var/lib/netdata \
-v netdatacache:/var/cache/netdata \
-v /etc/passwd:/host/etc/passwd:ro \
-v /etc/group:/host/etc/group:ro \
-v /proc:/host/proc:ro \
-v /sys:/host/sys:ro \
-v /etc/os-release:/host/etc/os-release:ro \
--restart unless-stopped \
--cap-add SYS_PTRACE \
--security-opt apparmor=unconfined \
netdata/netdata
```
To view the Netdata dashboard, navigate to `http://localhost:19999`, or `http://NODE:19999`.
### Other operating systems
See our documentation for [additional operating
systems](/packaging/installer/README.md#have-a-different-operating-system-or-want-to-try-another-method), including
[Kubernetes](/packaging/installer/methods/kubernetes.md), [`.deb`/`.rpm`
packages](/packaging/installer/methods/packages.md), and more.
### Post-installation
When you're finished with installation, check out our [single-node](/docs/quickstart/single-node.md) or
[infrastructure](/docs/quickstart/infrastructure.md) monitoring quickstart guides based on your use case.
Or, skip straight to [configuring the Netdata Agent](/docs/configure/nodes.md).
Read through Netdata's [documentation](https://learn.netdata.cloud/docs), which is structured based on actions and
solutions, to enable features like health monitoring, alarm notifications, long-term metrics storage, exporting to
external databases, and more.
## How it works
Netdata is a highly efficient, highly modular, metrics management engine. Its lockless design makes it ideal for
concurrent operations on the metrics.

The result is a highly efficient, low-latency system, supporting multiple readers and one writer on each metric.
## Infographic
This is a high-level overview of Netdata features and architecture. Click on it to view an interactive version, which
has links to our documentation.
[](https://my-netdata.io/infographic.html)
## Documentation
Netdata's documentation is available at [**Netdata Learn**](https://learn.netdata.cloud).
This site also hosts a number of [guides](https://learn.netdata.cloud/guides) to help newer users better understand how
to collect metrics, troubleshoot via charts, export to external databases, and more.
## Community
You can find most of the Netdata team in our [community forum](https://community.netdata.cloud). It's the best place to
ask questions, find resources, and get to know the Netdata team.
You can also find Netdata on:
- [Facebook](https://www.facebook.com/linuxnetdata/)
- [Twitter](https://twitter.com/linuxnetdata)
- [StackShare](https://stackshare.io/netdata)
- [Product Hunt](https://www.producthunt.com/posts/netdata-monitoring-agent/)
- [Repology](https://repology.org/metapackage/netdata/versions)
## Contribute
We welcome [contributions](/CONTRIBUTING.md) to our code and to our
[documentation](/docs/contributing/contributing-documentation.md). Feel free to join the team!
To report bugs or get help, use [GitHub's issues](https://github.com/netdata/netdata/issues).
Package maintainers should read the guide on [building Netdata from source](/packaging/installer/methods/source.md) for
instructions on building each Netdata component from source and preparing a package.
## License
The Netdata Agent is [GPLv3+](/LICENSE). Netdata re-distributes other open-source tools and libraries. Please check the
[third party licenses](/REDISTRIBUTED.md).
## Is it any good?
Yes.
_When people first hear about a new product, they frequently ask if it is any good. A Hacker News user
[remarked](https://news.ycombinator.com/item?id=3067434):_
> Note to self: Starting immediately, all raganwald projects will have a “Is it any good?” section in the readme, and
> the answer shall be “yes.".
So, we follow the tradition...

 Netdata's **distributed, real-time monitoring Agent** collects thousands of metrics from systems, hardware, containers,
and applications with zero configuration. It runs permanently on all your physical/virtual servers, containers, cloud
deployments, and edge/IoT devices, and is perfectly safe to install on your systems mid-incident without any
preparation.
You can install Netdata on most Linux distributions (Ubuntu, Debian, CentOS, and more), container platforms (Kubernetes
clusters, Docker), and many other operating systems (FreeBSD, macOS). No `sudo` required.
Netdata is designed by system administrators, DevOps engineers, and developers to collect everything, help you visualize
metrics, troubleshoot complex performance problems, and make data interoperable with the rest of your monitoring stack.
People get addicted to Netdata. Once you use it on your systems, there's no going back! _You've been warned..._

> **[Latest release](https://github.com/netdata/netdata/releases/latest): v1.28.0, December 18, 2020**
>
> Release v1.28.0 is a hotfix release to address a deadlock in the Netdata Agent. We intended to release this hotfix as
> v1.27.1, but we can't backtrack on a release once we've begun to publish new Docker images and binary packages on
> other platforms.
>
> **v1.27.0, December 17, 2020**
>
> The v1.27.0 release of the Netdata Agent brings dramatic improvements to long-term metrics storage via the database
> engine, and new dashboard features like a time & date picker for visualizing precise timeframes. Two new collectors
> bring incredible new value to existing features, including a bit of machine learning magic.
## Menu
- [Features](#features)
- [Get Netdata](#get-netdata)
- [How it works](#how-it-works)
- [Documentation](#documentation)
- [Community](#community)
- [Contribute](#contribute)
- [License](#license)
- [Is it any good?](#is-it-any-good)
## Features

Here's what you can expect from Netdata:
- **1s granularity**: The highest possible resolution for all metrics.
- **Unlimited metrics**: Netdata collects all the available metrics—the more, the better.
- **1% CPU utilization of a single core**: It's unbelievably optimized.
- **A few MB of RAM**: The highly-efficient database engine stores per-second metrics in RAM and then "spills"
historical metrics to disk long-term storage.
- **Minimal disk I/O**: While running, Netdata only writes historical metrics and reads `error` and `access` logs.
- **Zero configuration**: Netdata auto-detects everything, and can collect up to 10,000 metrics per server out of the
box.
- **Zero maintenance**: You just run it. Netdata does the rest.
- **Stunningly fast, interactive visualizations**: The dashboard responds to queries in less than 1ms per metric to
synchronize charts as you pan through time, zoom in on anomalies, and more.
- **Visual anomaly detection**: Our UI/UX emphasizes the relationships between charts to help you detect the root
cause of anomalies.
- **Scales to infinity**: You can install it on all your servers, containers, VMs, and IoT devices. Metrics are not
centralized by default, so there is no limit.
- **Several operating modes**: Autonomous host monitoring (the default), headless data collector, forwarding proxy,
store and forward proxy, central multi-host monitoring, in all possible configurations. Use different metrics
retention policies per node and run with or without health monitoring.
Netdata works with tons of applications, notifications platforms, and other time-series databases:
- **300+ system, container, and application endpoints**: Collectors autodetect metrics from default endpoints and
immediately visualize them into meaningful charts designed for troubleshooting. See [everything we
support](https://learn.netdata.cloud/docs/agent/collectors/collectors).
- **20+ notification platforms**: Netdata's health watchdog sends warning and critical alarms to your [favorite
platform](https://learn.netdata.cloud/docs/monitor/enable-notifications) to inform you of anomalies just seconds
after they affect your node.
- **30+ external time-series databases**: Export resampled metrics as they're collected to other [local- and
Cloud-based databases](https://learn.netdata.cloud/docs/export/external-databases) for best-in-class
interoperability.
> 💡 **Want to leverage the monitoring power of Netdata across entire infrastructure**? View metrics from
> any number of distributed nodes in a single interface and unlock even more
> [features](https://learn.netdata.cloud/docs/overview/why-netdata) with [Netdata
> Cloud](https://learn.netdata.cloud/docs/overview/what-is-netdata#netdata-cloud).
## Get Netdata
To install Netdata from source on most Linux systems (physical, virtual, container, IoT, edge), run our [one-line
installation script](https://learn.netdata.cloud/docs/agent/packaging/installer/methods/packages). This script downloads
and builds all dependencies, including those required to connect to [Netdata Cloud](https://netdata.cloud/cloud) if you
choose, and enables [automatic nightly
updates](https://learn.netdata.cloud/docs/agent/packaging/installer#nightly-vs-stable-releases) and [anonymous
statistics](https://learn.netdata.cloud/docs/agent/anonymous-statistics).
```bash
bash <(curl -Ss https://my-netdata.io/kickstart.sh)
```
To view the Netdata dashboard, navigate to `http://localhost:19999`, or `http://NODE:19999`.
### Docker
You can also try out Netdata's capabilities in a [Docker
container](https://learn.netdata.cloud/docs/agent/packaging/docker/):
```bash
docker run -d --name=netdata \
-p 19999:19999 \
-v netdataconfig:/etc/netdata \
-v netdatalib:/var/lib/netdata \
-v netdatacache:/var/cache/netdata \
-v /etc/passwd:/host/etc/passwd:ro \
-v /etc/group:/host/etc/group:ro \
-v /proc:/host/proc:ro \
-v /sys:/host/sys:ro \
-v /etc/os-release:/host/etc/os-release:ro \
--restart unless-stopped \
--cap-add SYS_PTRACE \
--security-opt apparmor=unconfined \
netdata/netdata
```
To view the Netdata dashboard, navigate to `http://localhost:19999`, or `http://NODE:19999`.
### Other operating systems
See our documentation for [additional operating
systems](/packaging/installer/README.md#have-a-different-operating-system-or-want-to-try-another-method), including
[Kubernetes](/packaging/installer/methods/kubernetes.md), [`.deb`/`.rpm`
packages](/packaging/installer/methods/packages.md), and more.
### Post-installation
When you're finished with installation, check out our [single-node](/docs/quickstart/single-node.md) or
[infrastructure](/docs/quickstart/infrastructure.md) monitoring quickstart guides based on your use case.
Or, skip straight to [configuring the Netdata Agent](/docs/configure/nodes.md).
Read through Netdata's [documentation](https://learn.netdata.cloud/docs), which is structured based on actions and
solutions, to enable features like health monitoring, alarm notifications, long-term metrics storage, exporting to
external databases, and more.
## How it works
Netdata is a highly efficient, highly modular, metrics management engine. Its lockless design makes it ideal for
concurrent operations on the metrics.

The result is a highly efficient, low-latency system, supporting multiple readers and one writer on each metric.
## Infographic
This is a high-level overview of Netdata features and architecture. Click on it to view an interactive version, which
has links to our documentation.
[](https://my-netdata.io/infographic.html)
## Documentation
Netdata's documentation is available at [**Netdata Learn**](https://learn.netdata.cloud).
This site also hosts a number of [guides](https://learn.netdata.cloud/guides) to help newer users better understand how
to collect metrics, troubleshoot via charts, export to external databases, and more.
## Community
You can find most of the Netdata team in our [community forum](https://community.netdata.cloud). It's the best place to
ask questions, find resources, and get to know the Netdata team.
You can also find Netdata on:
- [Facebook](https://www.facebook.com/linuxnetdata/)
- [Twitter](https://twitter.com/linuxnetdata)
- [StackShare](https://stackshare.io/netdata)
- [Product Hunt](https://www.producthunt.com/posts/netdata-monitoring-agent/)
- [Repology](https://repology.org/metapackage/netdata/versions)
## Contribute
We welcome [contributions](/CONTRIBUTING.md) to our code and to our
[documentation](/docs/contributing/contributing-documentation.md). Feel free to join the team!
To report bugs or get help, use [GitHub's issues](https://github.com/netdata/netdata/issues).
Package maintainers should read the guide on [building Netdata from source](/packaging/installer/methods/source.md) for
instructions on building each Netdata component from source and preparing a package.
## License
The Netdata Agent is [GPLv3+](/LICENSE). Netdata re-distributes other open-source tools and libraries. Please check the
[third party licenses](/REDISTRIBUTED.md).
## Is it any good?
Yes.
_When people first hear about a new product, they frequently ask if it is any good. A Hacker News user
[remarked](https://news.ycombinator.com/item?id=3067434):_
> Note to self: Starting immediately, all raganwald projects will have a “Is it any good?” section in the readme, and
> the answer shall be “yes.".
So, we follow the tradition...
Netdata's **distributed, real-time monitoring Agent** collects thousands of metrics from systems, hardware, containers,
and applications with zero configuration. It runs permanently on all your physical/virtual servers, containers, cloud
deployments, and edge/IoT devices, and is perfectly safe to install on your systems mid-incident without any
preparation.
You can install Netdata on most Linux distributions (Ubuntu, Debian, CentOS, and more), container platforms (Kubernetes
clusters, Docker), and many other operating systems (FreeBSD, macOS). No `sudo` required.
Netdata is designed by system administrators, DevOps engineers, and developers to collect everything, help you visualize
metrics, troubleshoot complex performance problems, and make data interoperable with the rest of your monitoring stack.
People get addicted to Netdata. Once you use it on your systems, there's no going back! _You've been warned..._

> **[Latest release](https://github.com/netdata/netdata/releases/latest): v1.28.0, December 18, 2020**
>
> Release v1.28.0 is a hotfix release to address a deadlock in the Netdata Agent. We intended to release this hotfix as
> v1.27.1, but we can't backtrack on a release once we've begun to publish new Docker images and binary packages on
> other platforms.
>
> **v1.27.0, December 17, 2020**
>
> The v1.27.0 release of the Netdata Agent brings dramatic improvements to long-term metrics storage via the database
> engine, and new dashboard features like a time & date picker for visualizing precise timeframes. Two new collectors
> bring incredible new value to existing features, including a bit of machine learning magic.
## Menu
- [Features](#features)
- [Get Netdata](#get-netdata)
- [How it works](#how-it-works)
- [Documentation](#documentation)
- [Community](#community)
- [Contribute](#contribute)
- [License](#license)
- [Is it any good?](#is-it-any-good)
## Features

Here's what you can expect from Netdata:
- **1s granularity**: The highest possible resolution for all metrics.
- **Unlimited metrics**: Netdata collects all the available metrics—the more, the better.
- **1% CPU utilization of a single core**: It's unbelievably optimized.
- **A few MB of RAM**: The highly-efficient database engine stores per-second metrics in RAM and then "spills"
historical metrics to disk long-term storage.
- **Minimal disk I/O**: While running, Netdata only writes historical metrics and reads `error` and `access` logs.
- **Zero configuration**: Netdata auto-detects everything, and can collect up to 10,000 metrics per server out of the
box.
- **Zero maintenance**: You just run it. Netdata does the rest.
- **Stunningly fast, interactive visualizations**: The dashboard responds to queries in less than 1ms per metric to
synchronize charts as you pan through time, zoom in on anomalies, and more.
- **Visual anomaly detection**: Our UI/UX emphasizes the relationships between charts to help you detect the root
cause of anomalies.
- **Scales to infinity**: You can install it on all your servers, containers, VMs, and IoT devices. Metrics are not
centralized by default, so there is no limit.
- **Several operating modes**: Autonomous host monitoring (the default), headless data collector, forwarding proxy,
store and forward proxy, central multi-host monitoring, in all possible configurations. Use different metrics
retention policies per node and run with or without health monitoring.
Netdata works with tons of applications, notifications platforms, and other time-series databases:
- **300+ system, container, and application endpoints**: Collectors autodetect metrics from default endpoints and
immediately visualize them into meaningful charts designed for troubleshooting. See [everything we
support](https://learn.netdata.cloud/docs/agent/collectors/collectors).
- **20+ notification platforms**: Netdata's health watchdog sends warning and critical alarms to your [favorite
platform](https://learn.netdata.cloud/docs/monitor/enable-notifications) to inform you of anomalies just seconds
after they affect your node.
- **30+ external time-series databases**: Export resampled metrics as they're collected to other [local- and
Cloud-based databases](https://learn.netdata.cloud/docs/export/external-databases) for best-in-class
interoperability.
> 💡 **Want to leverage the monitoring power of Netdata across entire infrastructure**? View metrics from
> any number of distributed nodes in a single interface and unlock even more
> [features](https://learn.netdata.cloud/docs/overview/why-netdata) with [Netdata
> Cloud](https://learn.netdata.cloud/docs/overview/what-is-netdata#netdata-cloud).
## Get Netdata
To install Netdata from source on most Linux systems (physical, virtual, container, IoT, edge), run our [one-line
installation script](https://learn.netdata.cloud/docs/agent/packaging/installer/methods/packages). This script downloads
and builds all dependencies, including those required to connect to [Netdata Cloud](https://netdata.cloud/cloud) if you
choose, and enables [automatic nightly
updates](https://learn.netdata.cloud/docs/agent/packaging/installer#nightly-vs-stable-releases) and [anonymous
statistics](https://learn.netdata.cloud/docs/agent/anonymous-statistics).
```bash
bash <(curl -Ss https://my-netdata.io/kickstart.sh)
```
To view the Netdata dashboard, navigate to `http://localhost:19999`, or `http://NODE:19999`.
### Docker
You can also try out Netdata's capabilities in a [Docker
container](https://learn.netdata.cloud/docs/agent/packaging/docker/):
```bash
docker run -d --name=netdata \
-p 19999:19999 \
-v netdataconfig:/etc/netdata \
-v netdatalib:/var/lib/netdata \
-v netdatacache:/var/cache/netdata \
-v /etc/passwd:/host/etc/passwd:ro \
-v /etc/group:/host/etc/group:ro \
-v /proc:/host/proc:ro \
-v /sys:/host/sys:ro \
-v /etc/os-release:/host/etc/os-release:ro \
--restart unless-stopped \
--cap-add SYS_PTRACE \
--security-opt apparmor=unconfined \
netdata/netdata
```
To view the Netdata dashboard, navigate to `http://localhost:19999`, or `http://NODE:19999`.
### Other operating systems
See our documentation for [additional operating
systems](/packaging/installer/README.md#have-a-different-operating-system-or-want-to-try-another-method), including
[Kubernetes](/packaging/installer/methods/kubernetes.md), [`.deb`/`.rpm`
packages](/packaging/installer/methods/packages.md), and more.
### Post-installation
When you're finished with installation, check out our [single-node](/docs/quickstart/single-node.md) or
[infrastructure](/docs/quickstart/infrastructure.md) monitoring quickstart guides based on your use case.
Or, skip straight to [configuring the Netdata Agent](/docs/configure/nodes.md).
Read through Netdata's [documentation](https://learn.netdata.cloud/docs), which is structured based on actions and
solutions, to enable features like health monitoring, alarm notifications, long-term metrics storage, exporting to
external databases, and more.
## How it works
Netdata is a highly efficient, highly modular, metrics management engine. Its lockless design makes it ideal for
concurrent operations on the metrics.

The result is a highly efficient, low-latency system, supporting multiple readers and one writer on each metric.
## Infographic
This is a high-level overview of Netdata features and architecture. Click on it to view an interactive version, which
has links to our documentation.
[](https://my-netdata.io/infographic.html)
## Documentation
Netdata's documentation is available at [**Netdata Learn**](https://learn.netdata.cloud).
This site also hosts a number of [guides](https://learn.netdata.cloud/guides) to help newer users better understand how
to collect metrics, troubleshoot via charts, export to external databases, and more.
## Community
You can find most of the Netdata team in our [community forum](https://community.netdata.cloud). It's the best place to
ask questions, find resources, and get to know the Netdata team.
You can also find Netdata on:
- [Facebook](https://www.facebook.com/linuxnetdata/)
- [Twitter](https://twitter.com/linuxnetdata)
- [StackShare](https://stackshare.io/netdata)
- [Product Hunt](https://www.producthunt.com/posts/netdata-monitoring-agent/)
- [Repology](https://repology.org/metapackage/netdata/versions)
## Contribute
We welcome [contributions](/CONTRIBUTING.md) to our code and to our
[documentation](/docs/contributing/contributing-documentation.md). Feel free to join the team!
To report bugs or get help, use [GitHub's issues](https://github.com/netdata/netdata/issues).
Package maintainers should read the guide on [building Netdata from source](/packaging/installer/methods/source.md) for
instructions on building each Netdata component from source and preparing a package.
## License
The Netdata Agent is [GPLv3+](/LICENSE). Netdata re-distributes other open-source tools and libraries. Please check the
[third party licenses](/REDISTRIBUTED.md).
## Is it any good?
Yes.
_When people first hear about a new product, they frequently ask if it is any good. A Hacker News user
[remarked](https://news.ycombinator.com/item?id=3067434):_
> Note to self: Starting immediately, all raganwald projects will have a “Is it any good?” section in the readme, and
> the answer shall be “yes.".
So, we follow the tradition...