# Monitor CockroachDB metrics with Netdata
[CockroachDB](https://github.com/cockroachdb/cockroach) is an open-source project that brings SQL databases into
scalable, disaster-resilient cloud deployments. Thanks to a [new CockroachDB
collector](https://learn.netdata.cloud/docs/agent/collectors/go.d.plugin/modules/cockroachdb/) released in
[v1.20](https://blog.netdata.cloud/posts/release-1.20/), you can now monitor any number of CockroachDB databases with
maximum granularity using Netdata. Collect more than 50 unique metrics and put them on interactive visualizations
designed for better visual anomaly detection.
Netdata itself uses CockroachDB as part of its Netdata Cloud infrastructure, so we're happy to introduce this new
collector and help others get started with it straightaway.
Let's dive in and walk through the process of monitoring CockroachDB metrics with Netdata.
## What's in this guide
- [Configure the CockroachDB collector](#configure-the-cockroachdb-collector)
- [Manual setup for a local CockroachDB database](#manual-setup-for-a-local-cockroachdb-database)
- [Tweak CockroachDB alarms](#tweak-cockroachdb-alarms)
## Configure the CockroachDB collector
Because _all_ of Netdata's collectors can auto-detect the services they monitor, you _shouldn't_ need to worry about
configuring CockroachDB. Netdata only needs to regularly query the database's `_status/vars` page to gather metrics and
display them on the dashboard.
If your CockroachDB instance is accessible through `http://localhost:8080/` or `http://127.0.0.1:8080`, your setup is
complete. Restart Netdata with `service netdata restart`, or use the [appropriate
method](../getting-started.md#start-stop-and-restart-netdata) for your system, and refresh your browser. You should see
CockroachDB metrics in your Netdata dashboard!
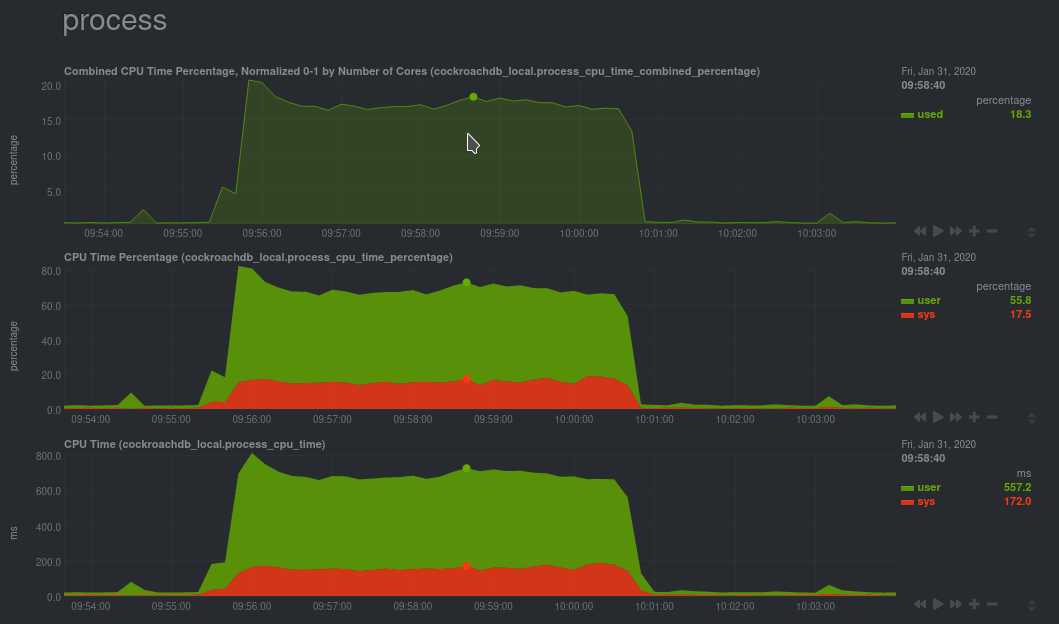
CPU utilization charts from a CockroachDB database monitored by Netdata
> Note: Netdata collects metrics from CockroachDB every 10 seconds, instead of our usual 1 second, because CockroachDB
> only updates `_status/vars` every 10 seconds. You can't change this setting in CockroachDB.
If you don't see CockroachDB charts, you may need to configure the collector manually.
### Manual setup for a local CockroachDB database
To configure Netdata's CockroachDB collector, navigate to your Netdata configuration directory (typically at
`/etc/netdata/`) and use `edit-config` to initialize and edit your CockroachDB configuration file.
```bash
cd /etc/netdata/ # Replace with your Netdata configuration directory, if not /etc/netdata/
./edit-config go.d/cockroachdb.conf
```
Scroll down to the `[JOBS]` section at the bottom of the file. You will see the two default jobs there, which you can
edit, or create a new job with any of the parameters listed above in the file. Both the `name` and `url` values are
required, and everything else is optional.
For a production cluster, you'll use either an IP address or the system's hostname. Be sure that your remote system
allows TCP communication on port 8080, or whichever port you have configured CockroachDB's [Admin
UI](https://www.cockroachlabs.com/docs/stable/monitoring-and-alerting.html#prometheus-endpoint) to listen on.
```yaml
# [ JOBS ]
jobs:
- name: remote
url: http://203.0.113.0:8080/_status/vars
- name: remote_hostname
url: http://cockroachdb.example.com:8080/_status/vars
```
For a secure cluster, use `https` in the `url` field instead.
```yaml
# [ JOBS ]
jobs:
- name: remote
url: https://203.0.113.0:8080/_status/vars
tls_skip_verify: yes # If your certificate is self-signed
- name: remote_hostname
url: https://cockroachdb.example.com:8080/_status/vars
tls_skip_verify: yes # If your certificate is self-signed
```
You can add as many jobs as you'd like based on how many CockroachDB databases you have—Netdata will create separate
charts for each job. Once you've edited `cockroachdb.conf` according to the needs of your infrastructure, restart
Netdata to see your new charts.
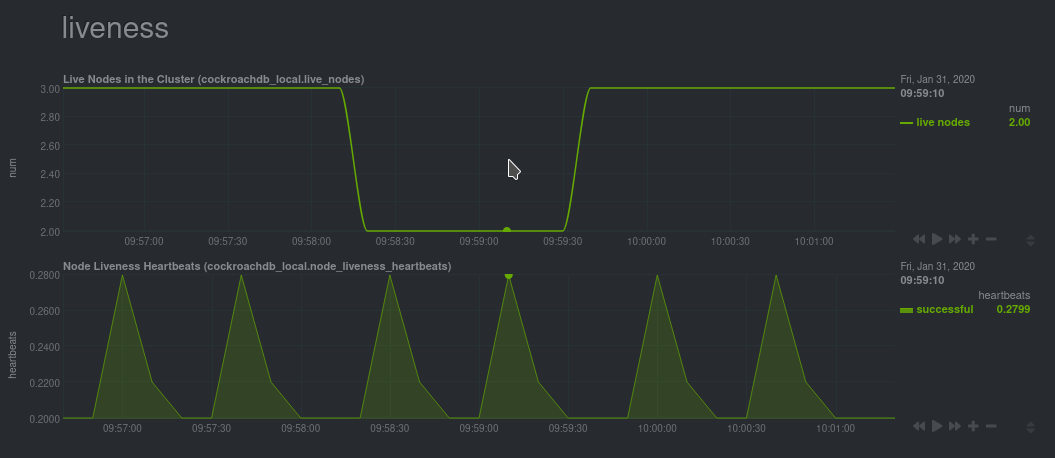
Charts showing a node failure during a simulated test
## Tweak CockroachDB alarms
This release also includes eight pre-configured alarms for live nodes, such as whether the node is live, storage
capacity, issues with replication, and the number of SQL connections/statements. See [health.d/cockroachdb.conf on
GitHub](https://raw.githubusercontent.com/netdata/netdata/master/health/health.d/cockroachdb.conf) for details.
You can also edit these files directly with `edit-config`:
```bash
cd /etc/netdata/ # Replace with your Netdata configuration directory, if not /etc/netdata/
./edit-config health.d/cockroachdb.conf # You may need to use `sudo` for write privileges
```
For more information about editing the defaults or writing new alarm entities, see our health monitoring [quickstart
guide](/health/QUICKSTART.md).
## What's next?
Now that you're collecting metrics from your CockroachDB databases, let us know how it's working for you! There's always
room for improvement or refinement based on real-world use cases. Feel free to [file an
issue](https://github.com/netdata/netdata/issues/new?labels=bug%2C+needs+triage&template=bug_report.md) with your
thoughts.
Also, be sure to check out these useful resources:
- [Netdata's CockroachDB
documentation](https://learn.netdata.cloud/docs/agent/collectors/go.d.plugin/modules/cockroachdb/)
- [Netdata's CockroachDB
configuration](https://github.com/netdata/go.d.plugin/blob/master/config/go.d/cockroachdb.conf)
- [Netdata's CockroachDB
alarms](https://github.com/netdata/netdata/blob/29d9b5e51603792ee27ef5a21f1de0ba8e130158/health/health.d/cockroachdb.conf)
- [CockroachDB homepage](https://www.cockroachlabs.com/product/)
- [CockroachDB documentation](https://www.cockroachlabs.com/docs/stable/)
- [`_status/vars` endpoint
docs](https://www.cockroachlabs.com/docs/stable/monitoring-and-alerting.html#prometheus-endpoint)
- [Monitor CockroachDB with
Prometheus](https://www.cockroachlabs.com/docs/stable/monitor-cockroachdb-with-prometheus.html)
[](<>)