1
2
3
4
5
6
7
8
9
10
11
12
13
14
15
16
17
18
19
20
21
22
23
24
25
26
27
28
29
30
31
32
33
34
35
36
37
38
39
40
41
42
43
44
45
46
47
48
49
50
51
52
53
54
55
56
57
58
59
60
61
62
63
64
65
66
67
68
69
70
71
72
73
74
75
76
77
78
79
80
81
82
83
|
---
title: "Import, export, and print a snapshot"
description: "Snapshots can be incredibly useful for diagnosing anomalies after they've already happened, and are interoperable with any other node running Netdata."
type: how-to
custom_edit_url: https://github.com/netdata/netdata/edit/master/docs/dashboard/import-export-print-snapshot.mdx
---
# Import, export, and print snapshots
Netdata can export snapshots of the contents of your dashboard at a given time, which you can then import into any other
node running Netdata. Or, you can create a print-ready version of your dashboard to save to PDF or actually print to
paper.
Snapshots can be incredibly useful for diagnosing anomalies after they've already happened. Let's say Netdata triggered
a warning alarm while you were asleep. In the morning, you can [pick the
timeframe](/docs/dashboard/visualization-date-and-time-controls.mdx) when the alarm triggered, export a snapshot, and send it to a
colleague for further analysis.
Or, send the Netdata team a snapshot of your dashboard when [filing a bug
report](https://github.com/netdata/netdata/issues/new?assignees=&labels=bug%2Cneeds+triage&template=BUG_REPORT.yml) on
GitHub.

## Import a snapshot
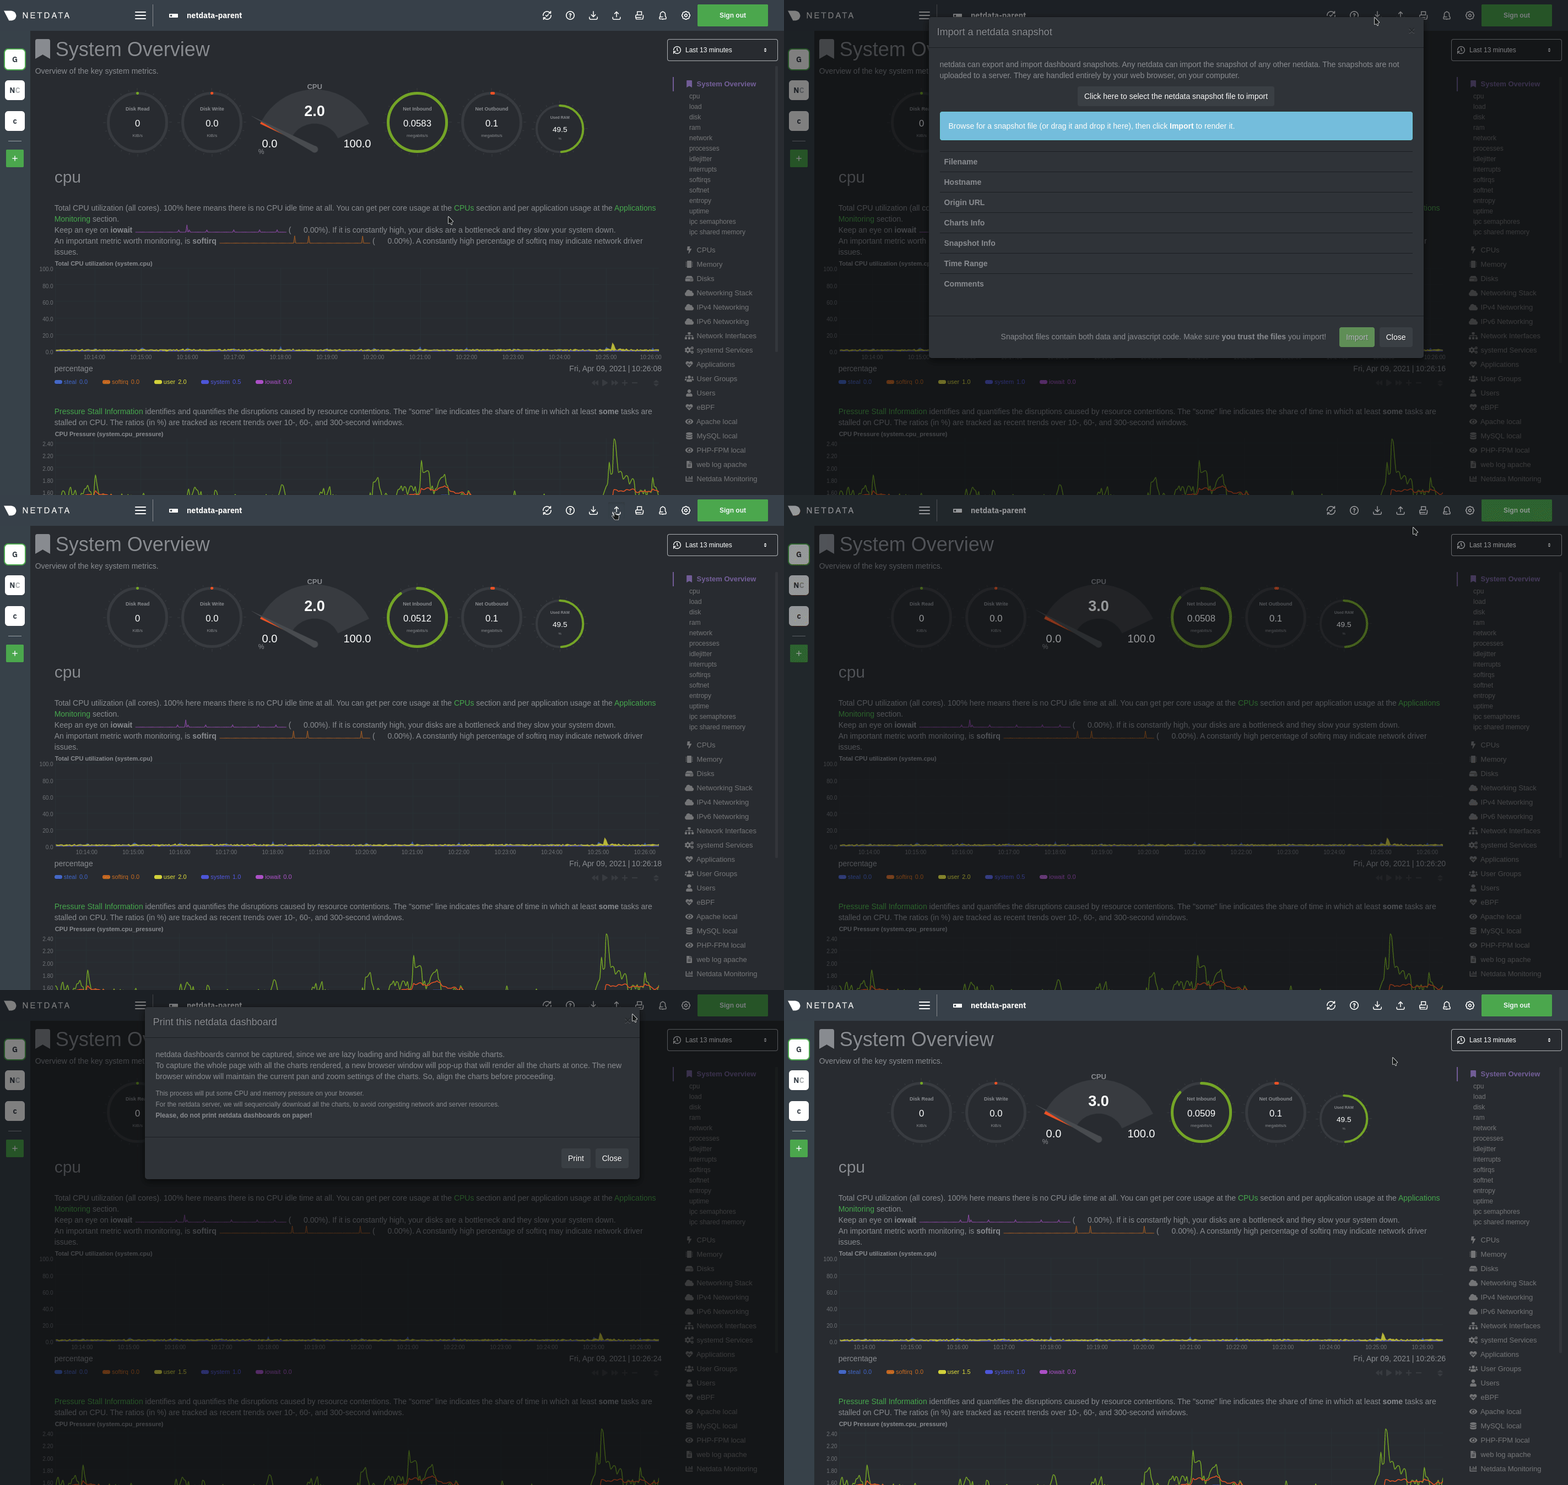
To import a snapshot, click on the **import** icon 
in the top panel.
Select the Netdata snapshot file to import. Once the file is loaded, the modal updates with information about the
snapshot and the system from which it was taken. Click **Import** to begin to process.
Netdata takes the data embedded inside the snapshot and re-creates a static replica on your dashboard. When the import
finishes, you're free to move around and examine the charts.
Some caveats and tips to keep in mind:
- Only metrics in the export timeframe are available to you. If you zoom out or pan through time, you'll see the
beginning and end of the snapshot.
- Charts won't update with new information, as you're looking at a static replica, not the live dashboard.
- The import is only temporary. Reload your browser tab to return to your node's real-time dashboard.
## Export a snapshot
To export a snapshot, first pan/zoom any chart to an appropriate _visible timeframe_. The export snapshot will only
contain the metrics you see in charts, so choose the most relevant timeframe.
Next, click on the **export** icon 
in the top panel.
Select the metrics resolution to export. The default is 1-second, equal to how often Netdata collects and stores
metrics. Lowering the resolution will reduce the number of data points, and thus the snapshot's overall size.
Edit the snapshot file name and select your desired compression method. Click on **Export**. When the export is
complete, your browser will prompt you to save the `.snapshot` file to your machine.
## Print a snapshot
To print a snapshot, click on the **print** icon 
in the top panel.
When you click **Print**, Netdata opens a new window to render every chart. This might take some time. When finished,
Netdata opens a browser print dialog for you to save to PDF or print.
## What's next?
Now that you understand snapshots, now is a good time to delve deeper into some of the dashboard's lesser-known
features, such as [customization](/docs/dashboard/customize.mdx) or [building new, custom
dashboards](/web/gui/custom/README.md).
### Further reading & related information
- Dashboard
- [How the dashboard works](/docs/dashboard/how-dashboard-works.mdx)
- [Interact with charts](/docs/dashboard/interact-charts.mdx)
- [Chart dimensions, contexts, and families](/docs/dashboard/dimensions-contexts-families.mdx)
- [Select timeframes to visualize](/docs/dashboard/visualization-date-and-time-controls.mdx)
- **[Import, export, and print a snapshot](/docs/dashboard/import-export-print-snapshot.mdx)**
- [Customize the standard dashboard](/docs/dashboard/customize.mdx)
|
