
diff options
| author | Daniel Baumann <daniel.baumann@progress-linux.org> | 2024-05-04 14:31:17 +0000 |
|---|---|---|
| committer | Daniel Baumann <daniel.baumann@progress-linux.org> | 2024-05-04 14:31:17 +0000 |
| commit | 8020f71afd34d7696d7933659df2d763ab05542f (patch) | |
| tree | 2fdf1b5447ffd8bdd61e702ca183e814afdcb4fc /docs/visualize/overview-infrastructure.md | |
| parent | Initial commit. (diff) | |
| download | netdata-upstream.tar.xz netdata-upstream.zip | |
Adding upstream version 1.37.1.upstream/1.37.1upstream
Signed-off-by: Daniel Baumann <daniel.baumann@progress-linux.org>
Diffstat (limited to 'docs/visualize/overview-infrastructure.md')
| -rw-r--r-- | docs/visualize/overview-infrastructure.md | 111 |
1 files changed, 111 insertions, 0 deletions
diff --git a/docs/visualize/overview-infrastructure.md b/docs/visualize/overview-infrastructure.md new file mode 100644 index 0000000..4edbb0f --- /dev/null +++ b/docs/visualize/overview-infrastructure.md @@ -0,0 +1,111 @@ +<!-- +title: "See an overview of your infrastructure" +description: "With Netdata Cloud's War Rooms, you can see real-time metrics, from any number of nodes in your infrastructure, in composite charts." +custom_edit_url: https://github.com/netdata/netdata/edit/master/docs/visualize/overview-infrastructure.md +--> + +# See an overview of your infrastructure + +In Netdata Cloud, your nodes are organized into War Rooms. One of the two available views for a War Room is the +[**Overview**](https://learn.netdata.cloud/docs/cloud/visualize/overview), which uses composite charts to display +real-time, aggregated metrics from all the nodes (or a filtered selection) in a given War Room. + +With Overview's composite charts, you can see your infrastructure from a single pane of glass, discover trends or +anomalies, then drill down with filtering or single-node dashboards to see more. In the screenshot below, +each chart visualizes average or sum metrics values from across 5 distributed nodes. + +Netdata also supports robust Kubernetes monitoring using the Overview. Read our [deployment +doc](/packaging/installer/methods/kubernetes.md) for details on visualizing Kubernetes metrics in Netdata Cloud. + +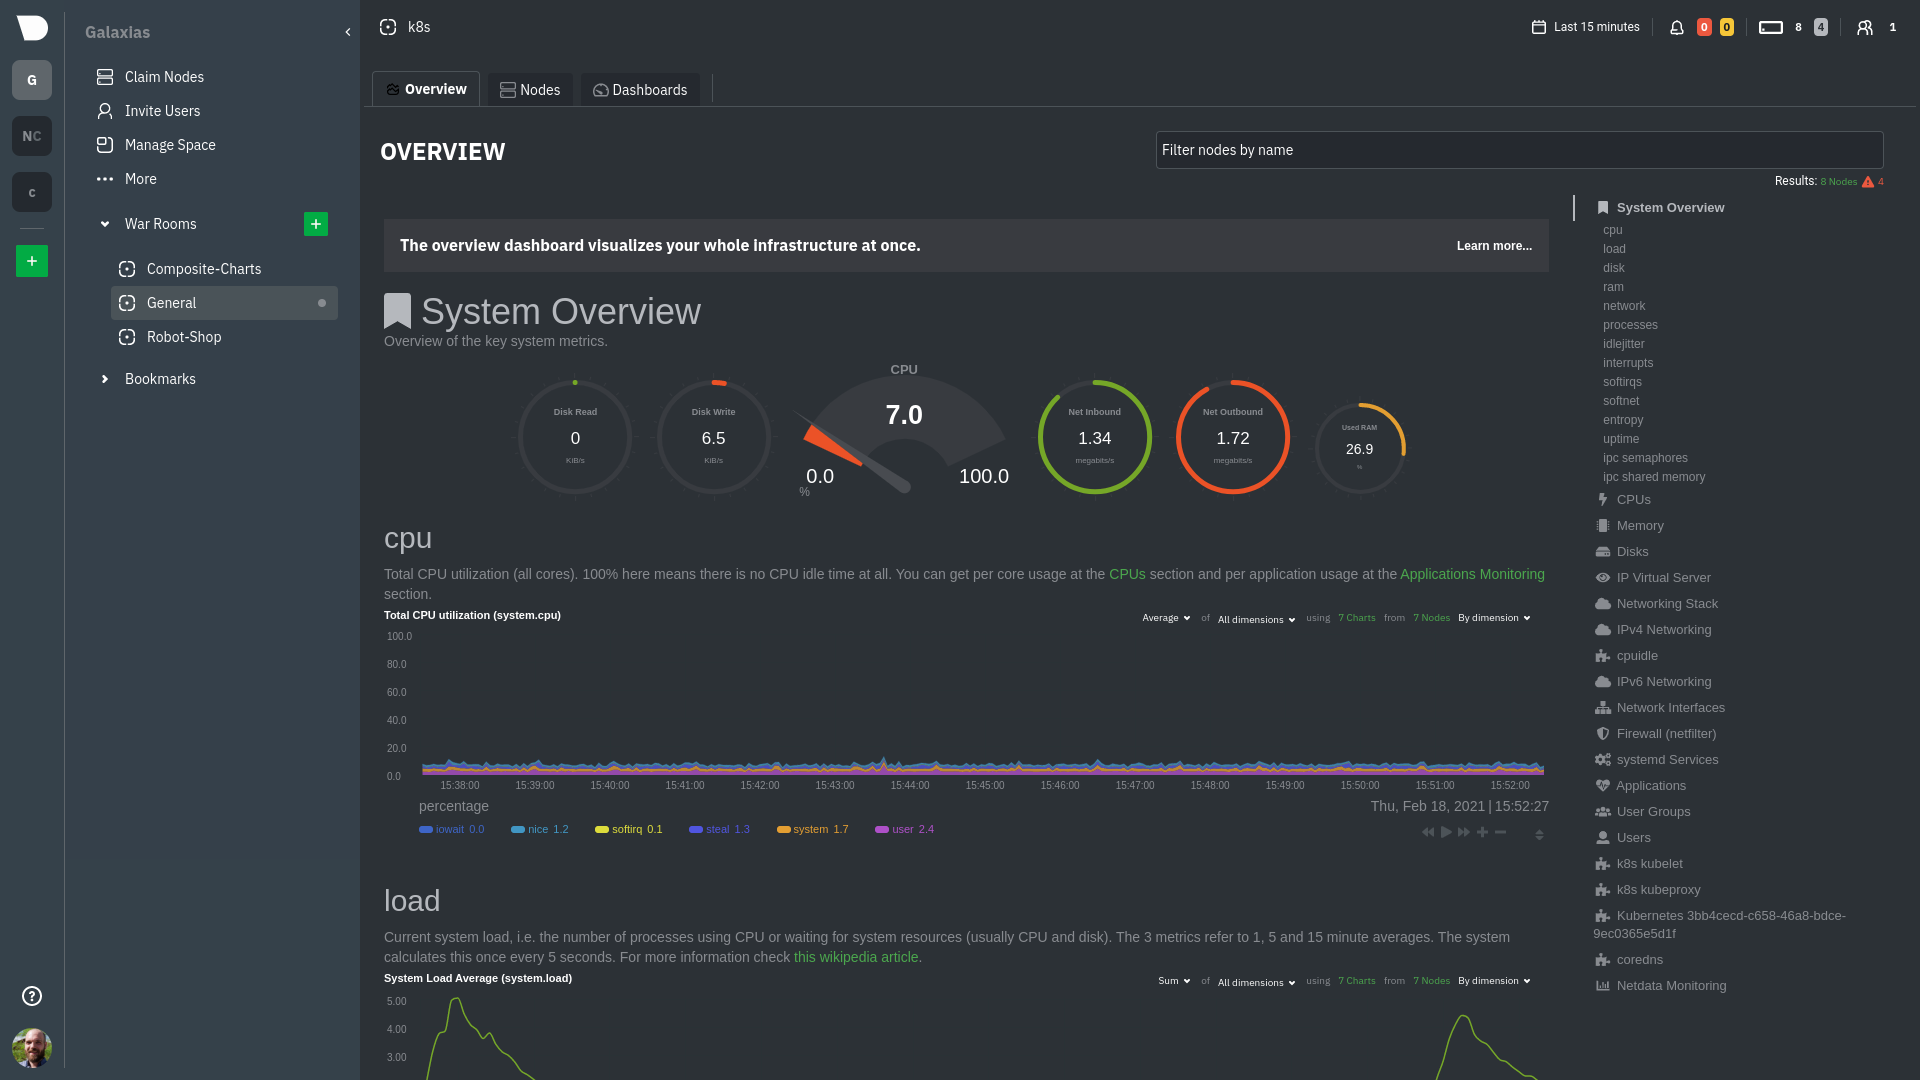 + +## Using the Overview + +The Overview uses roughly the same interface as local Agent dashboards or single-node dashboards in Netdata Cloud. By +showing all available metrics from all your nodes in a single interface, Netdata Cloud helps you visualize the overall +health of your infrastructure. Best of all, you don't have to worry about creating your own dashboards just to get +started with infrastructure monitoring. + +Let's walk through some examples of using the Overview to monitor and troubleshoot your infrastructure. + +### Filter nodes and pick relevant times + +While not exclusive to Overview, you can use two important features, [node +filtering](https://learn.netdata.cloud/docs/cloud/war-rooms#node-filter) and the [time & date +picker](https://learn.netdata.cloud/docs/cloud/war-rooms#time--date-picker), to widen or narrow your infrastructure +monitoring focus. + +By default, the Overview shows composite charts aggregated from every node in the War Room, but you can change that +behavior on an ad-hoc basis. The node filter allows you to create complex queries against your infrastructure based on +the name, OS, or services running on nodes. For example, use `(name contains aws AND os contains ubuntu) OR services == +apache` to show only nodes that have `aws` in the hostname and are Ubuntu-based, or any nodes that have an Apache +webserver running on them. + +The time & date picker helps you visualize both small and large timeframes depending on your goals, whether that's +establishing a baseline of infrastructure performance or targeted root cause analysis of a specific anomaly. + +For example, use the **Quick Selector** options to pick the 12-hour option first thing in the morning to check your +infrastructure for any odd behavior overnight. Use the 7-day option to observe trends between various days of the week. + +See the [War Rooms](https://learn.netdata.cloud/docs/cloud/war-rooms) docs for more details on both features. + +### Configure composite charts to identify problems + +Let's say you notice a sharp decrease in available RAM for applications, as seen in the example screenshot below. In +this situation, you can see when the anomalous behavior began and that it affects the average available and committed +RAM across your infrastructure. However, when _grouped by dimension_, composite charts cannot show whether an anomaly +affects a single node, a subset of nodes, or an entire infrastructure. + + + +Use [_group by node_](https://learn.netdata.cloud/docs/cloud/visualize/overview#group-by-dimension-or-node) to visualize +a single metric across all contributing nodes. If the composite chart has 5 contributing nodes, there will be 5 +lines/areas, one for the most relevant dimension from each node. + + + +After grouping by node, it's clear that the `Composite-Charts-01` node is experiencing anomalous behavior and should be +investigated further by jumping to its [single-node dashboard](#drill-down-with-single-node-dashboards) in Netdata +Cloud. + +### Drill down with single-node dashboards + +Click on **X Charts** of any composite chart's definition bar to display a dropdown of contributing contexts and nodes +contributing. Click on the link icon <img class="img__inline img__inline--link" +src="https://user-images.githubusercontent.com/1153921/95762109-1d219300-0c62-11eb-8daa-9ba509a8e71c.png" /> next to a +given node to quickly _jump to the same chart in that node's single-node dashboard_ in Netdata Cloud. + +You can use single-node dashboards in Netdata Cloud to drill down on specific issues, scrub backward in time to +investigate historical data, and see like metrics presented meaningfully to help you troubleshoot performance problems. +All of the familiar [interactions](/docs/visualize/interact-dashboards-charts.md) are available, as is adding any chart +to a [new dashboard](/docs/visualize/create-dashboards.md). + +## Nodes view + +You can also use the **Nodes view** to monitor the health status and user-configurable key metrics from multiple nodes +in a War Room. Read the [Nodes view doc](https://learn.netdata.cloud/docs/cloud/visualize/nodes) for details. + +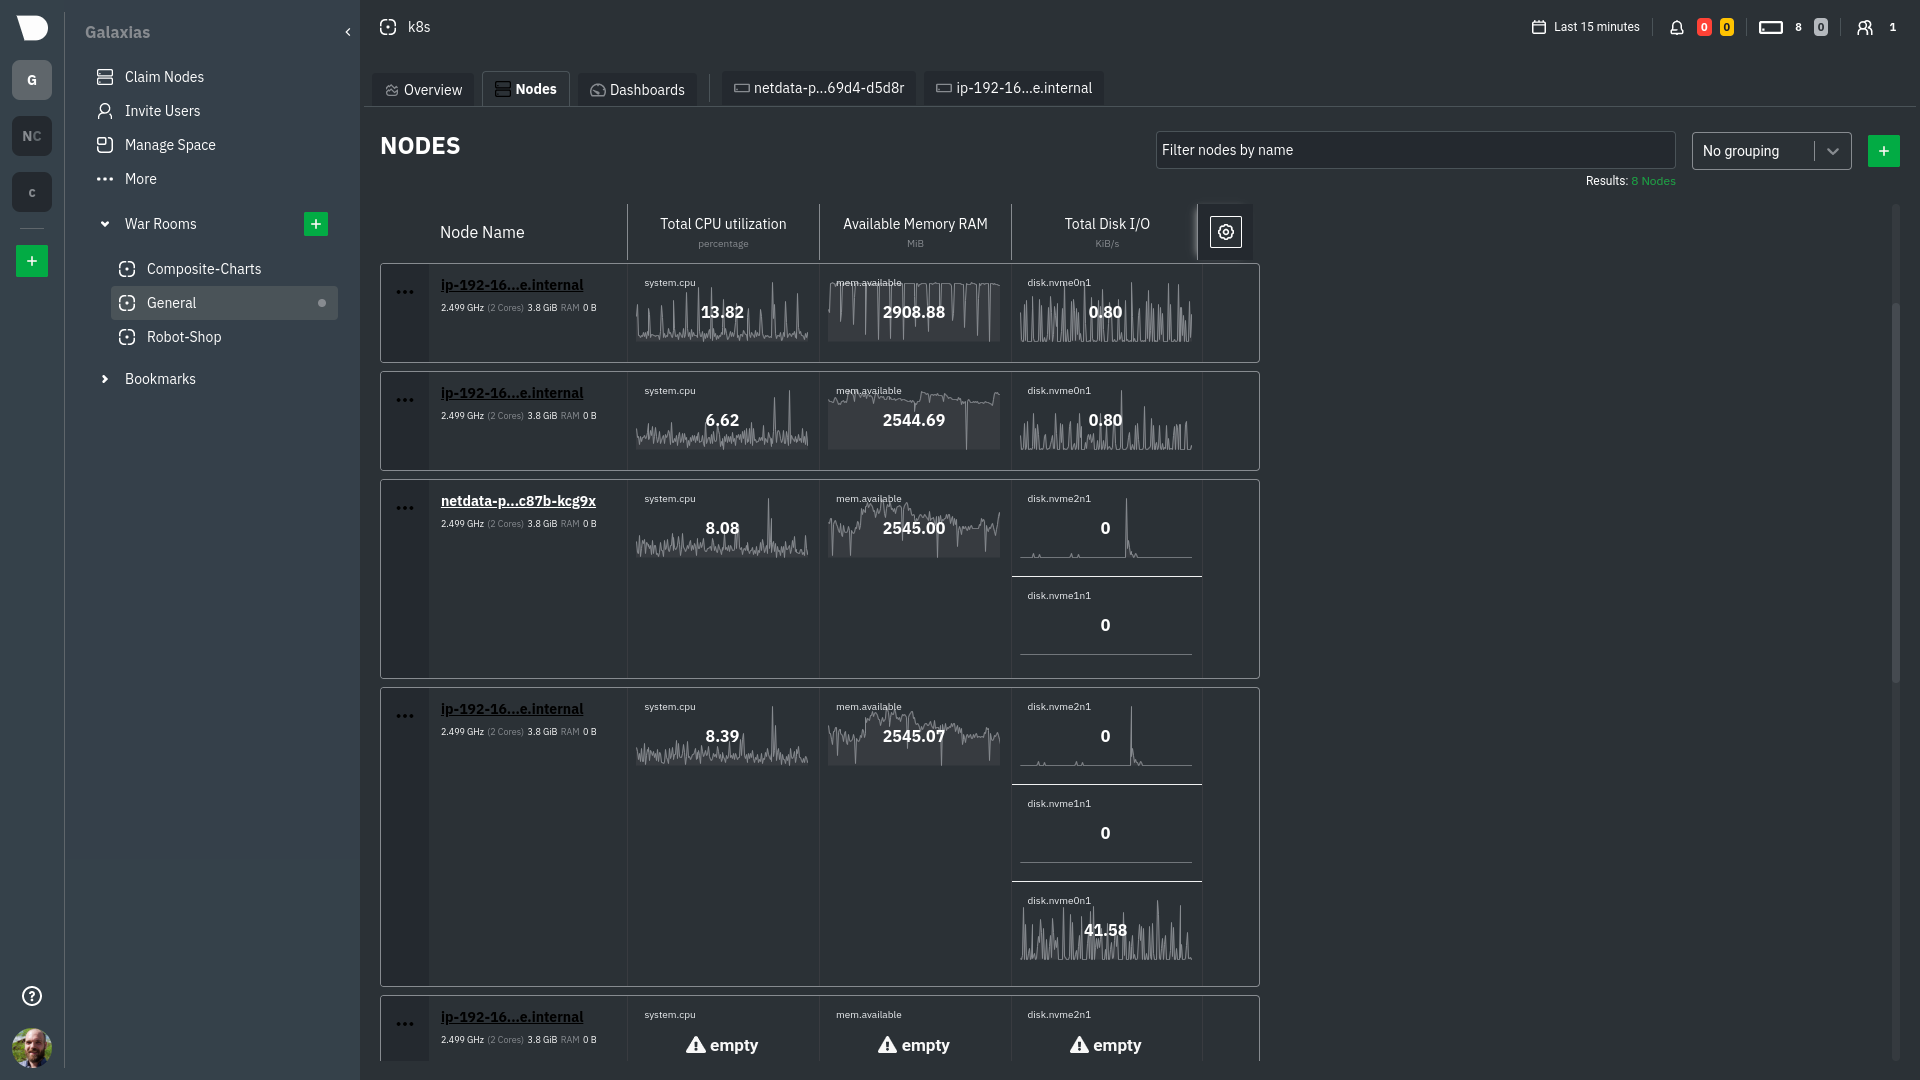 + +## What's next? + +To troubleshoot complex performance issues using Netdata, you need to understand how to interact with its meaningful +visualizations. Learn more about [interaction](/docs/visualize/interact-dashboards-charts.md) to see historical metrics, +highlight timeframes for targeted analysis, and more. + +If you're a Kubernetes user, read about Netdata's [Kubernetes +visualizations](https://learn.netdata.cloud/docs/cloud/visualize/kubernetes) for details about the health map and +time-series k8s charts, and our tutorial, [_Kubernetes monitoring with Netdata: Overview and +visualizations_](/docs/guides/monitor/kubernetes-k8s-netdata.md), for a full walkthrough. + +### Related reference documentation + +- [Netdata Cloud · War Rooms](https://learn.netdata.cloud/docs/cloud/war-rooms) +- [Netdata Cloud · Overview](https://learn.netdata.cloud/docs/cloud/visualize/overview) +- [Netdata Cloud · Nodes view](https://learn.netdata.cloud/docs/cloud/visualize/nodes) +- [Netdata Cloud · Kubernetes visualizations](https://learn.netdata.cloud/docs/cloud/visualize/kubernetes) + + |