
diff options
| author | Daniel Baumann <daniel.baumann@progress-linux.org> | 2021-12-14 16:28:27 +0000 |
|---|---|---|
| committer | Daniel Baumann <daniel.baumann@progress-linux.org> | 2021-12-14 16:28:34 +0000 |
| commit | 6abff7058da6b5bd0d8be156362a42ea458d6246 (patch) | |
| tree | 0bc2b2bb2dc1595e0bc281b58de3e2b0161bc9ca | |
| parent | Releasing debian version 1.32.0-1. (diff) | |
| download | netdata-6abff7058da6b5bd0d8be156362a42ea458d6246.tar.xz netdata-6abff7058da6b5bd0d8be156362a42ea458d6246.zip | |
Merging upstream version 1.32.1.
Signed-off-by: Daniel Baumann <daniel.baumann@progress-linux.org>
31 files changed, 1003 insertions, 346 deletions
diff --git a/.github/data/build-matrix.json b/.github/data/build-matrix.json index b066311f3..3cd3df53d 100644 --- a/.github/data/build-matrix.json +++ b/.github/data/build-matrix.json @@ -67,21 +67,11 @@ "rmjsonc": "dnf remove -y json-c-devel" }, { - "distro": "fedora:33", - "artifact_key": "fedora33", - "rmjsonc": "dnf remove -y json-c-devel" - }, - { "distro": "opensuse/leap:15.3", "artifact_key": "opensuse15.3", "rmjsonc": "zypper rm -y libjson-c-devel" }, { - "distro": "opensuse/leap:15.2", - "artifact_key": "opensuse15.2", - "rmjsonc": "zypper rm -y libjson-c-devel" - }, - { "distro": "oraclelinux:8", "artifact_key": "oraclelinux8", "rmjsonc": "dnf remove -y json-c-devel" diff --git a/.github/workflows/build.yml b/.github/workflows/build.yml index 2732a1851..0e13b0e2c 100644 --- a/.github/workflows/build.yml +++ b/.github/workflows/build.yml @@ -465,13 +465,13 @@ jobs: name: final-artifacts path: final-artifacts - name: Setup Gcloud - uses: google-github-actions/setup-gcloud@v0.2.1 + uses: google-github-actions/setup-gcloud@v0.3 with: project_id: ${{ secrets.GCP_NIGHTLY_STORAGE_PROJECT }} service_account_key: ${{ secrets.GCP_STORAGE_SERVICE_ACCOUNT_KEY }} export_default_credentials: true - name: Upload Artifacts - uses: google-github-actions/upload-cloud-storage@v0.4.0 + uses: google-github-actions/upload-cloud-storage@v0.5.0 with: destination: ${{ secrets.GCP_NIGHTLY_STORAGE_BUCKET }} gzip: false @@ -519,7 +519,7 @@ jobs: artifacts: 'final-artifacts/sha256sums.txt,final-artifacts/netdata-*.tar.gz,final-artifacts/netdata-*.gz.run' draft: true tag: ${{ github.event.inputs.version }} - token: ${{ secrets.NETDATABOT_TOKEN }} + token: ${{ secrets.NETDATABOT_GITHUB_TOKEN }} - name: Failure Notification uses: rtCamp/action-slack-notify@v2 env: diff --git a/.github/workflows/packaging.yml b/.github/workflows/packaging.yml index 80c14e24b..3b8dfc88d 100644 --- a/.github/workflows/packaging.yml +++ b/.github/workflows/packaging.yml @@ -57,17 +57,12 @@ jobs: - {distro: centos, version: "7", pkgclouddistro: el/7, format: rpm, base_image: centos, platform: linux/amd64, arch: amd64} - {distro: centos, version: "8", pkgclouddistro: el/8, format: rpm, base_image: centos, platform: linux/amd64, arch: amd64} - {distro: centos, version: "8", pkgclouddistro: el/8, format: rpm, base_image: centos, platform: linux/arm64/v8, arch: arm64} - - {distro: fedora, version: "33", pkgclouddistro: fedora/33, format: rpm, base_image: fedora, platform: linux/amd64, arch: amd64} - - {distro: fedora, version: "33", pkgclouddistro: fedora/33, format: rpm, base_image: fedora, platform: linux/arm/v7, arch: armhf} - - {distro: fedora, version: "33", pkgclouddistro: fedora/33, format: rpm, base_image: fedora, platform: linux/arm64/v8, arch: arm64} - {distro: fedora, version: "34", pkgclouddistro: fedora/34, format: rpm, base_image: fedora, platform: linux/amd64, arch: amd64} - {distro: fedora, version: "34", pkgclouddistro: fedora/34, format: rpm, base_image: fedora, platform: linux/arm/v7, arch: armhf} - {distro: fedora, version: "34", pkgclouddistro: fedora/34, format: rpm, base_image: fedora, platform: linux/arm64/v8, arch: arm64} - {distro: fedora, version: "35", pkgclouddistro: fedora/35, format: rpm, base_image: fedora, platform: linux/amd64, arch: amd64} - {distro: fedora, version: "35", pkgclouddistro: fedora/35, format: rpm, base_image: fedora, platform: linux/arm/v7, arch: armhf} - {distro: fedora, version: "35", pkgclouddistro: fedora/35, format: rpm, base_image: fedora, platform: linux/arm64/v8, arch: arm64} - - {distro: opensuse, version: "15.2", pkgclouddistro: opensuse/15.2, format: rpm, base_image: opensuse/leap, platform: linux/amd64, arch: amd64} - - {distro: opensuse, version: "15.2", pkgclouddistro: opensuse/15.2, format: rpm, base_image: opensuse/leap, platform: linux/arm64/v8, arch: arm64} - {distro: opensuse, version: "15.3", pkgclouddistro: opensuse/15.3, format: rpm, base_image: opensuse/leap, platform: linux/amd64, arch: amd64} - {distro: opensuse, version: "15.3", pkgclouddistro: opensuse/15.3, format: rpm, base_image: opensuse/leap, platform: linux/arm64/v8, arch: arm64} - {distro: oraclelinux, version: "8", pkgclouddistro: ol/8, format: rpm, base_image: oraclelinux, platform: linux/amd64, arch: amd64} diff --git a/.github/workflows/repoconfig-packages.yml b/.github/workflows/repoconfig-packages.yml index c132ec8b5..811750482 100644 --- a/.github/workflows/repoconfig-packages.yml +++ b/.github/workflows/repoconfig-packages.yml @@ -25,10 +25,8 @@ jobs: - {distro: ubuntu, version: "21.10", pkgclouddistro: ubuntu/impish, format: deb, base_image: ubuntu, platform: linux/amd64, arch: amd64} - {distro: centos, version: "7", pkgclouddistro: el/7, format: rpm, base_image: centos, platform: linux/amd64, arch: amd64} - {distro: centos, version: "8", pkgclouddistro: el/8, format: rpm, base_image: centos, platform: linux/amd64, arch: amd64} - - {distro: fedora, version: "33", pkgclouddistro: fedora/33, format: rpm, base_image: fedora, platform: linux/amd64, arch: amd64} - {distro: fedora, version: "34", pkgclouddistro: fedora/34, format: rpm, base_image: fedora, platform: linux/amd64, arch: amd64} - {distro: fedora, version: "35", pkgclouddistro: fedora/35, format: rpm, base_image: fedora, platform: linux/amd64, arch: amd64} - - {distro: opensuse, version: "15.2", pkgclouddistro: opensuse/15.2, format: rpm, base_image: opensuse/leap, platform: linux/amd64, arch: amd64} - {distro: opensuse, version: "15.3", pkgclouddistro: opensuse/15.3, format: rpm, base_image: opensuse/leap, platform: linux/amd64, arch: amd64} - {distro: oraclelinux, version: "8", pkgclouddistro: ol/8, format: rpm, base_image: oraclelinux, platform: linux/amd64, arch: amd64} # We intentiaonally disable the fail-fast behavior so that a diff --git a/CHANGELOG.md b/CHANGELOG.md index e3af9f3f8..2a7608181 100644 --- a/CHANGELOG.md +++ b/CHANGELOG.md @@ -1,5 +1,34 @@ # Changelog +## [v1.32.1](https://github.com/netdata/netdata/tree/v1.32.1) (2021-12-14) + +[Full Changelog](https://github.com/netdata/netdata/compare/v1.32.0...v1.32.1) + +**Merged pull requests:** + +- Clean up anomaly-detection guide docs [\#11901](https://github.com/netdata/netdata/pull/11901) ([andrewm4894](https://github.com/andrewm4894)) +- Use the chart id instead of chart name in response to incoming cloud context queries [\#11898](https://github.com/netdata/netdata/pull/11898) ([stelfrag](https://github.com/stelfrag)) +- Moved data privacy section into a separate topic [\#11889](https://github.com/netdata/netdata/pull/11889) ([kickoke](https://github.com/kickoke)) +- Fixed formatting issues. [\#11888](https://github.com/netdata/netdata/pull/11888) ([kickoke](https://github.com/kickoke)) +- Fix postdrop handling for systemd systems. [\#11885](https://github.com/netdata/netdata/pull/11885) ([Ferroin](https://github.com/Ferroin)) +- Minor ACLK docu updates [\#11882](https://github.com/netdata/netdata/pull/11882) ([underhood](https://github.com/underhood)) +- Adds Swagger docs for new `/api/v1/aclk` endpoint [\#11881](https://github.com/netdata/netdata/pull/11881) ([underhood](https://github.com/underhood)) +- fix\(updater\): don't produce output when static update succeeded [\#11879](https://github.com/netdata/netdata/pull/11879) ([ilyam8](https://github.com/ilyam8)) +- fix\(updater\): fix exit code when updating static install && updater script [\#11873](https://github.com/netdata/netdata/pull/11873) ([ilyam8](https://github.com/ilyam8)) +- add z score alarm example [\#11871](https://github.com/netdata/netdata/pull/11871) ([andrewm4894](https://github.com/andrewm4894)) +- fix\(health\): used\_swap alarm calc [\#11868](https://github.com/netdata/netdata/pull/11868) ([ilyam8](https://github.com/ilyam8)) +- Initialize enabled parameter to 1 in AlarmLogHealth message [\#11856](https://github.com/netdata/netdata/pull/11856) ([MrZammler](https://github.com/MrZammler)) +- Explicitly conflict with distro netdata DEB packages. [\#11855](https://github.com/netdata/netdata/pull/11855) ([Ferroin](https://github.com/Ferroin)) +- fixed username for not-local users [\#11854](https://github.com/netdata/netdata/pull/11854) ([scatenag](https://github.com/scatenag)) +- fix static build, curl will be staict binary; extra args can be transfer [\#11852](https://github.com/netdata/netdata/pull/11852) ([boxjan](https://github.com/boxjan)) +- Create ML README.md [\#11848](https://github.com/netdata/netdata/pull/11848) ([andrewm4894](https://github.com/andrewm4894)) +- Fix token name in release draft workflow. [\#11847](https://github.com/netdata/netdata/pull/11847) ([Ferroin](https://github.com/Ferroin)) +- Bump static builds to use Alpine 3.15 as a base. [\#11836](https://github.com/netdata/netdata/pull/11836) ([Ferroin](https://github.com/Ferroin)) +- Detect whether libatomic should be linked in when using CXX linker. [\#11818](https://github.com/netdata/netdata/pull/11818) ([vkalintiris](https://github.com/vkalintiris)) +- Make netdata-updater.sh POSIX compliant. [\#11755](https://github.com/netdata/netdata/pull/11755) ([Ferroin](https://github.com/Ferroin)) +- Remove Fedora 33 from CI. [\#11640](https://github.com/netdata/netdata/pull/11640) ([Ferroin](https://github.com/Ferroin)) +- Remove OpenSUSE Leap 15.2 from CI. [\#11600](https://github.com/netdata/netdata/pull/11600) ([Ferroin](https://github.com/Ferroin)) + ## [v1.32.0](https://github.com/netdata/netdata/tree/v1.32.0) (2021-11-30) [Full Changelog](https://github.com/netdata/netdata/compare/v1.31.0...v1.32.0) @@ -156,7 +185,6 @@ - add proc\_net\_sockstat and sockstat6 charts info [\#11567](https://github.com/netdata/netdata/pull/11567) ([ilyam8](https://github.com/ilyam8)) - Disable eBPF compilation in different platforms [\#11566](https://github.com/netdata/netdata/pull/11566) ([thiagoftsm](https://github.com/thiagoftsm)) - add proc\_net\_snmp6 charts info [\#11565](https://github.com/netdata/netdata/pull/11565) ([ilyam8](https://github.com/ilyam8)) -- add proc\_net\_sctp\_snmp charts info [\#11564](https://github.com/netdata/netdata/pull/11564) ([ilyam8](https://github.com/ilyam8)) - eBPF Shared Memory system call tracking [\#11560](https://github.com/netdata/netdata/pull/11560) ([UmanShahzad](https://github.com/UmanShahzad)) - Add shared memory to cgroup [\#11559](https://github.com/netdata/netdata/pull/11559) ([thiagoftsm](https://github.com/thiagoftsm)) - End of support for Ubuntu 16.04 [\#11556](https://github.com/netdata/netdata/pull/11556) ([Ferroin](https://github.com/Ferroin)) diff --git a/Makefile.am b/Makefile.am index 61213ca8d..5b1c7a31a 100644 --- a/Makefile.am +++ b/Makefile.am @@ -969,6 +969,7 @@ NETDATA_COMMON_LIBS = \ $(OPTIONAL_JUDY_LIBS) \ $(OPTIONAL_SSL_LIBS) \ $(OPTIONAL_JSONC_LIBS) \ + $(OPTIONAL_ATOMIC_LIBS) \ $(NULL) if LINK_STATIC_JSONC @@ -995,7 +996,6 @@ netdata_LDADD = \ if ACLK_NG netdata_LDADD += $(OPTIONAL_PROTOBUF_LIBS) \ - $(OPTIONAL_ATOMIC_LIBS) \ $(NULL) endif @@ -4,7 +4,7 @@ <br /> <p align="center"> <a href="https://github.com/netdata/netdata/releases/latest"><img src="https://img.shields.io/github/release/netdata/netdata.svg" alt="Latest release"></a> - <a href="https://github.com/netdata/netdata/releases/latest"><img src="https://img.shields.io/badge/dynamic/xml?url=https://storage.googleapis.com/netdata-nightlies/latest-version.txt&label=nightly%20release&query=/text()" alt="Nightly release"></a> + <a href="https://storage.googleapis.com/netdata-nightlies/latest-version.txt"><img src="https://img.shields.io/badge/dynamic/xml?url=https://storage.googleapis.com/netdata-nightlies/latest-version.txt&label=nightly%20release&query=/text()" alt="Nightly release"></a> <a href="https://travis-ci.com/netdata/netdata"><img src="https://travis-ci.com/netdata/netdata.svg?branch=master" alt="Build status"></a> <a href="https://bestpractices.coreinfrastructure.org/projects/2231"><img src="https://bestpractices.coreinfrastructure.org/projects/2231/badge" alt="CII Best Practices"></a> <a href="https://www.gnu.org/licenses/gpl-3.0"><img src="https://img.shields.io/badge/License-GPL%20v3%2B-blue.svg" alt="License: GPL v3+"></a> diff --git a/aclk/README.md b/aclk/README.md index 13a9be27f..414cca41b 100644 --- a/aclk/README.md +++ b/aclk/README.md @@ -19,29 +19,16 @@ started with Cloud](https://learn.netdata.cloud/docs/cloud/get-started) guide or documentation](/claim/README.md). ## Data privacy - [Data privacy](https://netdata.cloud/data-privacy/) is very important to us. We firmly believe that your data belongs to -you. This is why **we don't store any metric data in Netdata Cloud**. - -All the data that the user sees in the web browser when using Netdata Cloud, are actually streamed directly from the Netdata Agent to the Netdata Cloud dashboard. They pass through our systems, but they are not stored. +you. This is why **we don't store any metric data in Netdata Cloud**. -We do however store a limited number of *metadata* to be able to offer the stunning visualizations and advanced functionality of Netdata Cloud. +All the data that you see in the web browser when using Netdata Cloud, is actually streamed directly from the Netdata Agent to the Netdata Cloud dashboard. +The data passes through our systems, but it isn't stored. -### Metadata +However, to be able to offer the stunning visualizations and advanced functionality of Netdata Cloud, it does store a limited number of _metadata_. -The information we store in Netdata Cloud is the following (using the publicly available demo server `frankfurt.my-netdata.io` as an example): -- The email address you used to sign up/or sign in -- For each node connected to your Spaces in Netdata Cloud: - - Hostname (as it appears in Netdata Cloud) - - Information shown in `/api/v1/info`. For example: [https://frankfurt.my-netdata.io/api/v1/info](https://frankfurt.my-netdata.io/api/v1/info). - - The chart metadata shown in `/api/v1/charts`. For example: [https://frankfurt.my-netdata.io/api/v1/info](https://frankfurt.my-netdata.io/api/v1/info). - - Alarm configurations shown in `/api/v1/alarms?all`. For example: [https://frankfurt.my-netdata.io/api/v1/alarms?all](https://frankfurt.my-netdata.io/api/v1/alarms?all). - - Active alarms shown in `/api/v1/alarms`. For example: [https://frankfurt.my-netdata.io/api/v1/alarms](https://frankfurt.my-netdata.io/api/v1/alarms). +Read more about [Data privacy in the Netdata Cloud](https://learn.netdata.cloud/docs/cloud/data-privacy) in the documentation. -How we use them: -- The data are stored in our production database on Google Cloud and some of it is also used in BigQuery, our data lake, for analytics purposes. These analytics are crucial for our product development process. -- Email is used to identify users in regards to product use and to enrich our tools with product use, such as our CRM. -- This data is only available to Netdata and never to a 3rd party. ## Enable and configure the ACLK @@ -63,7 +50,7 @@ You can configure following keys in the `netdata.conf` section `[cloud]`: [cloud] statistics = yes query thread count = 2 - aclk implementation = legacy + aclk implementation = ng ``` - `statistics` enables/disables ACLK related statistics and their charts. You can disable this to save some space in the database and slightly reduce memory usage of Netdata Agent. @@ -84,7 +71,12 @@ Features: To verify which ACLK implementation Netdata uses, visit the `/api/v1/info` endpoint on your local dashboard and check the `aclk-implementation` key. -New Netdata Cloud features will be implemented on top of ACLK-NG from this point on. ACLK Legacy is therefore kept as a fallback in case some users have issues with ACLK-NG or need to use features which are not yet available in ACLK-NG *(like IPv6 support and SOCKS proxy)*. +New Netdata Cloud features will be implemented on top of ACLK-NG only. ACLK Legacy is therefore kept as a fallback in case some users have issues. + + +> Note: ACLK Legacy will be removed in following releases! +> Update your ACLK configuration to ACLK-NG to prevent any disruptions. + ### Improvements of ACLK-NG over Legacy are: - No dependency on custom patched `libmosquitto` (no bundling of libraries). Which should remove obstacles many GNU/Linux distribution package maintainers had trying to provide Netdata with Cloud support diff --git a/claim/README.md b/claim/README.md index bbccaac19..b709b0f06 100644 --- a/claim/README.md +++ b/claim/README.md @@ -239,7 +239,7 @@ for details on connecting a parent Netdata pod. ### Connect through a proxy -A Space's administrator can connect a node through a SOCKS5 or HTTP(S) proxy. +A Space's administrator can connect a node through HTTP(S) proxy. You should first configure the proxy in the `[cloud]` section of `netdata.conf`. The proxy settings you specify here will also be used to tunnel the ACLK. The default `proxy` setting is `none`. @@ -252,16 +252,15 @@ will also be used to tunnel the ACLK. The default `proxy` setting is `none`. The `proxy` setting can take one of the following values: - `none`: Do not use a proxy, even if the system configured otherwise. -- `env`: Try to read proxy settings from set environment variables `http_proxy`/`socks_proxy`. -- `socks5[h]://[user:pass@]host:ip`: The ACLK and connection process will use the specified SOCKS5 proxy. +- `env`: Try to read proxy settings from set environment variables `http_proxy`. - `http://[user:pass@]host:ip`: The ACLK and connection process will use the specified HTTP(S) proxy. -For example, a SOCKS5 proxy setting may look like the following: +For example, a HTTP proxy setting may look like the following: ```conf [cloud] - proxy = socks5h://203.0.113.0:1080 # With an IP address - proxy = socks5h://proxy.example.com:1080 # With a URL + proxy = http://203.0.113.0:1080 # With an IP address + proxy = http://proxy.example.com:1080 # With a URL ``` You can now move on to connecting. When you connect with the [kickstart](/packaging/installer/#automatic-one-line-installation-script) script, add the `--claim-proxy=` parameter and @@ -289,6 +288,18 @@ might be having with the ACLK or connection process. "aclk-available" ``` +On Netdata agent version `1.32` (`netdata -v` to find your version) and newer, the `netdata -W aclk-state` command can be used to get some diagnostic information about ACLK. Sample output: + +``` +ACLK Available: Yes +ACLK Implementation: Next Generation +New Cloud Protocol Support: Yes +Claimed: Yes +Claimed Id: 53aa76c2-8af5-448f-849a-b16872cc4ba1 +Online: Yes +Used Cloud Protocol: New +``` + Use these keys and the information below to troubleshoot the ACLK. #### kickstart: unsupported Netdata installation @@ -347,7 +358,7 @@ Additionally, check that the `enabled` setting in `var/lib/netdata/cloud.d/cloud To fix this issue, reinstall Netdata using your [preferred method](/packaging/installer/README.md) and do not add the `--disable-cloud` option. -#### cloud-available is false +#### cloud-available is false / ACLK Available: No If `cloud-available` is `false` after you verified Cloud is enabled in the previous step, the most likely issue is that Cloud features failed to build during installation. @@ -377,7 +388,7 @@ You may see one of the following error messages during installation: - Unable to fetch sources for JSON-C. Netdata Cloud support will be disabled. One common cause of the installer failing to build Cloud features is not having one of the following dependencies on -your system: `cmake` and OpenSSL, including the `devel` package. +your system: `cmake`, `json-c` and `OpenSSL`, including corresponding `devel` packages. You can also look for error messages in `/var/log/netdata/error.log`. Try one of the following two commands to search for ACLK-related errors. @@ -391,11 +402,11 @@ If the installer's output does not help you enable Cloud features, contact us by GitHub](https://github.com/netdata/netdata/issues/new?labels=bug%2C+needs+triage%2C+ACLK&template=bug_report.md&title=The+installer+failed+to+prepare+the+required+dependencies+for+Netdata+Cloud+functionality) with details about your system and relevant output from `error.log`. -#### agent-claimed is false +#### agent-claimed is false / Claimed: No You must [connect your node](#how-to-connect-a-node). -#### aclk-available is false +#### aclk-available is false / Online: No If `aclk-available` is `false` and all other keys are `true`, your Agent is having trouble connecting to the Cloud through the ACLK. Please check your system's firewall. diff --git a/cli/README.md b/cli/README.md index 1962b2ede..6eb121be5 100644 --- a/cli/README.md +++ b/cli/README.md @@ -17,8 +17,10 @@ help Show this help menu. reload-health Reload health configuration. +reload-labels + Reload all labels. save-database - Save internal DB to disk for for memory mode save. + Save internal DB to disk for memory mode save. reopen-logs Close and reopen log files. shutdown-agent @@ -26,7 +28,11 @@ shutdown-agent fatal-agent Log the state and halt the netdata agent. reload-claiming-state - Reload agent connection state from disk. + Reload agent claiming state from disk. +ping + Return with 'pong' if agent is alive. +aclk-state [json] + Returns current state of ACLK and Cloud connection. (optionally in json) ``` Those commands are the same that can be sent to netdata via [signals](/daemon/README.md#command-line-options). diff --git a/configure.ac b/configure.ac index b5b6893e5..b9b49d276 100644 --- a/configure.ac +++ b/configure.ac @@ -799,27 +799,6 @@ if test "$enable_cloud" != "no" -a "$aclk_ng" != "no"; then AC_MSG_RESULT([yes]) fi - if test "${with_bundled_protobuf}" = "yes"; then - AC_LANG_PUSH([C++]) - CXXFLAGS="${CXXFLAGS} -std=c++11" - - # On some platforms, std::atomic needs a helper library - AC_MSG_CHECKING(whether -latomic is needed for static protobuf) - AC_LINK_IFELSE([AC_LANG_SOURCE([[ - #include <atomic> - #include <cstdint> - std::atomic<std::int64_t> v; - int main() { - return v; - } - ]])], STD_ATOMIC_NEED_LIBATOMIC=no, STD_ATOMIC_NEED_LIBATOMIC=yes) - AC_MSG_RESULT($STD_ATOMIC_NEED_LIBATOMIC) - if test "x$STD_ATOMIC_NEED_LIBATOMIC" = xyes; then - OPTIONAL_ATOMIC_LIBS="-latomic" - fi - AC_SUBST([OPTIONAL_ATOMIC_LIBS]) - AC_LANG_POP([C++]) - fi AC_MSG_CHECKING([ACLK Next Generation can support New Cloud protocol]) AC_MSG_RESULT([${can_build_new_cloud_protocol}]) if test "$new_cloud_protocol" = "yes" -a "$can_build_new_cloud_protocol" != "yes"; then @@ -1655,11 +1634,44 @@ AC_MSG_RESULT([${enable_lto}]) # ----------------------------------------------------------------------------- -AM_CONDITIONAL([ENABLE_CXX_LINKER], [test "${enable_backend_kinesis}" = "yes" \ - -o "${enable_exporting_pubsub}" = "yes" \ - -o "${enable_backend_prometheus_remote_write}" = "yes" \ - -o "${new_cloud_protocol}" = "yes" \ - -o "${build_ml}" = "yes"]) +if test "${enable_backend_kinesis}" = "yes" -o \ + "${enable_exporting_pubsub}" = "yes" -o \ + "${enable_backend_prometheus_remote_write}" = "yes" -o \ + "${new_cloud_protocol}" = "yes" -o \ + "${build_ml}" = "yes"; then + enable_cxx_linker="yes" + + # Try to unconditionally link with -latomic. If the compiler can satisfy + # all the atomic ops with builtins then, the library will be left unused. + # Otherwise, some ops will be covered by the compiler's intrinsics and some + # will be picked up by the linker from -latomic. In the later case, if + # -latomic is not available there will be a build failure, which would + # have happened either way before this change. + AC_LANG_PUSH([C++]) + + AC_MSG_CHECKING(whether we can use -latomic) + OLD_LIBS="${LIBS}" + LIBS="-latomic" + AC_LINK_IFELSE([AC_LANG_SOURCE([[ + #include <atomic> + #include <cstdint> + std::atomic<std::int64_t> v; + int main() { + return v; + } + ]])], CAN_USE_LIBATOMIC=yes, CAN_USE_LIBATOMIC=no) + LIBS="${OLD_LIBS}" + AC_MSG_RESULT($CAN_USE_LIBATOMIC) + + if test "x$CAN_USE_LIBATOMIC" = xyes; then + OPTIONAL_ATOMIC_LIBS="-latomic" + fi + AC_SUBST([OPTIONAL_ATOMIC_LIBS]) + + AC_LANG_POP([C++]) +fi + +AM_CONDITIONAL([ENABLE_CXX_LINKER], [test "${enable_cxx_linker}" = "yes"]) AC_DEFINE_UNQUOTED([NETDATA_USER], ["${with_user}"], [use this user to drop privileged]) diff --git a/contrib/debian/control b/contrib/debian/control index 622e730f2..912800b7e 100644 --- a/contrib/debian/control +++ b/contrib/debian/control @@ -38,6 +38,11 @@ Depends: adduser, openssl, ${misc:Depends}, ${shlibs:Depends} +Conflicts: netdata-core, + netdata-plugins-bash, + netdata-plugins-python, + netdata-plugins-nodejs, + netdata-web Pre-Depends: dpkg (>= 1.17.14) Description: real-time charts for system monitoring Netdata is a daemon that collects data in realtime (per second) diff --git a/database/sqlite/sqlite_aclk_alert.c b/database/sqlite/sqlite_aclk_alert.c index af2797a51..8d7694244 100644 --- a/database/sqlite/sqlite_aclk_alert.c +++ b/database/sqlite/sqlite_aclk_alert.c @@ -370,6 +370,7 @@ void aclk_push_alarm_health_log(struct aclk_database_worker_config *wc, struct a alarm_log.node_id = wc->node_id; alarm_log.log_entries = log_entries; alarm_log.status = wc->alert_updates == 0 ? 2 : 1; + alarm_log.enabled = 1; wc->alert_sequence_id = last_sequence; diff --git a/docs/guides/monitor/anomaly-detection-python.md b/docs/guides/monitor/anomaly-detection-python.md new file mode 100644 index 000000000..d10e9da4f --- /dev/null +++ b/docs/guides/monitor/anomaly-detection-python.md @@ -0,0 +1,189 @@ +<!-- +title: "Detect anomalies in systems and applications" +description: "Detect anomalies in any system, container, or application in your infrastructure with machine learning and the open-source Netdata Agent." +image: /img/seo/guides/monitor/anomaly-detection.png +author: "Joel Hans" +author_title: "Editorial Director, Technical & Educational Resources" +author_img: "/img/authors/joel-hans.jpg" +custom_edit_url: https://github.com/netdata/netdata/edit/master/docs/guides/monitor/anomaly-detection-python.md +--> + +# Detect anomalies in systems and applications + +Beginning with v1.27, the [open-source Netdata Agent](https://github.com/netdata/netdata) is capable of unsupervised +[anomaly detection](https://en.wikipedia.org/wiki/Anomaly_detection) with machine learning (ML). As with all things +Netdata, the anomalies collector comes with preconfigured alarms and instant visualizations that require no query +languages or organizing metrics. You configure the collector to look at specific charts, and it handles the rest. + +Netdata's implementation uses a handful of functions in the [Python Outlier Detection (PyOD) +library](https://github.com/yzhao062/pyod/tree/master), which periodically runs a `train` function that learns what +"normal" looks like on your node and creates an ML model for each chart, then utilizes the +[`predict_proba()`](https://pyod.readthedocs.io/en/latest/api_cc.html#pyod.models.base.BaseDetector.predict_proba) and +[`predict()`](https://pyod.readthedocs.io/en/latest/api_cc.html#pyod.models.base.BaseDetector.predict) PyOD functions to +quantify how anomalous certain charts are. + +All these metrics and alarms are available for centralized monitoring in [Netdata Cloud](https://app.netdata.cloud). If +you choose to sign up for Netdata Cloud and [coonect your nodes](/claim/README.md), you will have the ability to run +tailored anomaly detection on every node in your infrastructure, regardless of its purpose or workload. + +In this guide, you'll learn how to set up the anomalies collector to instantly detect anomalies in an Nginx web server +and/or the node that hosts it, which will give you the tools to configure parallel unsupervised monitors for any +application in your infrastructure. Let's get started. + +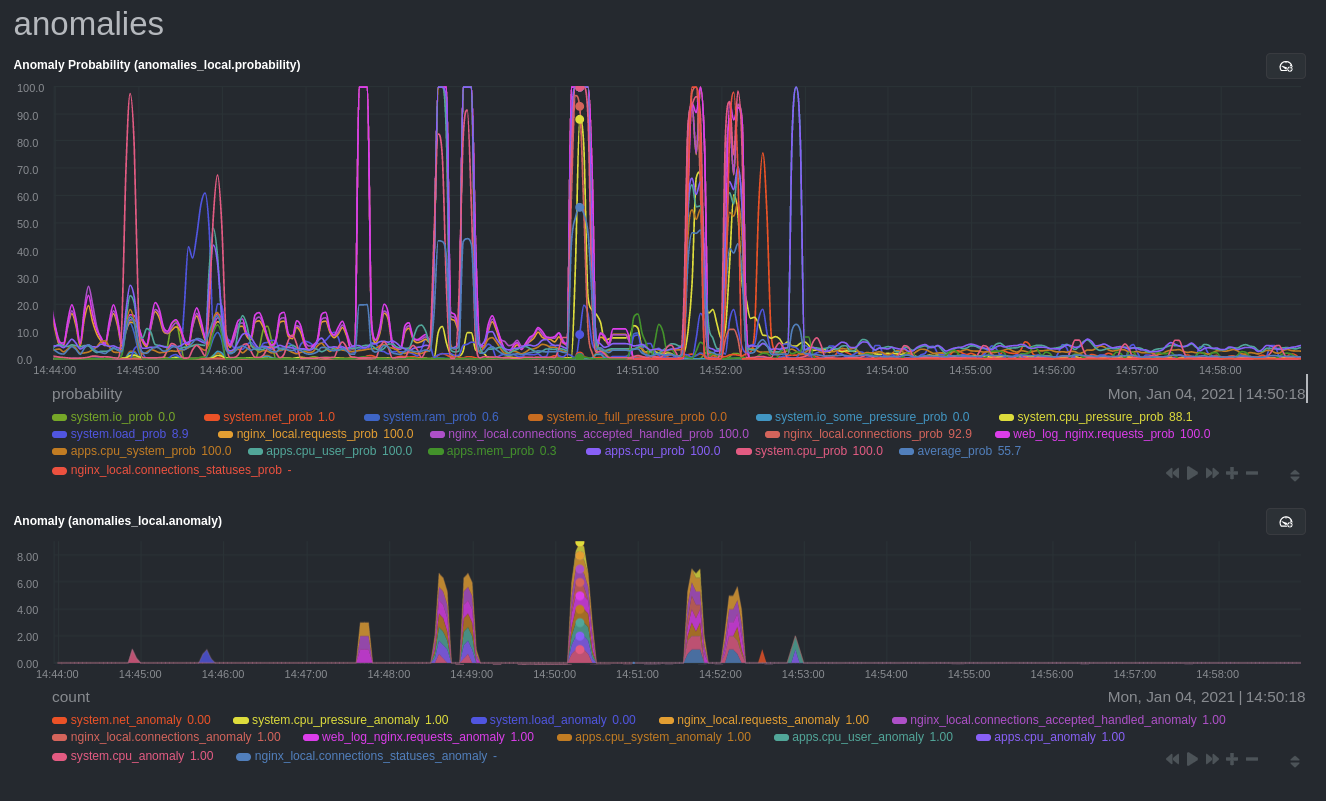 + +## Prerequisites + +- A node running the Netdata Agent. If you don't yet have that, [get Netdata](/docs/get-started.mdx). +- A Netdata Cloud account. [Sign up](https://app.netdata.cloud) if you don't have one already. +- Familiarity with configuring the Netdata Agent with [`edit-config`](/docs/configure/nodes.md). +- _Optional_: An Nginx web server running on the same node to follow the example configuration steps. + +## Install required Python packages + +The anomalies collector uses a few Python packages, available with `pip3`, to run ML training. It requires +[`numba`](http://numba.pydata.org/), [`scikit-learn`](https://scikit-learn.org/stable/), +[`pyod`](https://pyod.readthedocs.io/en/latest/), in addition to +[`netdata-pandas`](https://github.com/netdata/netdata-pandas), which is a package built by the Netdata team to pull data +from a Netdata Agent's API into a [Pandas](https://pandas.pydata.org/). Read more about `netdata-pandas` on its [package +repo](https://github.com/netdata/netdata-pandas) or in Netdata's [community +repo](https://github.com/netdata/community/tree/main/netdata-agent-api/netdata-pandas). + +```bash +# Become the netdata user +sudo su -s /bin/bash netdata + +# Install required packages for the netdata user +pip3 install --user netdata-pandas==0.0.38 numba==0.50.1 scikit-learn==0.23.2 pyod==0.8.3 +``` + +> If the `pip3` command fails, you need to install it. For example, on an Ubuntu system, use `sudo apt install +> python3-pip`. + +Use `exit` to become your normal user again. + +## Enable the anomalies collector + +Navigate to your [Netdata config directory](/docs/configure/nodes.md#the-netdata-config-directory) and use `edit-config` +to open the `python.d.conf` file. + +```bash +sudo ./edit-config python.d.conf +``` + +In `python.d.conf` file, search for the `anomalies` line. If the line exists, set the value to `yes`. Add the line +yourself if it doesn't already exist. Either way, the final result should look like: + +```conf +anomalies: yes +``` + +[Restart the Agent](/docs/configure/start-stop-restart.md) with `sudo systemctl restart netdata`, or the [appropriate +method](/docs/configure/start-stop-restart.md) for your system, to start up the anomalies collector. By default, the +model training process runs every 30 minutes, and uses the previous 4 hours of metrics to establish a baseline for +health and performance across the default included charts. + +> 💡 The anomaly collector may need 30-60 seconds to finish its initial training and have enough data to start +> generating anomaly scores. You may need to refresh your browser tab for the **Anomalies** section to appear in menus +> on both the local Agent dashboard or Netdata Cloud. + +## Configure the anomalies collector + +Open `python.d/anomalies.conf` with `edit-conf`. + +```bash +sudo ./edit-config python.d/anomalies.conf +``` + +The file contains many user-configurable settings with sane defaults. Here are some important settings that don't +involve tweaking the behavior of the ML training itself. + +- `charts_regex`: Which charts to train models for and run anomaly detection on, with each chart getting a separate + model. +- `charts_to_exclude`: Specific charts, selected by the regex in `charts_regex`, to exclude. +- `train_every_n`: How often to train the ML models. +- `train_n_secs`: The number of historical observations to train each model on. The default is 4 hours, but if your node + doesn't have historical metrics going back that far, consider [changing the metrics retention + policy](/docs/store/change-metrics-storage.md) or reducing this window. +- `custom_models`: A way to define custom models that you want anomaly probabilities for, including multi-node or + streaming setups. + +> ⚠️ Setting `charts_regex` with many charts or `train_n_secs` to a very large number will have an impact on the +> resources and time required to train a model for every chart. The actual performance implications depend on the +> resources available on your node. If you plan on changing these settings beyond the default, or what's mentioned in +> this guide, make incremental changes to observe the performance impact. Considering `train_max_n` to cap the number of +> observations actually used to train on. + +### Run anomaly detection on Nginx and log file metrics + +As mentioned above, this guide uses an Nginx web server to demonstrate how the anomalies collector works. You must +configure the collector to monitor charts from the +[Nginx](https://learn.netdata.cloud/docs/agent/collectors/go.d.plugin/modules/nginx) and [web +log](https://learn.netdata.cloud/docs/agent/collectors/go.d.plugin/modules/weblog) collectors. + +`charts_regex` allows for some basic regex, such as wildcards (`*`) to match all contexts with a certain pattern. For +example, `system\..*` matches with any chart with a context that begins with `system.`, and ends in any number of other +characters (`.*`). Note the escape character (`\`) around the first period to capture a period character exactly, and +not any character. + +Change `charts_regex` in `anomalies.conf` to the following: + +```conf + charts_regex: 'system\..*|nginx_local\..*|web_log_nginx\..*|apps.cpu|apps.mem' +``` + +This value tells the anomaly collector to train against every `system.` chart, every `nginx_local` chart, every +`web_log_nginx` chart, and specifically the `apps.cpu` and `apps.mem` charts. + +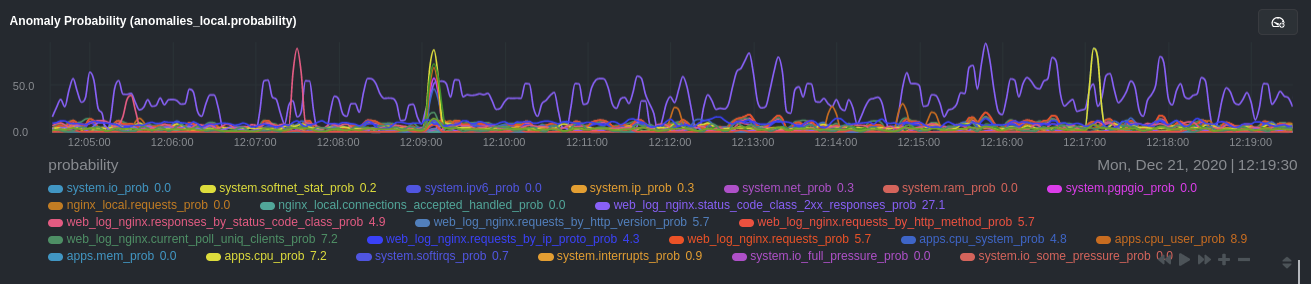 + +### Remove some metrics from anomaly detection + +As you can see in the above screenshot, this node is now looking for anomalies in many places. The result is a single +`anomalies_local.probability` chart with more than twenty dimensions, some of which the dashboard hides at the bottom of +a scroll-able area. In addition, training and analyzing the anomaly collector on many charts might require more CPU +utilization that you're willing to give. + +First, explicitly declare which `system.` charts to monitor rather than of all of them using regex (`system\..*`). + +```conf + charts_regex: 'system\.cpu|system\.load|system\.io|system\.net|system\.ram|nginx_local\..*|web_log_nginx\..*|apps.cpu|apps.mem' +``` + +Next, remove some charts with the `charts_to_exclude` setting. For this example, using an Nginx web server, focus on the +volume of requests/responses, not, for example, which type of 4xx response a user might receive. + +```conf + charts_to_exclude: 'web_log_nginx.excluded_requests,web_log_nginx.responses_by_status_code_class,web_log_nginx.status_code_class_2xx_responses,web_log_nginx.status_code_class_4xx_responses,web_log_nginx.current_poll_uniq_clients,web_log_nginx.requests_by_http_method,web_log_nginx.requests_by_http_version,web_log_nginx.requests_by_ip_proto' +``` + +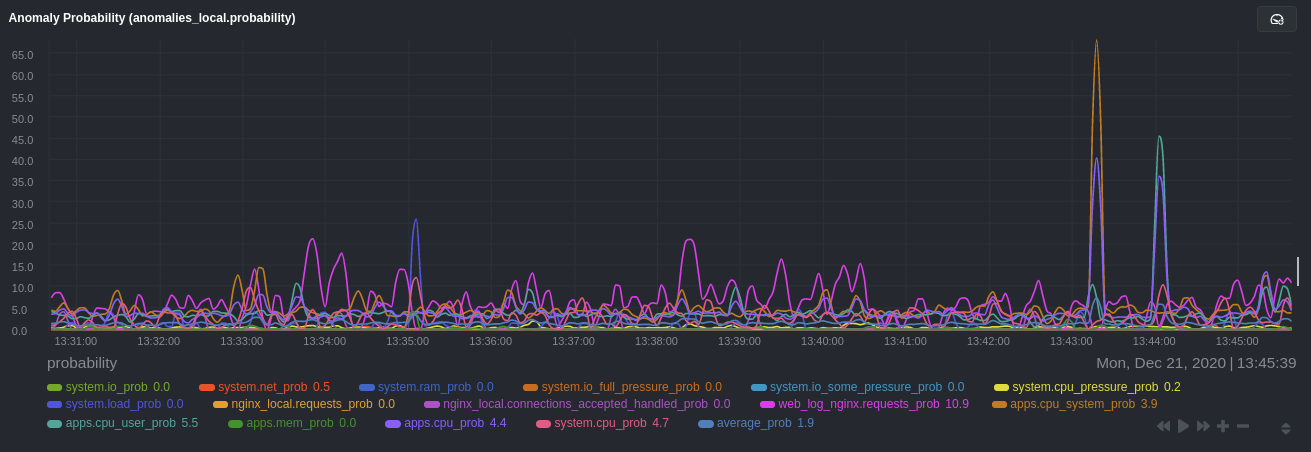 + +Apply the ideas behind the collector's regex and exclude settings to any other +[system](/docs/collect/system-metrics.md), [container](/docs/collect/container-metrics.md), or +[application](/docs/collect/application-metrics.md) metrics you want to detect anomalies for. + +## What's next? + +Now that you know how to set up unsupervised anomaly detection in the Netdata Agent, using an Nginx web server as an +example, it's time to apply that knowledge to other mission-critical parts of your infrastructure. If you're not sure +what to monitor next, check out our list of [collectors](/collectors/COLLECTORS.md) to see what kind of metrics Netdata +can collect from your systems, containers, and applications. + +Keep on moving to [part 2](/docs/guides/monitor/visualize-monitor-anomalies.md), which covers the charts and alarms +Netdata creates for unsupervised anomaly detection. + +For a different troubleshooting experience, try out the [Metric +Correlations](https://learn.netdata.cloud/docs/cloud/insights/metric-correlations) feature in Netdata Cloud. Metric +Correlations helps you perform faster root cause analysis by narrowing a dashboard to only the charts most likely to be +related to an anomaly. + +### Related reference documentation + +- [Netdata Agent · Anomalies collector](/collectors/python.d.plugin/anomalies/README.md) +- [Netdata Agent · Nginx collector](https://learn.netdata.cloud/docs/agent/collectors/go.d.plugin/modules/nginx) +- [Netdata Agent · web log collector](https://learn.netdata.cloud/docs/agent/collectors/go.d.plugin/modules/weblog) +- [Netdata Cloud · Metric Correlations](https://learn.netdata.cloud/docs/cloud/insights/metric-correlations) diff --git a/docs/guides/monitor/anomaly-detection.md b/docs/guides/monitor/anomaly-detection.md index 2d8b6d1d6..7b4388a05 100644 --- a/docs/guides/monitor/anomaly-detection.md +++ b/docs/guides/monitor/anomaly-detection.md @@ -1,191 +1,274 @@ <!-- -title: "Detect anomalies in systems and applications" +title: "Machine learning (ML) powered anomaly detection" description: "Detect anomalies in any system, container, or application in your infrastructure with machine learning and the open-source Netdata Agent." image: /img/seo/guides/monitor/anomaly-detection.png -author: "Joel Hans" -author_title: "Editorial Director, Technical & Educational Resources" -author_img: "/img/authors/joel-hans.jpg" -custom_edit_url: https://github.com/netdata/netdata/edit/master/docs/guides/monitor/anomaly-detection.md +author: "Andrew Maguire" +author_title: "Analytics & ML Lead" +author_img: "/img/authors/andy-maguire.jpg" +custom_edit_url: https://github.com/netdata/netdata/edit/master/ml/README.md --> -# Detect anomalies in systems and applications +# Machine learning (ML) powered anomaly detection -Beginning with v1.27, the [open-source Netdata Agent](https://github.com/netdata/netdata) is capable of unsupervised -[anomaly detection](https://en.wikipedia.org/wiki/Anomaly_detection) with machine learning (ML). As with all things -Netdata, the anomalies collector comes with preconfigured alarms and instant visualizations that require no query -languages or organizing metrics. You configure the collector to look at specific charts, and it handles the rest. +## Overview -Netdata's implementation uses a handful of functions in the [Python Outlier Detection (PyOD) -library](https://github.com/yzhao062/pyod/tree/master), which periodically runs a `train` function that learns what -"normal" looks like on your node and creates an ML model for each chart, then utilizes the -[`predict_proba()`](https://pyod.readthedocs.io/en/latest/api_cc.html#pyod.models.base.BaseDetector.predict_proba) and -[`predict()`](https://pyod.readthedocs.io/en/latest/api_cc.html#pyod.models.base.BaseDetector.predict) PyOD functions to -quantify how anomalous certain charts are. +As of [`v1.32.0`](https://github.com/netdata/netdata/releases/tag/v1.32.0), Netdata comes with some ML powered [anomaly detection](https://en.wikipedia.org/wiki/Anomaly_detection) capabilities built into it and available to use out of the box, with minimal configuration required. -All these metrics and alarms are available for centralized monitoring in [Netdata Cloud](https://app.netdata.cloud). If -you choose to sign up for Netdata Cloud and [coonect your nodes](/claim/README.md), you will have the ability to run -tailored anomaly detection on every node in your infrastructure, regardless of its purpose or workload. +🚧 **Note**: This functionality is still under active development and considered experimental. Changes might cause the feature to break. We dogfood it internally and among early adopters within the Netdata community to build the feature. If you would like to get involved and help us with some feedback, email us at analytics-ml-team@netdata.cloud or come join us in the [🤖-ml-powered-monitoring](https://discord.gg/4eRSEUpJnc) channel of the Netdata discord. -In this guide, you'll learn how to set up the anomalies collector to instantly detect anomalies in an Nginx web server -and/or the node that hosts it, which will give you the tools to configure parallel unsupervised monitors for any -application in your infrastructure. Let's get started. +Once ML is enabled, Netdata will begin training a model for each dimension. By default this model is a [k-means clustering](https://en.wikipedia.org/wiki/K-means_clustering) model trained on the most recent 4 hours of data. Rather than just using the most recent value of each raw metric, the model works on a preprocessed ["feature vector"](#feature-vector) of recent smoothed and differenced values. This should enable the model to detect a wider range of potentially anomalous patterns in recent observations as opposed to just point anomalies like big spikes or drops. ([This infographic](https://user-images.githubusercontent.com/2178292/144414415-275a3477-5b47-43d6-8959-509eb48ebb20.png) shows some different types of anomalies.) - +The sections below will introduce some of the main concepts: +- anomaly bit +- anomaly score +- anomaly rate +- anomaly detector -## Prerequisites +Additional explanations and details can be found in the [Glossary](#glossary) and [Notes](#notes) at the bottom of the page. -- A node running the Netdata Agent. If you don't yet have that, [get Netdata](/docs/get-started.mdx). -- A Netdata Cloud account. [Sign up](https://app.netdata.cloud) if you don't have one already. -- Familiarity with configuring the Netdata Agent with [`edit-config`](/docs/configure/nodes.md). -- _Optional_: An Nginx web server running on the same node to follow the example configuration steps. +### Anomaly Bit - (100 = Anomalous, 0 = Normal) -## Install required Python packages +Once each model is trained, Netdata will begin producing an ["anomaly score"](#anomaly-score) at each time step for each dimension. This ["anomaly score"](#anomaly-score) is essentially a distance measure to the trained cluster centers of the model (by default each model has k=2, so two cluster centers are learned). More anomalous looking data should be more distant to those cluster centers. If this ["anomaly score"](#anomaly-score) is sufficiently large, this is a sign that the recent raw values of the dimension could potentially be anomalous. By default, "sufficiently large" means that the distance is in the 99th percentile or above of all distances observed during training or, put another way, it has to be further away than the furthest 1% of the data used during training. Once this threshold is passed, the ["anomaly bit"](#anomaly-bit) corresponding to that dimension is set to 100 to flag it as anomalous, otherwise it would be left at 0 to signal normal data. -The anomalies collector uses a few Python packages, available with `pip3`, to run ML training. It requires -[`numba`](http://numba.pydata.org/), [`scikit-learn`](https://scikit-learn.org/stable/), -[`pyod`](https://pyod.readthedocs.io/en/latest/), in addition to -[`netdata-pandas`](https://github.com/netdata/netdata-pandas), which is a package built by the Netdata team to pull data -from a Netdata Agent's API into a [Pandas](https://pandas.pydata.org/). Read more about `netdata-pandas` on its [package -repo](https://github.com/netdata/netdata-pandas) or in Netdata's [community -repo](https://github.com/netdata/community/tree/main/netdata-agent-api/netdata-pandas). +What this means is that in addition to the raw value of each metric, Netdata now also stores an ["anomaly bit"](#anomaly-bit) that is either 100 (anomalous) or 0 (normal). Importantly, this is achieved without additional storage overhead due to how the anomaly bit has been implemented within the existing internal Netdata storage representation. -```bash -# Become the netdata user -sudo su -s /bin/bash netdata +This ["anomaly bit"](#anomaly-bit) is exposed via the `anomaly-bit` key that can be passed to the `options` param of the `/api/v1/data` REST API. -# Install required packages for the netdata user -pip3 install --user netdata-pandas==0.0.38 numba==0.50.1 scikit-learn==0.23.2 pyod==0.8.3 -``` +For example, here are some recent raw dimension values for `system.ip` on our [london](http://london.my-netdata.io/) demo server: -> If the `pip3` command fails, you need to install it. For example, on an Ubuntu system, use `sudo apt install -> python3-pip`. +[`https://london.my-netdata.io/api/v1/data?chart=system.ip`](https://london.my-netdata.io/api/v1/data?chart=system.ip) -Use `exit` to become your normal user again. +``` +{ + "labels": ["time", "received", "sent"], + "data": + [ + [ 1638365672, 54.84098, -76.70201], + [ 1638365671, 124.4328, -309.7543], + [ 1638365670, 123.73152, -167.9056], + ... + ] +} +``` -## Enable the anomalies collector +And if we add the `&options=anomaly-bit` params, we can see the "anomaly bit" value corresponding to each raw dimension value: -Navigate to your [Netdata config directory](/docs/configure/nodes.md#the-netdata-config-directory) and use `edit-config` -to open the `python.d.conf` file. +[`https://london.my-netdata.io/api/v1/data?chart=system.ip&options=anomaly-bit`](https://london.my-netdata.io/api/v1/data?chart=system.ip&options=anomaly-bit) -```bash -sudo ./edit-config python.d.conf ``` +{ + "labels": ["time", "received", "sent"], + "data": + [ + [ 1638365672, 0, 0], + [ 1638365671, 0, 0], + [ 1638365670, 0, 0], + ... + ] +} +``` +In this example, the dimensions "received" and "sent" didn't show any abnormal behavior, so the anomaly bit is zero. +Under normal circumstances, the anomaly bit will mostly be 0. However, there can be random fluctuations setting the anomaly to 100, although this very much depends on the nature of the dimension in question. + +### Anomaly Rate - average(anomaly bit) -In `python.d.conf` file, search for the `anomalies` line. If the line exists, set the value to `yes`. Add the line -yourself if it doesn't already exist. Either way, the final result should look like: +Once all models have been trained, we can think of the Netdata dashboard as essentially a big matrix or table of 0's and 100's. If we consider this "anomaly bit"-based representation of the state of the node, we can now think about how we might detect overall node level anomalies. The figure below illustrates the main ideas. -```conf -anomalies: yes ``` + dimensions +time d1 d2 d3 d4 d5 NAR + 1 0 0 0 0 0 0% + 2 0 0 0 0 100 20% + 3 0 0 0 0 0 0% + 4 0 100 0 0 0 20% + 5 100 0 0 0 0 20% + 6 0 100 100 0 100 60% + 7 0 100 0 100 0 40% + 8 0 0 0 0 100 20% + 9 0 0 100 100 0 40% + 10 0 0 0 0 0 0% + +DAR 10% 30% 20% 20% 30% 22% NAR_t1-t10 + +DAR = Dimension Anomaly Rate +NAR = Node Anomaly Rate +NAR_t1-t10 = Node Anomaly Rate over t1 to t10 +``` + +To work out an ["anomaly rate"](#anomaly-rate), we can just average a row or a column in any direction. For example, if we were to just average along a row then this would be the ["node anomaly rate"](#node-anomaly-rate) (all dimensions) at time t. Likewise if we averaged a column then we would have the ["dimension anomaly rate"](#dimension-anomaly-rate) for each dimension over the time window t=1-10. Extending this idea, we can work out an overall ["anomaly rate"](#anomaly-rate) for the whole matrix or any subset of it we might be interested in. + +### Anomaly Detector - Node level anomaly events + +An ["anomaly detector"](#anomaly-detector) looks at all anomaly bits of a node. Netdata's anomaly detector produces an ["anomaly event"](#anomaly-event) when a the percentage of anomaly bits is high enough for a persistent amount of time. This anomaly event signals that there was sufficient evidence among all the anomaly bits that some strange behavior might have been detected in a more global sense across the node. + +Essentially if the ["Node Anomaly Rate"](#node-anomaly-rate) (NAR) passes a defined threshold and stays above that threshold for a persistent amount of time, a "Node [Anomaly Event](#anomaly-event)" will be triggered. -[Restart the Agent](/docs/configure/start-stop-restart.md) with `sudo systemctl restart netdata`, or the [appropriate -method](/docs/configure/start-stop-restart.md) for your system, to start up the anomalies collector. By default, the -model training process runs every 30 minutes, and uses the previous 4 hours of metrics to establish a baseline for -health and performance across the default included charts. +These anomaly events are currently exposed via `/api/v1/anomaly_events` -> 💡 The anomaly collector may need 30-60 seconds to finish its initial training and have enough data to start -> generating anomaly scores. You may need to refresh your browser tab for the **Anomalies** section to appear in menus -> on both the local Agent dashboard or Netdata Cloud. +**Note**: Clicking the link below will likely return an empty list of `[]`. This is the response when no anomaly events exist in the specified range. The example response below is illustrative of what the response would be when one or more anomaly events exist within the range of `after` to `before`. -## Configure the anomalies collector +https://london.my-netdata.io/api/v1/anomaly_events?after=1638365182000&before=1638365602000 -Open `python.d/anomalies.conf` with `edit-conf`. +If an event exists within the window, the result would be a list of start and end times. -```bash -sudo ./edit-config python.d/anomalies.conf ``` +[ + [ + 1638367788, + 1638367851 + ] +] +``` + +Information about each anomaly event can then be found at the `/api/v1/anomaly_event_info` endpoint (making sure to pass the `after` and `before` params): + +**Note**: If you click the below url you will get a `null` since no such anomaly event exists as the response is just an illustrative example taken from a node that did have such an anomaly event. -The file contains many user-configurable settings with sane defaults. Here are some important settings that don't -involve tweaking the behavior of the ML training itself. - -- `charts_regex`: Which charts to train models for and run anomaly detection on, with each chart getting a separate - model. -- `charts_to_exclude`: Specific charts, selected by the regex in `charts_regex`, to exclude. -- `train_every_n`: How often to train the ML models. -- `train_n_secs`: The number of historical observations to train each model on. The default is 4 hours, but if your node - doesn't have historical metrics going back that far, consider [changing the metrics retention - policy](/docs/store/change-metrics-storage.md) or reducing this window. -- `custom_models`: A way to define custom models that you want anomaly probabilities for, including multi-node or - streaming setups. - -> ⚠️ Setting `charts_regex` with many charts or `train_n_secs` to a very large number will have an impact on the -> resources and time required to train a model for every chart. The actual performance implications depend on the -> resources available on your node. If you plan on changing these settings beyond the default, or what's mentioned in -> this guide, make incremental changes to observe the performance impact. Considering `train_max_n` to cap the number of -> observations actually used to train on. - -### Run anomaly detection on Nginx and log file metrics - -As mentioned above, this guide uses an Nginx web server to demonstrate how the anomalies collector works. You must -configure the collector to monitor charts from the -[Nginx](https://learn.netdata.cloud/docs/agent/collectors/go.d.plugin/modules/nginx) and [web -log](https://learn.netdata.cloud/docs/agent/collectors/go.d.plugin/modules/weblog) collectors. - -`charts_regex` allows for some basic regex, such as wildcards (`*`) to match all contexts with a certain pattern. For -example, `system\..*` matches with any chart with a context that begins with `system.`, and ends in any number of other -characters (`.*`). Note the escape character (`\`) around the first period to capture a period character exactly, and -not any character. - -Change `charts_regex` in `anomalies.conf` to the following: - -```conf - charts_regex: 'system\..*|nginx_local\..*|web_log_nginx\..*|apps.cpu|apps.mem' +https://london.my-netdata.io/api/v1/anomaly_event_info?after=1638367788&before=1638367851 + +``` +[ + [ + 0.66, + "netdata.response_time|max" + ], + [ + 0.63, + "netdata.response_time|average" + ], + [ + 0.54, + "netdata.requests|requests" + ], + ... ``` -This value tells the anomaly collector to train against every `system.` chart, every `nginx_local` chart, every -`web_log_nginx` chart, and specifically the `apps.cpu` and `apps.mem` charts. +The query returns a list of dimension anomaly rates for all dimensions that were considered part of the detected anomaly event. - +**Note**: We plan to build additional anomaly detection and exploration features into both Netdata Agent and Netdata Cloud. The current endpoints are still under active development to power the upcoming features. -### Remove some metrics from anomaly detection +## Configuration -As you can see in the above screenshot, this node is now looking for anomalies in many places. The result is a single -`anomalies_local.probability` chart with more than twenty dimensions, some of which the dashboard hides at the bottom of -a scroll-able area. In addition, training and analyzing the anomaly collector on many charts might require more CPU -utilization that you're willing to give. +To enable anomaly detection: +1. Find and open the Netdata configuration file `netdata.conf`. +2. In the `[ml]` section, set `enabled = yes`. +3. Restart netdata (typically `sudo systemctl restart netdata`). -First, explicitly declare which `system.` charts to monitor rather than of all of them using regex (`system\..*`). +**Note**: If you would like to learn more about configuring Netdata please see [the configuration guide](https://learn.netdata.cloud/guides/step-by-step/step-04). -```conf - charts_regex: 'system\.cpu|system\.load|system\.io|system\.net|system\.ram|nginx_local\..*|web_log_nginx\..*|apps.cpu|apps.mem' +Below is a list of all the available configuration params and their default values. + +``` +[ml] + # enabled = no + # maximum num samples to train = 14400 + # minimum num samples to train = 3600 + # train every = 3600 + # num samples to diff = 1 + # num samples to smooth = 3 + # num samples to lag = 5 + # maximum number of k-means iterations = 1000 + # dimension anomaly score threshold = 0.99 + # host anomaly rate threshold = 0.01000 + # minimum window size = 30.00000 + # maximum window size = 600.00000 + # idle window size = 30.00000 + # window minimum anomaly rate = 0.25000 + # anomaly event min dimension rate threshold = 0.05000 + # hosts to skip from training = !* + # charts to skip from training = !system.* !cpu.* !mem.* !disk.* !disk_* !ip.* !ipv4.* !ipv6.* !net.* !net_* !netfilter.* !services.* !apps.* !groups.* !user.* !ebpf.* !netdata.* * ``` -Next, remove some charts with the `charts_to_exclude` setting. For this example, using an Nginx web server, focus on the -volume of requests/responses, not, for example, which type of 4xx response a user might receive. +### Descriptions (min/max) -```conf - charts_to_exclude: 'web_log_nginx.excluded_requests,web_log_nginx.responses_by_status_code_class,web_log_nginx.status_code_class_2xx_responses,web_log_nginx.status_code_class_4xx_responses,web_log_nginx.current_poll_uniq_clients,web_log_nginx.requests_by_http_method,web_log_nginx.requests_by_http_version,web_log_nginx.requests_by_ip_proto' -``` +- `enabled`: `yes` to enable, `no` to disable. +- `maximum num samples to train`: (`3600`/`21600`) This is the maximum amount of time you would like to train each model on. For example, the default of `14400` trains on the preceding 4 hours of data, assuming an `update every` of 1 second. +- `minimum num samples to train`: (`900`/`21600`) This is the minimum amount of data required to be able to train a model. For example, the default of `3600` implies that once at least 1 hour of data is available for training, a model is trained, otherwise it is skipped and checked again at the next training run. +- `train every`: (`1800`/`21600`) This is how often each model will be retrained. For example, the default of `3600` means that each model is retrained every hour. Note: The training of all models is spread out across the `train every` period for efficiency, so in reality, it means that each model will be trained in a staggered manner within each `train every` period. +- `num samples to diff`: (`0`/`1`) This is a `0` or `1` to determine if you want the model to operate on differences of the raw data or just the raw data. For example, the default of `1` means that we take differences of the raw values. Using differences is more general and works on dimensions that might naturally tend to have some trends or cycles in them that is normal behavior to which we don't want to be too sensitive. +- `num samples to smooth`: (`0`/`5`) This is a small integer that controls the amount of smoothing applied as part of the feature processing used by the model. For example, the default of `3` means that the rolling average of the last 3 values is used. Smoothing like this helps the model be a little more robust to spiky types of dimensions that naturally "jump" up or down as part of their normal behavior. +- `num samples to lag`: (`0`/`5`) This is a small integer that determines how many lagged values of the dimension to include in the feature vector. For example, the default of `5` means that in addition to the most recent (by default, differenced and smoothed) value of the dimension, the feature vector will also include the 5 previous values too. Using lagged values in our feature representation allows the model to work over strange patterns over recent values of a dimension as opposed to just focusing on if the most recent value itself is big or small enough to be anomalous. +- `maximum number of k-means iterations`: This is a parameter that can be passed to the model to limit the number of iterations in training the k-means model. Vast majority of cases can ignore and leave as default. +- `dimension anomaly score threshold`: (`0.01`/`5.00`) This is the threshold at which an individual dimension at a specific timestep is considered anomalous or not. For example, the default of `0.99` means that a dimension with an anomaly score of 99% or higher is flagged as anomalous. This is a normalized probability based on the training data, so the default of 99% means that anything that is as strange (based on distance measure) or more strange as the most strange 1% of data observed during training will be flagged as anomalous. If you wanted to make the anomaly detection on individual dimensions more sensitive you could try a value like `0.90` (90%) or to make it less sensitive you could try `1.5` (150%). +- `host anomaly rate threshold`: (`0.0`/`1.0`) This is the percentage of dimensions (based on all those enabled for anomaly detection) that need to be considered anomalous at specific timestep for the host itself to be considered anomalous. For example, the default value of `0.01` means that if more than 1% of dimensions are anomalous at the same time then the host itself is considered in an anomalous state. +- `minimum window size`: The Netdata "Anomaly Detector" logic works over a rolling window of data. This parameter defines the minimum length of window to consider. If over this window the host is in an anomalous state then an anomaly detection event will be triggered. For example, the default of `30` means that the detector will initially work over a rolling window of 30 seconds. Note: The length of this window will be dynamic once an anomaly event has been triggered such that it will expand as needed until either the max length of an anomaly event is hit or the host settles back into a normal state with sufficiently decreased host level anomaly states in the rolling window. Note: If you wanted to adjust the higher level anomaly detector behavior then this is one parameter you might adjust to see the impact of on anomaly detection events. +- `maximum window size`: This parameter defines the maximum length of window to consider. If an anomaly event reaches this size, it will be closed. This is to provide an upper bound on the length of an anomaly event and cost of the anomaly detector logic for that event. +- `window minimum anomaly rate`: (`0.0`/`1.0`) This parameter corresponds to a threshold on the percentage of time in the rolling window that the host was considered in an anomalous state. For example, the default of `0.25` means that if the host is in an anomalous state for 25% of more of the rolling window then and anomaly event will be triggered or extended if one is already active. Note: If you want to make the anomaly detector itself less sensitive, you can adjust this value to something like `0.75` which would mean the host needs to be much more consistently in an anomalous state to trigger an anomaly detection event. Likewise, a lower value like `0.1` would make the anomaly detector more sensitive. +- `anomaly event min dimension rate threshold`: (`0.0`/`1.0`) This is a parameter that helps filter out irrelevant dimensions from anomaly events. For example, the default of `0.05` means that only dimensions that were considered anomalous for at least 5% of the anomaly event itself will be included in that anomaly event. The idea here is to just include dimensions that were consistently anomalous as opposed to those that may have just randomly happened to be anomalous at the same time. +- `hosts to skip from training`: This parameter allows you to turn off anomaly detection for any child hosts on a parent host by defining those you would like to skip from training here. For example, a value like `dev-*` skips all hosts on a parent that begin with the "dev-" prefix. The default value of `!*` means "don't skip any". +- `charts to skip from training`: This parameter allows you to exclude certain charts from anomaly detection by defining them here. By default, all charts, apart from a specific allow list of the typical basic Netdata charts, are excluded. If you have additional charts you would like to include for anomaly detection, you can add them here. **Note**: It is recommended to add charts in small groups and then measure any impact on performance before adding additional ones. + +## Charts + +Once enabled, the "Anomaly Detection" menu and charts will be available on the dashboard. + +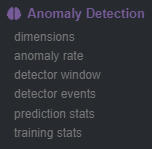 + +In terms of anomaly detection, the most interesting charts would be the `anomaly_detection.dimensions` and `anomaly_detection.anomaly_rate` ones, which hold the `anomalous` and `anomaly_rate` dimensions that show the overall number of dimensions considered anomalous at any time and the corresponding anomaly rate. + +- `anomaly_detection.dimensions`: Total count of dimensions considered anomalous or normal. +- `anomaly_detection.dimensions`: Percentage of anomalous dimensions. +- `anomaly_detection.detector_window`: The length of the active window used by the detector. +- `anomaly_detection.detector_events`: Flags (0 or 1) to show when an anomaly event has been triggered by the detector. +- `anomaly_detection.prediction_stats`: Diagnostic metrics relating to prediction time of anomaly detection. +- `anomaly_detection.training_stats`: Diagnostic metrics relating to training time of anomaly detection. + +Below is an example of how these charts may look in the presence of an anomaly event. + +Initially we see a jump in `anomalous` dimensions: + +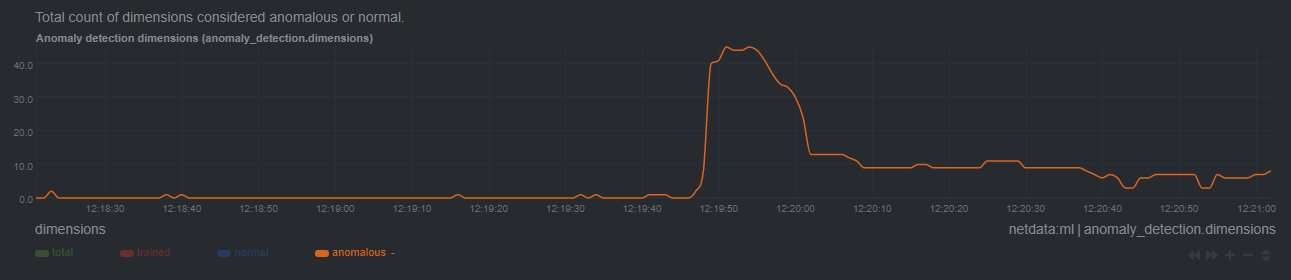 + +And a corresponding jump in the `anomaly_rate`: + +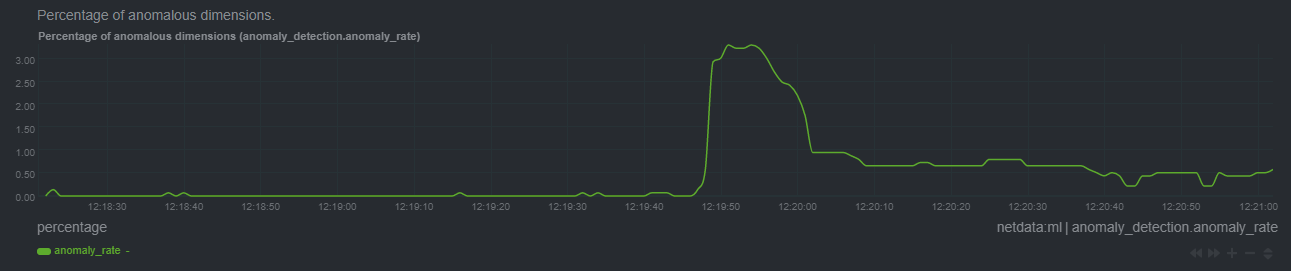 + +After a short while the rolling node anomaly rate goes `above_threshold`, and once it stays above threshold for long enough a `new_anomaly_event` is created: + +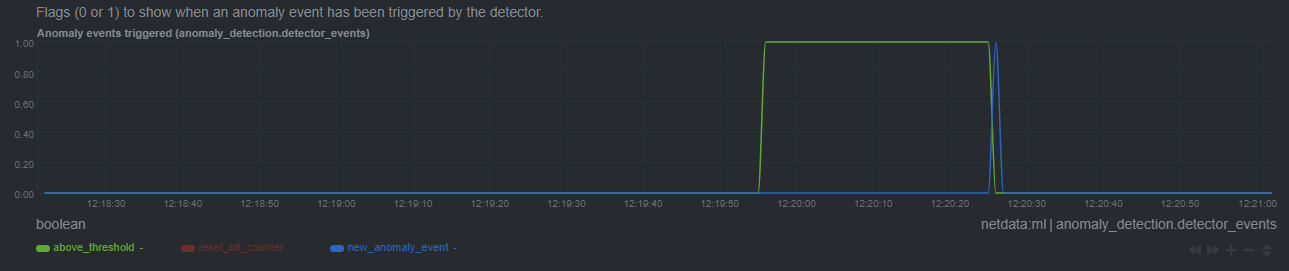 + +## Glossary + +#### _feature vector_ + +A [feature vector](https://en.wikipedia.org/wiki/Feature_(machine_learning)) is what the ML model is trained on and uses for prediction. The most simple feature vector would be just the latest raw dimension value itself [x]. By default Netdata will use a feature vector consisting of the 6 latest differences and smoothed values of the dimension so conceptually something like `[avg3(diff1(x-5)), avg3(diff1(x-4)), avg3(diff1(x-3)), avg3(diff1(x-2)), avg3(diff1(x-1)), avg3(diff1(x))]` which ends up being just 6 floating point numbers that try and represent the "shape" of recent data. + +#### _anomaly score_ + +At prediction time the anomaly score is just the distance of the most recent feature vector to the trained cluster centers of the model, which are themselves just feature vectors, albeit supposedly the best most representative feature vectors that could be "learned" from the training data. So if the most recent feature vector is very far away in terms of [euclidean distance](https://en.wikipedia.org/wiki/Euclidean_distance#:~:text=In%20mathematics%2C%20the%20Euclidean%20distance,being%20called%20the%20Pythagorean%20distance.) it's more likely that the recent data it represents consists of some strange pattern not commonly found in the training data. + +#### _anomaly bit_ + +If the anomaly score is greater than a specified threshold then the most recent feature vector, and hence most recent raw data, is considered anomalous. Since storing the raw anomaly score would essentially double amount of storage space Netdata would need, we instead efficiently store just the anomaly bit in the existing internal Netdata data representation without any additional storage overhead. + +#### _anomaly rate_ + +An anomaly rate is really just an average over one or more anomaly bits. An anomaly rate can be calculated over time for one or more dimensions or at a point in time across multiple dimensions, or some combination of the two. Its just an average of some collection of anomaly bits. + +#### _anomaly detector_ - +The is essentially business logic that just tries to process a collection of anomaly bits to determine if there is enough active anomaly bits to merit investigation or declaration of a node level anomaly event. -Apply the ideas behind the collector's regex and exclude settings to any other -[system](/docs/collect/system-metrics.md), [container](/docs/collect/container-metrics.md), or -[application](/docs/collect/application-metrics.md) metrics you want to detect anomalies for. +#### _anomaly event_ -## What's next? +Anomaly events are triggered by the anomaly detector and represent a window of time on the node with sufficiently elevated anomaly rates across all dimensions. -Now that you know how to set up unsupervised anomaly detection in the Netdata Agent, using an Nginx web server as an -example, it's time to apply that knowledge to other mission-critical parts of your infrastructure. If you're not sure -what to monitor next, check out our list of [collectors](/collectors/COLLECTORS.md) to see what kind of metrics Netdata -can collect from your systems, containers, and applications. +#### _dimension anomaly rate_ -Keep on moving to [part 2](/docs/guides/monitor/visualize-monitor-anomalies.md), which covers the charts and alarms -Netdata creates for unsupervised anomaly detection. +The anomaly rate of a specific dimension over some window of time. -For a different troubleshooting experience, try out the [Metric -Correlations](https://learn.netdata.cloud/docs/cloud/insights/metric-correlations) feature in Netdata Cloud. Metric -Correlations helps you perform faster root cause analysis by narrowing a dashboard to only the charts most likely to be -related to an anomaly. +#### _node anomaly rate_ -### Related reference documentation +The anomaly rate across all dimensions of a node. -- [Netdata Agent · Anomalies collector](/collectors/python.d.plugin/anomalies/README.md) -- [Netdata Agent · Nginx collector](https://learn.netdata.cloud/docs/agent/collectors/go.d.plugin/modules/nginx) -- [Netdata Agent · web log collector](https://learn.netdata.cloud/docs/agent/collectors/go.d.plugin/modules/weblog) -- [Netdata Cloud · Metric Correlations](https://learn.netdata.cloud/docs/cloud/insights/metric-correlations) +## Notes -[](<>) +- We would love to hear any feedback relating to this functionality, please email us at analytics-ml-team@netdata.cloud or come join us in the [🤖-ml-powered-monitoring](https://discord.gg/4eRSEUpJnc) channel of the Netdata discord. +- We are working on additional UI/UX based features that build on these core components to make them as useful as possible out of the box. +- Although not yet a core focus of this work, users could leverage the `anomaly_detection` chart dimensions and/or `anomaly-bit` options in defining alarms based on ML driven anomaly detection models. +- [This presentation](https://docs.google.com/presentation/d/18zkCvU3nKP-Bw_nQZuXTEa4PIVM6wppH3VUnAauq-RU/edit?usp=sharing) walks through some of the main concepts covered above in a more informal way. +- After restart Netdata will wait until `minimum num samples to train` observations of data are available before starting training and prediction. +- Netdata uses [dlib](https://github.com/davisking/dlib) under the hood for its core ML features. +- You should benchmark Netdata resource usage before and after enabling ML. Typical overhead ranges from 1-2% additional CPU at most. +- The "anomaly bit" has been implemented to be a building block to underpin many more ML based use cases that we plan to deliver soon. +- At its core Netdata uses an approach and problem formulation very similar to the Netdata python [anomalies collector](https://learn.netdata.cloud/docs/agent/collectors/python.d.plugin/anomalies), just implemented in a much much more efficient and scalable way in the agent in c++. So if you would like to learn more about the approach and are familiar with Python that is a useful resource to explore, as is the corresponding [deep dive tutorial](https://nbviewer.org/github/netdata/community/blob/main/netdata-agent-api/netdata-pandas/anomalies_collector_deepdive.ipynb) where the default model used is PCA instead of K-Means but the overall approach and formulation is similar.
\ No newline at end of file diff --git a/docs/guides/monitor/raspberry-pi-anomaly-detection.md b/docs/guides/monitor/raspberry-pi-anomaly-detection.md index 90ad763b8..029dfcbc7 100644 --- a/docs/guides/monitor/raspberry-pi-anomaly-detection.md +++ b/docs/guides/monitor/raspberry-pi-anomaly-detection.md @@ -1,4 +1,4 @@ -<!-- +--- title: "Unsupervised anomaly detection for Raspberry Pi monitoring" description: "Use a low-overhead machine learning algorithm and an open-source monitoring tool to detect anomalous metrics on a Raspberry Pi." image: /img/seo/guides/monitor/raspberry-pi-anomaly-detection.png @@ -6,9 +6,7 @@ author: "Andy Maguire" author_title: "Senior Machine Learning Engineer" author_img: "/img/authors/andy-maguire.jpg" custom_edit_url: https://github.com/netdata/netdata/edit/master/docs/guides/monitor/raspberry-pi-anomaly-detection.md ---> - -# Unsupervised anomaly detection for Raspberry Pi monitoring +--- We love IoT and edge at Netdata, we also love machine learning. Even better if we can combine the two to ease the pain of monitoring increasingly complex systems. @@ -110,7 +108,7 @@ looks like a potentially useful addition to enable unsupervised anomaly detectio See our two-part guide series for a more complete picture of configuring the anomalies collector, plus some best practices on using the charts it automatically generates: -- [_Detect anomalies in systems and applications_](/docs/guides/monitor/anomaly-detection.md) +- [_Detect anomalies in systems and applications_](/docs/guides/monitor/anomaly-detection-python.md) - [_Monitor and visualize anomalies with Netdata_](/docs/guides/monitor/visualize-monitor-anomalies.md) If you're using your Raspberry Pi for other purposes, like blocking ads/trackers with Pi-hole, check out our companions diff --git a/docs/guides/monitor/visualize-monitor-anomalies.md b/docs/guides/monitor/visualize-monitor-anomalies.md index 681ba8390..9eace5232 100644 --- a/docs/guides/monitor/visualize-monitor-anomalies.md +++ b/docs/guides/monitor/visualize-monitor-anomalies.md @@ -1,4 +1,4 @@ -<!-- +--- title: "Monitor and visualize anomalies with Netdata (part 2)" description: "Using unsupervised anomaly detection and machine learning, get notified " image: /img/seo/guides/monitor/visualize-monitor-anomalies.png @@ -6,13 +6,11 @@ author: "Joel Hans" author_title: "Editorial Director, Technical & Educational Resources" author_img: "/img/authors/joel-hans.jpg" custom_edit_url: https://github.com/netdata/netdata/edit/master/docs/guides/monitor/visualize-monitor-anomalies.md ---> - -# Monitor and visualize anomalies with Netdata (part 2) +--- Welcome to part 2 of our series of guides on using _unsupervised anomaly detection_ to detect issues with your systems, containers, and applications using the open-source Netdata Agent. For an introduction to detecting anomalies and -monitoring associated metrics, see [part 1](/docs/guides/monitor/anomaly-detection.md), which covers prerequisites and +monitoring associated metrics, see [part 1](/docs/guides/monitor/anomaly-detection-python.md), which covers prerequisites and configuration basics. With anomaly detection in the Netdata Agent set up, you will now want to visualize and monitor which charts have @@ -50,8 +48,8 @@ analysis (RCA). The anomalies collector creates two "classes" of alarms for each chart captured by the `charts_regex` setting. All these alarms are preconfigured based on your [configuration in -`anomalies.conf`](/docs/guides/monitor/anomaly-detection.md#configure-the-anomalies-collector). With the `charts_regex` -and `charts_to_exclude` settings from [part 1](/docs/guides/monitor/anomaly-detection.md) of this guide series, the +`anomalies.conf`](/docs/guides/monitor/anomaly-detection-python.md#configure-the-anomalies-collector). With the `charts_regex` +and `charts_to_exclude` settings from [part 1](/docs/guides/monitor/anomaly-detection-python.md) of this guide series, the Netdata Agent creates 32 alarms driven by unsupervised anomaly detection. The first class triggers warning alarms when the average anomaly probability for a given chart has stayed above 50% for @@ -81,7 +79,7 @@ alarms for any dimension on the `anomalies_local.probability` and `anomalies_loc In either [Netdata Cloud](https://app.netdata.cloud) or the local Agent dashboard at `http://NODE:19999`, click on the **Anomalies** [section](/web/gui/README.md#sections) to see the pair of anomaly detection charts, which are preconfigured to visualize per-second anomaly metrics based on your [configuration in -`anomalies.conf`](/docs/guides/monitor/anomaly-detection.md#configure-the-anomalies-collector). +`anomalies.conf`](/docs/guides/monitor/anomaly-detection-python.md#configure-the-anomalies-collector). These charts have the contexts `anomalies.probability` and `anomalies.anomaly`. Together, these charts create meaningful visualizations for immediately recognizing not only that something is going wrong on your node, but @@ -90,7 +88,7 @@ give context as to where to look next. The `anomalies_local.probability` chart shows the probability that the latest observed data is anomalous, based on the trained model. The `anomalies_local.anomaly` chart visualizes 0→1 predictions based on whether the latest observed data is anomalous based on the trained model. Both charts share the same dimensions, which you configured via -`charts_regex` and `charts_to_exclude` in [part 1](/docs/guides/monitor/anomaly-detection.md). +`charts_regex` and `charts_to_exclude` in [part 1](/docs/guides/monitor/anomaly-detection-python.md). In other words, the `probability` chart shows the amplitude of the anomaly, whereas the `anomaly` chart provides quick yes/no context. @@ -126,7 +124,7 @@ the dashboard into only the charts relevant to what you're seeing from the anoma ## What's next? -Between this guide and [part 1](/docs/guides/monitor/anomaly-detection.md), which covered setup and configuration, you +Between this guide and [part 1](/docs/guides/monitor/anomaly-detection-python.md), which covered setup and configuration, you now have a fundamental understanding of how unsupervised anomaly detection in Netdata works, from root cause to alarms to preconfigured or custom dashboards. diff --git a/docs/netdata-security.md b/docs/netdata-security.md index 42dd0415f..bb4ac30c4 100644 --- a/docs/netdata-security.md +++ b/docs/netdata-security.md @@ -13,11 +13,11 @@ We have given special attention to all aspects of Netdata, ensuring that everyth 2. [Your systems are safe with Netdata](#your-systems-are-safe-with-netdata) 3. [Netdata is read-only](#netdata-is-read-only) 4. [Netdata viewers authentication](#netdata-viewers-authentication) - - [Why Netdata should be protected](#why-netdata-should-be-protected) - - [Protect Netdata from the internet](#protect-netdata-from-the-internet) - \- [Expose Netdata only in a private LAN](#expose-netdata-only-in-a-private-lan) - \- [Use an authenticating web server in proxy mode](#use-an-authenticating-web-server-in-proxy-mode) - \- [Other methods](#other-methods) + * [Why Netdata should be protected](#why-netdata-should-be-protected) + * [Protect Netdata from the internet](#protect-netdata-from-the-internet) + * [Expose Netdata only in a private LAN](#expose-netdata-only-in-a-private-lan) + * [Use an authenticating web server in proxy mode](#use-an-authenticating-web-server-in-proxy-mode) + * [Other methods](#other-methods) 5. [Registry or how to not send any information to a third party server](#registry-or-how-to-not-send-any-information-to-a-third-party-server) ## Your data is safe with Netdata @@ -34,7 +34,7 @@ This means that Netdata can safely be used in environments that require the high We are very proud that **the Netdata daemon runs as a normal system user, without any special privileges**. This is quite an achievement for a monitoring system that collects all kinds of system and application metrics. -There are a few cases however that raw source data are only exposed to processes with escalated privileges. To support these cases, Netdata attempts to minimize and completely isolate the code that runs with escalated privileges. +There are a few cases, however, that raw source data are only exposed to processes with escalated privileges. To support these cases, Netdata attempts to minimize and completely isolate the code that runs with escalated privileges. So, Netdata **plugins**, even those running with escalated capabilities or privileges, perform a **hard coded data collection job**. They do not accept commands from Netdata. The communication is strictly **unidirectional**: from the plugin towards the Netdata daemon. The original application data collected by each plugin do not leave the process they are collected, are not saved and are not transferred to the Netdata daemon. The communication from the plugins to the Netdata daemon includes only chart metadata and processed metric values. diff --git a/health/REFERENCE.md b/health/REFERENCE.md index f1bb5557d..66ccf88da 100644 --- a/health/REFERENCE.md +++ b/health/REFERENCE.md @@ -679,7 +679,7 @@ Check the `health/health.d/` directory for all alarms shipped with Netdata. Here are a few examples: -### Example 1 +### Example 1 - check server alive A simple check if an apache server is alive: @@ -739,7 +739,7 @@ If these result in non-zero or true, they trigger the alarm. So, the warning condition checks if we have not collected data from apache for 5 iterations and the critical condition checks for 10 iterations. -### Example 2 +### Example 2 - disk space Check if any of the disks is critically low on disk space: @@ -760,7 +760,7 @@ So, the `calc` line finds the percentage of used space. `$this` resolves to this This is a repeating alarm and if the alarm becomes CRITICAL it repeats the notifications every 10 seconds. It also repeats notifications every 2 minutes if the alarm goes into WARNING mode. -### Example 3 +### Example 3 - disk fill rate Predict if any disk will run out of space in the near future. @@ -803,7 +803,7 @@ Once this alarm triggers we will receive an email like this:  -### Example 4 +### Example 4 - dropped packets Check if any network interface is dropping packets: @@ -823,7 +823,7 @@ Note that the drops chart does not exist if a network interface has never droppe When Netdata detects a dropped packet, it will add the chart and it will automatically attach this alarm to it. -### Example 5 +### Example 5 - CPU usage Check if user or system dimension is using more than 50% of cpu: @@ -842,7 +842,7 @@ The `lookup` line will calculate the average CPU usage from system and user in t the foreach in the `lookup` line, Netdata will create two independent alarms called `dim_template_system` and `dim_template_user` that will have all the other parameters shared among them. -### Example 6 +### Example 6 - CPU usage Check if all dimensions are using more than 50% of cpu: @@ -860,6 +860,32 @@ lookup: average -3s percentage foreach * The `lookup` line will calculate the average of CPU usage from system and user in the last 3 seconds. In this case Netdata will create alarms for all dimensions of the chart. +### Example 7 - Z-Score based alarm + +Derive a "[Z Score](https://en.wikipedia.org/wiki/Standard_score)" based alarm on `user` dimension of the `system.cpu` chart: + +```yaml + alarm: cpu_user_mean + on: system.cpu +lookup: mean -60s of user + every: 10s + + alarm: cpu_user_stddev + on: system.cpu +lookup: stddev -60s of user + every: 10s + + alarm: cpu_user_zscore + on: system.cpu +lookup: mean -10s of user + calc: ($this - $cpu_user_mean) / $cpu_user_stddev + every: 10s + warn: $this < -2 or $this > 2 + crit: $this < -3 or $this > 3 +``` + +Since [`z = (x - mean) / stddev`](https://en.wikipedia.org/wiki/Standard_score) we create two input alarms, one for `mean` and one for `stddev` and then use them both as inputs in our final `cpu_user_zscore` alarm. + ## Troubleshooting You can compile Netdata with [debugging](/daemon/README.md#debugging) and then set in `netdata.conf`: diff --git a/health/health.d/swap.conf b/health/health.d/swap.conf index 03c319320..d30c74cee 100644 --- a/health/health.d/swap.conf +++ b/health/health.d/swap.conf @@ -25,7 +25,7 @@ component: Memory component: Memory os: linux freebsd hosts: * - calc: ($used + $free) > 0 ? ($used * 100 / ($used + $free)) : 0 + calc: (($used + $free) > 0) ? ($used * 100 / ($used + $free)) : 0 units: % every: 10s warn: $this > (($status >= $WARNING) ? (80) : (90)) diff --git a/ml/README.md b/ml/README.md new file mode 100644 index 000000000..06f099fc2 --- /dev/null +++ b/ml/README.md @@ -0,0 +1,264 @@ +# Machine learning (ML) powered anomaly detection + +## Overview + +As of [`v1.32.0`](https://github.com/netdata/netdata/releases/tag/v1.32.0), Netdata comes with some ML powered [anomaly detection](https://en.wikipedia.org/wiki/Anomaly_detection) capabilities built into it and available to use out of the box, with minimal configuration required. + +🚧 **Note**: This functionality is still under active development and considered experimental. Changes might cause the feature to break. We dogfood it internally and among early adopters within the Netdata community to build the feature. If you would like to get involved and help us with some feedback, email us at analytics-ml-team@netdata.cloud or come join us in the [🤖-ml-powered-monitoring](https://discord.gg/4eRSEUpJnc) channel of the Netdata discord. + +Once ML is enabled, Netdata will begin training a model for each dimension. By default this model is a [k-means clustering](https://en.wikipedia.org/wiki/K-means_clustering) model trained on the most recent 4 hours of data. Rather than just using the most recent value of each raw metric, the model works on a preprocessed ["feature vector"](#feature-vector) of recent smoothed and differenced values. This should enable the model to detect a wider range of potentially anomalous patterns in recent observations as opposed to just point anomalies like big spikes or drops. ([This infographic](https://user-images.githubusercontent.com/2178292/144414415-275a3477-5b47-43d6-8959-509eb48ebb20.png) shows some different types of anomalies.) + +The sections below will introduce some of the main concepts: +- anomaly bit +- anomaly score +- anomaly rate +- anomaly detector + +Additional explanations and details can be found in the [Glossary](#glossary) and [Notes](#notes) at the bottom of the page. + +### Anomaly Bit - (100 = Anomalous, 0 = Normal) + +Once each model is trained, Netdata will begin producing an ["anomaly score"](#anomaly-score) at each time step for each dimension. This ["anomaly score"](#anomaly-score) is essentially a distance measure to the trained cluster centers of the model (by default each model has k=2, so two cluster centers are learned). More anomalous looking data should be more distant to those cluster centers. If this ["anomaly score"](#anomaly-score) is sufficiently large, this is a sign that the recent raw values of the dimension could potentially be anomalous. By default, "sufficiently large" means that the distance is in the 99th percentile or above of all distances observed during training or, put another way, it has to be further away than the furthest 1% of the data used during training. Once this threshold is passed, the ["anomaly bit"](#anomaly-bit) corresponding to that dimension is set to 100 to flag it as anomalous, otherwise it would be left at 0 to signal normal data. + +What this means is that in addition to the raw value of each metric, Netdata now also stores an ["anomaly bit"](#anomaly-bit) that is either 100 (anomalous) or 0 (normal). Importantly, this is achieved without additional storage overhead due to how the anomaly bit has been implemented within the existing internal Netdata storage representation. + +This ["anomaly bit"](#anomaly-bit) is exposed via the `anomaly-bit` key that can be passed to the `options` param of the `/api/v1/data` REST API. + +For example, here are some recent raw dimension values for `system.ip` on our [london](http://london.my-netdata.io/) demo server: + +[`https://london.my-netdata.io/api/v1/data?chart=system.ip`](https://london.my-netdata.io/api/v1/data?chart=system.ip) + +``` +{ + "labels": ["time", "received", "sent"], + "data": + [ + [ 1638365672, 54.84098, -76.70201], + [ 1638365671, 124.4328, -309.7543], + [ 1638365670, 123.73152, -167.9056], + ... + ] +} +``` + +And if we add the `&options=anomaly-bit` params, we can see the "anomaly bit" value corresponding to each raw dimension value: + +[`https://london.my-netdata.io/api/v1/data?chart=system.ip&options=anomaly-bit`](https://london.my-netdata.io/api/v1/data?chart=system.ip&options=anomaly-bit) + +``` +{ + "labels": ["time", "received", "sent"], + "data": + [ + [ 1638365672, 0, 0], + [ 1638365671, 0, 0], + [ 1638365670, 0, 0], + ... + ] +} +``` +In this example, the dimensions "received" and "sent" didn't show any abnormal behavior, so the anomaly bit is zero. +Under normal circumstances, the anomaly bit will mostly be 0. However, there can be random fluctuations setting the anomaly to 100, although this very much depends on the nature of the dimension in question. + +### Anomaly Rate - average(anomaly bit) + +Once all models have been trained, we can think of the Netdata dashboard as essentially a big matrix or table of 0's and 100's. If we consider this "anomaly bit"-based representation of the state of the node, we can now think about how we might detect overall node level anomalies. The figure below illustrates the main ideas. + +``` + dimensions +time d1 d2 d3 d4 d5 NAR + 1 0 0 0 0 0 0% + 2 0 0 0 0 100 20% + 3 0 0 0 0 0 0% + 4 0 100 0 0 0 20% + 5 100 0 0 0 0 20% + 6 0 100 100 0 100 60% + 7 0 100 0 100 0 40% + 8 0 0 0 0 100 20% + 9 0 0 100 100 0 40% + 10 0 0 0 0 0 0% + +DAR 10% 30% 20% 20% 30% 22% NAR_t1-t10 + +DAR = Dimension Anomaly Rate +NAR = Node Anomaly Rate +NAR_t1-t10 = Node Anomaly Rate over t1 to t10 +``` + +To work out an ["anomaly rate"](#anomaly-rate), we can just average a row or a column in any direction. For example, if we were to just average along a row then this would be the ["node anomaly rate"](#node-anomaly-rate) (all dimensions) at time t. Likewise if we averaged a column then we would have the ["dimension anomaly rate"](#dimension-anomaly-rate) for each dimension over the time window t=1-10. Extending this idea, we can work out an overall ["anomaly rate"](#anomaly-rate) for the whole matrix or any subset of it we might be interested in. + +### Anomaly Detector - Node level anomaly events + +An ["anomaly detector"](#anomaly-detector) looks at all anomaly bits of a node. Netdata's anomaly detector produces an ["anomaly event"](#anomaly-event) when a the percentage of anomaly bits is high enough for a persistent amount of time. This anomaly event signals that there was sufficient evidence among all the anomaly bits that some strange behavior might have been detected in a more global sense across the node. + +Essentially if the ["Node Anomaly Rate"](#node-anomaly-rate) (NAR) passes a defined threshold and stays above that threshold for a persistent amount of time, a "Node [Anomaly Event](#anomaly-event)" will be triggered. + +These anomaly events are currently exposed via `/api/v1/anomaly_events` + +**Note**: Clicking the link below will likely return an empty list of `[]`. This is the response when no anomaly events exist in the specified range. The example response below is illustrative of what the response would be when one or more anomaly events exist within the range of `after` to `before`. + +https://london.my-netdata.io/api/v1/anomaly_events?after=1638365182000&before=1638365602000 + +If an event exists within the window, the result would be a list of start and end times. + +``` +[ + [ + 1638367788, + 1638367851 + ] +] +``` + +Information about each anomaly event can then be found at the `/api/v1/anomaly_event_info` endpoint (making sure to pass the `after` and `before` params): + +**Note**: If you click the below url you will get a `null` since no such anomaly event exists as the response is just an illustrative example taken from a node that did have such an anomaly event. + +https://london.my-netdata.io/api/v1/anomaly_event_info?after=1638367788&before=1638367851 + +``` +[ + [ + 0.66, + "netdata.response_time|max" + ], + [ + 0.63, + "netdata.response_time|average" + ], + [ + 0.54, + "netdata.requests|requests" + ], + ... +``` + +The query returns a list of dimension anomaly rates for all dimensions that were considered part of the detected anomaly event. + +**Note**: We plan to build additional anomaly detection and exploration features into both Netdata Agent and Netdata Cloud. The current endpoints are still under active development to power the upcoming features. + +## Configuration + +To enable anomaly detection: +1. Find and open the Netdata configuration file `netdata.conf`. +2. In the `[ml]` section, set `enabled = yes`. +3. Restart netdata (typically `sudo systemctl restart netdata`). + +**Note**: If you would like to learn more about configuring Netdata please see [the configuration guide](https://learn.netdata.cloud/guides/step-by-step/step-04). + +Below is a list of all the available configuration params and their default values. + +``` +[ml] + # enabled = no + # maximum num samples to train = 14400 + # minimum num samples to train = 3600 + # train every = 3600 + # num samples to diff = 1 + # num samples to smooth = 3 + # num samples to lag = 5 + # maximum number of k-means iterations = 1000 + # dimension anomaly score threshold = 0.99 + # host anomaly rate threshold = 0.01000 + # minimum window size = 30.00000 + # maximum window size = 600.00000 + # idle window size = 30.00000 + # window minimum anomaly rate = 0.25000 + # anomaly event min dimension rate threshold = 0.05000 + # hosts to skip from training = !* + # charts to skip from training = !system.* !cpu.* !mem.* !disk.* !disk_* !ip.* !ipv4.* !ipv6.* !net.* !net_* !netfilter.* !services.* !apps.* !groups.* !user.* !ebpf.* !netdata.* * +``` + +### Descriptions (min/max) + +- `enabled`: `yes` to enable, `no` to disable. +- `maximum num samples to train`: (`3600`/`21600`) This is the maximum amount of time you would like to train each model on. For example, the default of `14400` trains on the preceding 4 hours of data, assuming an `update every` of 1 second. +- `minimum num samples to train`: (`900`/`21600`) This is the minimum amount of data required to be able to train a model. For example, the default of `3600` implies that once at least 1 hour of data is available for training, a model is trained, otherwise it is skipped and checked again at the next training run. +- `train every`: (`1800`/`21600`) This is how often each model will be retrained. For example, the default of `3600` means that each model is retrained every hour. Note: The training of all models is spread out across the `train every` period for efficiency, so in reality, it means that each model will be trained in a staggered manner within each `train every` period. +- `num samples to diff`: (`0`/`1`) This is a `0` or `1` to determine if you want the model to operate on differences of the raw data or just the raw data. For example, the default of `1` means that we take differences of the raw values. Using differences is more general and works on dimensions that might naturally tend to have some trends or cycles in them that is normal behavior to which we don't want to be too sensitive. +- `num samples to smooth`: (`0`/`5`) This is a small integer that controls the amount of smoothing applied as part of the feature processing used by the model. For example, the default of `3` means that the rolling average of the last 3 values is used. Smoothing like this helps the model be a little more robust to spiky types of dimensions that naturally "jump" up or down as part of their normal behavior. +- `num samples to lag`: (`0`/`5`) This is a small integer that determines how many lagged values of the dimension to include in the feature vector. For example, the default of `5` means that in addition to the most recent (by default, differenced and smoothed) value of the dimension, the feature vector will also include the 5 previous values too. Using lagged values in our feature representation allows the model to work over strange patterns over recent values of a dimension as opposed to just focusing on if the most recent value itself is big or small enough to be anomalous. +- `maximum number of k-means iterations`: This is a parameter that can be passed to the model to limit the number of iterations in training the k-means model. Vast majority of cases can ignore and leave as default. +- `dimension anomaly score threshold`: (`0.01`/`5.00`) This is the threshold at which an individual dimension at a specific timestep is considered anomalous or not. For example, the default of `0.99` means that a dimension with an anomaly score of 99% or higher is flagged as anomalous. This is a normalized probability based on the training data, so the default of 99% means that anything that is as strange (based on distance measure) or more strange as the most strange 1% of data observed during training will be flagged as anomalous. If you wanted to make the anomaly detection on individual dimensions more sensitive you could try a value like `0.90` (90%) or to make it less sensitive you could try `1.5` (150%). +- `host anomaly rate threshold`: (`0.0`/`1.0`) This is the percentage of dimensions (based on all those enabled for anomaly detection) that need to be considered anomalous at specific timestep for the host itself to be considered anomalous. For example, the default value of `0.01` means that if more than 1% of dimensions are anomalous at the same time then the host itself is considered in an anomalous state. +- `minimum window size`: The Netdata "Anomaly Detector" logic works over a rolling window of data. This parameter defines the minimum length of window to consider. If over this window the host is in an anomalous state then an anomaly detection event will be triggered. For example, the default of `30` means that the detector will initially work over a rolling window of 30 seconds. Note: The length of this window will be dynamic once an anomaly event has been triggered such that it will expand as needed until either the max length of an anomaly event is hit or the host settles back into a normal state with sufficiently decreased host level anomaly states in the rolling window. Note: If you wanted to adjust the higher level anomaly detector behavior then this is one parameter you might adjust to see the impact of on anomaly detection events. +- `maximum window size`: This parameter defines the maximum length of window to consider. If an anomaly event reaches this size, it will be closed. This is to provide an upper bound on the length of an anomaly event and cost of the anomaly detector logic for that event. +- `window minimum anomaly rate`: (`0.0`/`1.0`) This parameter corresponds to a threshold on the percentage of time in the rolling window that the host was considered in an anomalous state. For example, the default of `0.25` means that if the host is in an anomalous state for 25% of more of the rolling window then and anomaly event will be triggered or extended if one is already active. Note: If you want to make the anomaly detector itself less sensitive, you can adjust this value to something like `0.75` which would mean the host needs to be much more consistently in an anomalous state to trigger an anomaly detection event. Likewise, a lower value like `0.1` would make the anomaly detector more sensitive. +- `anomaly event min dimension rate threshold`: (`0.0`/`1.0`) This is a parameter that helps filter out irrelevant dimensions from anomaly events. For example, the default of `0.05` means that only dimensions that were considered anomalous for at least 5% of the anomaly event itself will be included in that anomaly event. The idea here is to just include dimensions that were consistently anomalous as opposed to those that may have just randomly happened to be anomalous at the same time. +- `hosts to skip from training`: This parameter allows you to turn off anomaly detection for any child hosts on a parent host by defining those you would like to skip from training here. For example, a value like `dev-*` skips all hosts on a parent that begin with the "dev-" prefix. The default value of `!*` means "don't skip any". +- `charts to skip from training`: This parameter allows you to exclude certain charts from anomaly detection by defining them here. By default, all charts, apart from a specific allow list of the typical basic Netdata charts, are excluded. If you have additional charts you would like to include for anomaly detection, you can add them here. **Note**: It is recommended to add charts in small groups and then measure any impact on performance before adding additional ones. + +## Charts + +Once enabled, the "Anomaly Detection" menu and charts will be available on the dashboard. + + + +In terms of anomaly detection, the most interesting charts would be the `anomaly_detection.dimensions` and `anomaly_detection.anomaly_rate` ones, which hold the `anomalous` and `anomaly_rate` dimensions that show the overall number of dimensions considered anomalous at any time and the corresponding anomaly rate. + +- `anomaly_detection.dimensions`: Total count of dimensions considered anomalous or normal. +- `anomaly_detection.dimensions`: Percentage of anomalous dimensions. +- `anomaly_detection.detector_window`: The length of the active window used by the detector. +- `anomaly_detection.detector_events`: Flags (0 or 1) to show when an anomaly event has been triggered by the detector. +- `anomaly_detection.prediction_stats`: Diagnostic metrics relating to prediction time of anomaly detection. +- `anomaly_detection.training_stats`: Diagnostic metrics relating to training time of anomaly detection. + +Below is an example of how these charts may look in the presence of an anomaly event. + +Initially we see a jump in `anomalous` dimensions: + + + +And a corresponding jump in the `anomaly_rate`: + + + +After a short while the rolling node anomaly rate goes `above_threshold`, and once it stays above threshold for long enough a `new_anomaly_event` is created: + + + +## Glossary + +#### _feature vector_ + +A [feature vector](https://en.wikipedia.org/wiki/Feature_(machine_learning)) is what the ML model is trained on and uses for prediction. The most simple feature vector would be just the latest raw dimension value itself [x]. By default Netdata will use a feature vector consisting of the 6 latest differences and smoothed values of the dimension so conceptually something like `[avg3(diff1(x-5)), avg3(diff1(x-4)), avg3(diff1(x-3)), avg3(diff1(x-2)), avg3(diff1(x-1)), avg3(diff1(x))]` which ends up being just 6 floating point numbers that try and represent the "shape" of recent data. + +#### _anomaly score_ + +At prediction time the anomaly score is just the distance of the most recent feature vector to the trained cluster centers of the model, which are themselves just feature vectors, albeit supposedly the best most representative feature vectors that could be "learned" from the training data. So if the most recent feature vector is very far away in terms of [euclidean distance](https://en.wikipedia.org/wiki/Euclidean_distance#:~:text=In%20mathematics%2C%20the%20Euclidean%20distance,being%20called%20the%20Pythagorean%20distance.) it's more likely that the recent data it represents consists of some strange pattern not commonly found in the training data. + +#### _anomaly bit_ + +If the anomaly score is greater than a specified threshold then the most recent feature vector, and hence most recent raw data, is considered anomalous. Since storing the raw anomaly score would essentially double amount of storage space Netdata would need, we instead efficiently store just the anomaly bit in the existing internal Netdata data representation without any additional storage overhead. + +#### _anomaly rate_ + +An anomaly rate is really just an average over one or more anomaly bits. An anomaly rate can be calculated over time for one or more dimensions or at a point in time across multiple dimensions, or some combination of the two. Its just an average of some collection of anomaly bits. + +#### _anomaly detector_ + +The is essentially business logic that just tries to process a collection of anomaly bits to determine if there is enough active anomaly bits to merit investigation or declaration of a node level anomaly event. + +#### _anomaly event_ + +Anomaly events are triggered by the anomaly detector and represent a window of time on the node with sufficiently elevated anomaly rates across all dimensions. + +#### _dimension anomaly rate_ + +The anomaly rate of a specific dimension over some window of time. + +#### _node anomaly rate_ + +The anomaly rate across all dimensions of a node. + +## Notes + +- We would love to hear any feedback relating to this functionality, please email us at analytics-ml-team@netdata.cloud or come join us in the [🤖-ml-powered-monitoring](https://discord.gg/4eRSEUpJnc) channel of the Netdata discord. +- We are working on additional UI/UX based features that build on these core components to make them as useful as possible out of the box. +- Although not yet a core focus of this work, users could leverage the `anomaly_detection` chart dimensions and/or `anomaly-bit` options in defining alarms based on ML driven anomaly detection models. +- [This presentation](https://docs.google.com/presentation/d/18zkCvU3nKP-Bw_nQZuXTEa4PIVM6wppH3VUnAauq-RU/edit?usp=sharing) walks through some of the main concepts covered above in a more informal way. +- After restart Netdata will wait until `minimum num samples to train` observations of data are available before starting training and prediction. +- Netdata uses [dlib](https://github.com/davisking/dlib) under the hood for its core ML features. +- You should benchmark Netdata resource usage before and after enabling ML. Typical overhead ranges from 1-2% additional CPU at most. +- The "anomaly bit" has been implemented to be a building block to underpin many more ML based use cases that we plan to deliver soon. +- At its core Netdata uses an approach and problem formulation very similar to the Netdata python [anomalies collector](https://learn.netdata.cloud/docs/agent/collectors/python.d.plugin/anomalies), just implemented in a much much more efficient and scalable way in the agent in c++. So if you would like to learn more about the approach and are familiar with Python that is a useful resource to explore, as is the corresponding [deep dive tutorial](https://nbviewer.org/github/netdata/community/blob/main/netdata-agent-api/netdata-pandas/anomalies_collector_deepdive.ipynb) where the default model used is PCA instead of K-Means but the overall approach and formulation is similar. diff --git a/packaging/installer/netdata-updater.sh b/packaging/installer/netdata-updater.sh index 59c5fab11..be98079c8 100755 --- a/packaging/installer/netdata-updater.sh +++ b/packaging/installer/netdata-updater.sh @@ -1,4 +1,4 @@ -#!/usr/bin/env bash +#!/bin/sh # Netdata updater utility # @@ -48,7 +48,7 @@ error() { : "${ENVIRONMENT_FILE:=THIS_SHOULD_BE_REPLACED_BY_INSTALLER_SCRIPT}" -if [ "${ENVIRONMENT_FILE}" == "THIS_SHOULD_BE_REPLACED_BY_INSTALLER_SCRIPT" ]; then +if [ "${ENVIRONMENT_FILE}" = "THIS_SHOULD_BE_REPLACED_BY_INSTALLER_SCRIPT" ]; then if [ -r "${script_dir}/../../../etc/netdata/.environment" ]; then ENVIRONMENT_FILE="${script_dir}/../../../etc/netdata/.environment" elif [ -r "/etc/netdata/.environment" ]; then @@ -96,7 +96,6 @@ cleanup() { } _cannot_use_tmpdir() { - local testfile ret testfile="$(TMPDIR="${1}" mktemp -q -t netdata-test.XXXXXXXXXX)" ret=0 @@ -124,9 +123,7 @@ create_tmp_directory() { if [ -z "${TMPDIR}" ] || _cannot_use_tmpdir "${TMPDIR}" ; then if _cannot_use_tmpdir /tmp ; then if _cannot_use_tmpdir "${PWD}" ; then - echo >&2 - echo >&2 "Unable to find a usable temporary directory. Please set \$TMPDIR to a path that is both writable and allows execution of files and try again." - exit 1 + fatal "Unable to find a usable temporary directory. Please set \$TMPDIR to a path that is both writable and allows execution of files and try again." else TMPDIR="${PWD}" fi @@ -173,9 +170,8 @@ download() { } get_netdata_latest_tag() { - local dest="${1}" - local url="https://github.com/netdata/netdata/releases/latest" - local tag + dest="${1}" + url="https://github.com/netdata/netdata/releases/latest" if command -v curl >/dev/null 2>&1; then tag=$(curl "${url}" -s -L -I -o /dev/null -w '%{url_effective}' | grep -m 1 -o '[^/]*$') @@ -185,7 +181,7 @@ get_netdata_latest_tag() { fatal "I need curl or wget to proceed, but neither of them are available on this system." fi - if [[ ! $tag =~ ^v[0-9]+\..+ ]]; then + if echo "${tag}" | grep -vEq "^v[0-9]+\..+"; then fatal "Cannot download latest stable tag from ${url}" fi @@ -193,7 +189,7 @@ get_netdata_latest_tag() { } newer_commit_date() { - echo >&3 "Checking if a newer version of the updater script is available." + info "Checking if a newer version of the updater script is available." if command -v jq > /dev/null 2>&1; then commit_date="$(_safe_download "https://api.github.com/repos/netdata/netdata/commits?path=packaging%2Finstaller%2Fnetdata-updater.sh&page=1&per_page=1" /dev/stdout | jq '.[0].commit.committer.date' | tr -d '"')" @@ -218,7 +214,7 @@ newer_commit_date() { self_update() { if [ -z "${NETDATA_NO_UPDATER_SELF_UPDATE}" ] && newer_commit_date; then - echo >&3 "Downloading newest version of updater script." + info "Downloading newest version of updater script." ndtmpdir=$(create_tmp_directory) cd "$ndtmpdir" || exit 1 @@ -228,7 +224,7 @@ self_update() { export ENVIRONMENT_FILE="${ENVIRONMENT_FILE}" exec ./netdata-updater.sh --not-running-from-cron --no-updater-self-update --tmpdir-path "$(pwd)" else - echo >&3 "Failed to download newest version of updater script, continuing with current version." + error "Failed to download newest version of updater script, continuing with current version." fi fi } @@ -241,22 +237,24 @@ parse_version() { r="$(echo "${r}" | sed -e 's/^v\(.*\)/\1/')" fi - read -r -a p <<< "$(echo "${r}" | tr '-' ' ')" + tmpfile="$(mktemp)" + echo "${r}" | tr '-' ' ' > "${tmpfile}" + read -r v b _ < "${tmpfile}" - v="${p[0]}" - b="${p[1]}" - _="${p[2]}" # ignore the SHA - - if [[ ! "${b}" =~ ^[0-9]+$ ]]; then + if echo "${b}" | grep -vEq "^[0-9]+$"; then b="0" fi - read -r -a pp <<< "$(echo "${v}" | tr '.' ' ')" - printf "%03d%03d%03d%05d" "${pp[0]}" "${pp[1]}" "${pp[2]}" "${b}" + echo "${v}" | tr '.' ' ' > "${tmpfile}" + read -r maj min patch _ < "${tmpfile}" + + rm -f "${tmpfile}" + + printf "%03d%03d%03d%05d" "${maj}" "${min}" "${patch}" "${b}" } get_latest_version() { - if [ "${RELEASE_CHANNEL}" == "stable" ]; then + if [ "${RELEASE_CHANNEL}" = "stable" ]; then get_netdata_latest_tag /dev/stdout else download "$NETDATA_NIGHTLIES_BASEURL/latest-version.txt" /dev/stdout @@ -264,14 +262,13 @@ get_latest_version() { } set_tarball_urls() { - local extension="tar.gz" + extension="tar.gz" - if [ "$2" == "yes" ]; then + if [ "$2" = "yes" ]; then extension="gz.run" fi if [ "$1" = "stable" ]; then - local latest latest="$(get_netdata_latest_tag /dev/stdout)" export NETDATA_TARBALL_URL="https://github.com/netdata/netdata/releases/download/$latest/netdata-$latest.${extension}" export NETDATA_TARBALL_CHECKSUM_URL="https://github.com/netdata/netdata/releases/download/$latest/sha256sums.txt" @@ -328,8 +325,7 @@ update() { possible_pids=$(pidof netdata) do_not_start= if [ -n "${possible_pids}" ]; then - read -r -a pids_to_kill <<< "${possible_pids}" - kill -USR1 "${pids_to_kill[@]}" + kill -USR1 "${possible_pids}" else # netdata is currently not running, so do not start it after updating do_not_start="--dont-start-it" @@ -396,17 +392,21 @@ done # But only we're not a controlling terminal (tty) # Randomly sleep between 1s and 60m if [ ! -t 1 ] && [ -z "${NETDATA_NOT_RUNNING_FROM_CRON}" ]; then - sleep $(((RANDOM % 3600) + 1)) + rnd="$(awk ' + BEGIN { srand() + printf("%d\n", 3600 * rand()) + }')" + sleep $(((rnd % 3600) + 1)) fi # shellcheck source=/dev/null -source "${ENVIRONMENT_FILE}" || exit 1 +. "${ENVIRONMENT_FILE}" || exit 1 # We dont expect to find lib dir variable on older installations, so load this path if none found export NETDATA_LIB_DIR="${NETDATA_LIB_DIR:-${NETDATA_PREFIX}/var/lib/netdata}" # Source the tarball checksum, if not already available from environment (for existing installations with the old logic) -[[ -z "${NETDATA_TARBALL_CHECKSUM}" ]] && [[ -f ${NETDATA_LIB_DIR}/netdata.tarball.checksum ]] && NETDATA_TARBALL_CHECKSUM="$(cat "${NETDATA_LIB_DIR}/netdata.tarball.checksum")" +[ -z "${NETDATA_TARBALL_CHECKSUM}" ] && [ -f "${NETDATA_LIB_DIR}/netdata.tarball.checksum" ] && NETDATA_TARBALL_CHECKSUM="$(cat "${NETDATA_LIB_DIR}/netdata.tarball.checksum")" # Grab the nightlies baseurl (defaulting to our Google Storage bucket) export NETDATA_NIGHTLIES_BASEURL="${NETDATA_NIGHTLIES_BASEURL:-https://storage.googleapis.com/netdata-nightlies}" @@ -431,11 +431,11 @@ self_update set_tarball_urls "${RELEASE_CHANNEL}" "${IS_NETDATA_STATIC_BINARY}" -if [ "${IS_NETDATA_STATIC_BINARY}" == "yes" ]; then +if [ "${IS_NETDATA_STATIC_BINARY}" = "yes" ]; then ndtmpdir="$(create_tmp_directory)" PREVDIR="$(pwd)" - echo >&2 "Entering ${ndtmpdir}" + info "Entering ${ndtmpdir}" cd "${ndtmpdir}" || exit 1 download "${NETDATA_TARBALL_CHECKSUM_URL}" "${ndtmpdir}/sha256sum.txt" @@ -452,16 +452,20 @@ if [ "${IS_NETDATA_STATIC_BINARY}" == "yes" ]; then # Do not pass any options other than the accept, for now # shellcheck disable=SC2086 - if sh "${ndtmpdir}/netdata-latest.gz.run" --accept -- ${REINSTALL_OPTIONS}; then - rm -r "${ndtmpdir}" + if sh "${ndtmpdir}/netdata-latest.gz.run" --accept -- ${REINSTALL_OPTIONS} >&3 2>&3; then + rm -rf "${ndtmpdir}" >&3 2>&3 else - echo >&2 "NOTE: did not remove: ${ndtmpdir}" + info "NOTE: did not remove: ${ndtmpdir}" fi echo "${install_type}" > /opt/netdata/etc/netdata/.install-type - echo >&2 "Switching back to ${PREVDIR}" - cd "${PREVDIR}" + if [ -e "${PREVDIR}" ]; then + info "Switching back to ${PREVDIR}" + cd "${PREVDIR}" + fi + [ -n "${logfile}" ] && rm "${logfile}" && logfile= + exit 0 else # the installer updates this script - so we run and exit in a single line update && exit 0 diff --git a/packaging/makeself/build-static.sh b/packaging/makeself/build-static.sh index e9cf620b4..e4c92a7ba 100755 --- a/packaging/makeself/build-static.sh +++ b/packaging/makeself/build-static.sh @@ -20,7 +20,7 @@ case ${BUILDARCH} in ;; esac -DOCKER_CONTAINER_NAME="netdata-package-${BUILDARCH}-static-alpine314" +DOCKER_CONTAINER_NAME="netdata-package-${BUILDARCH}-static-alpine315" if [ "${BUILDARCH}" != "$(uname -m)" ] && [ "$(uname -m)" = 'x86_64' ] && [ -z "${SKIP_EMULATION}" ]; then docker run --rm --privileged multiarch/qemu-user-static --reset -p yes || exit 1 @@ -40,12 +40,12 @@ if ! docker inspect "${DOCKER_CONTAINER_NAME}" > /dev/null 2>&1; then # inside the container and runs the script install-alpine-packages.sh # (also inside the container) # - if docker inspect alpine:3.14 > /dev/null 2>&1; then - run docker image remove alpine:3.14 - run docker pull --platform=${platform} alpine:3.14 + if docker inspect alpine:3.15 > /dev/null 2>&1; then + run docker image remove alpine:3.15 + run docker pull --platform=${platform} alpine:3.15 fi - run docker run --platform=${platform} -v "$(pwd)":/usr/src/netdata.git:rw alpine:3.14 \ + run docker run --platform=${platform} -v "$(pwd)":/usr/src/netdata.git:rw alpine:3.15 \ /bin/sh /usr/src/netdata.git/packaging/makeself/install-alpine-packages.sh # save the changes made permanently diff --git a/packaging/makeself/build-x86_64-static.sh b/packaging/makeself/build-x86_64-static.sh index 0f5f1df14..59d2078f4 100755 --- a/packaging/makeself/build-x86_64-static.sh +++ b/packaging/makeself/build-x86_64-static.sh @@ -4,4 +4,4 @@ SCRIPT_DIR="$( cd "$( dirname "${BASH_SOURCE[0]}" )" &> /dev/null && pwd )" -"${SCRIPT_DIR}/build-static.sh" x86_64 +"${SCRIPT_DIR}/build-static.sh" x86_64 "${@}" diff --git a/packaging/makeself/jobs/50-curl-7.78.0.install.sh b/packaging/makeself/jobs/50-curl-7.78.0.install.sh index a2bb24e2c..aeab1af68 100755 --- a/packaging/makeself/jobs/50-curl-7.78.0.install.sh +++ b/packaging/makeself/jobs/50-curl-7.78.0.install.sh @@ -40,7 +40,7 @@ run ./configure \ --with-openssl # Curl autoconf does not honour the curl_LDFLAGS environment variable -run sed -i -e "s/curl_LDFLAGS =/curl_LDFLAGS = -all-static/" src/Makefile +run sed -i -e "s/LDFLAGS =/LDFLAGS = -all-static/" src/Makefile run make clean run make -j "$(nproc)" diff --git a/packaging/version b/packaging/version index 6d101d3b1..d0ef161e0 100644 --- a/packaging/version +++ b/packaging/version @@ -1 +1 @@ -v1.32.0 +v1.32.1 diff --git a/system/netdata.service.in b/system/netdata.service.in index 813b2421f..53dd9087f 100644 --- a/system/netdata.service.in +++ b/system/netdata.service.in @@ -71,6 +71,8 @@ ProtectHome=read-only ProtectControlGroups=true # We whitelist this because it's the standard location to listen on a UNIX socket. ReadWriteDirectories=/run/netdata +# This is needed to make email-based alert deliver work if Postfix is the email provider on the system. +ReadWriteDirectories=-/var/spool/postfix/maildrop [Install] WantedBy=multi-user.target diff --git a/tests/profile/Makefile b/tests/profile/Makefile deleted file mode 100644 index 9348a4886..000000000 --- a/tests/profile/Makefile +++ /dev/null @@ -1,51 +0,0 @@ -# SPDX-License-Identifier: GPL-3.0-or-later - -COMMON_CFLAGS = -I ../../ -DTARGET_OS=1 -Wall -Wextra -PROFILE_CFLAGS = -O1 -ggdb $(COMMON_CFLAGS) -PERFORMANCE_CFLAGS = -O2 $(COMMON_CFLAGS) - -CFLAGS = $(PERFORMANCE_CFLAGS) - -LIBNETDATA_FILES = \ - ../../libnetdata/popen/popen.o \ - ../../libnetdata/storage_number/storage_number.o \ - ../../libnetdata/avl/avl.o \ - ../../libnetdata/socket/socket.o \ - ../../libnetdata/os.o \ - ../../libnetdata/clocks/clocks.o \ - ../../libnetdata/procfile/procfile.o \ - ../../libnetdata/statistical/statistical.o \ - ../../libnetdata/eval/eval.o \ - ../../libnetdata/threads/threads.o \ - ../../libnetdata/dictionary/dictionary.o \ - ../../libnetdata/simple_pattern/simple_pattern.o \ - ../../libnetdata/url/url.o \ - ../../libnetdata/config/appconfig.o \ - ../../libnetdata/libnetdata.o \ - ../../libnetdata/buffer/buffer.o \ - ../../libnetdata/adaptive_resortable_list/adaptive_resortable_list.o \ - ../../libnetdata/locks/locks.o \ - ../../libnetdata/log/log.o \ - $(NULL) - -COMMON_LDFLAGS = $(LIBNETDATA_FILES) -pthread -lm - -all: statsd-stress benchmark-procfile-parser test-eval benchmark-dictionary benchmark-value-pairs - -benchmark-procfile-parser: benchmark-procfile-parser.c - gcc ${CFLAGS} -o $@ $^ ${COMMON_LDFLAGS} - -benchmark-dictionary: benchmark-dictionary.c - gcc ${CFLAGS} -o $@ $^ ${COMMON_LDFLAGS} - -benchmark-value-pairs: benchmark-value-pairs.c - gcc ${CFLAGS} -o $@ $^ ${COMMON_LDFLAGS} - -statsd-stress: statsd-stress.c - gcc ${CFLAGS} -o $@ $^ ${COMMON_LDFLAGS} - -test-eval: test-eval.c - gcc ${CFLAGS} -o $@ $^ ${COMMON_LDFLAGS} - -clean: - rm -f benchmark-procfile-parser statsd-stress test-eval benchmark-dictionary benchmark-value-pairs diff --git a/web/api/formatters/json_wrapper.c b/web/api/formatters/json_wrapper.c index 1d9c2472a..264377e20 100644 --- a/web/api/formatters/json_wrapper.c +++ b/web/api/formatters/json_wrapper.c @@ -114,7 +114,7 @@ void rrdr_json_wrapper_begin(RRDR *r, BUFFER *wb, uint32_t format, RRDR_OPTIONS if (i) buffer_strcat(wb, ", "); buffer_strcat(wb, sq); - buffer_strcat(wb, rd->rrdset->name); + buffer_strcat(wb, rd->rrdset->id); buffer_strcat(wb, sq); i++; } diff --git a/web/api/netdata-swagger.json b/web/api/netdata-swagger.json index 5c2bba9a8..7786b333a 100644 --- a/web/api/netdata-swagger.json +++ b/web/api/netdata-swagger.json @@ -1067,6 +1067,24 @@ } } } + }, + "/aclk": { + "get": { + "summary": "Get information about current ACLK state", + "description": "aclk endpoint returns detailed information about current state of ACLK (Agent to Cloud communication).", + "responses": { + "200": { + "description": "JSON object with ACLK information.", + "content": { + "application/json": { + "schema": { + "$ref": "#/components/schemas/aclk_state" + } + } + } + } + } + } } }, "servers": [ @@ -2059,6 +2077,48 @@ } } } + }, + "aclk_state": { + "type": "object", + "properties": { + "aclk-available": { + "type": "boolean", + "description": "Describes whether this agent is capable of connection to the Cloud. False means agent has been built without ACLK component either on purpose (user choice) or due to missing dependency." + }, + "aclk-implementation": { + "type": "string", + "description": "Describes which ACLK implementation is currently used.", + "enum": [ + "Next Generation", + "Legacy" + ] + }, + "new-cloud-protocol-supported": { + "type": "boolean", + "description": "Informs about new protobuf based Cloud/Agent protocol support of this agent. If false agent has to be compiled with protobuf and protoc available." + }, + "agent-claimed": { + "type": "boolean", + "description": "Informs whether this agent has been added to a space in the cloud (User has to perform claiming). If false (user didnt perform claiming) agent will never attempt any cloud connection." + }, + "claimed-id": { + "type": "string", + "format": "uuid", + "description": "Unique ID this agent uses to identify when connecting to cloud" + }, + "online": { + "type": "boolean", + "description": "Informs if this agent was connected to the cloud at the time this request has been processed." + }, + "used-cloud-protocol": { + "type": "string", + "description": "Informs which protocol is used to communicate with cloud", + "enum": [ + "Old", + "New" + ] + } + } } } } diff --git a/web/api/netdata-swagger.yaml b/web/api/netdata-swagger.yaml index 19f4ded56..83487bda8 100644 --- a/web/api/netdata-swagger.yaml +++ b/web/api/netdata-swagger.yaml @@ -865,6 +865,18 @@ paths: description: A plain text response based on the result of the command. "403": description: Bearer authentication error. + /aclk: + get: + summary: Get information about current ACLK state + description: aclk endpoint returns detailed information + about current state of ACLK (Agent to Cloud communication). + responses: + "200": + description: JSON object with ACLK information. + content: + application/json: + schema: + $ref: "#/components/schemas/aclk_state" servers: - url: https://registry.my-netdata.io/api/v1 - url: http://registry.my-netdata.io/api/v1 @@ -1609,3 +1621,37 @@ components: - WARNING - CRITICAL - UNKNOWN + aclk_state: + type: object + properties: + aclk-available: + type: string + description: Describes whether this agent is capable of connection to the Cloud. + False means agent has been built without ACLK component either on purpose (user choice) or due to missing dependency. + aclk-implementation: + type: string + description: Describes which ACLK implementation is currently used. + enum: + - Next Generation + - Legacy + new-cloud-protocol-supported: + type: boolean + description: Informs about new protobuf based Cloud/Agent protocol support of this agent. + If false agent has to be compiled with protobuf and protoc available. + agent-claimed: + type: boolean + description: Informs whether this agent has been added to a space in the cloud (User has to perform claiming). + If false (user didnt perform claiming) agent will never attempt any cloud connection. + claimed_id: + type: string + format: uuid + description: Unique ID this agent uses to identify when connecting to cloud + online: + type: boolean + description: Informs if this agent was connected to the cloud at the time this request has been processed. + used-cloud-protocol: + type: string + description: Informs which protocol is used to communicate with cloud + enum: + - Old + - New |